title: carbon footprint for population density€¦ · title: carbon footprint for population...
TRANSCRIPT

Title: CARBON FOOTPRINT FOR POPULATION DENSITY Grade and Subject: 8th-12th grades Number of Days for Completion of the Project:
1 (maybe even just half a period – Recommended to combine with Science Skeptic Lesson Plan)
Overarching Project Goals/Outcomes:
For a number of weeks, we have been focusing on calculating the carbon footprints for the trees measured in the neighborhood. A second component of the CO2 compensation project is the carbon footprint created by the neighborhood population. This is a single calculation, which is based on the population density determined by the most recent census. An interactive PowerPoint presentation was used to help demonstrate what population density is, how it is determined, and based on this understanding, how to calculate the carbon footprint for the area under investigation.
Materials: ● Computer ● SmartBoard
Introduction: 1. Previous class’ carbon footprint calculations for trees as well as past lessons on converting units.
Instruction/Direct Experience:
1. Analyzing data. 2. Understanding the multiple variables within a single
project. 3. Answering and posing questions related to the
presentation. Independent Activities: Students will have hands-on experience calculating the related
carbon footprints for trees and car emissions. Assessment: Student’s participation. Follow-up Following the completion of calculating the carbon footprint for
population, students will calculate the carbon footprint for car emissions based on their in-field tallies. After the completion of all data anaylsis, students will work on their conclusions and creating a poster to present in a science fair.

Neighborhood Population
And Its Carbon Footprint

3 Variables
• Trees • Cars
• Population
• PROJECT MISSION IS TO CALCULATE THE CARBON FOOTPRINT OF EACH VARIABLE!!

What is Population Density?

Did you know…
• “With a 2010 population of 8,175,133 New York is the most populous city in the United States, more than twice the size of the second largest city, Los Angeles.”
• “Population: Population facts.” New York City Department of City Planning. Web. 1 March 2012.
<http://www.nyc.gov/html/dcp/html/census/pop_facts.shtml>.

Arthur, Andy. “2010 New York Census Population Maps.”18 June 2011. Web. 1 March 2012. <http://andyarthur.org/fodder/country/2010newyorkcens.html>.

Fact:
• According to the NYC Department of City Planning
–“The borough of Brooklyn on its own would be the 4th largest city in the United States.”
• “Population: Population facts.” New York City Department of City Planning. Web. 1
March 2012. <http://www.nyc.gov/html/dcp/html/census/pop_facts.shtml>.

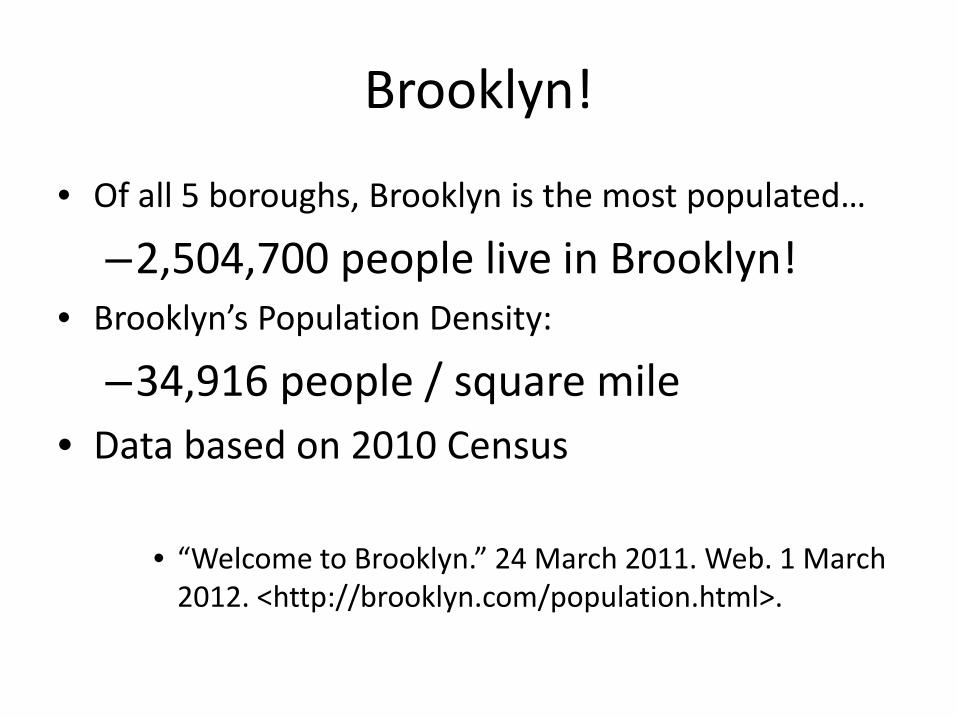
Brooklyn!
• Of all 5 boroughs, Brooklyn is the most populated…
–2,504,700 people live in Brooklyn! • Brooklyn’s Population Density:
–34,916 people / square mile • Data based on 2010 Census
• “Welcome to Brooklyn.” 24 March 2011. Web. 1 March 2012. <http://brooklyn.com/population.html>.
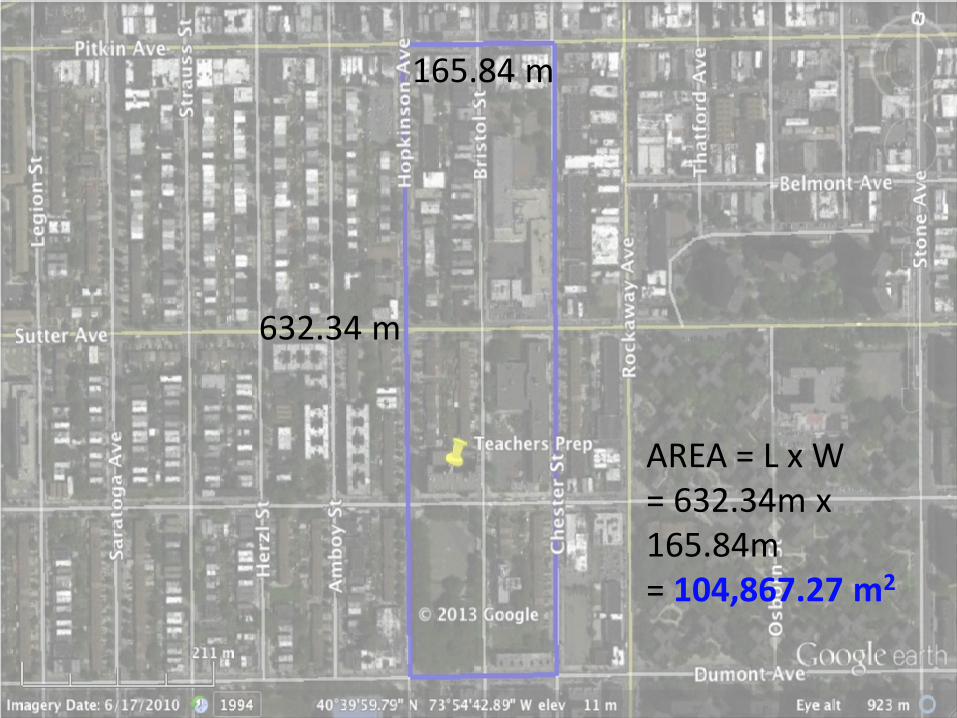
165.84 m
632.34 m
AREA = L x W = 632.34m x 165.84m = 104,867.27 m2

What We Know:
• Population Density = 34,916 pp / mi2 • = 0.013 pp / m2
• (1 mi2= 2589988.1 m2)
• Study Area = 104,867.27 m2
• SO FROM THERE WE CAN CALCULATE: • Population within Study Area = 1,363 pp

The Carbon Footprint
• The average person who consumes 2000 calories per day; each person leaves a carbon footprint of:
–0.7 kg/day/pp • If there are 1,363 pp, then:
–TOTAL CARBON FOOTPRINT DUE TO POPULATION = 954.3 kg/day
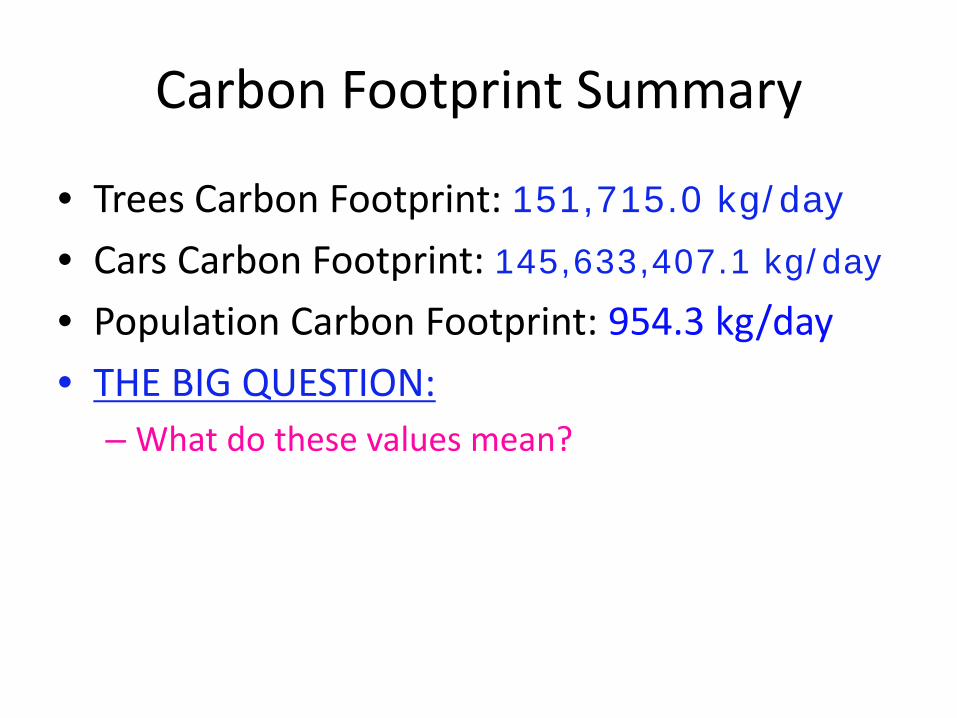
Carbon Footprint Summary
• Trees Carbon Footprint: 151,715.0 kg/day
• Cars Carbon Footprint: 145,633,407.1 kg/day
• Population Carbon Footprint: 954.3 kg/day • THE BIG QUESTION:
– What do these values mean?

That’s 20 million!!
151,715.0 kg/day 954.3 kg/day
Almost 150 million!