title customer valuation and value-based strategies ervin
TRANSCRIPT
Title Customer Valuation and Value-Based Strategies
Author(s) Ervin, Kirke; 平敷, 徹男
Citation 琉球大学経済研究(78): 81-130
Issue Date 2009-09
URL http://hdl.handle.net/20.500.12000/14251
Rights
Customer Valuation and Value-Based Strategies
Ervin Kirke
TABLE OF CONTENTS
I. INTRODUCTION 82
E. THE RELATIONSHIP MARKETING PARADIGM 83
m. THE VALUATION OF CUSTOMERS 84
A. Customer Value 85
B. Customer Valuation 86
C. Valuation Data and their Sources 87
IV. APPROACHES TO CUSTOMER VALUATION 91
A. Implementation of Customer Value Models 91
B. Recency, Frequency, Monetary (RFM) Analysis 93
C. Customer Profitability Analysis (CPA) 98
D. Time-Driven Activity-Based Costing (ABC) 102
E. Customer Lifetime Value (CLV) 105
F. Share Of Wallet (SOW) Analysis 112
V. VALUE-BASED STRATEGIES 113
A. Value-Based Customer Differentiation 113
B. Allocation of Marketing Resources 120
VI. CONCLUSIONS 124
VE. FUTURE CONSIDERATIONS 126
W. REFERENCES 127
— 81 —

2009^9^
INTRODUCTION
This paper proposes two separate frameworks. The first is a goals-based hierarchal
framework which conceptualizes the integration of the various related disciplines
that have developed within and around the relationship marketing paradigm. The
second is a procedural framework for the customer qualification process based
largely on a survey of extant academic literature.
We will begin with a brief background concerning the relationship marketing paradigm,
and the role and present circumstances surrounding CRM. We will then present a
proposed goals-based framework and its constituent elements. Next, We posit a survey
of extant academic literature on customer valuation methodologies and approaches
which will be the main focus of this paper. Finally, we will end with a proposed customer
qualification framework for the valuation and differentiation of customers, and the
optimized allocation of marketing resources based on customer value.
The second framework, which aims to provide a meaningful point of departure for a
deeper and broader understanding of the customer qualification process which is
necessary for gauging the feasibility of investing in long-term customer relationships,
consists of a customer valuation model and two subsequent value-based strategies;
customer differentiation and allocation of marketing resources. In order to maintain
focus on the valuation processes and their key components and characteristics,
complex computations are not expounded upon however relevant equations are
offered for the sake of clarity. The resulting framework model illustrates how the
qualification process forms the prerequisite foundation for CRM related goals and
strategies. The scope of this paper is limited to the treatment of current
customers, and does not consider the acquisition of new or former customers.
The concept of customer qualification is not new. Gronroos (1994) stated that the
function of relationship marketing is not seeking the retention of all customers but
rather making every relationship with the customer profitable. He later pointed out
in particular that relationships between the buyer and the seller must be profitable;
therefore customers must first be assessed according to the value created by them
for the company, and only later other marketing instruments can be applied for the
deepening of their "knowledge" - to determine the trends of their customer behavior
and needs for the goods/services provided (Gronroos, 1997).
— 82 —
Customer Valuation and Value-Based Strategies (Ervin
THE RELATIONSHIP MARKETING PARADIGM
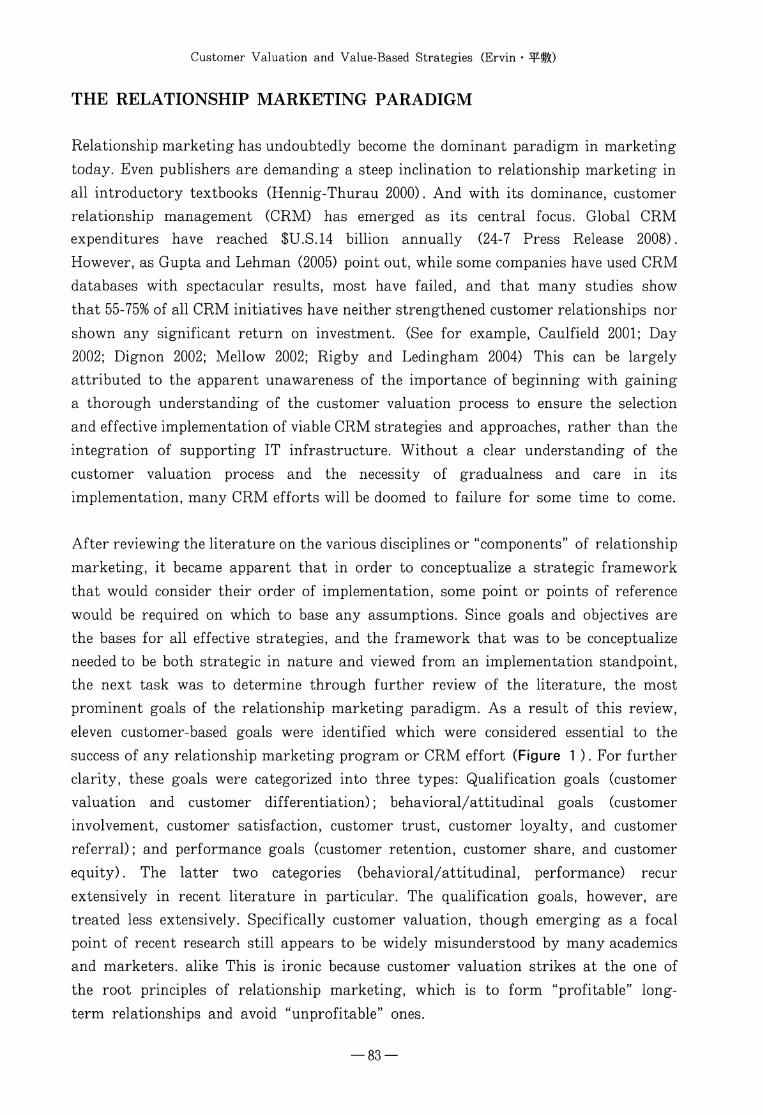
Relationship marketing has undoubtedly become the dominant paradigm in marketing
today. Even publishers are demanding a steep inclination to relationship marketing in
all introductory textbooks (Hennig-Thurau 2000). And with its dominance, customer
relationship management (CRM) has emerged as its central focus. Global CRM
expenditures have reached $U.S.14 billion annually (24-7 Press Release 2008).
However, as Gupta and Lehman (2005) point out, while some companies have used CRM
databases with spectacular results, most have failed, and that many studies show
that 55-75% of all CRM initiatives have neither strengthened customer relationships nor
shown any significant return on investment. (See for example, Caulfield 2001; Day
2002; Dignon 2002; Mellow 2002; Rigby and Ledingham 2004) This can be largely
attributed to the apparent unawareness of the importance of beginning with gaining
a thorough understanding of the customer valuation process to ensure the selection
and effective implementation of viable CRM strategies and approaches, rather than the
integration of supporting IT infrastructure. Without a clear understanding of the
customer valuation process and the necessity of gradualness and care in its
implementation, many CRM efforts will be doomed to failure for some time to come.
After reviewing the literature on the various disciplines or "components" of relationship
marketing, it became apparent that in order to conceptualize a strategic framework
that would consider their order of implementation, some point or points of reference
would be required on which to base any assumptions. Since goals and objectives are
the bases for all effective strategies, and the framework that was to be conceptualize
needed to be both strategic in nature and viewed from an implementation standpoint,
the next task was to determine through further review of the literature, the most
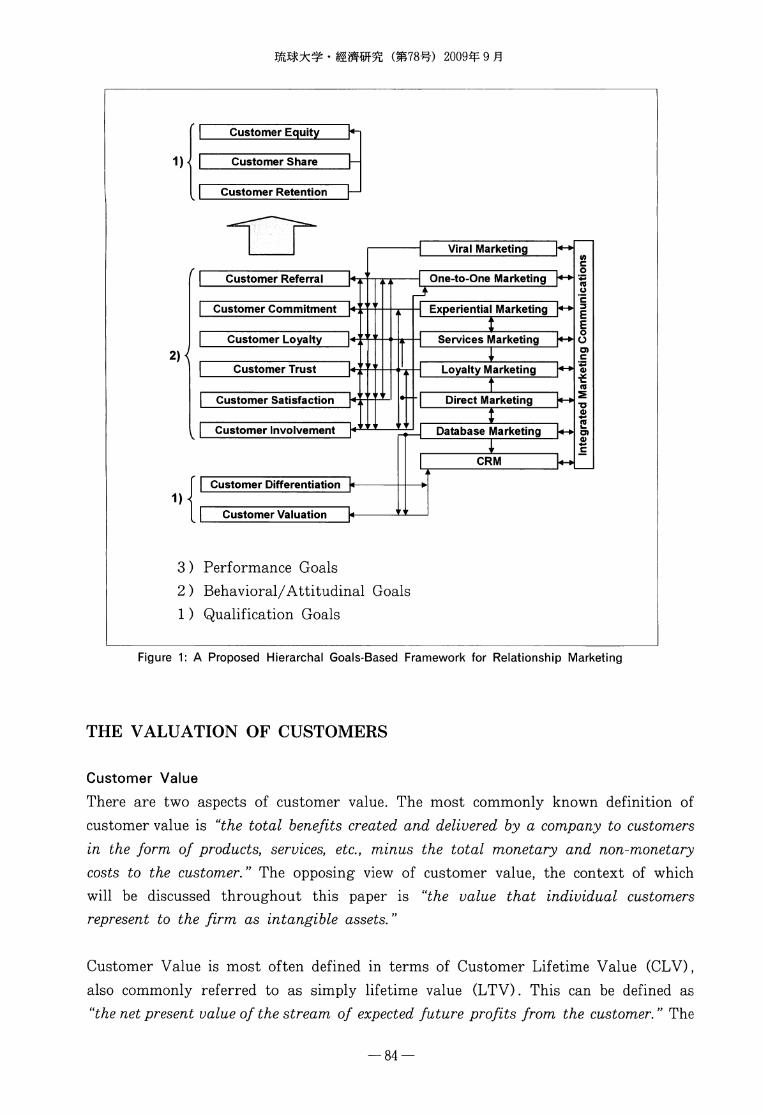
prominent goals of the relationship marketing paradigm. As a result of this review,
eleven customer-based goals were identified which were considered essential to the
success of any relationship marketing program or CRM effort (Figure 1 ). For further
clarity, these goals were categorized into three types: Qualification goals (customer
valuation and customer differentiation); behavioral/attitudinal goals (customer
involvement, customer satisfaction, customer trust, customer loyalty, and customer
referral); and performance goals (customer retention, customer share, and customer
equity). The latter two categories (behavioral/attitudinal, performance) recur
extensively in recent literature in particular. The qualification goals, however, are
treated less extensively. Specifically customer valuation, though emerging as a focal
point of recent research still appears to be widely misunderstood by many academics
and marketers, alike This is ironic because customer valuation strikes at the one of
the root principles of relationship marketing, which is to form "profitable" long-
term relationships and avoid "unprofitable" ones.
— 83 —
2009^ 9 n
| Customer Equity
Customer Share
Customer Retention |—'
| Customer Referral
| Customer Commitment
| Customer Loyalty |«+- p
Customer Trust
| Customer Satisfaction
I Customer Involvement
H Viral Marketing >-»
-| One-to-One Marketing |*
1)
| Customer Differentiation |+
Customer Valuation
\ Experiential Marketing |«-»
-| Services Marketing |«-»
■] Loyalty Marketing |
t| Direct Marketing p
1■I Database Marketing |«-»
CRM
3) Performance Goals
2) Behavioral/Attitudinal Goals
1) Qualification Goals
Figure 1: A Proposed Hierarchal Goals-Based Framework for Relationship Marketing
THE VALUATION OF CUSTOMERS
Customer Value
There are two aspects of customer value. The most commonly known definition of
customer value is "the total benefits created and delivered by a company to customers
in the form of products, services, etc.f minus the total monetary and non-monetary
costs to the customer." The opposing view of customer value, the context of which
will be discussed throughout this paper is "the value that individual customers
represent to the firm as intangible assets."
Customer Value is most often defined in terms of Customer Lifetime Value (CLV),
also commonly referred to as simply lifetime value (LTV). This can be defined as
"the net present value of the stream of expected future profits from the customer." The
— 84 —
Customer Valuation and Value-Based Strategies (Ervin
term "profits" is often substituted by the terms "financial contribution/7 "contribution
margins" or just "margins," and in some cases "benefits" in the various literature. Net
present value is a financial term that takes into account the fact that the value of
a particular currency today will not be worth the same in the future. Therefore, in
order to calculate future cash flows accurately, they must be discounted to reflect
their present value.
Peppers and Rogers (2004), expands the definition of customer value to be viewed as
being comprised of two distinct concepts - actual value and potential value. They describe
actual value as the customer's value as an asset to the enterprise, given what is currently
known or predicted about their future behavior assuming there are no major
changes in the marketing environment. This is equivalent to the CLV definition
above. Potential value is all the value that this customer could represent if the firm
were to apply a conscious strategy to improve it by changing the customer's future
behavior in some way. According to this view, the value of a customer can be
thought of not only as a function of the customer's own inertia (i.e. what the customer
is currently spending and intends to continue spending), but also of whatever
changes in the customers future purchasing behavior could be brought about
through the marketer's own initiative. (Jill Collins; Convergency Case Study in
Peppers & Rogers 2004, p. 128). From a similar perspective, potential value can be
viewed as the gap between a firm's share of wallet for a given customer and that
customer's total wallet size for a given product or service category.
McNab (2005) describes three other measurements of customer value; Present value,
Current value, and Historic value. Present value, like CLV, is a future oriented
measurement, which typically considers the future revenue and cost streams of the
customers existing business. This measure is usually only extended to include the
contractual lifetime of ongoing products or services. Revenues and costs are projected
into the future and then discounted to the present as with customer lifetime value.
Current value looks to a shorter time frame, often a month, in order to coincide
with reporting cycles. Current value is often volatile, since cyclical factors in the
relationship are often not reflected within a single month.
Historical value of a customer reveals the value earned for a customer relationship
over an extended period of time, such as prior fiscal quarter, prior year, or since the
beginning of the relationship. It can be measured as a simple average of previous
periods or can be weighted, placing higher emphasis on recent periods.
— 85 —
2009^ 9 n
Customer Valuation
Meckley and Toscano (2005) defines customer valuation as the analytical process of
increasing knowledge of customers, at various levels, in order to determine and
improve the value of customer relationships, interactions with customers or corporate
programs. Understanding the value of customers affects every aspect of the way a
business interacts with customers. It requires an in-depth understanding of customer
behavior, as well as using past behavior to predict future actions. As such, customer
value analysis is often performed in conjunction with a customer data warehouse
and customer analysis where detailed historical behavior can be tracked to predict
trends and actions (Kinekin 2001). It also requires understanding and anticipating
customer needs, and developing strategies and approaches that serve these needs in
a way that is affordable to the organization. (Carlin 2007).
At an individual level, sales and service approaches can be tuned to manage the
growth of customer relationships. The enterprise can devote the greatest portion of
its internal resources to serving its most valuable customers, determine how to keep
customers longer, grow them into bigger customers, make them more profitable, and
serve them more efficiently (Kinikin, 2001; Peppers and Rogers 2004; Carlin 2007).
Watching for shifts in the customer value itself can reveal changes in customer
behavior. Early intervention to reward higher value activities or address customer
dissatisfaction is often key to maintaining or enhancing customer value. This
approach is most effective in industries with highly predictable periodic customer
purchases, such as retail. It can also be used in many business sales with fairly
predictable upgrade or replacement cycles, such as high-tech and heavy manufacturing,
or on an aggregate basis to track the relative value of different customer segments.
(Kinekin 2001)
Predicting the value of a customer can also be an important part of deploying
marketing campaigns. Two prospects may both have the same percentage of
responding to a company's offer, but prospect "A" might generate $10 in profits
while prospect "B" might generate $50 in profits. While the cost of acquiring each
prospect might be the same, the impact to the bottom line is very different.
At a segment level, customer value analysis can identify gaps between actual value
and potential value (Kinekin, 2001). It can show both what customers do buy, and
what they could buy, based on their likely purchase levels in the product categories
being evaluated. For example, in two different SIC codes, companies of equal size
may purchase from a given supplier, an equal amount on average. Through customer
analysis, it can be determined that one SIC code uses five times more of the product
than the other, but it is penetrated more heavily by competitors. It is thus possible
— 86 —
Customer Valuation and Value-Based Strategies (Ervin
to quantify the difference between these groups, and target large potential buyers
who otherwise may have been ignored. (Weber 2008)
Firms can also identify customer/client behaviors and interactions based on a customer
segment and attach a financial component to each type (Carlin 2007). Channels of
interaction and their associated costs, for example, vary widely. While interaction via
internet is currently the cheapest channel by far, the use of sales force is the most
expensive. Purchase behavior such as recency, frequency and amount of purchase
provide valuable insight for segmentation decisions based on behavior as well.
Further, value analysis allows the firm to understand the relative value of current
customers and identify and seek ways to eliminate those customers that will never
be profitable (Kinekin 2001). From a promotional standpoint, direct marketing, sales
and Web information can be tailored to a retention or growth strategy at a segment
level as well (Peppers and Rogers 2004).
In summary, customer value can be viewed in terms of revenue, behavior (i.e.,
responsiveness, purchase frequency, channel usage), profitability, and other non-
monetary contributions to the firm. It can be viewed as historic (past), current or
future; actual or potential. Valuation approaches are also varied, and can be
operationalized at the individual, segment or management level. While important
points will be acknowledged concerning each of these levels, the main focus of this
paper is centered on customer valuation at the individual level. A detailed discussion of
various approaches and their limitations will be discussed in detail in the following
chapter.
Valuation Data and their Sources
Understanding the value of each customer is critical to balancing the value between a
business and its customers. The process of understanding this value begins by creating
a consolidated source of customer information such as a data warehouse. Because of
the potential expense and time required to create sophisticated LTV models, proxy
variables that allow initial rank-ordering of customers by value are a good starting
point. Then, as an enterprise evolves in its CRM capabilities and its metrics mature,
it typically moves from simply measuring sales revenue to measuring profitability,
and even measuring potential profitability and other useful qualitative values such
as customer referral value, collaboration value, etc. The ultimate goal is to model the
actual lifetime value of each customer, as well as the customer's potential value.
Firms often find that starting with overlay data is a low-risk first step. These overlay
data are then enriched over time with basic scores and segmentation. Integrating actual
behavioral data not only provides tremendous value for marketing and personalization,
but also for strengthening and expanding upon scores, segmentation, and value
— 87 —

(^78^) 2009^ 9 n
assessment metrics. In general, explicit dialogue information is one of the last (but
potentially most powerful) categories of data collected and applied to managing
customer relationships. (Peppers and Rogers 2004)
Customer valuation naturally requires software and storage for the data. Although
initially, calculations can be achieved using a simple spreadsheet program (Peppers
and Rogers 2004; Novo 2004), meaningful CLV measurements, especially for larger
firms with many customers, will eventually require a marketing database (data
warehouse). Databases vary in capacity and cost. For many small businesses, an
"off the shelf" database program may suffice, whereas a medium-sized or larger
business will invariably require a third party database of significant size in the long run.
Most importantly, firms should minimize IT spending for CRM until they understand
the processes that the software is designed to support (Rigby and Ledingham 2004).
Before actually constructing the data warehouse, the first step in customer valuation
would be to define the customer type(s) served by the firm. Gupta and Lehman
(2003) point out that defining the customer properly is a fundamental and critically
important step that is often not given the proper attention by marketers. The term
"customer" should first be carefully defined either as an individual, household, company,
or division, etc. who has purchased or ordered something from, or registered with
the firm. Many banks, for example, consider their relationships being built with
households - that is - they defined their relationships in terms of the number of
products sold to customers with a common account address. Large companies with
multiple branches will either order their products centrally, or each branch will
order supplies individually. In this case, the supplier must decide whether to treat
each branch as separate customers or treat the company as one large customer.
Furthermore, the account name may well be the name of the organization, but the
actual customer may be an engineer, a purchasing agent, or even some cross-functional
team within the organization. Another factor involved with defining customers is
initial purchase volume. In a B2B setting, for example, if an organization's initial
purchase is substantially large, in that the supplies purchased will likely be consumed
over time, that organization can safely be considered a customer worth retaining. On
the other hand, if the initial purchase is negligible, this organization is probably just
evaluating the product for whatever its own purposes may be. This organization
would probably be better classified as a prospect, and more research performed as to
its needs and purchasing motivations. Customers must also be defined as contractual or
non-contractual. This is very important because the valuation metrics may be different
for each of these classifications. With contractual customers, a critical metric for
valuation is the customer retention rate. However, for non-contractual customers
retention rate has much less meaning, and thus a different metric such as recency
Customer Valuation and Value-Based Strategies (Ervin
or P (Active) will probably become the most important metric.
Once the enterprise has clearly defined its customer types, the next step is to identify
its customers. For business-to-business relationships, this can easily be done through
contract, billing, or shipping information. However for consumer relationships,
customers may have to be asked to divulge some type of information to be used as an
identifier, such as a combination of name and address or name and phone number, etc.
Credit card payments and web site visits are also possible methods. Each customer
should be identified and recognized at every touch point in order to more accurately
measure purchaes and other behavior. The linking of that information allows the
company to see each customer completely, as one customer throughout the organization,
and enables a company to compare, or differentiate customers from one another.
(Peppers and Rogers 2004)
Once the customer types have been defined and the individual customers identified,
another important step is to decide how the data which will be used in the selected
valuation model will be classified. There are various ways of classifying customer
data. The following examples are provided to illustrate the various perspectives from
which an organization may view the data and their possible uses.
In their earlier works, The One to One Field Book (1999), Peppers and Rogers postulated
the following four categories:
1. Current facts and figures
2. Imputable and Computable Customer Data
3. Observable Customer Data
4. Obtainable Customer Data
In their most recent work, Managing Customer Relationships (2004), they offer the
following three major classifications for customer data:
1. Overlay Information
2. Actual Behavior Data
3. Dialog Information
Shepherd (1999) classifies data directly supplied by the customer into three types:
1. Behavioral data,
2. Attitudinal data,
3. Demographic (i.e. "descriptive")
— 89 —
(^78^) 2009^ 9 ft
Vavra (1992) provides an extensive list of the types of customer data which can be used
in a customer information file for both consumers and business-to-business customers:
1. Identification
2. Customer Rating
3. Background
4. Pre-Sale Communication
5. Purchase Behavior
6. Post-purchase behavior
7. Decision Makers (B2B)
8. Decision Making (B2B)
9. Influences (B2B)
10. Post-purchase behavior
11. Predicted Behavior
12. Channels (B2B)
13. Pricing (B2B)
14. Creditworthiness
15. Attitudes and Perceptions
16. Selected Relevant Information
Further, data used in calculation of customer value can be categorized as either
quantitative or qualitative. Although, the computation of quantitative data is relatively
straightforward, qualitative data must be weighted in a way that will provide accurate
and meaningful input to the lifetime value calculation. Customer referrals, for example
could be weighted not only to according monetary value, but also to frequency, as
well as the resulting CLV of the customer (s) referred. A customer's suggestion for
a new or modified product design may be itself qualitative in nature, however, once
implemented and offered to other customers, its value could be quantified in terms
of acceptance, sales, or costs.
Once the customers have been defined, the data classifications have been determined,
and the database constructed accordingly, customer data can be collected from their
sources.
Data sources can be classified into three types (Peppers and Rogers 2004):
1. Data generated from internal operations
Data generated from internal operations, which can make significant contributions,
include transaction details, information relating to billing and accounting status,
customer service interactions, back orders, product shipment, product returns,
— 90 —

Customer Valuation and Value-Based Strategies (Ervin
claims history, and internal operating costs. This type of information can
significantly affect an enterprise's understanding of its customers.
2. Data directly supplied by the customer
Directly supplied data consists of data obtained directly from customers, prospects,
or suspects. It is generally captured from lead generation questionnaires, customer
surveys, warranty registration cards, customer service interactions, website
responses, interviews, focus groups, or other direct interactions with individuals.
3. Data supplied by third parties
B2C customer information can be purchased or rented from any number of com
mercial databases. Trade publications, research services, online business-
information services, and individual company annual reports and/or websites can
also be consulted for usable customer data.
As can be seen by the above examples, which are by no means exhaustive, there is
virtually no limit to the amount and types of data that can be collected on individual
customers. There are also numerous internal and external sources from which to access
that data as well. On the other hand, however, there are two very important points
to be kept in mind when considering the collection of data. First, in order to load
the valuation model with meaningful data, the firm must first define and identify its
customers. Secondly, to control costs, internally generated data should be used first,
and only data that will be used should be collected. As Khan (1998) pointed out,
unless companies start to make use of the information they collect, there seems to
be little justification for collecting it. Furthermore, the costs of data collection
frequently outweigh the advantages gained (O'Malley 1998). Therefore, this aspect
of data collection must also be monitored to avoid cost overruns.
APPROACHES TO CUSTOMER VALUATION
Implementation of Customer Value Models
The Customer Lifetime Value model has become the most widely accepted method of
measuring individual customer value (Peppers and Rogers 2004). Most statistical
variations offer much more precise and thorough measurements than other valuation
methods. But calculating the precise value of customers can be a tricky process.
Companies have found that going directly from mass-marketing measures to actual
customer value is too large of a chasm to cross all at once. The time and expense
that is required to understand the revenue, fixed and variable costs, and margins
associated with every interaction can be overwhelming. A series of steps is often
taken prior to developing an actual customer value calculation. While lifetime value
— 91 —
2009^ 9
is the variable an enterprise wants to know, the enterprise may first find some
proxy variable that allows initial rank-ordering of customers by value to be nearly as
useful as a good starting point. A proxy variable should be easy to measure, but it
obviously will not provide as clear a picture when it comes to qualifying a customer's
actual or potential value.
Customer valuation can be conducted in various ways. In general, a company can
begin by tracking the total revenues of individual customers over a given period of
time. While an estimated value such as RFM can be a good start, an actual value,
calculated by customer, is desirable. Subtle differences between estimated value and
actual profitability can cause a person to make different decisions. (Peppers and
Rogers 2004)
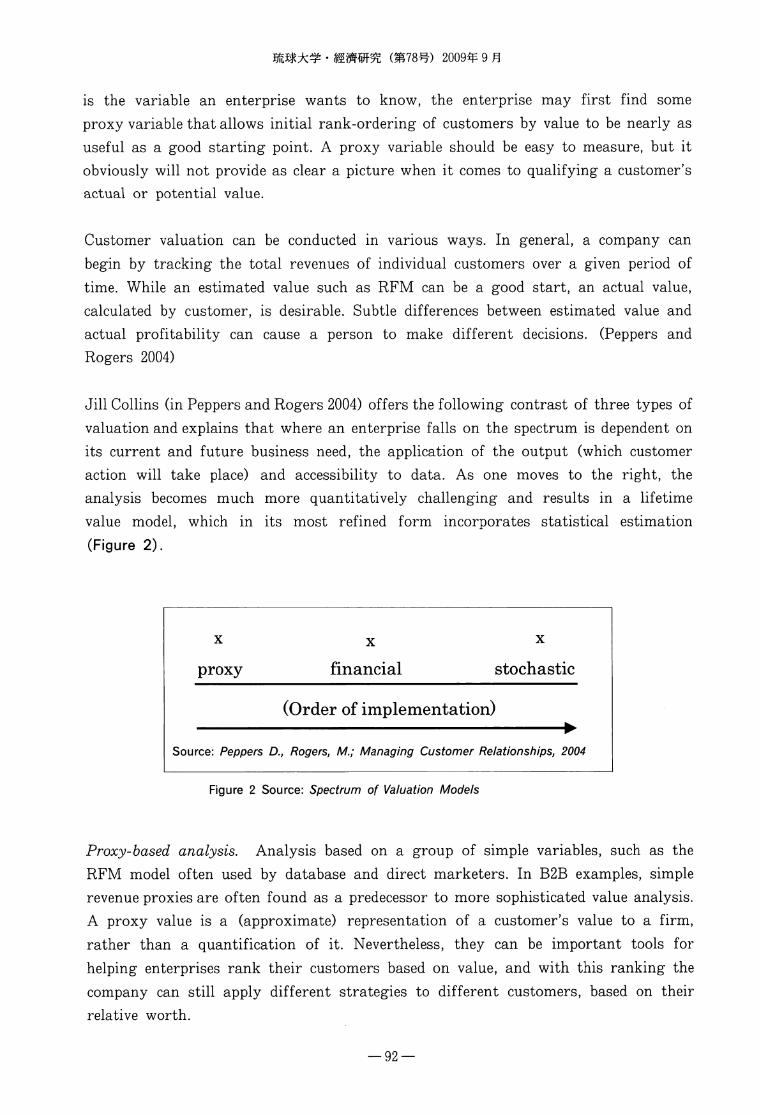
Jill Collins (in Peppers and Rogers 2004) offers the following contrast of three types of
valuation and explains that where an enterprise falls on the spectrum is dependent on
its current and future business need, the application of the output (which customer
action will take place) and accessibility to data. As one moves to the right, the
analysis becomes much more quantitatively challenging and results in a lifetime
value model, which in its most refined form incorporates statistical estimation
(Figure 2).
x
proxy
x
financial stochastic
(Order of implementation)
Source: Peppers D., Rogers, M.; Managing Customer Relationships, 2004
Figure 2 Source: Spectrum of Valuation Models
Proxy-based analysis. Analysis based on a group of simple variables, such as the
RFM model often used by database and direct marketers. In B2B examples, simple
revenue proxies are often found as a predecessor to more sophisticated value analysis.
A proxy value is a (approximate) representation of a customer's value to a firm,
rather than a quantification of it. Nevertheless, they can be important tools for
helping enterprises rank their customers based on value, and with this ranking the
company can still apply different strategies to different customers, based on their
relative worth.
— 92 —

Customer Valuation and Value-Based Strategies (Ervin
Financial analysis. A quantitative analysis based on revenue, and if possible, cost
information at the individual level. Discounted cash flow or other spreadsheet models are
used. Likely to be used for hospitality (hotels), automotive, some B2B, and others.
Statistical analysis. Builds on proxy-based analysis and financial analysis. In calculating
discounted cash flows, assumptions are made as to the length of a customers relationship
and future growth. Statistical analysis incorporates a more rigorous analysis behind
these assumptions, such as estimating the probability to purchase. Variables used in
the estimation could be those adopted in the earlier stages of customer valuation
with proxy-based analysis. Most likely found in a company with tens of millions of
data points, such as credit card companies or telecommunications firms.
Recency, Frequency, Monetary (RFM) Analysis
Because of the highly technical nature of RFM, for which a true understanding
requires a thorough knowledge of database technology, an exhaustive explanation is
beyond the scope of this paper. However, a certain degree of description is warranted in
order to facilitate a better understanding of how it may be used as a proxy customer
valuation tool. The overview and explanations of coding procedures are extracted
from Hughes (2006), and the individual characteristics of each attribute were compiled
from the works of Libey and Pickering (2005). The contributions of other authors
are cited as they appear. Our own remarks are either introductory to, or fall at the
end of a paragraph in order to illuminate the relevance to customer valuation or related
strategies when the relationship may not appear to be obvious. We conclude this section
with a brief list of RFM limitations.
RFM (Recency, Frequency, and Monetary) works with both consumer and B2B
customer files. It works in any type of industry in which firms communicate with
their customers for marketing purposes. However, it only works with customer files.
It cannot be used with prospects because it requires knowledge of the customer's
prior purchase history with the firm. Prospects, by definition, have no such history.
Recency refers to the most recent purchase, order, visit or other desirable action by
the customer. Frequency refers to the frequency of those actions performed within
that time period. Finally, Monetary indicates the total (or average) amount of
goods or services purchased during the same time period
In preparation for an RFM analysis, the database must be "coded" for each attribute
(recency, frequency, and monetary amount).
Coding for Recency, Frequency and Monetary
In order to code the customer base for Recency, it is first necessary for one vital
— 93 —

2009^ 9
piece of information to be stored in every customer's database record: the most recent
purchase date. Every time the database is updated, this date must be updated as
well. To create the Recency code, the entire database must be sorted by this date,
with the most recent at the top. The database is then divided into five exactly equal
parts, or quintiles, which are numbered from 5 (most recent) to 1 (most ancient) as
shown in Figure 3. Next, each customer record in the database is coded anywhere
from one to five according to the group that they fall into.
The criterion for deciding Recency will differ among industries. A telephone company,
for example couldn't use the payment date because all customers would end up having
the same code. Therefore, the last time they changed their service (added or dropped
a line, signed up for a cell phone service, etc.), would be the Recency in that case.
A Bank on the other may use the last time a customer opened an account or bought
financial products.
11/04/2005
Most recent
purchase date
06/09/1998
Recency
quintile
codes
Source: Hughes, A; Strategic Database Marketing, 2006
Figure 3: Sorting by Recency
The process for sorting and coding the database records for Frequency is identical
to that for recency. However, the information used here is the total (or average)
number of purchases from each customer during a given period (Figure 4).
3,254
Total products
purchased
per period
Frequency
quintile
codes
Source: Hughes, A; Strategic Database Marketing, 2006
Figure 4: Sorting by Frequency
— 94 —
Customer Valuation and Value-Based Strategies (Ervin
Frequency can be measured in many ways. First, it could be the number of contacts
(purchases, service calls, returns, etc.) per year, season, quarter, month, week, or
even day. Second, the units used must be considered carefully and finding the best
measure for a given enterprise may require experimentation. Consider the following
examples:
• A retailer or cataloger - the number of purchases or items ordered
• A bank - the number of checks written, deposits made
• A hotel - the number of visits or the number of nights stayed
• A telephone company - the number of calls or minutes talked
• An electric utility - the number of KWH is used per month
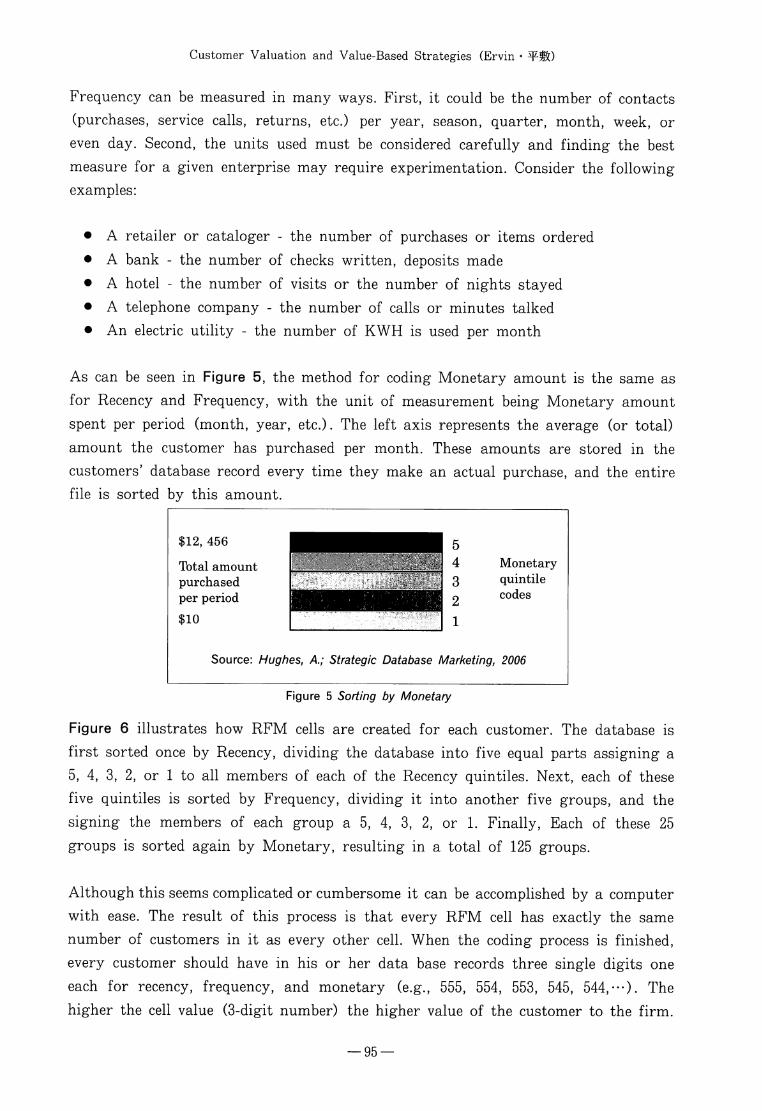
As can be seen in Figure 5, the method for coding Monetary amount is the same as
for Recency and Frequency, with the unit of measurement being Monetary amount
spent per period (month, year, etc.). The left axis represents the average (or total)
amount the customer has purchased per month. These amounts are stored in the
customers' database record every time they make an actual purchase, and the entire
file is sorted by this amount.
$12, 456
Total amount
purchased
per period
$10
Source:
Hi
Hughes, A;
wsmnsmm
■milmi ii
Strategic Database /
5
3
2
1
Marketing,
Monetary
quintile
codes
2006
Figure 5 Sorting by Monetary
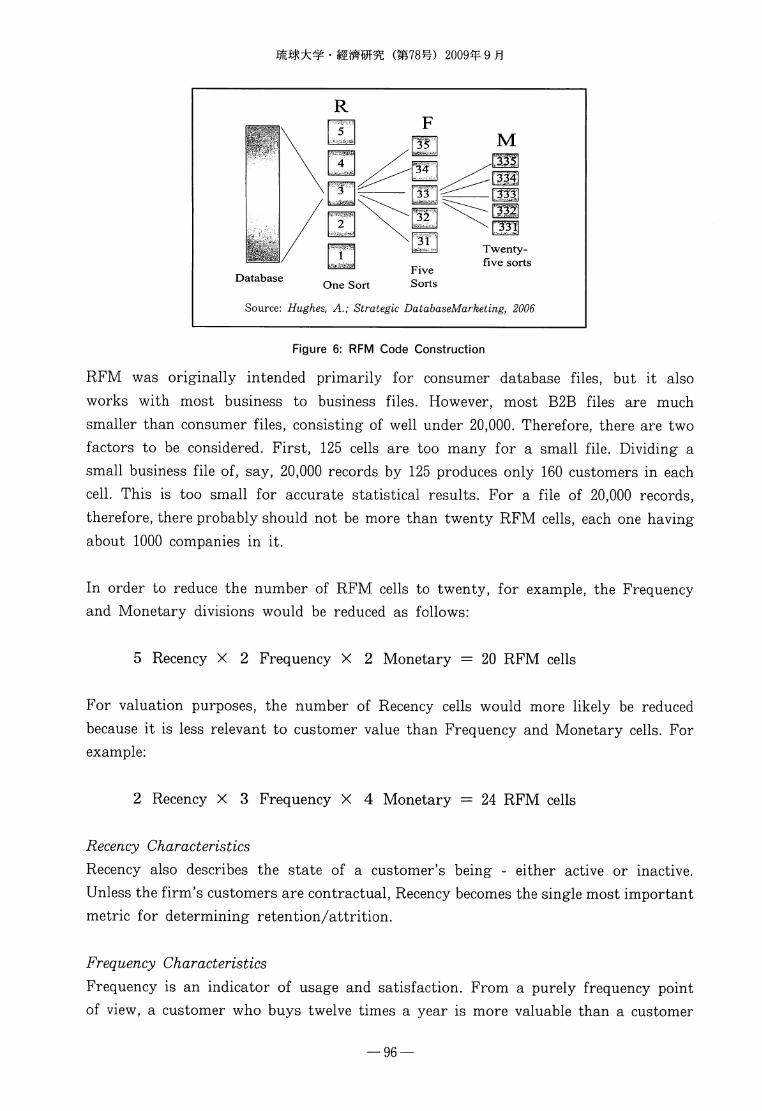
Figure 6 illustrates how RFM cells are created for each customer. The database is
first sorted once by Recency, dividing the database into five equal parts assigning a
5, 4, 3, 2, or 1 to all members of each of the Recency quintiles. Next, each of these
five quintiles is sorted by Frequency, dividing it into another five groups, and the
signing the members of each group a 5, 4, 3, 2, or 1. Finally, Each of these 25
groups is sorted again by Monetary, resulting in a total of 125 groups.
Although this seems complicated or cumbersome it can be accomplished by a computer
with ease. The result of this process is that every RFM cell has exactly the same
number of customers in it as every other cell. When the coding process is finished,
every customer should have in his or her data base records three single digits one
each for recency, frequency, and monetary (e.g., 555, 554, 553, 545, 544,---). The
higher the cell value (3-digit number) the higher value of the customer to the firm.
— 95 —
Twenty-
five sorts
DatabaseOne Sort
Source: Hughes, A.; Strategic DatabaseMarketing, 2006
Figure 6: RFM Code Construction
RFM was originally intended primarily for consumer database files, but it also
works with most business to business files. However, most B2B files are much
smaller than consumer files, consisting of well under 20,000. Therefore, there are two
factors to be considered. First, 125 cells are too many for a small file. Dividing a
small business file of, say, 20,000 records by 125 produces only 160 customers in each
cell. This is too small for accurate statistical results. For a file of 20,000 records,
therefore, there probably should not be more than twenty RFM cells, each one having
about 1000 companies in it.
In order to reduce the number of RFM cells to twenty, for example, the Frequency
and Monetary divisions would be reduced as follows:
5 Recency X 2 Frequency X 2 Monetary = 20 RFM cells
For valuation purposes, the number of Recency cells would more likely be reduced
because it is less relevant to customer value than Frequency and Monetary cells. For
example:
2 Recency X 3 Frequency X 4 Monetary = 24 RFM cells
Recency Characteristics
Recency also describes the state of a customer's being - either active or inactive.
Unless the firm's customers are contractual, Recency becomes the single most important
metric for determining retention/attrition.
Frequency Characteristics
Frequency is an indicator of usage and satisfaction. From a purely frequency point
of view, a customer who buys twelve times a year is more valuable than a customer
— 96 —

Customer Valuation and Value-Based Strategies (Ervin • ^fISO
who only buys once, i.e., twelve opportunities to engage the customer are better
than one. Every interaction is, potentially, an opportunity to strengthen the loyalty,
bond and reliance between the company and the customer, thereby lowering the
attrition rate. Further, a customer who purchases twelve times provides that may
chances for cross-selling or up-selling. Frequency is perhaps influenced to the greatest
degree by satisfaction and satistied customers are considered more valuable.
There are two ways to define and track Frequency, and each method requires a
different database structure. Multiple purchases can be counted on an annual basis
or on a lifetime (cumulative) basis. A pitfall involved in counting frequency at a
life-to-date (LTD) rather than a rolling twelve months: Customer A made five
purchases - four of those purchases being made over thirty-six months ago and one
made recently. Customer B made one purchase a month for the past five months.
Although each of these customers made five purchases, customer B is clearly a better
customer from a valuation standpoint.
Monetary Value Characteristics
Monetary value is how much a customer spends, and is an indicator of just that-
monetary value. As with Frequency, Monetary value can be measured in two ways;
it can be expressed as the total amount spent in the current year, or as the total
amount spent during the lifetime of the customer. Only monetary value can validate
the hierarchy of customer value described by recency and frequency.
Limitations of RFM
RFM was developed to measure and predict responsiveness. It only measures
profitability indirectly. (Hughes 2006).
RFM lacks information such as the costs of the product or service and other costs
associated with making the sale and serving customers (direct costs, such as the
costs of supporting the customers on-line, repairs, restocking, etc.). (Gordon 1998)
RFM Can only be applied to available historic customer data and not on data related
to prospects. Although it does uncover some aspects of customer buying behavior
that have an impact on future buying behavior, the actual score fails to reveal key
information to marketers, such as whether a customer is loyal, when a customer is
likely to buy next, and how profitable a customer will be in the future. (Kumar
2007)
— 97 —

2009^ 9 n
Customer Profitability Analysis
Customer profitability is the single most important variable of customer value and
forms the most essential basis for customer lifetime value and resource allocation. It
can be said that without an eventual measure of customer profitability, the customer
valuation process is an exercise in futility.
Kotler and Keller (2006) remind us that it is not necessarily the company's largest
customers who yield the most profit. The largest customers demand considerable
service and receive the deepest discounts. The smallest customers pay full price and
receive minimal service, but the costs of transacting with small customers reduce
their profitability. The midsized customers receive good service and pay nearly full
price and are often the most profitable.
In this section we present a survey of essential considerations important for formulating
an effective customer profitability analysis as perceived by various authors, followed
by a brief overview of a customer profitability analysis offered by Kotler and Keller
(2006).
Revenue Sources
McNab (2005) submits that the main choice to be made concerning revenue is
whether it will be recognized on a Cash or Accrual basis. In some industries, such
as construction, banking, and franchising this is an important issue and special rules
are laid down by accounting authorities as to how to treat certain items of revenue.
In general, accrual accounting provides a smoother recognition of profit in any given
period, and is desirable for any purpose other than management of cash flow or
business valuation. Most companies will choose to adopt an accrual basis of a counting
for customer revenue. As the types of revenue that occur in the firm's business is
analyzed, care should be given that the treatment of that revenue is as good an
approximation of the business as is possible - even if it differs from the company's
finance policies. It must be remembered that the profitability analysis is a management
information measurement not a financial reporting system.
Kinekin (2001) offers a comprehensive explanation of both customer revenue and
cost sources used for customer profitability/value calculations:
Initial Revenue: The revenue generated by goods and services the customer purchases
initially. The initial reading of profitability isn't a good indicator of long-term customer
value. A customer or segment can be unprofitable initially but vastly more profitable
overtime because of the service revenue, up-sell revenue, and influence value. At the
same time, revenue now is better than revenue later, both because of the increased
— 98 —
Customer Valuation and Value-Based Strategies (Ervin
risk and the time value of money.
Future Revenue: The value of future purchases depends on the amount the frequency of
incremental purchases and the customer's loyalty (which determines the length of
time the customer continues to purchase). Also included is ongoing recurring revenue
for services.
• Incremental Purchases: For industries with periodic transactions (such as insurance,
some retail, telecom, or other services), incremental purchase estimates are
relatively simple. For others, customer purchase history can help determine
typical purchase patterns for a given time period. The company may also find
that purchase value or customer loyalty increases with the number of purchases,
so they adjust marketing and sales programs to move customers more quickly
to a higher value state.
• Service and Support Revenue: The amount of services the customer typically
buys in a given time period is often a percent of product cost. In more mature
industries, service revenue may be more valuable - and more profitable - than
product revenue. For example, automotive suppliers now claim to lose money on
every car sale but they make it up on service. Many high-tech vendors charge
annual maintenance fees for service and support, which for more mature products
can now be lucrative profit centers.
Cost Sources
Initial Costs: The cost of making the sale plus the cost of the actual good or service
sold.
• Acquisition Cost: a rough way to estimate the acquisition cost is to take total
sales and marketing costs (assuming most of these are variable costs) for the
company or business unit, and estimate the percentage spent for new customer
acquisitions (as opposed to customer retention). Then divide that number by the
number of customers acquired. Companies with better sales and marketing
reporting mechanisms can use finer-grained cost-per-sales numbers for common
sales and marketing activities.
Another good indicator of sales cost for B2B transactions is the length of the
sales cycle. Initial sales costs are usually higher than those for repeat sales, and
sales costs vary significantly by customer type (major account, new business,
small and medium-sized enterprise).
Sales and marketing costs also vary widely by industry, with customer acquisition
costs ranging from tens of dollars in online retail to thousands of dollars for
business services. The firm should try to get an appropriate acquisition cost for
each type of customer.
— 99 —
• Products Cost: product cost can be calculated based on a typical product or
product mix sold. For companies providing custom or configured products, the
cost of the product can vary significantly based on the amount of nonstandard
work required (in high tech, this could include cost of additional features added
to make the sale; in manufacturing or service industries in could include the cost
of additional process steps). Care should be taken to include as many of the
variable costs as possible to reflect the true cost of the transaction.
Future Costs: Similar to initial costs, this includes the cost of the incremental products
purchased, the cost to make the incremental sale, and the cost for ongoing service.
• Incremental Product Costs: this is the cost of the product that the customer
purchases. Again, care must be taken to include variable production or fulfillment
costs specific to a customer or group of customers.
• Incremental Sale Cost: typically, sales costs for repeat sales are about 20 percent
of the cost to make the initial sale. However, that number varies by industry
and customer segment, and should be validated with customer examples.
• Ongoing Service and Support Costs: In many industries, customers require ongoing
management and service outside incremental transactions. These cost typically
include customer service and support calls, and back-office processing costs (e.g.,
billing statements) and may include ongoing sales account management or customer
retention programs (e.g., newsletters, frequent shopper, or customer loyalty
awards). The service and support costs may or may not be billed to the customer.
Egan (2004) offers the following insight pertaining to acquisition and retention costs
and their allocations.
Front-end costs
The industries chosen most frequently as examples of customer retention strategies
appear all to have high front-end acquisition costs inherent in their make-up, e.g.,
banks, credit card and insurance companies. Those costs that occur most frequently
are:
• The high cost of personal selling
• Commission payments
• Direct and indirect costs of detailed information gathering
• Supply of equipment
• Advertising and other communication expenditure
— 100 —

Customer Valuation and Value-Based Strategies (Ervin
Personal selling
The higher the degree of complexity involved in the product or service, the higher
propensity for the need of personal selling. Personal selling costs can include salary,
commissions, expenses, and fringe benefits. The cost per customer acquisition can be
high where personal selling is a major component in the customer's decision making
process (Egan p. 60).
Commission
If commissions are payable on sales, the fixed costs of personal selling may be reduced
but the variable costs of acquisition increase. Acquisition costs will therefore likely
be high relative to retention costs.
Data Collection
The Where data collection required is significant and the issue of contracts or other
expensive material is involved, initial costs may be high as well. In these cases the
company may not be able to turn a profit for a year or more into the contract.
Supply of equipment
This refers to long-term equipment supply, etc., free or subsidized supply of satellite or
digital TV receivers) where the investment is written off over the lifetime of the
contract. Any contract that terminates prior to the full write-off period is loss making,
while any contract which lasts beyond that point represents additional profit.
Advertising and other communication costs
Where advertising is used to promote "front of the mind awareness" then the cost of
maintaining this awareness may be justifiably included in the cost of customer
acquisition.
Industries that have high front end costs would benefit from writing those costs off
over an extended period of time. The longer the relationship, the lower the cost relevant
to the income and the higher the profit is likely to be. At the other end of the
acquisition costs spectrum, for example FMCG retailing, the costs of customer
acquisition appear marginal as intense personal selling, commissions, detailed
information gathering, etc. are not always necessary to make an individual sale.
Measurement and Analysis
As can be seen, measuring customer profitability requires detailed information (such as
that outlined above). While assigning revenues to customers is often easy, assigning
costs is much more difficult. The cost of goods sold obviously gets assigned to the
customers based on the goods each customer purchased. Assigning the more indirect
— 101 —
2009^ 9
costs may require the use of some form of Activity-Based costing (ABC). Finally,
there may be some categories of costs that will be impossible to assign to the customer.
If so, it is probably best to keep these costs as company costs and be content with the
customer profit numbers adding up to something less than the total company profit
(Farris, Bendle, Pfeifer, and Reibstein 2006). As mentioned, customer profitability is
management information so there are no set rules that have to be followed, so the
choice of accounting methods depends on the internal needs of the decision makers.
(McNab 2005)
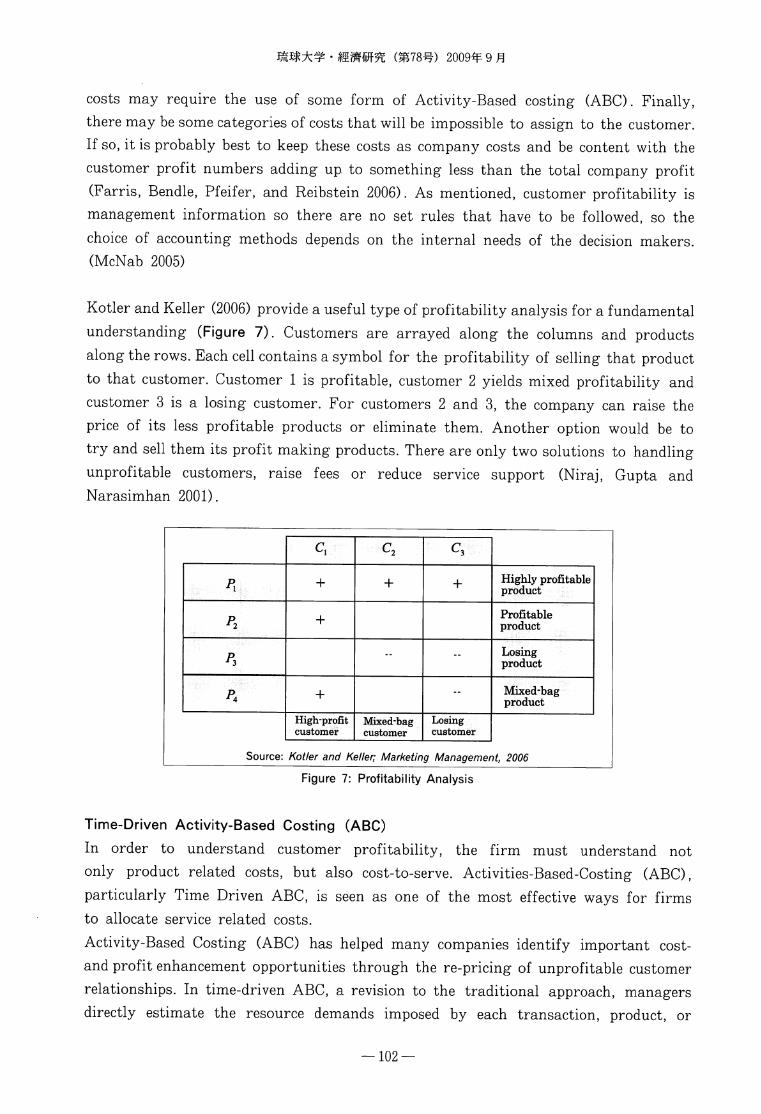
Kotler and Keller (2006) provide a useful type of profitability analysis for a fundamental
understanding (Figure 7). Customers are arrayed along the columns and products
along the rows. Each cell contains a symbol for the profitability of selling that product
to that customer. Customer 1 is profitable, customer 2 yields mixed profitability and
customer 3 is a losing customer. For customers 2 and 3, the company can raise the
price of its less profitable products or eliminate them. Another option would be to
try and sell them its profit making products. There are only two solutions to handling
unprofitable customers, raise fees or reduce service support (Niraj, Gupta and
Narasimhan 2001).
Pr
P2
P3
P*
+
+
+
High-profit
customer
c2
+
--
Mixed-bag
customer
c3
+
--
Losing
customer
Highly profitableproduct
Profitableproduct
Losing
product
Mixed-bagproduct
Source: Kotler and Keller; Marketing Management, 2006
Figure 7: Profitability Analysis
Time-Driven Activity-Based Costing (ABC)
In order to understand customer profitability, the firm must understand not
only product related costs, but also cost-to-serve. Activities-Based-Costing (ABC),
particularly Time Driven ABC, is seen as one of the most effective ways for firms
to allocate service related costs.
Activity-Based Costing (ABC) has helped many companies identify important cost-
and profit enhancement opportunities through the re-pricing of unprofitable customer
relationships. In time-driven ABC, a revision to the traditional approach, managers
directly estimate the resource demands imposed by each transaction, product, or
— 102 —
Customer Valuation and Value-Based Strategies (Ervin
customer. For each group of resources, only two parameters are required:
1) The cost per time unit of supplying resource capacity, and;
2) The unit times of consumption of resource capacity by products, services, and
customers
Estimating the cost per time unit of capacity
Managers first directly estimate the practical capacity of the resources supplied as
a percentage of the theoretical capacity. There are various ways to do this. As a rule
of thumb, it could be simply assumed that practical full capacity is 80 to 85% of
theoretical full capacity. So if an employee or machine is available to work 40 hours
per week, its practical full capacity is 32 to 35 hours per week. A more systematic
approach, perhaps, would be to review past activity levels and identify the month
with the largest number of orders handled without excessive delays, poor quality,
overtime or stressed employees. The objective is to be approximately right (within 5 -
10% of the actual number) rather than precise, and it is important not to be over
sensitive to small errors.
The formula for calculating the estimated cost per time unit of capacity is as
follows:
(No. of employees per mo. x work hours per mo. x 60)x80%
monthly overhead cst
Estimating the unit time of activities
Having calculated the cost per time unit of supplying resources to the business's
activities, managers next determine the time it takes to carry out one unit of each
type of activity. It is important to stress, though, that the question is not about the
percentage of time an employee spends doing an activity (processing orders, etc.),
but how long it takes to complete one unit of that activity.
Deriving cost driver rates
Next, the cost-driver rates can be calculated by multiplying the two input variables
Once these standard rates have been calculated, they may be applied in real time to
assign costs to individual customers as transactions occur. The standard cost rates
can also be used in discussions with customers about the pricing of new business.
The calculation of resource costs per time unit forces the company to incorporate
estimates of the practical capacities of its resources, allowing the ABC cost drivers
to provide more accurate signals about the cost and the underlying efficiency of its
processes.
— 103 —

mmmn 2009^9 n
Analyzing and reporting costs
Time-driven ABC allows managers to report their costs on an ongoing basis in a
way that reveals both the costs of a business' activities as well as the time spent on
them. Managers can review the cost of the unused capacity and contemplate actions
to determine whether and how to reduce the cost of supplying unused resources in
subsequent periods; they can monitor those actions over time (Figure 8).
Activity
Process customer orders
Handle customer inquiries
Perform credit checks
Total Used
Total Supplied
Unused Capacity
Quantity
51,000
1,150
2,700
Unit
Time
8
44
50
Total Time
Used (min)
408,000
50,600
135,000
593,600
700,000
106,400
Cost-Driver
Rate
$6.40
$35.20
$40.00
Total
Cost
$326,400
$40,480
$108,000
$474,880
$560,000
$85,120
Source: Kaplan R. S., Anderson, S.R.; Time-Driven Activity-Based Costing,
Figure 8: Cost Analysis
Updating the model
Managers can easily update their time-driven ABC models to reflect changes in operating
conditions. To add more activities for a department they can simply estimate the
unit time required for each new activity. They can also easily update the cost-driver
rates. Two factors can cause these rates to change:
1) Changes in the prices of resources supplied affect the cost per time unit of
supplying capacity.
2) A shift in the efficiency of the activity can also cause a change in the activity
cost-driver rate.
Examples of a shift in efficiency include quality programs, continuous improvement
efforts, reengineering, or the introduction of new technology, which can enable the
same activity to be performed in less time of with fewer resources. When permanent
sustainable improvements in a process have been made, the ABC analyst recalculates
the unit time estimates (and therefore the demands on resources) to reflect the process
improvements.
To accommodate the improvement, the unit time estimate may simply be changed
and the cost driver rate will automatically reflect the new value upon recalculation.
In this case, the cost impact of any purchases required to obtain those efficiencies
must be added back in by updating the cost per time estimate.
— 104 —
Customer Valuation and Value-Based Strategies (Ervin
By updating the ABC model on the basis of events rather than the calendar (quarterly,
annually, etc.), you get a much more accurate reflection of current condition. Any
time analysts learn about a significant shift in the costs of resources supplied or the
practical capacity of those resources, or about a change in the resources required to
perform the activity, they update the resource cost per time unit, or resource cost
rate, estimates. And any time they learn of a significant and permanent shift in the
efficiency with which an activity is performed, they update the unit time estimate.
Time Equations to Capture Complexity
Time-driven ABC can accommodate the complexity of real-world operations by
incorporating time equations, a feature that enables the model to reflect how order
and activity characteristics cause processing times to vary. The key insight is that
although transactions can easily become complicated, managers can usually identify
what makes them complicated. The variables that affect most such activities can be
precisely specified and are typically already recorded in a company's information
system.
Many companies' ERP systems already store data on order, packaging, distribution
method and other characteristics. These order and transaction specific data enable
the particular time demands for any given order to be quickly determined using a
calculation like the one above.
The ability of time-driven ABC to identify and report complex processes in a simple way
also provides a powerful negotiation tool when it comes to dealing with customers.
The Bottom Line
Time-driven ABC offers a transparent, scalable methodology that is easy to implement
and update. It draws on existing databases to incorporate specific features for particular
orders, processes, suppliers, and customers. Activity-based costing is no longer a
complex, expensive financial-systems implementation; the time-driven ABC innovation
provides managers with meaningful cost and profitability information, quickly and
expensively.
Customer Lifetime Value
Customer lifetime value is the present value of all current and future profits generated
from a customer over the life of his or her business with the firm. It is an important
concept in that it encourages firms to shift their focus from quarterly profits to the
long-term health of their customer relationships (Farris, Bendle, Pfeifer and
Reibstein). It is also the only metric that incorporates all the elements that drive
customer profitability: revenue, expense and customer behavior, thus keeping the focus
— 105 —

mmmn (mm) 2009^9 r
on the customer rather than the product as the driver of profitability. It provides
the best measurement of both loyalty and profitability within one metric. In very simple
terms, CLV is a multi-period evaluation of a customer's value to the firm. Calculating
the CLV can be the basis for formulating and implementing customer-specific strategies
for maximizing customers' lifetime profits and increasing their lifetime duration. It
can also be considered as the metric that guides the allocation of resources for ongoing
marketing activities in a firm. A firm has limited resources and ideally wants to
invest in those customers who bring maximum return to the firm. It helps the firm
to know how much it can invest to retain the customer so as to achieve a positive
return on investment. This is possible only by knowing that cumulated cash flow of
a customer over his or her entire lifetime with the company. Once this is known the
firm can optimally allocate its limited resources to achieve maximum return.
(Kumar 2008)
In comparison to other valuation approaches, Kumar (2007) states that a major
shortcoming of other metrics is that they are not forward-looking and hence do not
consider whether a customer is going to be active in the future. They consider only
the observed purchase behavior, which is then extrapolated to the future to arrive at
the future profitability of a customer. Egan (2004) on the other hand, warns that
the downsides of customer lifetime value is that there is no guarantee that the
customer will continue to patronize a supplier at the same level as previously or that
he or she will even stay with the company. This is particularly true in businesses
with low exit barriers and in rapidly changing, competitive markets (e.g. telecom).
Models of customer lifetime value originated many years ago in the field of direct
and database marketing and continue, to a large extent, to focus in this tactical
domain (Gupta and Lehman 2005). Over the past decade or so, CLV has become a
topic of much research (Heskett, Sasser and Schlesinger). Since then, there appears
to be two schools of thought in the research of customer lifetime value. On the one
hand there is a growing body of research with the aim of providing relatively exact
calculations of CLV through the use of sophisticated models (e.g., Kumar 2007, 2008;
Rajkumar, Venkatesan and Kumar 2004; Werner, Reinartz and Kumar 2000), while
on the other hand there are those who advocate that rough estimates of lifetime
value are sufficient for most top-level managerial decisions (e.g. Gupta and Lehman
2005; Heskett, Sasser and Schlesinger).
In this paper, we have chosen two models for brief typification. The model proposed
by Gupta and Lehman (2005) because of its ease, and the model proposed by Kumar
(2008) because of its treatment of non-contractual customers and because it is based
on two previous empirical studies (Reinartz and Kumar 2000; Venkatesan and
Kumar 2004).
-106 —
Customer Valuation and Value-Based Strategies (Ervin
Gupta and Lehman Model
This model was chosen for typification because of its relative ease of calculation,
thereby making the ability to grasp the fundamental concepts of Customer Lifetime
Value considerably more intuitive to those who are initially unfamiliar with the
concept. Gupta and Lehman maintain that even with detailed data and sophisticated
modeling, we have at best imprecise and approximate estimates of CLV. What is
needed, they say, is a simple metric that is easy to understand and captures the
spirit of customer lifetime value. They maintain that simple and approximate methods
are far more likely to actually be used than their complex counterparts. Further, for
most decision-making purposes it is enough to know the approximate value of the
customer. Therefore, companies should start with simple methods and see how they
affect decisions. After becoming comfortable, the firm can begin to seek precision
and sophistication when the situation warrants doing so.
Gupta and Lehman postulate the following benefits to their approach to estimating
the value of a customer:
• Designed to be transparent to both company executives and investors
• Not requiring large amounts of data
• Simple to understand and use for decision-making purposes
• Providing a good approximation of more detailed and data intensive methods
Based on three simple assumptions, they postulate that for typical situations, the
lifetime value of a customer is simply 1 to 4.5 times the annual dollar margin that
is generated from this customer:
a) profit margins remain constant over time
b) retention rate for customers remain constant over time
c) customer lifetime value is estimated over an infinite horizon
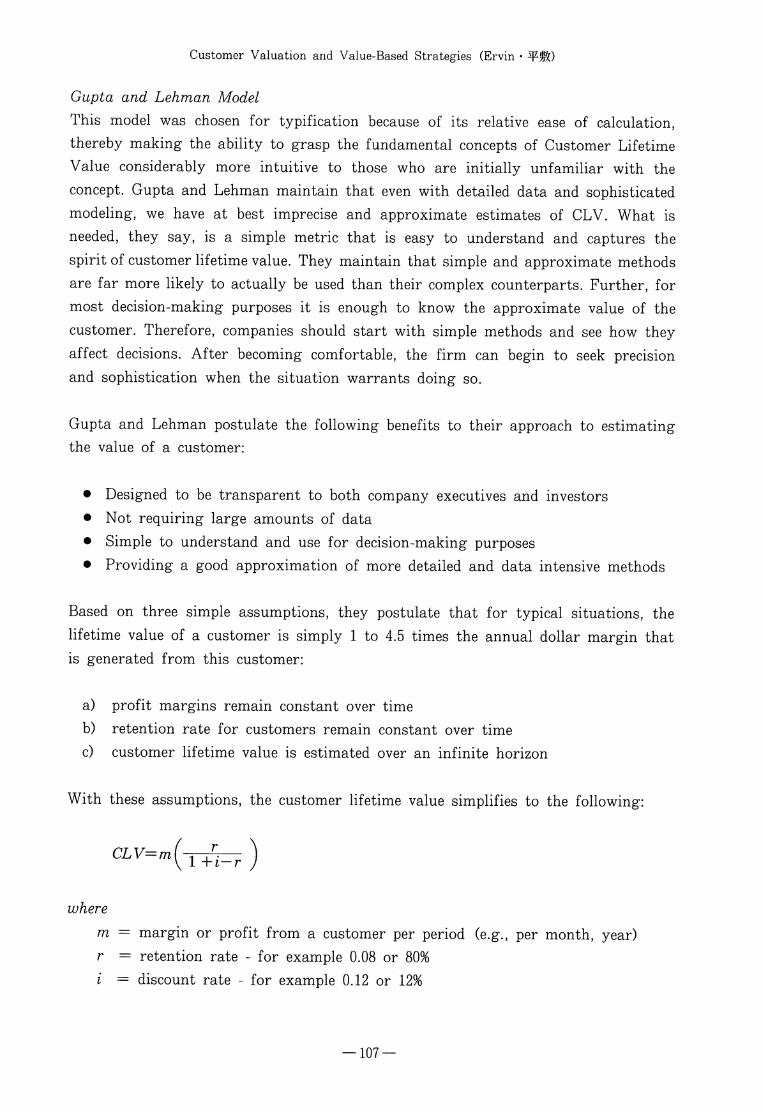
With these assumptions, the customer lifetime value simplifies to the following:
CLV=m
where
m = margin or profit from a customer per period (e.g., per month, year)
r = retention rate - for example 0.08 or 80%
i = discount rate - for example 0.12 or 12%
— 107 —
) 2009^ 9 £
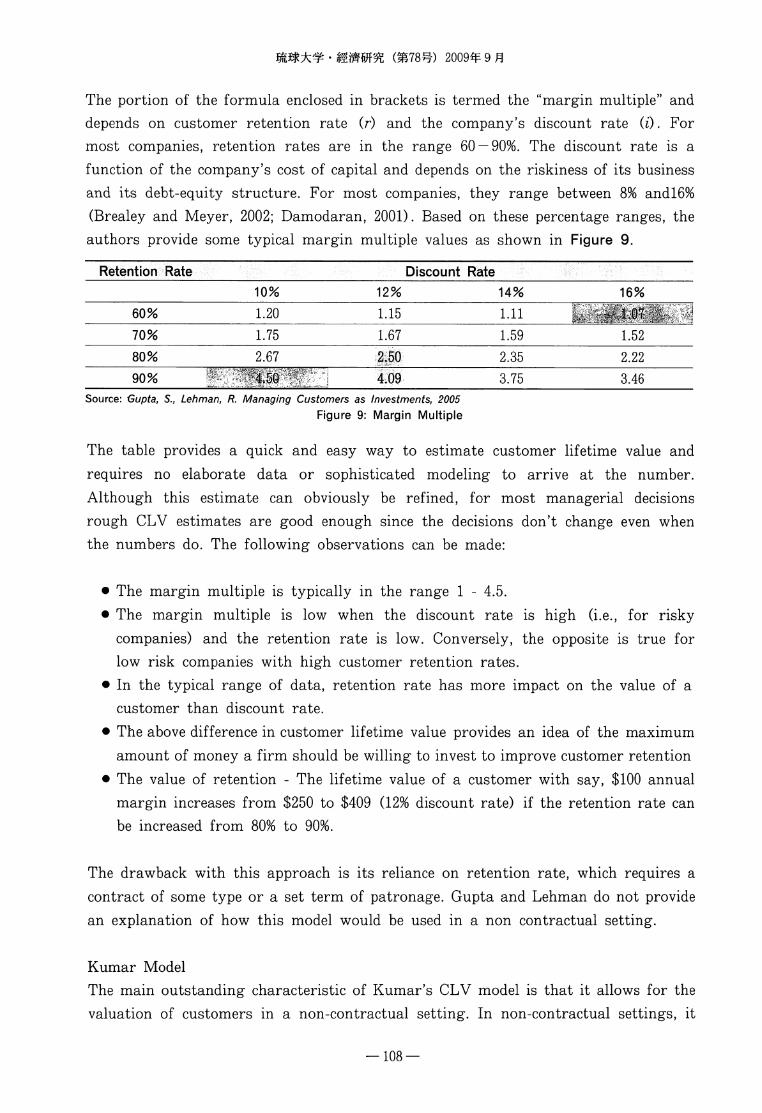
The portion of the formula enclosed in brackets is termed the "margin multiple" and
depends on customer retention rate (r) and the company's discount rate (i). For
most companies, retention rates are in the range 60 — 90%. The discount rate is a
function of the company's cost of capital and depends on the riskiness of its business
and its debt-equity structure. For most companies, they range between 8% andl6%
(Brealey and Meyer, 2002; Damodaran, 2001). Based on these percentage ranges, the
authors provide some typical margin multiple values as shown in Figure 9.
Retention Rate Discount Rate
10% 12% 14% 16%
60% L20 U5 Ul i§| ,—^.,~,^-,...is
70% L75 L67 L59 L52_
80% 2.67 2.50 2.35 2.22
90% Wl'J3PII1Wi:Ii 4-09 3/75 3.46Source: Gupta, S., Lehman, R. Managing Customers as Investments, 2005
Figure 9: Margin Multiple
The table provides a quick and easy way to estimate customer lifetime value and
requires no elaborate data or sophisticated modeling to arrive at the number.
Although this estimate can obviously be refined, for most managerial decisions
rough CLV estimates are good enough since the decisions don't change even when
the numbers do. The following observations can be made:
• The margin multiple is typically in the range 1 - 4.5.
• The margin multiple is low when the discount rate is high (i.e., for risky
companies) and the retention rate is low. Conversely, the opposite is true for
low risk companies with high customer retention rates.
• In the typical range of data, retention rate has more impact on the value of a
customer than discount rate.
• The above difference in customer lifetime value provides an idea of the maximum
amount of money a firm should be willing to invest to improve customer retention
• The value of retention - The lifetime value of a customer with say, $100 annual
margin increases from $250 to $409 (12% discount rate) if the retention rate can
be increased from 80% to 90%.
The drawback with this approach is its reliance on retention rate, which requires a
contract of some type or a set term of patronage. Gupta and Lehman do not provide
an explanation of how this model would be used in a non contractual setting.
Kumar Model
The main outstanding characteristic of Kumar's CLV model is that it allows for the
valuation of customers in a non-contractual setting. In non-contractual settings, it
— 108 —

Customer Valuation and Value-Based Strategies (Ervin • ^
might be difficult to ascertain the duration for which the customer has been associated
with a firm. In the absence of a contract that guarantees future revenue generation,
it is difficult to predict how long the customer is going to stay with the firm. In
such a scenario, predicting the lifetime duration of a customer by observing buying
patterns and other explanatory factors assumes importance.
Kumar advocates computing the CLV of a customer over a three year time period
for most applications and gives the following four reasons:
• No one truly knows how long the customer is going to live
• Given that future cash flows are discounted heavily, the contribution beyond
three years might be quite small
• The predictive accuracy of the models being used can also declined over longer
forecasting times
• A major purpose of computing CLV is for resource allocation; resources have
to be allocated today based on the customer's value in the near future
He gives two exceptions to this three year measurement - the automobile industry
(20 years, with at least 3 purchases) and the insurance industry (7 to 10 years to
recover in the acquisition costs).
The CLV measurement approach illustrated in Figure 10 gives clarity to the calculations
involved in the process.
Recurring
Revenues
Recurring
Costs
Gross Contribution
Margin
Marketing
Costs
Net
Margin XExpected Number of
Purchases over Next 3 Years
Accumulated
Margin
Acquisition
Costs
C Adjusted ^NPresent Value )
Source: Kumar, V. Managing Customers for Profit, 2008
Figure 10: CLV Calculation Process
Customer
lifetime
— 109 —
Kumar offers three approaches to the calculation of customer lifetime value, the
aggregate approach, calculating the average CLV of cohorts or segments, and the
individual level approach. This paper is will be concerned only with the individual
level approach.
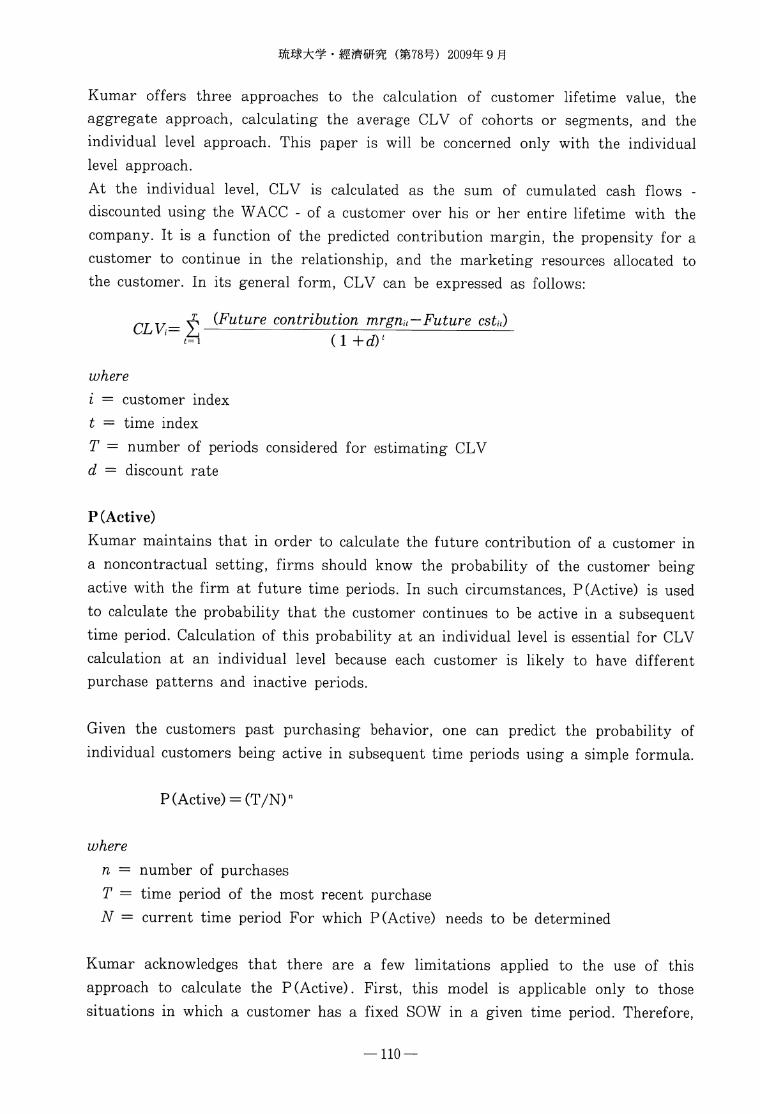
At the individual level, CLV is calculated as the sum of cumulated cash flows -
discounted using the WACC - of a customer over his or her entire lifetime with the
company. It is a function of the predicted contribution margin, the propensity for a
customer to continue in the relationship, and the marketing resources allocated to
the customer. In its general form, CLV can be expressed as follows:
nTTT_ yi (Future contribution mrgnlt—Future cstit
CLV'~M oT^
where
i = customer index
t = time index
T = number of periods considered for estimating CLV
d = discount rate
P (Active)
Kumar maintains that in order to calculate the future contribution of a customer in
a noncontractual setting, firms should know the probability of the customer being
active with the firm at future time periods. In such circumstances, P (Active) is used
to calculate the probability that the customer continues to be active in a subsequent
time period. Calculation of this probability at an individual level is essential for CLV
calculation at an individual level because each customer is likely to have different
purchase patterns and inactive periods.
Given the customers past purchasing behavior, one can predict the probability of
individual customers being active in subsequent time periods using a simple formula.
P (Active) = (T/N)n
where
n = number of purchases
T = time period of the most recent purchase
N = current time period For which P (Active) needs to be determined
Kumar acknowledges that there are a few limitations applied to the use of this
approach to calculate the P(Active). First, this model is applicable only to those
situations in which a customer has a fixed SOW in a given time period. Therefore,
— 110 —
Customer Valuation and Value-Based Strategies (Ervin • ^fISO
the more the customer buys earlier on, the less is available for future time periods.
Also, the model penalizes higher frequencies of buying because any fraction raised to a
higher power (which is the frequency of buying) results in a lower profitability. These
limitations can be relaxed if the focus is on modeling the expected inter-purchase time.
Average Monthly Gross Contribution
Firms attain the average gross contribution margin (AMGC) by deducting the average
cost of goods sold for the average monthly revenue from a customer. This is calculated
based on the customer's past purchases and is obtained for all customers (i) and for
the time period (t) for which the lifetime value is being estimated. To arrive at the
present value of the future contribution, the AMGC of the customers is adjusted
with a discount rate (d), for the number of time periods (n).
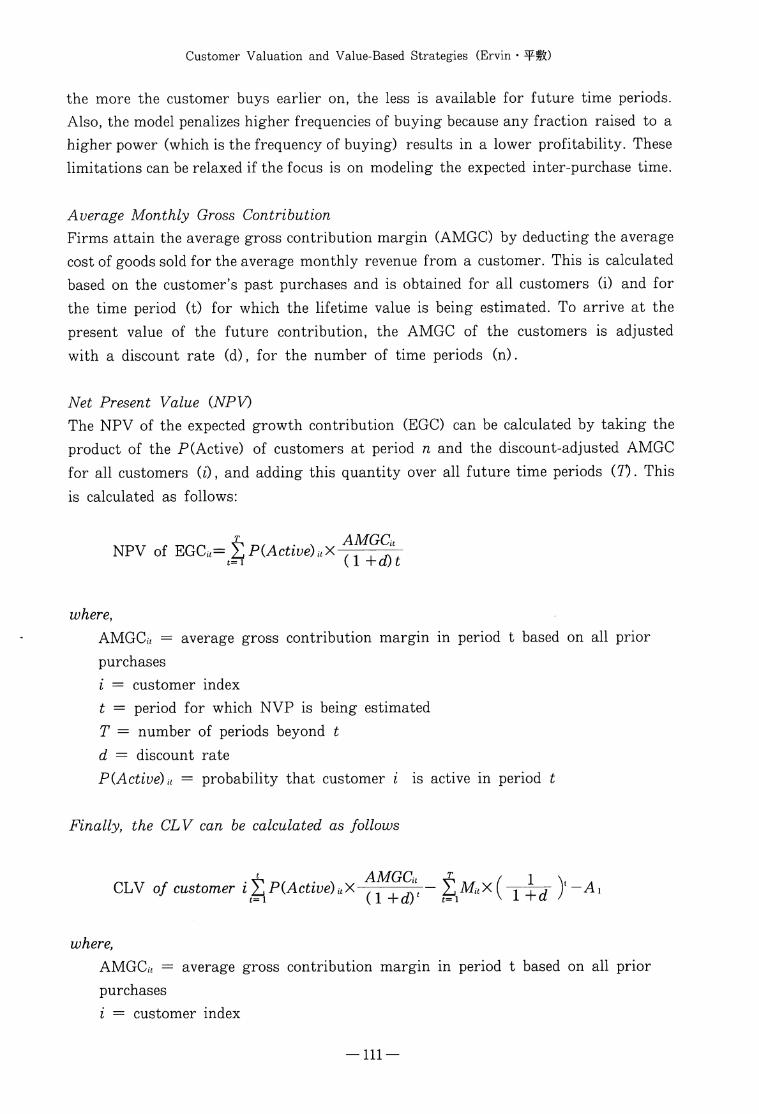
Net Present Value (NPV)
The NPV of the expected growth contribution (EGO can be calculated by taking the
product of the P(Active) of customers at period n and the discount-adjusted AMGC
for all customers (0, and adding this quantity over all future time periods (T). This
is calculated as follows:
NPV of EGC.= fiP(Active) uX ff^?t=\ { L -ra)t
where,
AMGCu = average gross contribution margin in period t based on all prior
purchases
i = customer index
t = period for which NVP is being estimated
T = number of periods beyond t
d = discount rate
P(Active) u = probability that customer i is active in period t
Finally, the CLV can be calculated as follows
CLV of customer i j]P'(Active)ftX ,. , '''- £Afi«x( , ]_ , )l-Ait=\ ( 1 + a) t=\ \ i T a /
where,
AMGCu = average gross contribution margin in period t based on all prior
purchases
i = customer index
— 111 —
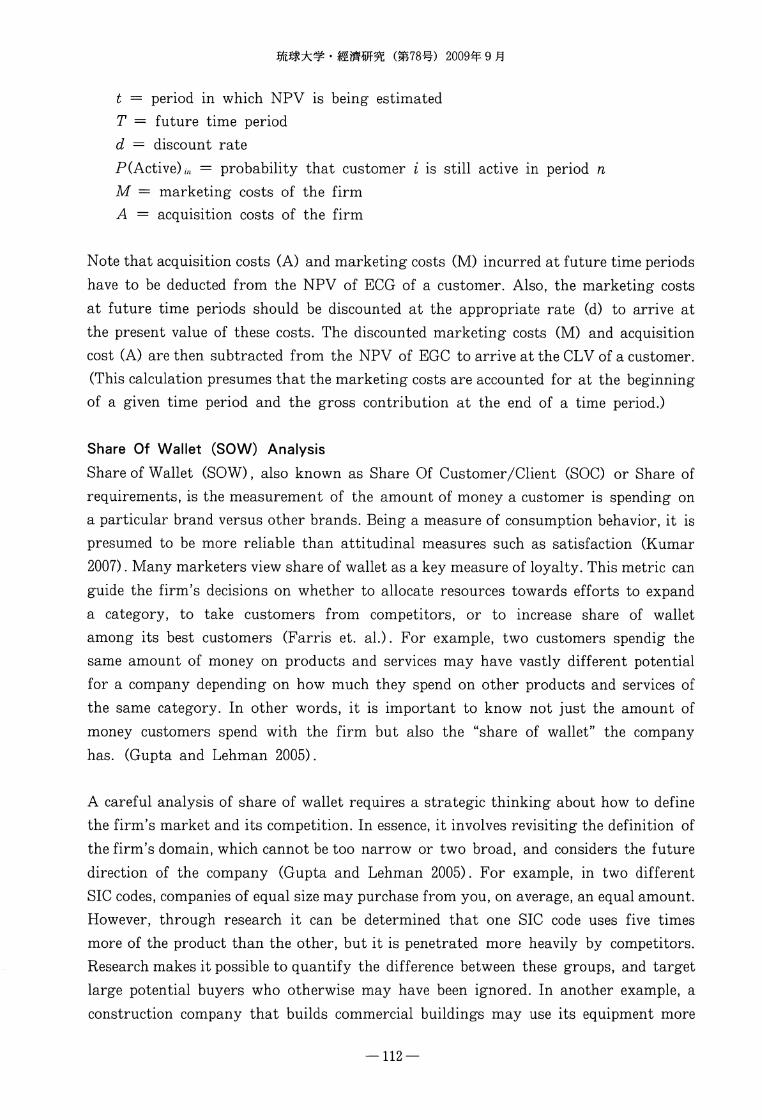
t = period in which NPV is being estimated
T = future time period
d = discount rate
P(Active)*,* = probability that customer i is still active in period n
M = marketing costs of the firm
A = acquisition costs of the firm
Note that acquisition costs (A) and marketing costs (M) incurred at future time periods
have to be deducted from the NPV of ECG of a customer. Also, the marketing costs
at future time periods should be discounted at the appropriate rate (d) to arrive at
the present value of these costs. The discounted marketing costs (M) and acquisition
cost (A) are then subtracted from the NPV of EGC to arrive at the CLV of a customer.
(This calculation presumes that the marketing costs are accounted for at the beginning
of a given time period and the gross contribution at the end of a time period.)
Share Of Wallet (SOW) Analysis
Share of Wallet (SOW), also known as Share Of Customer/Client (SOC) or Share of
requirements, is the measurement of the amount of money a customer is spending on
a particular brand versus other brands. Being a measure of consumption behavior, it is
presumed to be more reliable than attitudinal measures such as satisfaction (Kumar
2007). Many marketers view share of wallet as a key measure of loyalty. This metric can
guide the firm's decisions on whether to allocate resources towards efforts to expand
a category, to take customers from competitors, or to increase share of wallet
among its best customers (Farris et. al.). For example, two customers spendig the
same amount of money on products and services may have vastly different potential
for a company depending on how much they spend on other products and services of
the same category. In other words, it is important to know not just the amount of
money customers spend with the firm but also the "share of wallet" the company
has. (Gupta and Lehman 2005).
A careful analysis of share of wallet requires a strategic thinking about how to define
the firm's market and its competition. In essence, it involves revisiting the definition of
the firm's domain, which cannot be too narrow or two broad, and considers the future
direction of the company (Gupta and Lehman 2005). For example, in two different
SIC codes, companies of equal size may purchase from you, on average, an equal amount.
However, through research it can be determined that one SIC code uses five times
more of the product than the other, but it is penetrated more heavily by competitors.
Research makes it possible to quantify the difference between these groups, and target
large potential buyers who otherwise may have been ignored. In another example, a
construction company that builds commercial buildings may use its equipment more
— 112 —
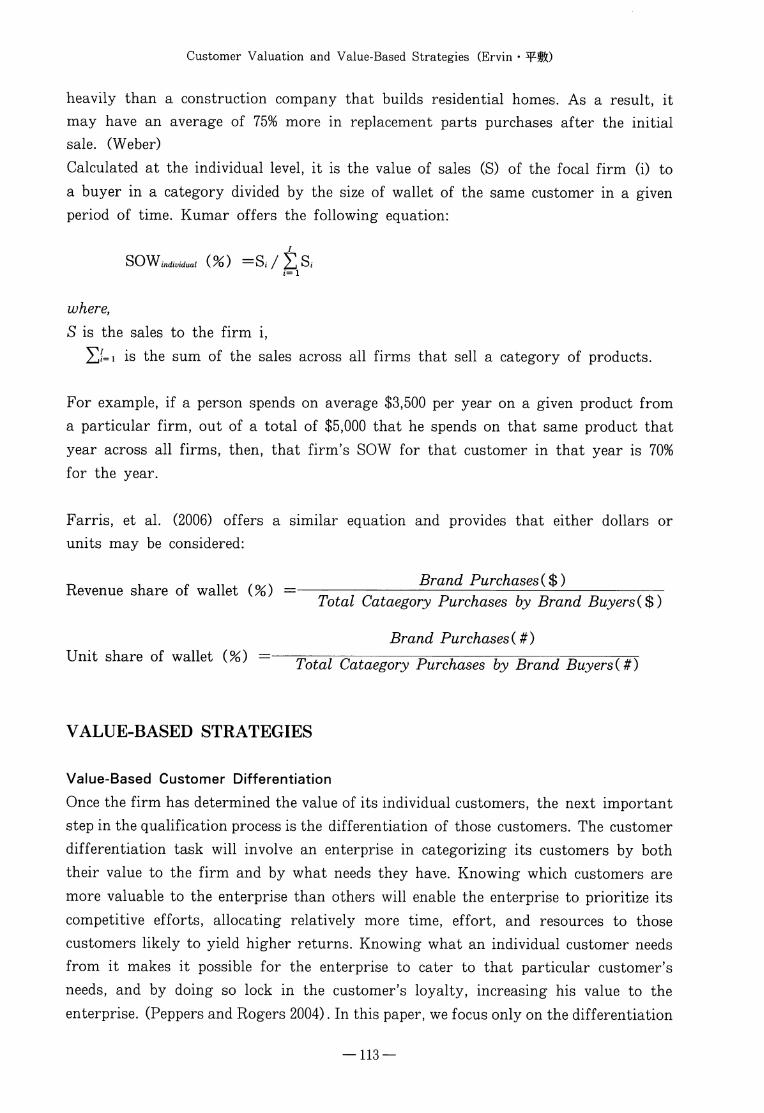
Customer Valuation and Value-Based Strategies (Ervin
heavily than a construction company that builds residential homes. As a result, it
may have an average of 75% more in replacement parts purchases after the initial
sale. (Weber)
Calculated at the individual level, it is the value of sales (S) of the focal firm (i) to
a buyer in a category divided by the size of wallet of the same customer in a given
period of time. Kumar offers the following equation:
oOWindividual \/o) =Si /
where,
S is the sales to the firm i,
]►]{=! is the sum of the sales across all firms that sell a category of products.
For example, if a person spends on average $3,500 per year on a given product from
a particular firm, out of a total of $5,000 that he spends on that same product that
year across all firms, then, that firm's SOW for that customer in that year is 70%
for the year.
Farris, et al. (2006) offers a similar equation and provides that either dollars or
units may be considered:
^ t r n x /o/\ Brand Purchases($)Revenue share of wallet (%) =
Unit share of wallet (%) =-
Total Cataegory Purchases by Brand Buyers($)
Brand Purchases(#)
Total Cataegory Purchases by Brand Buyers{#)
VALUE-BASED STRATEGIES
Value-Based Customer Differentiation
Once the firm has determined the value of its individual customers, the next important
step in the qualification process is the differentiation of those customers. The customer
differentiation task will involve an enterprise in categorizing its customers by both
their value to the firm and by what needs they have. Knowing which customers are
more valuable to the enterprise than others will enable the enterprise to prioritize its
competitive efforts, allocating relatively more time, effort, and resources to those
customers likely to yield higher returns. Knowing what an individual customer needs
from it makes it possible for the enterprise to cater to that particular customer's
needs, and by doing so lock in the customer's loyalty, increasing his value to the
enterprise. (Peppers and Rogers 2004). In this paper, we focus only on the differentiation
— 113 —
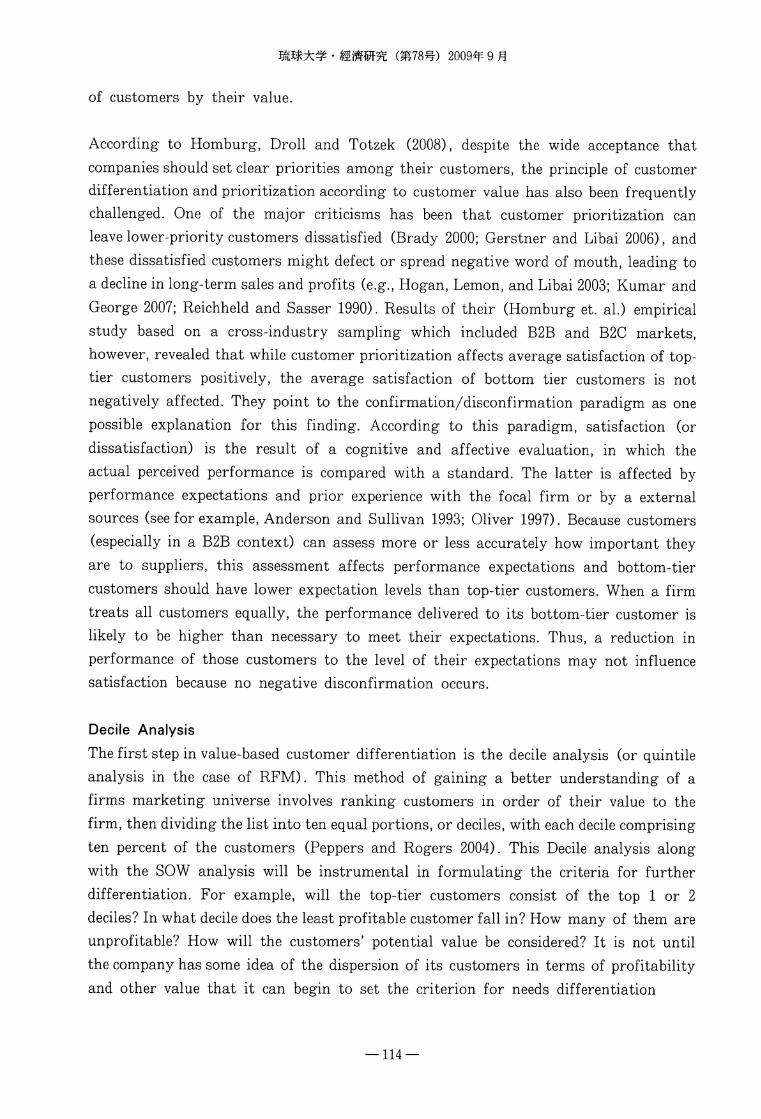
mrnmn mim) 2009^ 9 n
of customers by their value.
According to Homburg, Droll and Totzek (2008), despite the wide acceptance that
companies should set clear priorities among their customers, the principle of customer
differentiation and prioritization according to customer value has also been frequently
challenged. One of the major criticisms has been that customer prioritization can
leave lower-priority customers dissatisfied (Brady 2000; Gerstner and Libai 2006), and
these dissatisfied customers might defect or spread negative word of mouth, leading to
a decline in long-term sales and profits (e.g., Hogan, Lemon, and Libai 2003; Kumar and
George 2007; Reichheld and Sasser 1990). Results of their (Homburg et. al.) empirical
study based on a cross-industry sampling which included B2B and B2C markets,
however, revealed that while customer prioritization affects average satisfaction of top-
tier customers positively, the average satisfaction of bottom tier customers is not
negatively affected. They point to the confirmation/disconfirmation paradigm as one
possible explanation for this finding. According to this paradigm, satisfaction (or
dissatisfaction) is the result of a cognitive and affective evaluation, in which the
actual perceived performance is compared with a standard. The latter is affected by
performance expectations and prior experience with the focal firm or by a external
sources (see for example, Anderson and Sullivan 1993; Oliver 1997). Because customers
(especially in a B2B context) can assess more or less accurately how important they
are to suppliers, this assessment affects performance expectations and bottom-tier
customers should have lower expectation levels than top-tier customers. When a firm
treats all customers equally, the performance delivered to its bottom-tier customer is
likely to be higher than necessary to meet their expectations. Thus, a reduction in
performance of those customers to the level of their expectations may not influence
satisfaction because no negative disconfirmation occurs.
Decile Analysis
The first step in value-based customer differentiation is the decile analysis (or quintile
analysis in the case of RFM). This method of gaining a better understanding of a
firms marketing universe involves ranking customers in order of their value to the
firm, then dividing the list into ten equal portions, or deciles, with each decile comprising
ten percent of the customers (Peppers and Rogers 2004). This Decile analysis along
with the SOW analysis will be instrumental in formulating the criteria for further
differentiation. For example, will the top-tier customers consist of the top 1 or 2
deciles? In what decile does the least profitable customer fall in? How many of them are
unprofitable? How will the customers' potential value be considered? It is not until
the company has some idea of the dispersion of its customers in terms of profitability
and other value that it can begin to set the criterion for needs differentiation
— 114 —
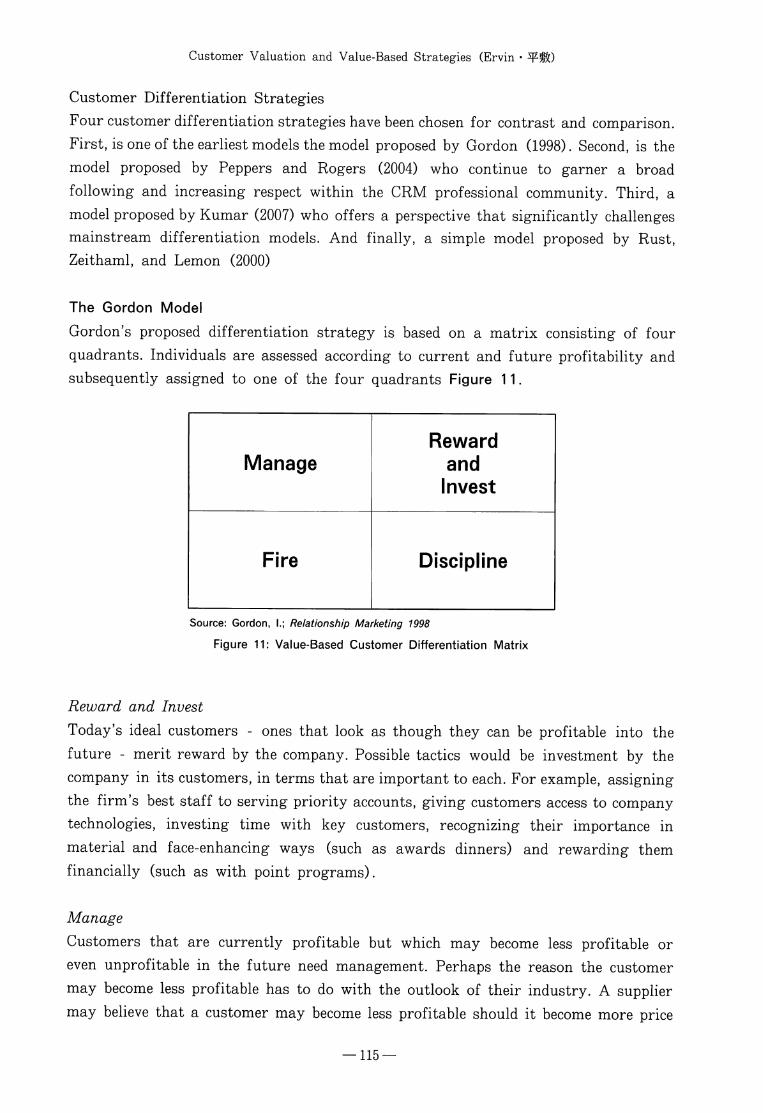
Customer Valuation and Value-Based Strategies (Ervin
Customer Differentiation Strategies
Four customer differentiation strategies have been chosen for contrast and comparison.
First, is one of the earliest models the model proposed by Gordon (1998). Second, is the
model proposed by Peppers and Rogers (2004) who continue to garner a broad
following and increasing respect within the CRM professional community. Third, a
model proposed by Kumar (2007) who offers a perspective that significantly challenges
mainstream differentiation models. And finally, a simple model proposed by Rust,
Zeithaml, and Lemon (2000)
The Gordon Model
Gordon's proposed differentiation strategy is based on a matrix consisting of four
quadrants. Individuals are assessed according to current and future profitability and
subsequently assigned to one of the four quadrants Figure 11.
Manage
Fire
Reward
and
Invest
Discipline
Source: Gordon, I.; Relationship Marketing 1998
Figure 11: Value-Based Customer Differentiation Matrix
Reward and Invest
Today's ideal customers - ones that look as though they can be profitable into the
future - merit reward by the company. Possible tactics would be investment by the
company in its customers, in terms that are important to each. For example, assigning
the firm's best staff to serving priority accounts, giving customers access to company
technologies, investing time with key customers, recognizing their importance in
material and face-enhancing ways (such as awards dinners) and rewarding them
financially (such as with point programs).
Manage
Customers that are currently profitable but which may become less profitable or
even unprofitable in the future need management. Perhaps the reason the customer
may become less profitable has to do with the outlook of their industry. A supplier
may believe that a customer may become less profitable should it become more price
— 115 —
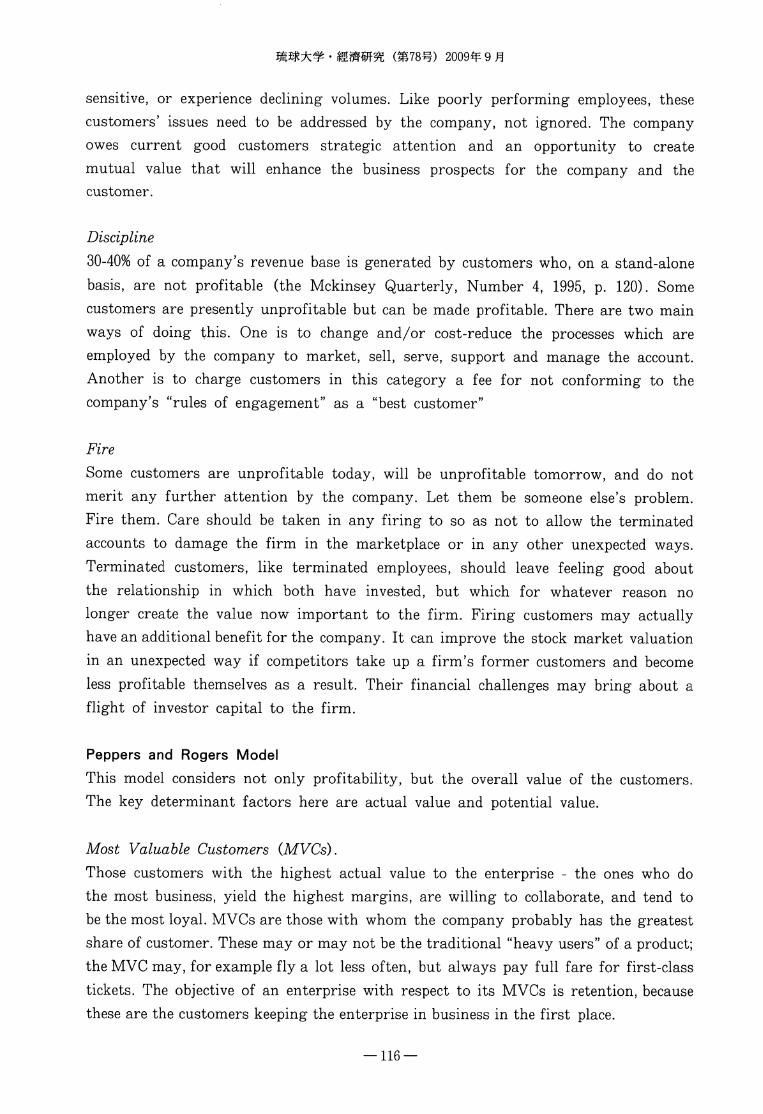
(8178-Jt) 2009^9^
sensitive, or experience declining volumes. Like poorly performing employees, these
customers' issues need to be addressed by the company, not ignored. The company
owes current good customers strategic attention and an opportunity to create
mutual value that will enhance the business prospects for the company and the
customer.
Discipline
30-40% of a company's revenue base is generated by customers who, on a stand-alone
basis, are not profitable (the Mckinsey Quarterly, Number 4, 1995, p. 120). Some
customers are presently unprofitable but can be made profitable. There are two main
ways of doing this. One is to change and/or cost-reduce the processes which are
employed by the company to market, sell, serve, support and manage the account.
Another is to charge customers in this category a fee for not conforming to the
company's "rules of engagement" as a "best customer"
Fire
Some customers are unprofitable today, will be unprofitable tomorrow, and do not
merit any further attention by the company. Let them be someone else's problem.
Fire them. Care should be taken in any firing to so as not to allow the terminated
accounts to damage the firm in the marketplace or in any other unexpected ways.
Terminated customers, like terminated employees, should leave feeling good about
the relationship in which both have invested, but which for whatever reason no
longer create the value now important to the firm. Firing customers may actually
have an additional benefit for the company. It can improve the stock market valuation
in an unexpected way if competitors take up a firm's former customers and become
less profitable themselves as a result. Their financial challenges may bring about a
flight of investor capital to the firm.
Peppers and Rogers Model
This model considers not only profitability, but the overall value of the customers.
The key determinant factors here are actual value and potential value.
Most Valuable Customers (MVCs).
Those customers with the highest actual value to the enterprise - the ones who do
the most business, yield the highest margins, are willing to collaborate, and tend to
be the most loyal. MVCs are those with whom the company probably has the greatest
share of customer. These may or may not be the traditional "heavy users" of a product;
the MVC may, for example fly a lot less often, but always pay full fare for first-class
tickets. The objective of an enterprise with respect to its MVCs is retention, because
these are the customers keeping the enterprise in business in the first place.
— 116 —
Customer Valuation and Value-Based Strategies (Ervin
Most Growable Customers (MGCs).
These are the customers who have the most growth potential; growth that can be
realized through cross-selling, through keeping the customer for a long time, or perhaps
by changing the customer's behavior and getting them to operate in a way that cost
the enterprise less money. MGCs, in effect, are those customers with the highest
unrealized potential values. There is likely to be a large gap between the customers'
actual value and their potential value. One company's MGCs could actually be their
competitor's best customer - just as big as a firm's own MVCs, and often with similar
needs.
Below-zeros (BZs).
These are customers who, no matter what the effort a company makes, will generate
less revenue than cost-to-serve. That means that not only is their actual value below
zero, but their potential value is also less than zero. No matter what the firm does,
no matter what strategy it follows, a BZ customer is highly unlikely ever to show
a positive net value to the enterprise. Nearly every company has at least a few of
these customers - the telecommunications customer who moves often and leaves the
last month or two unpaid at each address, the high-maintenance customer who buys
little but needs lots of service, the giant business customer who bullies prices down so
low that the vendor's margin is repeatedly demolished. Some companies have many
such customers. The enterprise's strategy for a BZ should be to create incentives
either to convert the customer's trajectory into a breakeven or profitable one (for
instance, by imposing service charges for services previously given away for free) or
to encourage the BZ to become someone else's unprofitable customer.
Migrators.
These customers linger on the brink between being not profitable and having some
growth potential. The enterprise needs to decide whether they can be nurtured to
grow or are not capable of being highly valuable. The enterprise's goal should be to
migrate these customers to the MGC group, or at least to get them to show their
"true colors" regarding their likely profit for the enterprise or the long-term.
Kumar's Model
Kumar takes a different approach to customer differentiation in that he takes into
account the fact that all short duration customers are not necessarily low value
customers as has been debated in previous studies (see Reichheld 1996; Reinartz and
Kumar 2004). He also considers the fit between the customers and the firm's value
offering. His differentiation matrix illustrates how customers can be sorted based on
both longevity and profitability for the firm (Figure 12). While there may be
longstanding customers who are only marginally profitable, there also may be
— 117 —
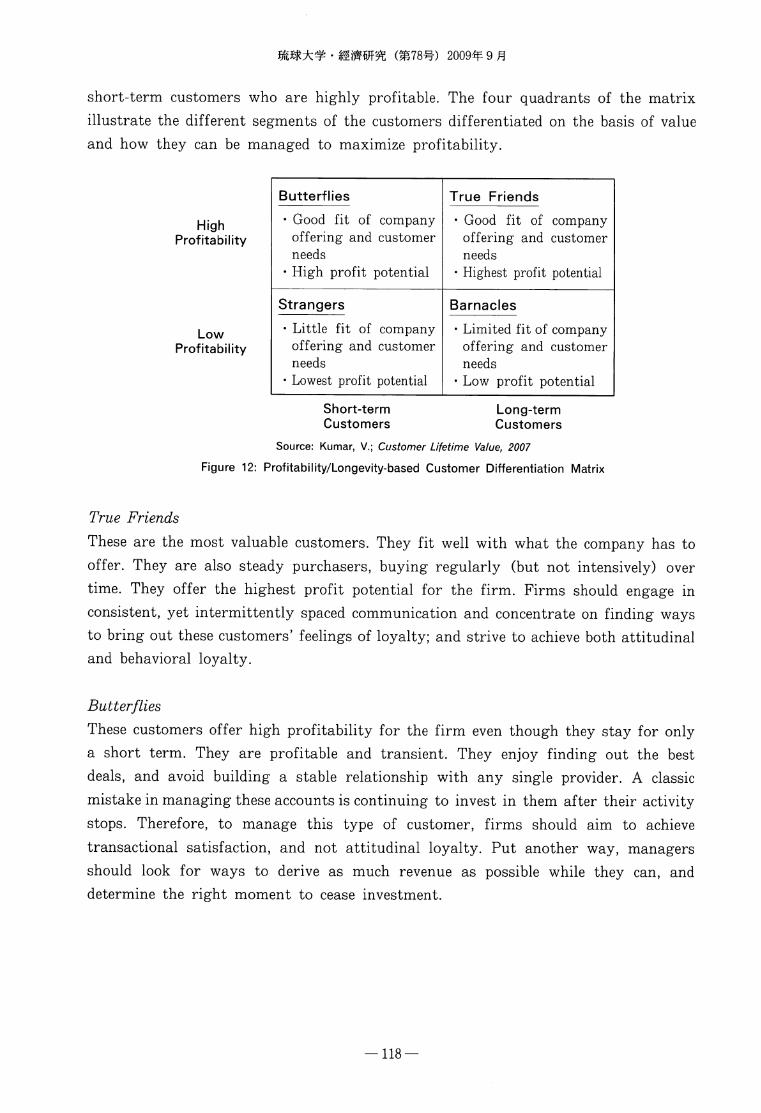
2009^ 9
short-term customers who are highly profitable. The four quadrants of the matrix
illustrate the different segments of the customers differentiated on the basis of value
and how they can be managed to maximize profitability.
High
Profitability
Low
Profitability
Butterflies
• Good fit of company
offering and customer
needs
• High profit potential
Strangers
• Little fit of company
offering and customer
needs
• Lowest profit potential
True Friends
• Good fit of company
offering and customer
needs
• Highest profit potential
Barnacles
• Limited fit of company
offering and customer
needs
• Low profit potential
Short-term
Customers
Long-term
Customers
Source: Kumar, V.; Customer Lifetime Value, 2007
Figure 12: Profitability/Longevity-based Customer Differentiation Matrix
True Friends
These are the most valuable customers. They fit well with what the company has to
offer. They are also steady purchasers, buying regularly (but not intensively) over
time. They offer the highest profit potential for the firm. Firms should engage in
consistent, yet intermittently spaced communication and concentrate on finding ways
to bring out these customers' feelings of loyalty; and strive to achieve both attitudinal
and behavioral loyalty.
Butterflies
These customers offer high profitability for the firm even though they stay for only
a short term. They are profitable and transient. They enjoy finding out the best
deals, and avoid building a stable relationship with any single provider. A classic
mistake in managing these accounts is continuing to invest in them after their activity
stops. Therefore, to manage this type of customer, firms should aim to achieve
transactional satisfaction, and not attitudinal loyalty. Put another way, managers
should look for ways to derive as much revenue as possible while they can, and
determine the right moment to cease investment.
— 118 —

Customer Valuation and Value-Based Strategies (Ervin • ^fISO
Barnacles
This type of customer, in spite of being a long-term customer, offers low profitability,
is a limited fit for the company, and offers low profit potential. They don't generate
satisfactory return on investments because the size and volume of transactions are
too low. Like barnacles on the hull of a cargo ship, they only create additional drag.
However, if properly managed, they can sometimes become profitable. To manage
such customers, firms should determine whether the problem is a small SOW or a
small wallet size. If the SOW is found to be low, specific cross-selling and up-selling
can be done to extract profitability. However if the wallet size is small, then strict
cost control measures can reduce the loss for the firm.
Strangers
As the name suggests, these are the least profitable customers for the firm. They fit in
poorly with the company offerings. To manage these customers, the key is to identify
them early and refrain from making any relationship investment. These customers
have no loyalty to the firm and bring in no profits. Hence, the firms aim should be
to extract maximum profit from every transaction with these customers (Reinartz
and Kumar 2002)
Kumar notes that while the chance of misclassification of customers between the four
quadrants does exist, the model provides sufficient scope for regular reevaluation of
customers and constant update of customer segmentation status and maintains that
this updating should be based on the purchase cycle of the products/services.
Rust, Zeithaml, Lemon Model
The Rust, Zeithaml, Lemon Model offer a differentiation model they term the
customer pyramid. This model appears to be based solely on profitability. Although
loyalty is mentioned, it is done so more in the context of a descriptor rather than a
measurement or objective. It neither considers customer behavior nor growth potential.
Although it may be suitable for a loyalty program or for a business just starting
out with customer valuation, it is clearly unsuitable for a mature CRM program.
Platinum Tier
These are the company's most profitable customers, typically those who are heavy
users of the product, are not overly price sensitive, are willing to invest in and try
new offerings, and are committed customers of the firm.
Gold Tier
The profitability of these customers is not as high as that of platinum customers,
perhaps because they want price discounts or are not as loyal. They may be heavy
— 119 —
(3S78*t) 2009^9 3
users who minimize risk by working through multiple vendors rather than just the
focal company.
Iron Tier
This tier contains essential customers who provide the volume needed to utilize the
firm's capacity, but their spending levels, loyalty, and profitability are not substantial
enough for special treatment.
Lead Tier
These customers are costing the company money. They demand more attention than
they are due given their spending and profitability, and are sometimes problem
customers, complaining about the firm to others.
The authors of this model note that it resembles the segmentation used by American
Airlines, but point out two major differences:
1. Profitability rather than usage defines all tier levels.
2. The lower levels actually articulate classes of customers who require a different
sort of attention. The firm must work either to change their behavior to make
them more profitable, or change the firms cost structure to make them more
profitable through decreased costs.
All of the models are similar in that they each advocate four classifications. All
prioritize their customers in terms of profitability except that of Peppers and
Rogers, which also considers other factors such as collaboration, business volume,
and loyalty. Interestingly, while Peppers and Rogers emphasize potential value,
Gordon on the other hand accounts for the possible future unprofitability of customers.
All models provide a classification for borderline or marginal customers and offer
similar strategies for managing them (except the Rust, Zeithaml, Lemon Model,
which offers no strategies). While three of the models clearly provide a category for
unprofitable customers, the Kumar model seems to include these customers with the
marginally profitable ones (barnacles). The Kumar model is the only model that
takes into account the longevity of the customers' patronage. From a resources
allocation standpoint, it can be seen that not only the current, future, and potential
profitability of customers, but also their overall value to the firm can be considered
key factors for prioritization.
Allocation of Marketing Resources
The allocation of marketing resources can be seen as the final stage of the qualification
process. Once the customers' individual (lifetime) values have been calculated, their
— 120 —
Customer Valuation and Value-Based Strategies (Ervin
growth potential has been ascertained, and they have been differentiated accordingly,
decisions concerning resources allocation can be made based on those actual and
potential values. This is an important concept because if companies are not vigilant,
exorbitant amounts of marketing and servicing dollars can be wasted on customers
who are not presently nor can or will be profitable in the future. Customers who
have previously been profitable but whose profitability is on a downward trajectory
may pose an equal risk.
Kumar (2007, 2008) articulates several important considerations involved in optimizing
resources allocation. The first step, he imparts, is to identify the most profitable
(and high potential) customers and the customers who are most responsive to marketing
efforts. The second step is to figure out the right mix of channel contacts for each
customer. This depends on how responsive each customer is to these various channels
of communication (e.g. email, direct mail, telephone, direct visit by a sales person)
and how cost-effective these channels are. To simplify the approach of optimally
allocating resources, Kumar categorizes the channels used for marketing purposes
into the following two types:
• Rich modes. These include face-to-face-meetings, trade event meetings, and
telephone calls. These modes can be 50 to 100 times or more expensive than
standardized modes, but on the other hand they may seem more like personal
service.
• Standardized modes. These include direct mail and email contacts.
Each of these modes differs significantly in cost and personalization, and different
customers have different levels of responsiveness. Rich modes are associated with
high costs and have to be used sparingly and when the situation warrants it. They
are preferred when there is a high level of uncertainty in a relationship with a
customer. Standardized modes are the most cost efficient channels of individual-level
communications. For relational customers, standardized modes can be used to maintain
commitment and trust by regularly communicating the relationship benefits to these
customers.
The next step is to decide how frequently the customer should be contacted and what
the inter-contact time should be. It can be said that there is an optimal frequency of
communicating using various channels of communication. Too much or too little
communication is not effective. Initially, as the number of marketing interventions
made by the company increases, the customer's purchase frequency also increases and
it maximizes at a particular point. Any further communication or marketing
— 121 —

mmmn mim) 2009^ 9 n
investment on that customer will only result in a reduction in the purchasing
frequency. Therefore, companies should find this optimal level of communication for
each customer and design their promotions accordingly, to maximize profit. Contact
with customers at regular yet sufficiently spaced intervals will help to maintain
relationships, however too much communication could harm them. Once again,
companies should find the optimal inter-contact point and contact customers when
necessary. The best approach is to evaluate when customers are most likely to buy
based on past purchasing behavior and send communications through the appropriate
channel to induce them to purchase.
Also, the various factors that affect customer behavior such as up-selling and cross-
selling, etc. need to be analyzed. Therefore, by carefully monitoring the customers'
purchase frequency, inter-purchased time, and their contribution toward profit,
managers can determine the frequency of marketing initiatives to maximize lifetime
value. Further, this measured approach considers each customer's responsiveness to each
channel of communication and thus provides for the implementation of a carefully
designed strategy to allocate the limited marketing resources.
A forward looking metric such as CLV (particularly when enhanced by an SOW
analysis) can be used to effectively allocate marketing resources to maximize profit
while providing managers with a guideline to evaluate the return on marketing
investments. By linking all resource-allocation decisions to the CLV of the customer,
the managers can be well-prepared for projected transitions and changes in the
customer purchase behavior. For example, a customer's/supplier's transition through
the lifecycle (exploration, evaluation, maturity and decline) can be accommodated by
evaluating their CLV; in turn, this will help optimize resource allocation.
Figure 13 illustrates how the resource allocation strategy can be put into practice.
The customers are segmented based on their Share Of Wallet and their value to the
firm, and various strategies are recommended to manage different types of customers.
By combining CLV with SOW, firms can effectively categorize customers based on
both loyalty and profitability, and thus an effective resource-allocation strategy can be
formulated. Also, by using CLV, which includes future spending potential of customers,
managers can ensure higher return on their marketing investments.
The customers in cell I have a low SOW and low customer value. They are of little
value to the firm, and managers should refrain from investing in these customers to
avoid loss. Customers in cell II have a high customer value and a low SOW. In this
case, firms should adopt a conversion strategy, and invest in up-selling and cross-
selling to these customers. Customers in cell III have a high SOW, but a low
— 122 —

Customer Valuation and Value-Based Strategies (Ervin
• Share-of-Wallet
Low High
High
Customer
Value
Low
Cell n
Heavy investment
conversion
strategy through
up-selling and
cross-selling
Cell IV
Higher frequency
of contacts -
Reward
behavioral loyalty
and create
attitudinal loyalty
Resource^Mtocation
Cell I
Transact through
Low cost channels,
and try up-selling
and cross-selling
CellIV
CellsII &III
Cell n
Lower frequency
of contacts
CellI
High
Investment
Moderate
Investment
Minimal
Investment
Consider Divestment
Source: Kumar, V.; Customer Lifetime Value, 2007
Figure 13 Resources Allocation Decision Matrix
customer value. Firms should shift resources from customers in cell 11 to those in
cell II with the goal of increasing their SOW. Customers in cell IV have a high SOW
and high customer value. They should be the main targets for loyalty programs,
and firms should heavily invest in maintaining their loyalty and maximizing their
profitability.
In summary, optimal resource allocation is a process that determines which customers
to target in order to assign the available marketing resources so that they produce
the maximum possible profits in the minimum possible time. The strategy aims to
maximize profits by reducing the costs incurred.
The Customer Qualification Process
The customer qualification process can be defined as a set of procedures for gathering
and classifying specific customer data to be used with specific algorithms for the
measurement individual customer values, the differentiation of those customers
according to their value to the firm, and the allocation of marketing resources
according to the most valuable or profitable customers.
Figure 14 illustrates the role of customer valuation and value-based strategies both
in the framework of the customer qualification process and in the context of a
larger process-based CRM framework.
— 123 —
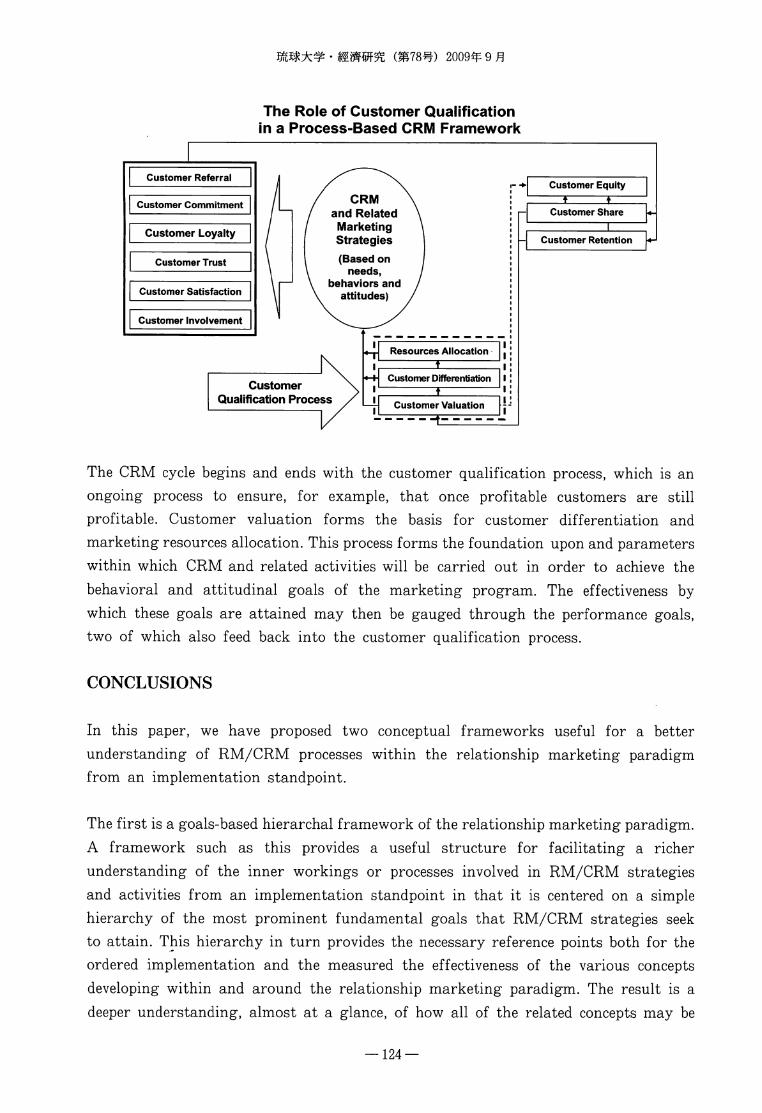
2009^ 9
The Role of Customer Qualification
in a Process-Based CRM Framework
Customer Referral
CRM
and Related
Marketing
Strategies
Customer Commitment
Customer Loyalty
(Based on
needs,
behaviors and
attitudes)Customer Satisfaction
Customer Involvement
Resources Allocation
Customer DifferentiationCustomer
Qualification ProcessCustomer Valuation
Customer Equity
— Customer Share
_L
Customer Retention
The CRM cycle begins and ends with the customer qualification process, which is an
ongoing process to ensure, for example, that once profitable customers are still
profitable. Customer valuation forms the basis for customer differentiation and
marketing resources allocation. This process forms the foundation upon and parameters
within which CRM and related activities will be carried out in order to achieve the
behavioral and attitudinal goals of the marketing program. The effectiveness by
which these goals are attained may then be gauged through the performance goals,
two of which also feed back into the customer qualification process.
CONCLUSIONS
In this paper, we have proposed two conceptual frameworks useful for a better
understanding of RM/CRM processes within the relationship marketing paradigm
from an implementation standpoint.
The first is a goals-based hierarchal framework of the relationship marketing paradigm.
A framework such as this provides a useful structure for facilitating a richer
understanding of the inner workings or processes involved in RM/CRM strategies
and activities from an implementation standpoint in that it is centered on a simple
hierarchy of the most prominent fundamental goals that RM/CRM strategies seek
to attain. This hierarchy in turn provides the necessary reference points both for the
ordered implementation and the measured the effectiveness of the various concepts
developing within and around the relationship marketing paradigm. The result is a
deeper understanding, almost at a glance, of how all of the related concepts may be
— 124 —

Customer Valuation and Value-Based Strategies (Ervin
prioritized and/or work to complement each other. Although relationship marketing
concepts have been treated extensively in the literature, this coverage has been
largely fragmented and isolated with little if any reference to how each concept may
relate to, or compliment another in when viewed in a larger context. This framework
is not intended to be exclusive with respect to the constituent components, but
rather begs for flexibility in the addition, subtraction or interchangeability of the
components as each field matures with time. The fields of database marketing and
CRM, for example, could conceivable be merged at some future point. The difference
between direct marketing and database marketing is also a source of contention in
some circles.
The second is a process-based framework of the customer qualification process as it
relates to higher level CRM activities. This can be seen as an important cornerstone
of the entire concept of relationship marketing. In order for relationship marketing
to work, relationships must be built based on mutual value. That is, customers must
receive value from the utility of the firm's products and services, and the firm must
receive value from the margins and other contributions of individual customers.
Further, the marketing resources necessary to retain those customers are limited by
the very contributions they make to the firm. Therefore, a clear understanding of
the customer qualification process is of paramount importance. It is the single most
prerequisite concept in the relationship marketing paradigm and is the engine that
drives all other CRM efforts.
Additionally, we have provided a survey of extant literature on the major elements of the
customer qualification process, the understanding of which is a vital prerequisite to the
consideration of expenditures for supporting IT infrastructure. Key considerations
concerning customer qualification include deciding on the initial valuation model,
defining customers, classification of data to be collected, data collection procedures, and
the subsequent formulation of customer-based strategies, which is the main object of
customer valuation. For an understanding of the main characteristics of customer
valuation models, specific examples of RFM analysis, customer profitability analysis,
Time-driven ABC, and CLV models were presented, and the contrast and comparison
of two CLV models and three customer differentiation matrices were also offered to
highlight likely customer-based strategies.
Although, the customer lifetime value framework is the most widely accepted metric
for measuring individual customer value to a company, the complexities involved
with implementation can be overwhelming at the outset. At present, the time
required for full implementation of a statistical CLV model takes anywhere from
several months to more than a year. Therefore, an enterprise newly embarking on
— 125 —
2009^9^
customer valuation efforts should initially choose an easier valuation model that is
commensurate with its current level of resources and knowledge of the concept,
gradually building toward a suitable CLV framework. Data collection should begin
with that which already exists within the company or readily obtainable foom its
customers. The type of data collected should only be that which will be used in the
proposed valuation model or a projected enhancement thereto in order to avoid cost
overruns.
Of all the literature surveyed the knowledge of databases is implied, however this
may not be the case. Many companies (particularly SMEs) are just beginning to
understand the power of a database and may not even employ the qualified personnel to
optimize its use. Before investing in a database, which is required for the implementation
of an RFM (and ultimately CLV) model, the firm must know its purpose, full potential
and limitations, and scalability.
Finally, the concepts introduced in this paper highlight the need for future CRM
software and IT infrastructure to include capabilities for supporting customer valuation
and value-based strategies in order for marketers to optimize their CRM efforts.
FUTURE CONSIDERATIONS
Because of the limited of scope of this study, there were some areas of particular
importance that could not be investigated. The first of these areas is "size of wallet."
Although the calculation of SOW is a fairly simple and straight forward process once
the definition of the company's domain has been revisited, estimation/measurement
of individual size of wallet appears to be a significant challenge in both B2B and
B2C markets. Of the literature surveyed for this paper, none expounded on the topic
of size of wallet.
A second area of importance is the cost of implementing a valuation model. In the
literature surveyed, there were references to the cost of data collection; however the
importance of identifying other cost drivers such as outlays for IT, training of
personnel, conducting ABC estimates, data analysis, etc. were not mentioned in any
significant detail. While all of the literature indicates that the valuation framework
is a worthwhile investment, it doesn't treat the costs involved with implementation and
upkeep. It would seem obvious that the cost of implementing the valuation framework
must be assessed as well. If not, companies run the risk of reducing the value received
by their customers in an attempt to measure it.
— 126 —
Customer Valuation and Value-Based Strategies (Ervin
Finally, communicating the customer value concept to contact and other key personnel.
The customer value concept is not for management personnel only. It must be
communicated to, and inculcated in the minds of all touch point personnel (at the very
least) as well. Not only will the firms have to consider cost, but also organizational
structure, corporate culture and more.
REFERENCES
1. Anderson., E. W., Sullivan, M.W.; The Antecedents and Consequences of Customer
Satisfaction of Firms; Marketing Science (1993) Volume 12, Number 2, pp. 125-143
2. Brady, D; Why Service Stinks; Business Week pp 72-78, October 23, 2000
3. Brealey, R. A., Myers, S. C; Principles of Corporate Finance, Th ed.; New York:
McGraw-Hill, 2002
4. Caulfield, J.; Facing up to CRM; Business 2.0 (August-September, 2001), pp.149-150
5. Damodaran, A.; The Dark Side of Valuation: Valuing Old Tech, New Tech, and
New Economy Companies; Upper Saddle River, NJ: Prentice Hall, 2001
6. David Shepherd Associates; The New Direct Marketing: How to Implement a
Profit-Driven Database Marketing Strategy; New York: McGraw-Hill, 1999
7. Day, G.; Winning the Competition for Customer Relationship, Working Paper;
The Wharton School, University of Pennsylvania, 2002
8. Dowling, G.R., Uncles, M.; Do Customer Loyalty Programs Really Work?; Sloan
Management Review, Volume 38, Number 4, pp. 71-82
9. Egan, J.; Relationship Marketing: Exploring Relational Strategies in Marketing;
Harlow: Prentice Hall, 2004
10. Farris, P.W., Neil, T.B., Phillip, E. P., David, J. R.: Marketing Metrics; Upper
Saddle River: Wharton School Publishing, 2006
11. Gerstner, E., Libai, B.; Why does Poor Service Prevail? Marketing Science (2006)
Volume 25, Number 6 pp. 601-603
12. Gordon, I.H.; Relationship Marketing: New Strategies, Techniques and Technologies
to Win the Customers You Want and Keep Them Forever; Wiley & Sons, Canada,
1998
13. Gronroos, C; From Scientific Management to Service Management: A Management
Perspective for the Age of Service Competition; International Journal of Service
Industry Management (1994), Volume 5, Number 1, pp. 5-20.
14. Gronroos, C; From Marketing Mix to Relationship Marketing-Towards a Paradigm
Shift in Marketing; Management Decisions (1997), Volume 35, Issue 3/4, p. 322-339.
15. Gupta, S., Lehmann, D. R.; Customers As Assets; Journal of Interactive Marketing
(2003) Volume 17, Issue 1, pp. 9-24
16. Gupta, S., Lehmann, D. R., Stuart, J. A.; Managing Customers as Investments,
Upper Saddle River, NJ: Wharton School Publishing, 2005
— 127 —

mmmn mn^) 2009^ 9 n
17. Hennig-Thurau, T.; Hansen, U. Relationship Marketing: Gaining Competitive
Advantage Through Customer Satisfaction and Customer Retention; Springer-
Verlag, Berlin, New York, 2000
18. Heskett, J. Sasser, W.E. Jr., Schlinger, L.; The Value Profit Chain: Treat Employees
Like Customers and Customers Like Employees; New York: Simon and Schuster,
2003
19. Hogan, J.E., Lemon, K.N., Libai, Barak; What is the True Value of a Lost
Customer?; Journal of Service Research (2003), Volume 5, Number 3, pp. 196-208
20. Hughes, A. M.; Strategic Database Marketing; New York: McGraw-Hill, 2006
21. Khan, Y.; Winning Cards; Marketing Business, May, p. 65
22. Kaplan, R. S., Anderson, S. R.; Time-Driven Activity Based Costing; Harvard
Business Review (Nov 2004) Volume 82, Issue 11, pp. 131-138
23. Kotler, P., Keller, K. L.; Marketing Management; Upper Saddle River' Pearson
Education, Inc., 2006
24. Kumar, V.; Customer Lifetime Value-The Path to Profitability; Foundations
and Trends® in Marketing (2007), Volume 2, Number 1, pp. 1-96,
25. Kumar, V.; Managing Customers for Profit Strategies to increase profit and build
loyalty; Upper Saddle River Wharton School Publishing, 2008
26. Kumar, V., George, M.; Measuring and Maximizing Customer Equity;: A Critical
Analysis; Journal of the Academy of Marketing Science (2007) Volume 35, Number
2 pp 151-171
27. Lemon, K. N., Rust, R. T., Zeithaml V.; Driving Customer Equity; New York:
The Free Press, 2000
28. Libey, D. R.; Pickering, C; Libey and Pickering on RFM and Beyond; New York'
MeritDirect Press, 2005
29. Meckley, B., Toscano, L.; Defining Customer Valuation; IBM Business Consulting
Services, 2005
30. Newell, F.; The New rules of marketing: How to Use One-to-One Relationship
Marketing to Be the Leader in Your Industry; McGraw-Hill, 1997
31. Novo, J.; Drilling Down: Turning customer Data into profits with a spreadsheet;
Saint Petersburg, 2004
32. O'Malley, L.; Can Loyalty Schemes Really Build Loyalty?; Marketing Intelligence
and Planning (1998), Volume 16, Number 1, pp. 47-55(9)
33. Oliver, R.L.; Satisfaction: A Behavioral Perspective on the Consumer; Boston:
McGraw-Hill, 1997
34. Peppers, D., Rogers, M.; One-to-One: Tools For Competing in the Interactive Age
(lsted.); New York: currency Doubleday, 1997
35. Peppers, D., Rogers, M.; Managing Customer Relationships; Wiley and Sons, 2004
36. Peppers, D., Rogers, M.; The One to One Fieldbook; Currency Doubleday, 1999
37. Reichheld, F.; The Loyalty Effect; Boston: HBS Press, 1996
— 128 —
Customer Valuation and Value-Based Strategies (Ervin •
38. Reichheld, F., Sasser, W.; Zero defects: Quality Comes to Services", Harvard
Business Review (Sep-Oct 1990), pp. 105-111
39. Reinartz, W., Kumar V.; On the Profitability of Long-Life Customers in a
Noncontractual Setting; Journal of Marketing (Oct 2000), Volume 64, Number 4,
pp. 17-35
40. Reinartz, W., Kumar V.; The Impact of Customer Relationship Characteristics on
Profitable Lifetime Duration; Journal of Marketing (2003), Volume 67, Number
1, pp. 77-99
41. Reinartz, W., Kumar V.; The Mismanagement of Customer Loyalty; Harvard
Business Review (Jul 2002) pp. 86-94
42. Reinartz, W., Kumar V.; Balancing acquisition and Retention Resources to Maximize
Customer Profitability; Journal of Marketing Volume 69, pp. (January 2005) 63-79
43. Rigby, K., Ledingham, D.; CRM Done Right; Harvard Business Review (Nov 2004)
pp. 118-129
44. Rust, R., Zeithaml, V., Lemon, K.; Driving Customer Equity; New York: Simon
and Schuster, 2000
45. Schmid, J., Webber, A.; Desktop Database Marketing; Chicago: NTC/Contemporary
Publishing Group, 1998
46. Vavra, T. G.; Aftermarketing, Business One Irwin, 1992
47. Venkatesan, R. and Kumar, V.; A Customer Lifetime Value Framework for
Customer Selection and Resource Allocation Strategy; Journal of Marketing Volume
68, Issue ?, pp. 106-125
48. Weisel, T. Skiera, B. and Villanueva, J.; Customer Equity: An Integral Part of
Financial Reporting; Journal of Marketing (2005) Volume 72, pp. 1-14
— 129 —
URL References
1. 24-7 Press Release; Why do Most CRM Projects Fail?; November 25, 2008
http://www.24-7pressrelease.com/press-release-rss/why-do-most-crm-projecဗ
76323.php
2. Carlin, S.; Insights into Using Customer Valuation Strategies to Drive Growth
and Increase Profits from Aon Risk Services, Sprint Nextel, and a Leading
Brokerage Services Firm; (2007)
http://www.apqc.org/portal/apqc/ksn/FinalEditedCustomerValu
ationArticlev2 ,pdf?paf_gear_id=contentgearhome&paf_dm—full&pageselect
= contentitem&docid= 130606
3. CRMtrends; Marketing Analysis; http://www.crmtrends.com/analytics.html
4. Evans, B.; "A question of Customer Loyalty/'; Information Week Online July 3,
2000
5. Dignon, L.; Is CRM All Its Cracked up to Be, CNET, April 3, 2002
6. Kinekin, E.; How Valuable Are Your Customers?;
http://my.advisor.com/doc/KINIE01, posted 08/27/2001
7. Market Focus Direct; Customer Valuation;
http://www.market-focus.com/valuation.html
8. McNab, D.; How Should we Measure Customer Profitability?;
http://www.the^ma.org/?WCE=C=47IK=226030; May 9, 2005
9. Mellow, A.; CRM Failures: Don't Blame The Tools;
http://techupdat.zdnet.com; December 18, 2002
10. Schmid, J.; Catalog Analysis: The Cost of Acquiring a Customer;
http://multichannelmerchant.com/news/marketing_catalog_analysis_cost/
11. SearchDataManagement.com; RFM analysis;
http://searchdatamanagement.techtarget.com/sDefinition/0Msid91_gci
751219,00.html
12. Sellers, J., Hughes A.M.; RFM Migration Analysis-A New Approach to a Proven
Technique; Database Marketing institute,
http://www.dbmarketing.com/articles/Artl23.htm,
accessed September 12, 2008
13. Weber, A.; Building a Customer Value Index;
http://www.dbmarketing.com/articles/Artl62.htm
accessed September 12, 2008
— 130 —