title: emissions performance standard impact … kayihan 0300 068 6913 summary: intervention and...
TRANSCRIPT

1
Title: Emissions Performance Standard Impact Assessments (IAs) This document comprises the two related Impact Assessments that have to date been published in respect of the Emissions Performance Standard (EPS). Part 1 of this document IA No: DECC0064 was first published together with “Planning our electricity future: A White Paper for secure, affordable and low carbon electricity” in July 2011 available at http://webarchive.nationalarchives.gov.uk/20121025080026/http://www.decc.gov.uk/en/content/cms/legislation/white_papers/emr_wp_2011/emr_wp_2011.aspx Part 2 of this document IA No: DECC0080 was first published in May 2012 alongside the Draft Energy Bill http://webarchive.nationalarchives.gov.uk/20121025080026/http://www.decc.gov.uk/en/content/cms/legislation/energybill2012/energybill2012.aspx These Impact Assessments have been published together for ease of reference.

2
Part 1
Title: Emissions Performance Standard
Lead department or agency:
DECC
Other departments or agencies:
Impact Assessment (IA)
IA No: DECC0064
Date: 08/05/2013
Stage: Final
Source of intervention: Domestic
Type of measure: Other
Contact for enquiries:
Selcan Kayihan 0300 068 6913
Summary: Intervention and Options
What is the problem under consideration? Why is government intervention necessary?
Climate Change is a global market failure. In response to this the UK has set itself emission reductions targets and whilst the UK is on target to reduce its greenhouse emissions in 2020 by 34% on 1990 levels, in line with carbon budgets and the EU target, the longer term goals are more challenging. For example, in 2008 the Climate Change Act set a target to reduce greenhouse gas emissions by at least 80% by 2050, compared to 1990 levels.
The electricity system needs to be substantially decarbonised during the 2020s, particularly if it is to play its part in decarbonising the heat and transport sectors in the 2030s and beyond. Fossil fuel fired electricity generation is responsible for a significant proportion of the UK’s emissions. It is necessary to limit these emissions to help meet decarbonisation targets.
The Coalition Programme for Government stated that the Government would establish an Emissions Performance Standard (EPS) “that will prevent coal-fired power stations from being built unless they are equipped with sufficient carbon capture and storage to meet the emissions performance standard.”
What are the policy objectives and the intended effects?
The policy objective is for the EPS to act as a regulatory backstop, alongside the other decarbonisation policies set out in the accompanying EMR White Paper, ensuring that while fossil fuel-fired electricity generation continues to make an important contribution to electricity security of supply it does so in a manner consistent with the UK’s decarbonisation objectives.
What policy options have been considered, including any alternatives to regulation? Please justify preferred option (further details in Evidence Base)
The policy options that have been considered are:
- Option 1: Introduce an EPS of 600gCO2/kWh An annual limit on the amount of CO2 a plant can emit, equivalent to 600gCO2/kWh for plant operating at baseload
1
- Option 2: Introduce an EPS of 450gCO2/kWh An annual limit on the amount of CO2 a plant can emit, equivalent to 450gCO2/KWh for plant operating at baseload
2.
The preferred option is Option 2.
Will the policy be reviewed? It will be reviewed. If applicable, set review date: 2015
What is the basis for this review? PIR If applicable, set sunset clause date: To be determined in the final IA
Are there arrangements in place that will allow a systematic collection of monitoring information for future policy review?
Yes
Ministerial Sign-off
I have read the Impact Assessment and I am satisfied that, given the available evidence, it represents a reasonable view of the likely costs, benefits and impact of the leading options
1 For the purposes of the analysis presented in the IA, baseload is assumed to be 85%
2 For the purposes of the analysis presented in the IA, baseload is assumed to be 85%

3
Signed by the responsible Minister: ................................... Date: 08/05/2013

4
Summary: Analysis and Evidence Policy Option 1 An EPS as an annual limit on the amount of CO2 a plant can emit, equivalent to 600gCO2/KWh for
plant operating at baseload.
Price Base Year 2010
PV Base Year 2010
Time Period Years 17
Net Benefit (Present Value (PV)) (£m) -£0.6m
Low: High: Best Estimate: -£0.6m
COSTS (£m) Total Transition (Constant Price) Years
Average Annual (excl. Transition) (Constant Price)
Total Cost (Present Value)
Low
High
Best Estimate
0.06 0.05 0.6
Description and scale of key monetised costs by ‘main affected groups’
There would be a one-off cost to business for an initial regulatory exchange to establish the EPS value for each plant. The Environmental Agency estimated that this cost could be approximately £5,000 for each new plant. Also there will be the annual operating costs of a central body administering the EPS. The Environmental Agency estimated that this cost could be approximately £50,000 per year. This estimate is based on the Environment Agency’s experience of administering the EU ETS and is for the cost of administering an EPS in England and Wales only. Administering the EPS in Scotland may increase this cost and if so will be taken into account in the final stage IA. The EPS proposed at this level is not expected to result in an impact on investment, operation decision making or security of supply.
Other key non-monetised costs by ‘main affected groups’
BENEFITS (£m) Total Transition
(Constant Price) Years
Average Annual (excl. Transition) (Constant Price)
Total Benefit (Present Value)
Low
High
Best Estimate
0 0 0
Description and scale of key monetised benefits by ‘main affected groups’
This option does not give rise to any changes compared to the baseline with regards to generation mix or load factor, as the emissions of the new fossil fuel plants that the modelling suggests will become operational, combined with their estimated load factors under the baseline, do not breach the emissions limit created of this level of EPS.
Other key non-monetised benefits by ‘main affected groups’
The EPS will provide further clarity on the regulatory environment for fossil fuel power stations
Key assumptions/sensitivities/risks Discount rate (%)
3.5
Use of different fossil fuel price scenarios does not change the conclusions. The analysis presented relies on the baseline as modelled by Redpoint for the Electricity Market Reform (EMR) White Paper using a sophisticated economic model of investment in electricity generation. All modelling is dependent on the assumptions and methodology used. While the Government’s view is that the policy will improve clarity and investor confidence, it is not possible to model with accuracy the impact of the policy on investor sentiment. Analysis on options for grandfathering the EPS is detailed in the Grandfathering Period of the Emissions Performance Standard Impact Assessment. The assumption used in this impact assessment is that all new fossil fuel plants that become operational during the period considered here would be grandfathered.
Direct impact on business (Equivalent Annual) (£m): In scope of OIOO Measure Qualifies as
Costs: 0.05 Benefits: 0 Net: -0.05 Yes IN

5
Enforcement, Implementation and Wider Impacts What is the geographic coverage of the policy/option? Great Britain
From what date will the policy be implemented? 2014
Which organisation(s) will enforce the policy? Environmental Regulator
What is the annual change in enforcement cost (£m)? 0.02
Does enforcement comply with Hampton principles? Yes
Does implementation go beyond minimum EU requirements? N/A
What is the CO2 equivalent change in greenhouse gas emissions? (Million tonnes CO2 equivalent)
Traded:
Non-traded:
Does the proposal have an impact on competition? No
What proportion (%) of Total PV costs/benefits is directly attributable to primary legislation, if applicable?
Costs:
Benefits:
Distribution of annual cost (%) by organisation size (excl. Transition) (Constant Price)
Micro
< 20
Small
Medium
100%
Large
Are any of these organisations exempt? No No No No No
Specific Impact Tests: Checklist Set out in the table below where information on any SITs undertaken as part of the analysis of the policy options can be found in the evidence base. For guidance on how to complete each test, double-click on the link for the guidance provided by the relevant department.
Please note this checklist is not intended to list each and every statutory consideration that departments should take into account when deciding which policy option to follow. It is the responsibility of departments to make sure that their duties are complied with.
Does your policy option/proposal have an impact on…? Impact Page ref within IA
Statutory equality duties3
Statutory Equality Duties Impact Test guidance
No
Economic impacts
Competition Competition Assessment Impact Test guidance No 19
Small firms Small Firms Impact Test guidance No 19
Environmental impacts
Greenhouse gas assessment Greenhouse Gas Assessment Impact Test guidance No 19
Wider environmental issues Wider Environmental Issues Impact Test guidance No 19
Social impacts
Health and well-being Health and Well-being Impact Test guidance No
Human rights Human Rights Impact Test guidance No
Justice system Justice Impact Test guidance No
Rural proofing Rural Proofing Impact Test guidance No
Sustainable development
Sustainable Development Impact Test guidance
No
3 Race, disability and gender Impact assessments are statutory requirements for relevant policies. Equality statutory requirements will be
expanded 2011, once the Equality Bill comes into force. Statutory equality duties part of the Equality Bill apply to GB only. The Toolkit provides advice on statutory equality duties for public authorities with a remit in Northern Ireland.

6
Summary: Analysis and Evidence Policy Option 2 An EPS as an annual limit on the amount of CO2 a plant can emit, equivalent to 450Gco2/kWh for plant operating at baseload
Price Base Year 2010
PV Base Year 2010
Time Period Years 17
Net Benefit (Present Value (PV)) (£m) -£0.6m
Low: High: Best Estimate: -£0.6m
COSTS (£m) Total Transition (Constant Price) Years
Average Annual (excl. Transition) (Constant Price)
Total Cost (Present Value)
Low
High
Best Estimate
0.06 0.05 0.6
Description and scale of key monetised costs by ‘main affected groups’
There would be a one-off cost to business for an initial regulatory exchange to establish the EPS value for each plant. The Environmental Agency estimated that this cost could be approximately £5,000 for each new plant. Also there will be the annual operating costs of a central body administering the EPS. The Environmental Agency estimated that this cost could be approximately £50,000 per year. This estimate is based the Environment Agency’s experience of administering the EU ETS and is for the cost of administering an EPS in England and Wales only. Administering the EPS in Scotland may increase this cost and if so will be taken into account in the final stage IA The EPS proposed at this level is not expected to result in an impact on investment, operation decision making or security of supply.
Other key non-monetised costs by ‘main affected groups’
BENEFITS (£m) Total Transition
(Constant Price) Years
Average Annual (excl. Transition) (Constant Price)
Total Benefit (Present Value)
Low
High
Best Estimate
0 0 0
Description and scale of key monetised benefits by ‘main affected groups’
This option does not give rise to any changes compared to the baseline with regards to generation mix or load factor as the emissions of the new fossil fuel plants that the modelling suggests will become operational, combined with their estimated load factors under the baseline do not breach the emissions limit created of this level of EPS.
Other key non-monetised benefits by ‘main affected groups’
The EPS will provide further clarity on the regulatory environment for fossil fuel power stations.
Key assumptions/sensitivities/risks Discount rate (%)
3.5
Use of different fossil fuel price scenarios does not change the conclusions. The analysis presented relies on the baseline as modelled by Redpoint for the Electricity Market Reform (EMR) White Paper using a sophisticated economic model of investment in electricity generation. All modelling is dependent on the assumptions and methodology used. While the Government’s view is that the policy will improve clarity and investor confidence, it is not possible to model with accuracy the impact of the policy on investor sentiment.
Analysis on options for grandfathering the EPS is detailed in the Grandfathering Period of the Emissions Performance Standard Impact Assessment. The assumption used in this impact assessment is that all new fossil fuel plants that become operational during the period considered here would be grandfathered
Direct impact on business (Equivalent Annual) (£m): In scope of OIOO Measure Qualifies as

7
Costs: 0.05 Benefits: 0 Net: -0.05 Yes IN
Enforcement, Implementation and Wider Impacts What is the geographic coverage of the policy/option? Great Britain
From what date will the policy be implemented? 2014
Which organisation(s) will enforce the policy? Environmental Regulator
What is the annual change in enforcement cost (£m)? 0.02
Does enforcement comply with Hampton principles? Yes
Does implementation go beyond minimum EU requirements? N/A
What is the CO2 equivalent change in greenhouse gas emissions? (Million tonnes CO2 equivalent)
Traded:
Non-traded:
Does the proposal have an impact on competition? No
What proportion (%) of Total PV costs/benefits is directly attributable to primary legislation, if applicable?
Costs:
Benefits:
Distribution of annual cost (%) by organisation size (excl. Transition) (Constant Price)
Micro
< 20
Small
Medium
100%
Large
Are any of these organisations exempt? No No No No No
Specific Impact Tests: Checklist Set out in the table below where information on any SITs undertaken as part of the analysis of the policy options can be found in the evidence base. For guidance on how to complete each test, double-click on the link for the guidance provided by the relevant department.
Please note this checklist is not intended to list each and every statutory consideration that departments should take into account when deciding which policy option to follow. It is the responsibility of departments to make sure that their duties are complied with.
Does your policy option/proposal have an impact on…? Impact Page ref within IA
Statutory equality duties4
Statutory Equality Duties Impact Test guidance
No
Economic impacts
Competition Competition Assessment Impact Test guidance No 19
Small firms Small Firms Impact Test guidance No 19
Environmental impacts
Greenhouse gas assessment Greenhouse Gas Assessment Impact Test guidance No 19
Wider environmental issues Wider Environmental Issues Impact Test guidance No 19
Social impacts
Health and well-being Health and Well-being Impact Test guidance No
Human rights Human Rights Impact Test guidance No
Justice system Justice Impact Test guidance No
Rural proofing Rural Proofing Impact Test guidance No
Sustainable development
Sustainable Development Impact Test guidance
No
4 Race, disability and gender Impact assessments are statutory requirements for relevant policies. Equality statutory requirements will be
expanded 2011, once the Equality Bill comes into force. Statutory equality duties part of the Equality Bill apply to GB only. The Toolkit provides advice on statutory equality duties for public authorities with a remit in Northern Ireland.

8
Evidence Base (for summary sheets) – Notes Use this space to set out the relevant references, evidence, analysis and detailed narrative from which you have generated your policy options or proposal. Please fill in References section.
References
Include the links to relevant legislation and publications, such as public impact assessment of earlier stages (e.g. Consultation, Final, Enactment).
Evidence Base
Please see spreadsheet attached for full time series of costs.
Annual profile of monetised costs and benefits* - (£m) constant prices
Y0 Y1 Y2 Y3 Y4 Y5 Y6 Y7 Y8 Y9
Transition costs 0 0 0 0 0 0 0 0 0 0
Annual recurring cost 0 0 0 0 0.05 0.05 0.05 0.05 0.05 0.05
Total annual costs 0 0 0 0 0.05 0.05 0.05 0.05 0.05 0.05
Transition benefits 0 0 0 0 0 0 0 0 0 0
Annual recurring benefits 0 0 0 0 0 0 0 0 0 0
Total annual benefits 0 0 0 0 0 0 0 0 0 0
* For non-monetised benefits please see summary pages and main evidence base section
Microsoft Office Excel Worksheet
No. Legislation or publication
1 Electricity Market Reform: Consultation Document, DECC (2010)
https://www.gov.uk/government/uploads/system/uploads/attachment_data/file/42636/1041-electricity-market-reform-condoc.pdf
2 Electricity Market Reform: Analysis of policy options, Redpoint (2010)
https://www.gov.uk/government/uploads/system/uploads/attachment_data/file/42638/1043-emr-analysis-policy-options.pdf
3
4

9
Evidence Base (for summary sheets) Climate Change is a global market failure. In response to this the UK has set itself emission reductions targets and whilst the UK is on target to reduce its greenhouse emissions in 2020 by 34% on 1990 levels, in line with carbon budgets and the EU target, the longer term goals are more challenging. For example, in 2008, the Climate Change Act set a target to reduce greenhouse gas emissions by at least 80% by 2050, compared to 1990 levels.
The electricity system needs to be substantially decarbonised through the 2020s, particularly if it is to play its part in decarbonising the heat and transport sectors in the 2030s and beyond. See for example, the fourth carbon budget report from Committee on Climate Change (published December 20105). Their analysis suggests the need for 30-40GW of low-carbon capacity to be built during the 2020s to replace ageing capacity and meet demand growth.
The main focus of this Impact Assessment is to set out the analysis of the impacts of introducing an EPS against a ‘do nothing’ option. While the proposed designs for the introduction of an EPS formed part of the Electricity Market Reform (EMR) , the other EMR policies (please see details below) are not considered in depth here6. As explained below the EPS does not impact on modelled trajectories for investment in electricity generation either with or without EMR policies. This limits the need to consider the interaction between the EPS and other EMR policies7. Further, this Impact Assessment assesses the policy decisions regarding the introduction of the EPS that have been made up to this point and also highlight areas which are to be developed in the future subject to further analysis. For example, policy decisions have been made to grandfather the EPS, but the question of the length of time that the EPS will be grandfathered are detailed in the Grandfathering Period of the Emissions Performance Standard Impact Assessment . Where there are policy decisions that have not been made at this time, assumptions have been made for the purposes of this analysis, which will be revisited in future Impact Assessments.
The appraisal period is from the 2014, when the proposed EPS would be introduced, to 2030.
Background The Coalition Programme for Government stated that the Government would establish an Emissions Performance Standard (EPS) “that will prevent coal-fired power stations from being built unless they are equipped with sufficient carbon capture and storage to meet the emissions performance standard.”
As the policy developed, it was decided that the EPS would cover all new fossil fuel plant, including gas plants from the outset. This will provide a degree of certainty for investors as they will know from the date the policy is implemented what regulatory emissions limit they will face, and it is designed to reduce any perceived risk that an EPS of an unknown level is introduced at a later date (see also section on Grandfathering). The proposed designs for the introduction of an EPS formed part of the Electricity Market Reform (EMR) consultation, published in December 2010. The Government’s proposals for reform of the electricity market represent a coherent and complementary package designed to ensure the security of future electricity supply and the decarbonisation of electricity generation, at least cost. The package of measures proposed in the EMR consultation included the introduction of a Carbon Price Floor. The Carbon Price Floor was subject to a separate consultation lead by HMT8. Following this, Budget 2011 announced that from April 2013 a Carbon Price Floor would be introduced to the power sector in the UK.
Rationale The objective of the EPS is to ensure that while fossil fuel-fired electricity generation continues to make an important contribution to security of supply, it does so in a manner consistent with the UK’s decarbonisation objectives. The EPS will act as a regulatory backstop to limit how much carbon new
5 http://www.theccc.org.uk/reports/fourth-carbon-budget
6 The other EMR policies are classified as Environmental Taxation and so are analysed seperately
7 Other EMR policies will be analysed separately
8 http://www.hm-treasury.gov.uk/consult_carbon_price_support.htm

10
fossil fuel plants can emit, and sit alongside the other decarbonisation policies set out in the accompanying White Paper. For example, if measures such as the EU ETS and other EMR policies do not result in a reduction in emissions, the EPS will ensure that each new plant does not emit more than the limit. The EPS will provide further clarity on the regulatory environment for fossil fuel power stations, building on the Government’s current policy. Currently new coal-fired power stations are required to be constructed with a full CCS chain fitted on at least 300MW (net) of their generating capacity and be carbon capture ready on the rest, while all new combustion plant9 at or over 300MW must be carbon capture ready (CCR) on the whole plant, i.e. they must demonstrate that there are no economic or technical barriers to retrofitting CCS. In England and Wales these requirements are contained in the National Policy Statements. These requirements do not, however provide clarity in respect to the operating regime of these plant, nor do they provide any emission limits. An EPS goes a stage further, and ensures that not only are new coal plant built with CCS but that it is operated in accordance with emissions requirements. Further, the requirement for 300MW CCS applies irrespective of the size of the plant, i.e. the larger the plant the smaller the proportion required to have CCS. Where it applies, an EPS will therefore ensure that total annual emissions from new plant are consistent with the EPS requirements, regardless of their total size. Further, the EPS will complement the economic signals provided by the carbon price floor and low carbon support mechanism. Initially it will support the requirements set out in the National Policy Statements, and in the longer term could be used to give a clear regulatory signal on emission reductions to back up the economic signals provided for through the rest of EMR. In the future it may be appropriate to use the EPS in a different way, for example to require CCS on new plant once the commercial and technical viability of CCS is better understood (in line with grandfathering principles). Introduction of an EPS at this stage provides for this opportunity, and the Government will review the mechanism in line with the decarbonisation reports required under the 2010 Energy Act. The Energy and Climate Change Select Committee have previously stated that the introduction of the EPS proposed in the EMR consultation could create uncertainty among investors, without promoting decarbonisation. However, Government believes that the introduction of the measure now will provide certainty on emission limits for new plant built under this framework. An alternative of ‘do nothing’ leaves open uncertainty on whether Government will introduce an EPS at a later stage which could impact plant.
Overall, there were differing views to the responses on the EPS questions posed in the EMR consultation, with some stakeholders in support of the introduction of the policy, while others were in opposition. Most stakeholders agreed on the importance of grandfathering as a means of ensuring investor confidence.
Current market arrangements Current market arrangements do not restrict the amount of carbon dioxide released into the atmosphere from sources of electricity generation. However there are existing and confirmed policies which make polluters pay for their emissions of carbon dioxide and certain other greenhouse gases. The EU ETS is the primary EU wide policy driving decarbonisation across a number of sectors in the UK economy, including the power sector. It is a cap and trade system, which creates a Europe wide price for carbon. While the EU ETS does set a cap for emissions, the limit is for all sectors within scope and so does not directly restrict emissions from the electricity generation. In addition to this electricity generators, along with other emitters, can buy allowances to cover their emissions instead of reducing their emissions. In addition to the EU ETS, Budget 2011 announced that from April 2013 a Carbon Price Floor would be introduced to the power sector in the UK. The floor will start at around £16 per tonne of carbon dioxide and follow a linear path to target £30/tCO2 in 2020 (2009 prices).
9 Of a type covered by the EU Large Combustion Plant Directive

11
Options considered
Baseline/ ‘do nothing’ option
In order to analyse the impacts of the EPS designs considered in the White Paper, the instrument designs were assessed against a “business as usual” baseline scenario where there are no additional policies that impact on the electricity market other than those already existing or confirmed, e.g. EU ETS, Carbon Price Floor, and the Renewables Obligation. This baseline was modelled by Redpoint out to 2030 so that it would meet a 29% share of renewable electricity on the system in 2020, rising to 35% in 2030, but no other explicit constraint was placed on this scenario. For example, Redpoint did not impose on the baseline the need to meet any indicative carbon emission intensity targets, nor did the baseline include any of the other EMR policies. The modelling is based on DECC’s central assumptions around fossil fuel prices10 and Mott MacDonald’s assumptions on the cost of electricity generation technologies11. Please refer to Annex 2 for more detail. Redpoint’s model of the electricity sector is an economic investment decision model in which decisions on build rates of new electricity plant by technology and dispatch decisions are made within-model, based on the current and expected economics of generation technologies and prevailing market conditions. Details of the general analytical approach taken by Redpoint in their modelling are set out in the report published alongside the EMR consultation document12. The results from Redpoint’s baseline modelling indicated that no new unabated coal plants would be built going forward. This is in accordance with consenting policy and the National Policy Statements. The results also suggested that only coal capacity as part of the CCS Commercialisation Project will come forward and that there will be some new CCGT gas plants (which will all be Carbon Capture Ready); a total of 12GW between 2014 and 2030. It should be noted as with all modelling, the output is dependent on the assumptions and methodology used.
Details of the proposed EPS policy The design principles of the EPS include:
application to individual fossil fuel-fired plants larger than 50MW from 2014;
setting an annual limit on the total amount of carbon dioxide permitted, equivalent to a per unit of electricity emissions limit for a plant operating at baseload (which is assumed to be 85% for the purposes of the analysis in this Impact Assessment);
application to new power stations, or existing plants that undergo significant life extensions or upgrades only13;
consistency with the UK CCS Commercialisation Programme covering the full range of approaches to carbon capture.
The annual limit on the total amount of carbon dioxide permitted, as set out in the second design principle above, will be dependent on the size of plant in question. The annual limit permitted for an individual plant will be equal to the amount of carbon dioxide emitted from a plant of the same size that operates at baseload and has an emissions intensity factor equal to that set out in the EPS. For example if the EPS were to be set at 450gCO2/kWh, then the annual limit permitted for a 1GW combustion plant would be equal to the amount of carbon dioxide emitted from a 1GW plant that ran at baseload for a year and had an emissions intensity factor of 450gCO2/kWh (see calculation in Table 2 below). Two options were proposed for the level of the EPS in the Electricity Market Reform consultation document:
10
http://webarchive.nationalarchives.gov.uk/20130106105028/http:/www.decc.gov.uk/en/content/cms/about/ec_social_res/analyt
ic_projs/en_emis_projs/en_emis_projs.aspx#2010-projections Annex F (2010) 11
https://www.gov.uk/government/publications/uk-electricity-generation-costs-mott-macdonald-update-2010 12
https://www.gov.uk/government/uploads/system/uploads/attachment_data/file/42638/1043-emr-analysis-policy-options.pdf 13
This does not include Retrofit of CCS or upgrades to meet requirements under European directives (specifically the
Industrial Emissions Directive)

12
Option 1 An EPS as an annual limit on the amount of carbon dioxide a plant can emit, equivalent to 600gCO2/kWh for plant operating at baseload.
This level is consistent with demonstrating CCS on a new, supercritical coal fired power station, which are typically sized at around 1600MW (gross). It would allow stations to demonstrate CCS on around a quarter of their capacity (300MW net, around 400MW gross) if it were to run at baseload. This is consistent with the National Policy Statements, yet it goes further by ensuring that the CCS capacity would be utilised sufficiently over the year to meet the emission limit or else the generator would have to limit its load factor if it wished to operate the plant unabated.
Option 2 An EPS as an annual limit on the amount of carbon dioxide a plant can emit equivalent to 450gCO2/kWh for plant operating at baseload. This option would require new plant to meet the tighter standard. For example, it would require a new, supercritical coal plant, sized at around 1600MW (gross) to use CCS on around 700MW (gross) of its capacity, around 40%, if it were to run at baseload. Again, this EPS design option necessitates a sufficient utilisation of the CCS technology in order to meet the emissions limit or the generator would have to limit its load factor if it wished to operate the plant unabated.
Putting the EPS emission limit options into context The tables presented in the section present emissions intensity factors and total emissions for illustrative
new fossil fuel plants, as well as some sensitivity analysis around load factors14
. This is to provide
context for the EPS design options set out above. Table 1 – emission intensity of new fossil fuel generation
Gas (CCGT) Gas (OCGT)
Coal (ASC)
15
Coal (ASC with CCS) - 90% CO2 capture
Net Thermal Efficiency16
52% 40% 39% 28%
Fuel Emission Factor 0.184 0.184 0.308 0.308
Emissions g/kWh 353.8 460.0 789.7 110.0
Net thermal efficiency is the ratio of the net electricity generated by a unit to the thermal energy of the fuel consumed during the same period by the same unit. The ratio of net thermal efficiency and the fuel emission factor give the emissions intensity of the plant. This shows that the emissions intensity factor of a plant is dependent on the efficiency of that plant and emissions factor of the fuel it uses to generate electricity. Table 2 – Comparison of the emissions of new 1GW fossil fuel plants of different technologies with the constraints imposed by the two EPS options
14
Source of all data in tables: DECC (2010) Digest of UK Energy Statistics
Mott MacDonald (2010) UK Electricity Generation Cost Update 15
Advanced Supercritical 16
These are considered best efficiencies
13
Gas (CCGT)
Gas (OCGT)
Coal (ASC)
Coal (ASC fully fitted with CCS) - 90% CO2 capture
EPS equivalent to 450g/kWh
EPA Equivalent to 600g/kWh
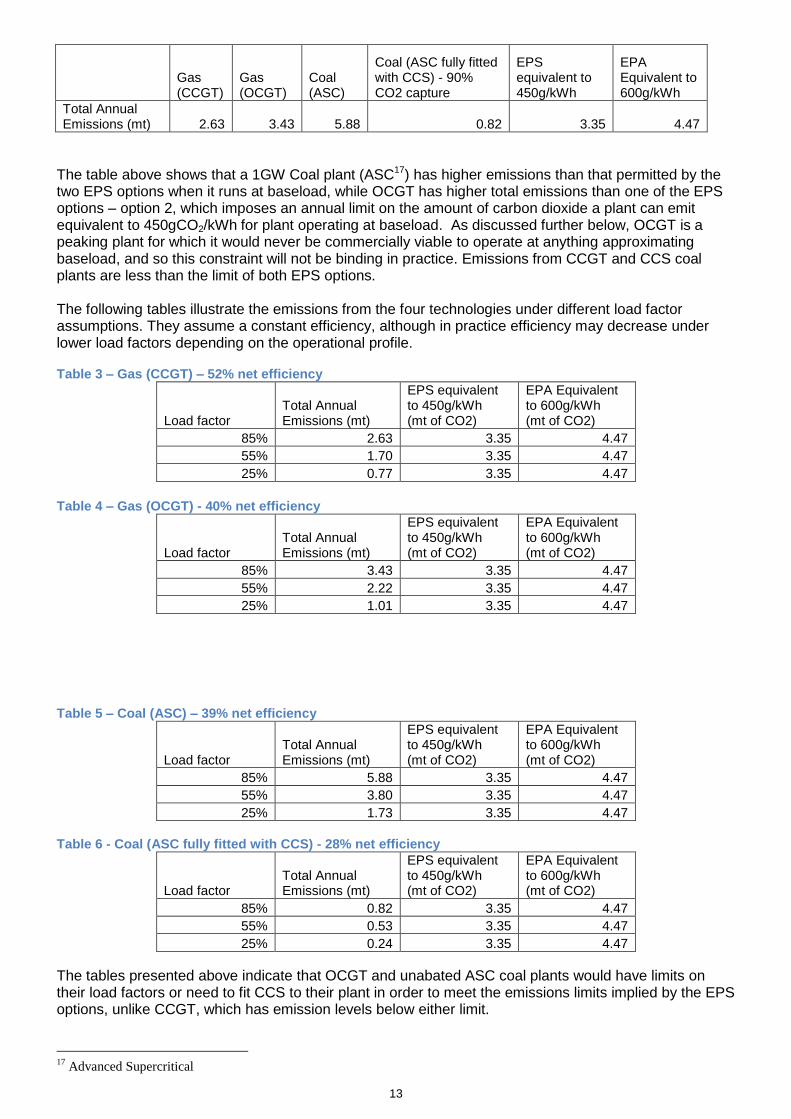
Total Annual Emissions (mt) 2.63 3.43 5.88 0.82 3.35 4.47
The table above shows that a 1GW Coal plant (ASC17) has higher emissions than that permitted by the two EPS options when it runs at baseload, while OCGT has higher total emissions than one of the EPS options – option 2, which imposes an annual limit on the amount of carbon dioxide a plant can emit equivalent to 450gCO2/kWh for plant operating at baseload. As discussed further below, OCGT is a peaking plant for which it would never be commercially viable to operate at anything approximating baseload, and so this constraint will not be binding in practice. Emissions from CCGT and CCS coal plants are less than the limit of both EPS options. The following tables illustrate the emissions from the four technologies under different load factor assumptions. They assume a constant efficiency, although in practice efficiency may decrease under lower load factors depending on the operational profile. Table 3 – Gas (CCGT) – 52% net efficiency
Load factor Total Annual Emissions (mt)
EPS equivalent to 450g/kWh (mt of CO2)
EPA Equivalent to 600g/kWh (mt of CO2)
85% 2.63 3.35 4.47
55% 1.70 3.35 4.47
25% 0.77 3.35 4.47
Table 4 – Gas (OCGT) - 40% net efficiency
Load factor Total Annual Emissions (mt)
EPS equivalent to 450g/kWh (mt of CO2)
EPA Equivalent to 600g/kWh (mt of CO2)
85% 3.43 3.35 4.47
55% 2.22 3.35 4.47
25% 1.01 3.35 4.47
Table 5 – Coal (ASC) – 39% net efficiency
Load factor Total Annual Emissions (mt)
EPS equivalent to 450g/kWh (mt of CO2)
EPA Equivalent to 600g/kWh (mt of CO2)
85% 5.88 3.35 4.47
55% 3.80 3.35 4.47
25% 1.73 3.35 4.47
Table 6 - Coal (ASC fully fitted with CCS) - 28% net efficiency
Load factor Total Annual Emissions (mt)
EPS equivalent to 450g/kWh (mt of CO2)
EPA Equivalent to 600g/kWh (mt of CO2)
85% 0.82 3.35 4.47
55% 0.53 3.35 4.47
25% 0.24 3.35 4.47
The tables presented above indicate that OCGT and unabated ASC coal plants would have limits on their load factors or need to fit CCS to their plant in order to meet the emissions limits implied by the EPS options, unlike CCGT, which has emission levels below either limit.
17
Advanced Supercritical

14
Further details on scope The EPS options described above were proposed to be technology neutral. However there were some issues considered in the consultation and some issues raised by responses to the consultation. It was stated in the consultation document that the EPS needs to be designed to support the burning and co-firing of biomass, and a question was asked as to how biomass should be treated for the purpose of meeting the EPS. Following the consultation responses, it has been decided that the EPS should only cover emissions from fossil fuels, therefore ensuring that dedicated biomass, or co-firing, is not discouraged as it plays an important role in providing a renewable source of energy. This approach is consistent with that used by other polices such the Carbon Reduction Commitment (CRC) Energy Efficiency Scheme where biomass is zero-rated. Further, responses to the consultation also highlighted the risks an EPS places on combined heat and power (CHP) plant, and the Government will be considering how to account for emissions from such plant (e.g. if they generate heat, as opposed to electricity) before introducing any legislation (intended in spring 2012). For the purposes of this IA it is assumed that the EPS will not impact CHP investments. The result is that new fossil fuel plant (principally coal plants and gas plants) will fall under the scope of the proposed EPS policy and be subject to the same emissions limit.
Security of Supply Around 12GW of fossil fuel capacity will be closing by 2016 as a result of the EU Large Combustion Plant Directive, coupled with additional retirements of nuclear this decade (up to 9GW). The UK needs to ensure sufficient generation is built to accommodate this. While significant amounts will come from low carbon (including renewables, new nuclear and CCS), there will also be an important role for new gas plant over the next few years, including CCGT. Further, as more renewables enter onto the system, it will be important to have sufficient back up generation and sufficient capacity to providing ‘peaking’ services to accommodate increased amounts of intermittent generation. Such backup and peaking can be provided in a number of ways (e.g. demand-side response, pumped storage, and existing fossil fuel power stations). Open Cycle Gas Turbines (OGCT) are one of the technologies that are adept at providing such services. New fossil fuel plant providing peaking services generally have higher emissions than plant operating at higher load factors – OCGT generally has an emissions intensity greater than 450g/kWh18. Whilst the EPS will apply to such plant, as an annual limit based on a high-load factor, it will ensure that it does not constrain those plant which may have a higher emissions intensity, but do not operate for long periods of the year or as peaking plant. As seen in Table 4 above, an OCGT plant would need to operate at a load factor of just under 85% to hit the EPS level – existing OCGTs are estimated to have annual load factors of less than 1% between now and 203019. Further, the Government intends to provide for the Secretary of State to make exceptions to maintain energy security (e.g. limited exceptions in supply emergencies). For example, it is thought that CCS technology could have a parasitic load on a power station of around 20%. Exemptions, should they be provided, would allow for CCS equipped plant to switch off their capture technology and have a greater net electricity output, but without being penalised for the increase in emissions which could breach the limit set by the EPS.
Grandfathering The consultation document proposed that the EPS level should be grandfathered for each new plant at ‘point of consent’ for the economic life of the plant. Grandfathering provides clarity to developers over the emissions limits that their plant will face for a set period of time, and hence clarity over what load factors they can run their plant at during that time, or the
18
New OCGT have a net efficiency of 40%, resulting in an emission intensity of 457g/kWh as set out in Table 1
Source: DECC (2010) Digest of UK Energy Statistics
Mott MacDonald (2010) UK Electricity Generation Cost Update 19
Source: Redpoint

15
technology solutions they will need to use (e.g. CCS or biomass) during that time. This clarity will help developers when making a decision of whether or not to invest in the electricity market. This issue received mixed views as part of the consultation, but was strongly supported by a significant proportion of industry as an essential tool in enabling the new gas (CCGT) generation needed to come forward over the next few years to maintain security of supply. However, some respondents were critical that the policy could perpetuate the relative attractiveness of unabated gas over other forms of low carbon, notably fossil fuel with CCS, and of how long it would remain on the system. Following careful consideration of the arguments, it has been decided that the principle of grandfathering will be implemented. Other mechanisms are designed to incentivise investment in low carbon technologies (including fossil fuels with CCS), and creating too much uncertainty with the EPS at this stage could discourage investment. The questions of the length of time that the EPS will be grandfathered and the time period in which generators have to take advantage of the provision are still to be decided. Further analysis of the impacts of the options for grandfathering and an informal consultation will be carried out to develop the policy in this area. The analysis will take into account more than just modelling outputs as it is important that this aspect of the policy is considered carefully and considers all information; setting an ill-informed limit on the length of time an EPS is grandfathered could lead to unnecessary load factor risk for developers when considering whether to invest. Following this an Impact Assessment will be developed to update the analysis presented here before any legislation is introduced (expected spring 2012). It should be noted that in the development of these elements of an EPS the Government is minded to set the period for which the EPS is grandfathered to a period sufficient to give enough certainty so as not to deter the investment needed in new gas over the next few years, whilst not locking in unabated fossil generation far into the future. Feedback and some high level preliminary analysis suggest that investment decisions in CCGT are based on expectations over the next 20 years. Analysis on options for grandfathering the EPS is detailed in the Grandfathering Period of the Emissions Performance Standard Impact Assessment. The assumption used in this impact assessment is that all new fossil fuel plants that become operational during the period considered here would be grandfathered. Furthermore, the period for which each plant has certainty over the emissions limit they face (i.e. the grandfathering period) is assumed not to be time-limited for this analysis. This assumption is considered reasonable as this approach to the modelling is consistent with the Government’s objective that grandfathering ensures developers have enough certainty to invest. Given that preliminary analysis suggests that investment decisions are based on 20 years into the future and the appraisal period for this IA is 17 years, it is anticipated that analysing an EPS that is grandfathered without a time limit will produce the same results as analysing an EPS that is grandfathered for a period that is sufficient to provide enough certainty so as not to deter investment that would come about under the business as usual baseline.
Impacts of the policy options The policy will have an impact if it changes a generator’s decision about whether to invest in an unabated plant compared to what they would do in the absence of the policy. And if a generator does decide to invest, the policy will have an impact if it changes the generators’ ability to run at a load factor that is dictated by the wholesale electricity market.
16
The baseline20 modelled to 2030 by Redpoint indicates that no new unabated coal plants would be built going forward (this is in accordance with consenting policy and the draft National Policy Statements) and that only coal capacity as part of the CCS Commercialisation Project will come forward. The model baseline also suggests that there will be some 12GW of new CCGT gas plants. Neither of the options for the EPS as set out above would have an impact on any of the new CCGT gas capacity, as the emissions limit of the EPS options are higher than the emissions factors of CCGT gas plants that we would expect to see in the future21. This is based on the assumption that the EPS is grandfathered without a time-limit22, as neither of the levels considered in this IA limits the operation of gas plants. In summary, the analysis suggests that the proposed options for the EPS do not have an effect on investment in new plants or their load factors compared to the baseline modelled by Redpoint. It should be noted that the analysis presented here does not capture the impacts of any perceptions of the policy, only the impact of the fundamentals of the policy designs. Hence the assumption that all new fossil fuel plants are grandfathered for a period that is sufficient to provide enough certainty so as not to deter investment is important to remember. In response to the EMR consultation, most stakeholders agreed on the importance of grandfathering the EPS as a means of ensuring investor confidence. There is also uncertainty surrounding the modelling results, as with any modelling. So while the modelled baseline suggests that no new unabated coal comes onto the system, the effect of the EPS will be to act as a back-stop to ensure that any new carbon emitting generating capacity that may come forward is run in such as way that complements the UK’s decarbonisation targets. Given this, the incentive for market entry for coal plants was considered despite the analysis suggesting that the only coal plants that would be built are those associated with the CCS Demonstration Programme.
Incentives for market entry and exit
If an EPS equivalent to 600gCO2/kWh for a plant operating at baseload were to be grandfathered for new fossil fuel plants, there will be no change in the incentives for market entry. This is because this level of EPS is consistent with demonstrating 300MW of CCS on a typically sized new, supercritical coal fired power station. This is consistent with the draft National Policy Statements.
On the other hand, the introduction of an EPS equivalent to 450gCO2/kWh for a plant operating at baseload may change the incentives for coal generators to enter the market as they would need a sufficient proportion of their emissions to be captured by CCS. This is true whether the policy is grandfathered or not. The additional amount of investment needed to construct and operate CCS technology above 300MW may deter entry.
Adding clarity and certainty Significant upgrades and life extensions The National Policy Statements will require that a “significant extension” to existing coal-fired power stations will trigger a requirement that the station demonstrate 300MW CCS. This will prevent developers circumnavigating the CCS requirement by building additional (or replacement) capacity on existing power stations.23
20
Used to illustrate a state of the world where there are no additional policies that impact on the electricity market other than
those already existing or confirmed, e.g. Carbon Price Floor. 21
Emissions factors of new CCGT gas plants are estimated to be 350gCO2/kWh, as set out in Table 1 22
As set out in the “Grandfathering” section, the assumption of grandfathering that is not time-limited is considered to be
consistent with an EPS that is grandfathered for a length of time for which the EPS level that is sufficient to provide enough
certainty to invest 23
EN-1 Overarching National Policy Statement para 4.7.5

17
Nevertheless, it is possible that an existing coal power station could undertake works which would significantly extend its life in some way that would not be caught by the Planning Act regime. The introduction of regulation will allow for very clearly defined situations that would trigger an existing plant coming under an carbon reduction framework (although this will specifically exclude upgrades to meet European environmental standards, those needed to facilitate CCS and those need to increase the use of biomass). Effect on the cost of capital Not to proceed with an EPS leaves open the question about whether it will be introduced at a later stage, and whether it will affect an investor’s assets. If it is not introduced now, it may also be perceived that the later an EPS regime is introduced, the more likely investors may be concerned about pressure to include measures such as retrospective effect on existing plant. Introduction of the mechanism now, with clarity on the scope of this policy intervention and with safe-guards for investment (grandfathering and level) could provide more certainty. Should introduction of the measure now provided increase certainty, one way this may be considered by investors is through a reduction in their required rate of return for a project. The cost of the policy is extremely small when considered against the investment cost of fossil fuel plant, approximately £5,000 compared against approximately £600 million for a CCGT and £2.5 billion for an unabated coal plant24. Given this, any reduction in investment costs would only need to be very small to more than offset the costs of the policy. However, quantifying the possible benefit of reducing regulatory uncertainty by introducing an EPS is inherently uncertain. Investors would need to perceive the introduction of an EPS as providing more certainty than no EPS.
Interactions with other EMR policies The proposed introduction of an EPS is part of the EMR set of policy reforms, as set out in the “Background” section, but this policy has so far been appraised in isolation in this IA. DECC’s own analysis as well as quantitative modelling by Redpoint consultants for DECC suggest that the EPS as currently proposed will have no interactions with low carbon incentives or security of supply option policies. In other words, the inclusion of EPS in the package modelling does not have any impact on the results. This is because the analysis suggests that any new fossil fuel plant to be built will fall below the EPS emission levels as proposed in this IA.
Cost to business of administering an EPS The cost of setting up the EPS depends on the final design details of the EPS, so it can’t be estimated in detail at this time, though full costs will be detailed in any final stage Impact Assessment accompanying legislation to be laid in Parliament. However, the cost to business has been estimated and consists of the following two other elements: Firstly, an initial regulatory exchange will be required to establish the EPS value for each new fossil fuel-fired plant individually. An initial estimate provided by the Environment Agency of the cost of this to each plant is approximately £5,000 in current prices. Using Redpoint modelling results it is estimated that 12 new CCGT gas plants will become operational by 2030. The NPV cost to business is estimated at £36,000.
24
Parsons Brinckerhoff (2011) Electricity Generation Cost Model – 2011 update
https://www.gov.uk/government/uploads/system/uploads/attachment_data/file/65714/2127-electricity-generation-cost-model-
2011.pdf

18
Secondly, it is expected that the operating costs of the EPS will be directly paid for by operators. The Environment Agency estimates that the cost of a central body administering the EPS could be approximately £50,000 per annum, based on staff costs, IT costs and enforcement costs (applicable to both EPS design options). Staff costs are estimated to be approximately £20,000. This would cover 0.1 FTE Grade 5 and 0.1 FTE Grade 6 to carry out calculations and act as points of contact for enquiries25. IT and website costs were estimated to be around £10,000, while enforcement (or non-respondent action) costs were estimated at around £20,000. These enforcement (or non-respondent action) cost estimates are based on one or two non-compliant sites per annum receiving enforcement notices and issuance/receipt of monetary fines i.e. assuming minimal amount of legal staff input. This £50,000 estimate is based the Environment Agency’s experience of administering the EU ETS and is for the cost of administering an EPS in England and Wales only. Administering the EPS in Scotland may increase this cost and if so will be taken into account in the final stage IA. Over the period to 2014-2030, the £50,000 estimated annual cost leads to an NPV cost to business of £570,000. There should be no further costs if the EPS is to be grandfathered, as the monitoring is already covered by the EU ETS. Combining the costs from the initial regulatory exchange and the EPS operating costs, the best estimate of the total net cost to business at the present time is therefore £606,000 (NPV). Assessed over the 17 year appraisal period (2014-2030), this leads to an estimated regulatory ‘in’ of £46,000 under the one-in, one-out framework. The exact value of any ‘in’ that may need offsetting will be determined in a Final Stage IA prior to legislation being introduced following publication of the White Paper. A micro-business exemption for this policy will not be required as no business affected by EPS are assumed to have fewer than 10 employees due to the nature of conventional combustion plant electricity generation business
Bills As previously explained, it is not envisaged that the introduction of an EPS will change the pattern of new electricity plant build. Also, the EPS assessed would not impact on the operation pattern of the existing electricity generation plant fleet. Therefore, there is no reason to expect that wholesale electricity prices will change as a result of the introduction of EPS and no reason to expect any impact on bills. In theory, there could be a very small indirect impact on electricity bills if the cost of setting up and administering the EPS were passed through from business to electricity consumers. However, even if this was the case (and it has yet to be established how the cost of setting up and administering the EPS will be funded) the costs are sufficiently small compared to the number of consumers so that any impact on average bills would be negligible.
Fossil fuel price sensitivities The analysis presented above was carried out under the assumption of DECC central fossil fuel prices. However the analysis does not differ under either the DECC low or high fossil fuel price scenarios. This is because under both these sensitivities, the modelling for the baseline suggests that there will be no new unabated coal plants being built going forward (this is in accordance with consenting policy and the National Policy Statements). While there are no new gas plants built under the high fossil fuel price baseline scenario, the new CCGT gas plants built under the low fossil fuel price baseline scenario would not be affected by either of the EPS options as their emissions are lower than the EPS level. The modelling also suggests that under the high fossil fuel price baseline scenario, a small amount of commercial scale CCS is built. However these would not be affected by either of the EPS options as their emissions will be lower than the EPS level.
25
However EA noted that the estimate of staff costs would increase slightly if the operational work were to be financed
through charges as some finance staff costs would be added for payment/exchequer services.

19
Specific Impact Tests The analysis presented in this IA suggests that there will be no impact on either generators’ decisions to invest in plants, or generators’ operation decisions compared to business as usual baseline. Given this it is considered that the policy does not have any economic effects. Similarly, as the analysis suggests that the policies will not lead to a change in electricity generation compared to the business as usual baseline, at this time it is felt that there are no environmental impacts of the policy options presented.
Preferred option The quantified negative NPV for both EPS options is very small. There are unquantified benefits of providing a clear regulatory approach to managing emissions from new plant, to provide fossil fuel plants with regulatory certainty, and provide a framework for future action. The preferred option is Option 2, introducing an EPS as an annual limit on the amount of CO2 a plant can emit, equivalent to 450gCO2/kWh for plant operating at baseload.
Annexes
Annex 1: Post Implementation Review (PIR) Plan
Basis of the review: [The basis of the review could be statutory (forming part of the legislation), it could be to review existing
policy or there could be a political commitment to review
The policy will be reviewed in line with decarbonisation reporting under the Energy Act 2010. This is required every three years.
Review objective: [Is it intended as a proportionate check that regulation is operating as expected to tackle the problem of
concern?; or as a wider exploration of the policy approach taken?; or as a link from policy objective to outcome?]
The review will enable to UK to consider whether the policy is meeting its objectives
Review approach and rationale: [e.g. describe here the review approach (in-depth evaluation, scope review of monitoring
data, scan of stakeholder views, etc.) and the rationale that made choosing such an approach]
Ongoing assessment of the degree to which the policy meets its objective.
Baseline: [The current (baseline) position against which the change introduced by the legislation can be measured]
Measured against an assumed baseline where the EPS was not introduced
Success criteria: [Criteria showing achievement of the policy objectives as set out in the final impact assessment; criteria for
modifying or replacing the policy if it does not achieve its objectives]
The policy meets its objective.
Monitoring information arrangements: [Provide further details of the planned/existing arrangements in place that will
allow a systematic collection systematic collection of monitoring information for future policy review]
The central body that administers the EPS will collect and monitor information.
Reasons for not planning a PIR: [If there is no plan to do a PIR please provide reasons here]

20
Annex 2: Redpoint modelling for the EMR White Paper
For the EMR consultation, DECC commissioned Redpoint Energy to analyse policy options for EMR reform. The findings of their analysis were published in a report accompanying the EMR consultation document. This report also sets out Redpoint’s approach to modelling the electricity system and key assumptions used in the modelling. DECC subsequently commissioned Redpoint to update the modelling for the consultation to reflect policy developments and changes to DECC assumptions around some electricity generation technologies. For example, the Carbon Price Floor policy was included in the baseline alongside other current polices like the Renewable Obligation. Redpoint’s model of the electricity sector is an economic investment decision model in which decisions on build rates of new electricity plant by technology and dispatch decisions are made within-model, based on the current and expected economics of generation technologies and prevailing market conditions. As such, the outcome of the modelling is an assessment of what new electricity plant will be built and when, according to plant economics and the policy environment. Details of the general analytical approach taken by Redpoint in their modelling are set out in the report published alongside the EMR consultation document26. The baseline scenario used in this Impact Assessment was modelled so that it would meet a share of renewable electricity on the system of 29% in 2020 and 35% in 2030, on the assumption that the Renewables Obligation policy would deliver these indicative renewables targets. No further explicit constraint was placed on the modelling for this scenario. For example, Redpoint did not impose on the baseline to meet any indicative carbon emission intensity targets, nor does it include other EMR policies. The modelling is based on DECC’s central assumptions around fossil fuel prices and Mott MacDonald’s assumptions on the cost of electricity generation technologies27. The results from the baseline scenario modelling (using central fossil fuel price scenarios) indicate that no new unabated coal plants would be built going forward, as seen in figure 1 below. As stressed in this IA, this is in accordance with consenting policy and the National Policy Statements. The modelling results also suggested that only coal capacity as part of the CCS Demonstration Project will come forward and that there will be some new CCGT gas plants (which will all be Carbon Capture Ready); while a total of 12GW of CCGT gas plants become operational between 2014 and 2030. Figure 1: Cumulative new electricity generation capacity build 2014-2030, baseline scenario
26
https://www.gov.uk/government/uploads/system/uploads/attachment_data/file/42638/1043-emr-analysis-policy-options.pdf 27
https://www.gov.uk/government/publications/uk-electricity-generation-costs-mott-macdonald-update-2010
-
5,000
10,000
15,000
20,000
25,000
Gas CCS Coal Nuclear Renewables
MW
New capacity under baseline
21
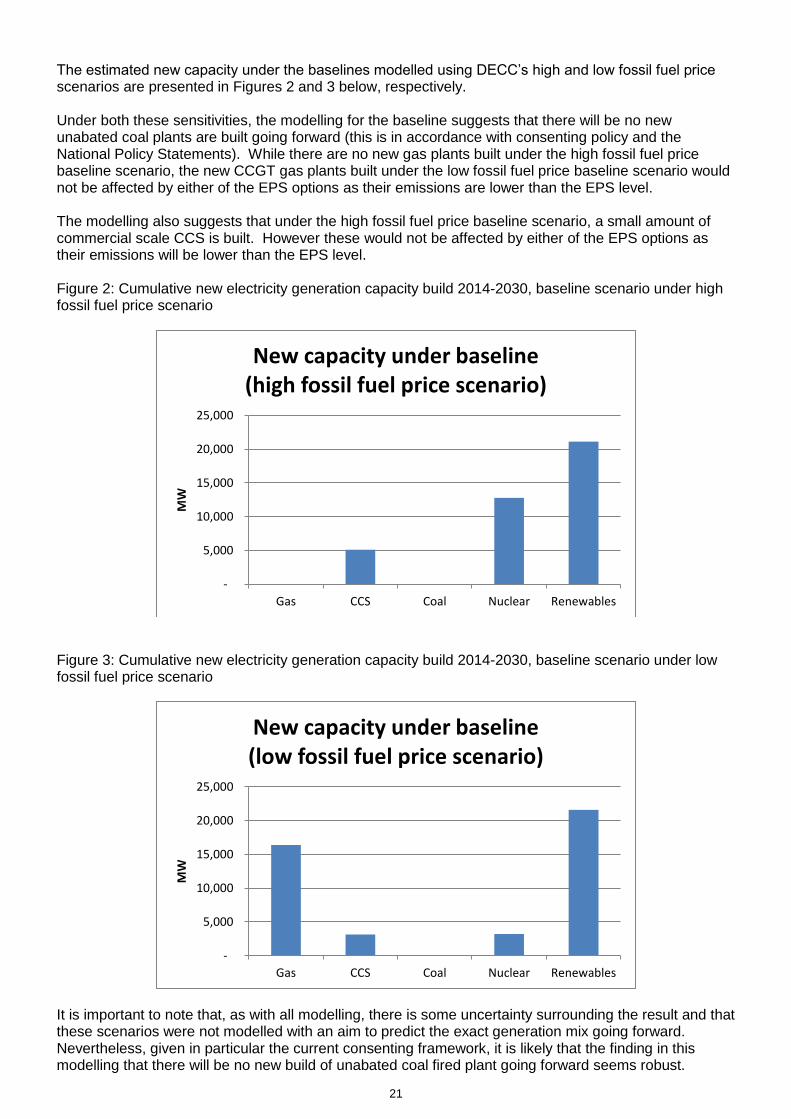
The estimated new capacity under the baselines modelled using DECC’s high and low fossil fuel price scenarios are presented in Figures 2 and 3 below, respectively. Under both these sensitivities, the modelling for the baseline suggests that there will be no new unabated coal plants are built going forward (this is in accordance with consenting policy and the National Policy Statements). While there are no new gas plants built under the high fossil fuel price baseline scenario, the new CCGT gas plants built under the low fossil fuel price baseline scenario would not be affected by either of the EPS options as their emissions are lower than the EPS level. The modelling also suggests that under the high fossil fuel price baseline scenario, a small amount of commercial scale CCS is built. However these would not be affected by either of the EPS options as their emissions will be lower than the EPS level. Figure 2: Cumulative new electricity generation capacity build 2014-2030, baseline scenario under high fossil fuel price scenario
Figure 3: Cumulative new electricity generation capacity build 2014-2030, baseline scenario under low fossil fuel price scenario
It is important to note that, as with all modelling, there is some uncertainty surrounding the result and that these scenarios were not modelled with an aim to predict the exact generation mix going forward. Nevertheless, given in particular the current consenting framework, it is likely that the finding in this modelling that there will be no new build of unabated coal fired plant going forward seems robust.
-
5,000
10,000
15,000
20,000
25,000
Gas CCS Coal Nuclear Renewables
MW
New capacity under baseline (high fossil fuel price scenario)
-
5,000
10,000
15,000
20,000
25,000
Gas CCS Coal Nuclear Renewables
MW
New capacity under baseline (low fossil fuel price scenario)

22

23
Part 2
Title: Grandfathering Period of the Emissions Performance Standard
IA No: DECC0080
Lead department or agency: DECC
Other departments or agencies:
Impact Assessment (IA)
Date: 08/05/2013
Stage: Final
Source of intervention: Domestic
Type of measure: Primary legislation
Contact for enquiries:
Selcan Kayihan
0300 068 6913
Summary: Intervention and Options
RPC: AMBER
Cost of Preferred (or more likely) Option
Total Net Present Value
Business Net Present Value
Net cost to business per year (EANCB in 2009 prices)
In scope of One-In, One-Out?
Measure qualifies as
£0m £0m £0m Yes IN
What is the problem under consideration? Why is government intervention necessary?
In the Electricity Market Reform (EMR) White Paper28
, the government confirmed that an EPS of 450g/kWh would be introduced. The government also confirmed that the principle of grandfathering would be applied to the level of the EPS from the point of consent for a period in order to provide sufficient certainty to investors. An Impact Assessment
29 of the introduction of the EPS accompanied the White Paper.
The focus of this Impact Assessment (IA) is to set out the analysis of the impacts of the last remaining EPS design option, that of the length of the grandfathering period. Grandfathering provides certainty over the level of the EPS that a plant will be subject to, for a specific period. Government intervention is necessary to ensure that the EPS is designed appropriately.
What are the policy objectives and the intended effects?
The policy objective is to ensure that the EPS does not prevent new fossil fuel-fired electricity generation from continuing to make an important contribution to electricity security of supply in a manner consistent with the UK’s decarbonisation objectives.
28
https://www.gov.uk/government/publications/planning-our-electric-future-a-white-paper-for-secure-affordable-and-low-
carbon-energy 29
Ibid

24
What policy options have been considered, including any alternatives to regulation? Please justify preferred option (further details in Evidence Base)
The introduction of the EPS and the level at which it should be introduced was the focus of the previous EPS IA. This IA focuses on the last main remaining design option, that of the length of grandfathering. The policy options that have been considered are:
- Option 1: ‘do nothing’ Introduce an EPS of 450gCO2/kWh with grandfathering of the level for the operational life of the plant.. The introduction of the EPS and the level and the principle of grandfathering were confirmed in the EMR White Paper. This option of introducing an EPS of 450g/kWh with assumed grandfathering for operational life was the preferred option in the previous EPS IA so this option is considered the ‘do nothing’ option;
- Option 2: Introduce an EPS of 450gCO2/kWh with grandfathering of the level until 2018
- Option 3: Introduce an EPS of 450g/kWh with grandfathering of the level until 2045 after which the policy comes to an end.
The preferred option is Option 3. This option is best aligned with the policy objective. It provides a period of investor certainty over the EPS regime that new plants will have to operate under while also allowing the government to apply the EPS instrument to all plants in the five years preceding 2050. This gives government flexibility to meet its legally binding target of an 80% emission reduction relative to the 1990 baseline. This is expected to require the almost complete decarbonisation of electricity generation
30.
Will the policy be reviewed? It will be reviewed. If applicable, set review date: 2015
Does implementation go beyond minimum EU requirements? N/A
Are any of these organisations in scope? If Micros not exempted set out reason in Evidence Base.
Micro No
< 20 No
Small No
Medium Yes
Large Yes
What is the CO2 equivalent change in greenhouse gas emissions? (Million tonnes CO2 equivalent)
Traded: 0
Non-traded: 0
I have read the Impact Assessment and I am satisfied that, given the available evidence, it represents a reasonable view of the likely costs, benefits and impact of the leading options.
Signed by the responsible Minister: Date: 08/05/2013
30
DECC, Carbon Plan, December 2011

25
Summary: Analysis & Evidence Policy Option 1 Description: ‘do nothing’
Introduce an EPS of 450gCO2/kWh for all new fossil fuel plant with grandfathering of the level for the operational life the plant FULL ECONOMIC ASSESSMENT
Price Base Year 2010
PV Base Year 2010
Time Period Years 32
Net Benefit (Present Value (PV)) (£m) £0m
Low High: Best Estimate: £0m
COSTS (£m) Total Transition (Constant Price) Years
Average Annual (excl. Transition) (Constant Price)
Total Cost (Present Value)
Low
High
Best Estimate
£0m
66 Description and scale of key monetised costs by ‘main affected groups’
The EPS proposed at this level and with grandfathering for operational life is the ‘do nothing’ option and is therefore not expected to result in an impact on investment, operation decision making or security of supply compared to the baseline
31.
The EPS is a confirmed government policy, the costs of this option are compared against a baseline that includes the preferred option from the previous IA which was to introduce an EPS of 450gCO2/kWh with grandfathering of the level for operational life. This means this option has no additional costs compared to the baseline. Other key non-monetised costs by ‘main affected groups’
N/A
BENEFITS (£m) Total Transition (Constant Price) Years
Average Annual (excl. Transition) (Constant Price)
Total Benefit (Present Value)
Low
High
Best Estimate
£0m £0m
Description and scale of key monetised benefits by ‘main affected groups’
This option does not give rise to any changes compared to the baseline with regards to generation mix or load factor, as this design option for the EPS is the same as the preferred design option from the previous IA, which forms part of the baseline.
Other key non-monetised benefits by ‘main affected groups’
N/A
Key assumptions/sensitivities/risks Discount rate (%)
3.5%
Use of different fossil fuel price scenarios does not change the conclusions. The analysis presented relies on the baseline as modelled by DECC’s economic model of investment in electricity generation. All modelling is dependent on the assumptions and methodology used. While the Government’s view is that the policy will improve clarity and investor confidence, it is not possible to model with accuracy the impact of the
policy on investor sentiment.
BUSINESS ASSESSMENT (Option 1)
Direct impact on business (Equivalent Annual) £m: In scope of OIOO? Measure qualifies as
Costs: £0m Benefits: £0m Net: £0m Yes IN
31 The baseline consists of all existing and confirmed policies which have an impact on the electricity, e.g. EU ETS, Carbon Price
Floor, the Renewables Obligation, EMR policies including the EPS at a level of 450g/kWh grandfathered for operational life.

26
Summary: Analysis & Evidence Policy Option 2 Description:
Introduce an EPS of 450gCO2/kWh for all new fossil fuel plant with the level of the EPS grandfathered until 2018
FULL ECONOMIC ASSESSMENT
Price Base Year 2010
PV Base Year 2010
Time Period Years 32
Net Benefit (Present Value (PV)) (£m) -£500m
Low: -£4300m High: £200m Best Estimate: -£500m
COSTS (£m) Total Transition (Constant Price) Years
Average Annual (excl. Transition) (Constant Price)
Total Cost (Present Value)
Low
High £4,900m
Best Estimate
£3,900m
Description and scale of key monetised costs by ‘main affected groups’
The introduction of an EPS with such limited grandfathering is assumed to deter any new investment in CCGTs. This is because the emissions limit set by the EPS could reduce a plant’s ability to run. A lack of clarity on the level of the EPS post 2018 therefore increases regulatory uncertainty and deters investment.
The welfare loss to consumers is estimated to be £3.9bn under a central fossil fuel price scenario compared to the baseline in which 4.25GW of CCGTs would otherwise be built. The costs are driven by an increase in the wholesale price and increases in capacity mechanism payments. Under the high fossil fuel price scenario the welfare loss is £4.9bn, while under the low fossil fuel price scenario both consumers and producers suffer and there it is an estimated decrease in net welfare of £4.3bn
The EPS is a confirmed government policy. The cost of this option is compared against a baseline that includes the chosen option from the previous IA which was to introduce an EPS of 450gCO2/kWh with grandfathering of the level for operational life from point of consent. The administrative costs identified are the same as those under the baseline.
Other key non-monetised costs by ‘main affected groups’
The administrative costs presented above assumes that the level of the EPS applied to plants consented from 2014 does not change during their operational lifetimes. However this option allows for the level to be changed from 2018. It has not been possible to estimate the cost of this as at this stage because it is not possible to estimate when a level change may occur or how many times. It has not been possible to quantitatively analyse the impact of this option post 2030 as the model used for the analysis ends in 2030 and so there is no baseline post 2030. However it is considered that the lack of certainty over the level of the EPS which plants have to operate under, due to the absence of grandfathering, would result in no new CCGTs being built between 2030 and 2045.
BENEFITS (£m) Total Transition (Constant Price) Years
Average Annual (excl. Transition) (Constant Price)
Total Benefit (Present Value)
Low
High £5,100m
Best Estimate
£3,400m
Description and scale of key monetised benefits by ‘main affected groups’
There is an estimated increase in producer welfare under the central fossil fuel price scenario of £3.4bn. This is driven by increases in the wholesale price and capacity payment. Under a high fossil fuel price scenario, the there is an estimated increase in net welfare to producers of £5.1bn
Other key non-monetised benefits by ‘main affected groups’
The level of the EPS can be changed for fossil fuel plants consented from 2014 onwards after 2018. If the electricity market were to turn out differently from that modelled by the Dynamic Dispatch Model (DDM) and government considered that the EPS level needed to be changed for these plants it could be.
Key assumptions/sensitivities/risks Discount rate (%)
3.5%

27
The analysis presented relies on the baseline as modelled by a DECC economic model of investment in electricity generation. All modelling is dependent on the assumptions and methodology used. While the Government’s view is that the policy will improve clarity and investor confidence, it is not possible to model with accuracy the impact of the policy on investor sentiment.
BUSINESS ASSESSMENT (Option 2)
Direct impact on business (Equivalent Annual) £m: In scope of OIOO? Measure qualifies as
Costs: £0m Benefits: £0m32
Net: £0m Yes IN
32
It has been estimated that there are no direct impacts on business under this option because the impacts on business
identified are second order impacts. This is in accordance with the One-In, One-Out framework

28
Summary: Analysis & Evidence Policy Option 3 Description:
Introduce an EPS of 450g/kWh with grandfathering of the level until 2045
FULL ECONOMIC ASSESSMENT
Price Base Year 2010
PV Base Year 2010
Time Period Years 32
Net Benefit (Present Value (PV)) (£m) £0m
Low -£4300m High: Best Estimate: £0m
COSTS (£m) Total Transition (Constant Price) Years
Average Annual (excl. Transition) (Constant Price)
Total Cost (Present Value)
Low
£0m
High £4,300m
Best Estimate
£0m
66 Description and scale of key monetised costs by ‘main affected groups’
Grandfathering the level of the EPS until 2045 means that the later that a new fossil plant become operational within the period 2014-2045, the shorter the period of clarity over the emissions limit. Under the central and high fossil fuel price baselines new CCGTs would have between 22 and 25 years of certainty over the level of the EPS, while new CCGTs under the low fossil fuel price scenario would only have 15 to 20 years because they don’t start to be built until later in the 2020s. Provisional project finance analysis suggests that new CCGTs that become operational in the early 2020s will need to operate for a period of up to almost 20 years before they breakeven. The breakeven point represents the time when all debt has been paid, but doesn’t take into account the return on equity that investors require which will differ between projects and it is not possible to accurately predict this. However, generators that responded to the informal consultation and through our stakeholder engagement, suggested periods of between 20 years of operation and operational life for the length of grandfathering. Given this, it is considered unlikely that this option would have an impact under the central and high fossil fuel price scenario, but would under the low fossil fuel price scenario. Under the low fossil fuel price scenario, it is considered likely that there would be fewer new CCGTs built than under the low fossil fuel price baseline. While it is not possible to accurately analyse the impact of this option under the low fossil fuel price scenario, an upper bound of the impact of this option under the low fossil fuel price scenario is no new CCGTs consented post 2014 will be built leading to an estimated cost of £4.3 billion. This is made up of a loss in consumer surplus (driven by increases in the wholesale price) and producer surplus (driven by higher producer costs) compared to the baseline However it’s possible that the costs of this scenario will be lower if a number of the new CCGTs in the low fossil fuel price baseline are built.
Other key non-monetised costs by ‘main affected groups’
It has not been able to quantitatively analyse the impact of this option post 2030 as the model used for the analysis ends in 2030 and so there is no baseline post 2030. However it is considered that the lack of certainty over the level of the EPS which plants have to operate under, due to insufficient grandfathering periods, would result in no new CCGTs being built between 2030 and 2045.
BENEFITS (£m) Total Transition (Constant Price) Years
Average Annual (excl. Transition) (Constant Price)
Total Benefit (Present Value)
Low
High
Best Estimate
£0m £0m
Description and scale of key monetised benefits by ‘main affected groups’
This option does not give rise to any quantifiable benefits compared to the baseline with regards to generation mix or load factor,
Other key non-monetised benefits by ‘main affected groups’
If the UK is on track to meet the 2050 carbon emissions target by the mid-2040s then the EPS will no longer be required, but if necessary it also allows the UK to act on emissions of grandfathered plants in the five years preceding 2050 (although this would require further legislation). This option provides greater policy flexibility compared to the baseline.
Key assumptions/sensitivities/risks Discount rate (%)
3.5%

29
The analysis presented relies on the baseline as modelled by DECC’s economic model of investment in electricity generation. All modelling is dependent on the assumptions and methodology used. While the Government’s view is that the policy will improve clarity and investor confidence, it is not possible to model with accuracy the impact of the
policy on investor sentiment.
BUSINESS ASSESSMENT (Option 1)
Direct impact on business (Equivalent Annual) £m: In scope of OIOO? Measure qualifies as
Costs: £0m Benefits: £0m Net: £0m Yes IN

30
Evidence Base (for summary sheets)
Background Climate Change is a global market failure. In response to this the UK has set itself a target to reduce greenhouse gas emissions by at least 80% by 2050, compared to 1990 levels, which is set out in the Climate Change Act. As part of this the electricity system needs to be substantially decarbonised by the 2030s as set out in DECC’s Carbon Plan published in December 2011.
To support this decarbonisation, the Coalition Programme for Government stated that the Government would establish an Emissions Performance Standard (EPS) “that will prevent coal-fired power stations from being built unless they are equipped with sufficient carbon capture and storage to meet the emissions performance standard.”
In the Electricity Market Reform (EMR) White Paper33 published in July 2011, the government confirmed that an EPS of 450g/kWh would be in introduced and would cover all new fossil fuel-fired plant, including gas-fired plants, from the outset. The government also confirmed that the principle of grandfathering would be applied to the level of the EPS from point of consent for a period to provide sufficient certainty to investors. An Impact Assessment34 of the introduction of the EPS accompanied the White Paper. This Impact Assessment (IA) sets out the analysis for the length of the grandfathering period. Grandfathering provides certainty over the level of the EPS that a plant will be subject to, for a specific period. The focus of the analysis is on the different impacts of the options on investor certainty over the EPS and how that impacts on investment and dispatch decisions. It should be noted that there is much uncertainty in predicting how investors will react to different grandfathering periods and there are limitations to the degree of accuracy of the analysis.
The appraisal period is from 2014, when the proposed EPS would be introduced, to 2045. However the quantitative analysis only covers the period 2014- 2030 as the DECC Dynamic Dispatch Model (DDM) which has been used for the quantitative analysis only extends to 2030.
Current Market Arrangements Current market arrangements do not restrict the amount of carbon dioxide released into the atmosphere from sources of electricity generation. However there are existing policies which make polluters pay for their emissions of carbon dioxide and certain other greenhouse gases. The EU ETS is the primary EU wide policy driving decarbonisation across a number of sectors, including the power sector. It is a cap and trade system, which creates a Europe wide price for carbon. While the EU ETS does set a cap for emissions, the limit is for all sectors within scope and does not directly restrict emissions from the electricity generation. However, the EMR White Paper stated that “the level of this cap (and associated carbon price) is not consistent with the pace and scale of decarbonisation that is needed for the UK to meet its 2050 targets.
Electricity Market Reform The proposed designs for the introduction of an EPS formed part of the EMR White Paper. The other EMR policies are not discussed in depth here, but are taken into account in the analysis. The Government’s proposals for reform of the electricity market represent a coherent and complementary package designed to ensure the security of future electricity supply and the decarbonisation of electricity generation, at least cost. In addition to the EPS, the package includes:
- A Contract for Difference (CfD) Feed in Tariff to support all low carbon generation;
- A capacity market which will be based on ensuring a required volume of capacity.
33
https://www.gov.uk/government/publications/planning-our-electric-future-a-white-paper-for-secure-affordable-and-low-
carbon-energy 34
Ibid

31
The EMR measures will be introduced in addition to the Carbon Price Floor which was subject to a separate consultation led by HMT35. It was announced in Budget 2011 that from April 2013 a Carbon Price Floor would be introduced to the power sector in the UK.
Objective of the EPS The objective of the EPS is to ensure that while new fossil fuel-fired electricity generation continues to make an important contribution to security of supply, it does so in a manner consistent with the UK’s decarbonisation objectives.
Design of the EPS The annual limit on the total amount of carbon dioxide permitted will be dependent on the size of plant in question. The annual limit permitted for an individual plant will be equal to the amount of carbon dioxide emitted from a plant of the same size that operates at baseload (85% load factor for the purposes of EPS) and has an emissions intensity factor equal to 450g/kWh. To put the EPS emissions limit into context, the table below presents the emissions intensity factors for illustrative new fossil fuel plants. Table 1 – emission intensity of new fossil fuel generation
Gas (CCGT)
Gas (OCGT)
Coal (ASC) 36
Coal (ASC with CCS) - 90% CO2
capture Net HHV Thermal Efficiency37 54% 38% 42% 35% Fuel Emission Factor38 kg CO2/kWh 0.185 0.185 0.308 0.308 Emissions gCO2/kWh 343 485 737 88
The tables presented above indicate that new CCGTs will have emissions levels below the emissions limit of the EPS. Also, whilst not in scope of the EPS, existing CCGTs would also meet the emissions limit of the EPS. Over the period 2006-2010 CCGTs achieved an average load factor of 62%39. If the amount of emissions resulting from a CCGT operating at 62% load factor and emitting 343 gCO2/kWh were to be presented as a level comparable to the EPS that will be introduced at, it would be approximately 245gCO2/kWh. OCGTs and unabated ASC coal plants would have limits on their load factors or need to fit CCS to their plant in order to meet the emissions limits implied by the EPS options. However, as OCGTs historically have run at very low load factors, it’s considered that this emissions limit will not be binding for OCGTs. OCGT load factors have not been collected by government since 2000, but the average load factor for OCGTs in the period 1996-1999 was 1.9%. It is believed that the load factor of OCGTs has not varied from this very much over the last decade.
35
http://www.hm-treasury.gov.uk/consult_carbon_price_support.htm 36
Advanced Supercritical Coal 37
These are considered best technical efficiencies from Parsons Brinckerhoff ‘s 2011 report with a conversion factor from
LHV to HHV applied based on a representative composition of the fuel; 92.6% for gas plants and 95% for coal plants.
https://www.gov.uk/government/uploads/system/uploads/attachment_data/file/65714/2127-electricity-generation-cost-model-
2011.pdf
38
Digest of UK Energy Statistics 2011, DECC
http://webarchive.nationalarchives.gov.uk/20130109092117/http://decc.gov.uk/assets/decc/11/stats/publications/dukes/2312-
dukes-2011--full-document-excluding-cover-pages.pdf 39
ibid

32
Grandfathering Grandfathering provides clarity to developers over the emissions limits that their plant will face for a set period of time, and hence clarity over what load factors they can run their plant at during that time, or the technology solutions they will need to use (e.g. CCS or biomass) during that time. For the period of grandfathering, new fossil fuel-fired plants are not exposed to any additional uncertainty than they would be without the EPS. Annex 2 summarises the economics of new CCGTs and why providing certainty over the level of the EPS is desirable. This IA focuses on the length of the grandfathering period and there is a range of possible lengths that could be implemented. At one end of the spectrum the EPS could be grandfathered for the operational life of a plant providing the maximum length of certainty over the EPS regime for plants. At the other end of the spectrum there could be no grandfathering. However this is not considered in this IA as the government confirmed that the principle of grandfathering would be applied to the level of the EPS from point of consent in the EMR White Paper. Instead, the minimum period of grandfathering considered reasonable is analysed, grandfathering the level until 2018.
EPS grandfathering options considered
The introduction of the EPS and the level at which it should be introduced was the focus of the previous EPS IA. This IA focuses on the last main remaining design option, that of the length of grandfathering. Three options are considered in this Impact Assessment:
Option 1: ‘do nothing’ Introduce an EPS as an annual limit on the amount of carbon dioxide that a plant can emit equivalent to 450gCO2/kWh for plant operating at baseload40. The level would be grandfathered for the operational life of the plant. This option was the preferred option in the previous EPS IA and the government confirmed its commitment to the introduction of the EPS at the level of 450g/kWh and the principle of grandfathering at the time of the EMR White Paper. If there were to be no further regulation agreed in this area grandfathering for operational life would be the default due to the way the legislation would be introduced. Thus, this option forms the ‘do nothing’ option in this IA. The emissions limit imposed by this option would require a new, supercritical coal plant, sized at around 1600MW (gross) to use CCS on around 700MW (gross) of its capacity, around 40%, if it were to run at baseload. This EPS design option necessitates utilisation of the CCS technology fitted to supercritical coal plant in order to meet the emissions limit or the generators would face significant load factor constraints. As set out in the previous section in this Impact Assessment, the emissions limit will not be binding for CCGT plants or those plants that fit and use CCS. Grandfathering the level of the EPS for the expected operational life of the plant means that the plants that are consented at this EPS level will have to operate in accordance to this level for the operational life of the plant even though the level of the EPS may subsequently be reduced for new plant41. This clarity will help developers when making a deciding whether or not to invest in the electricity market. Grandfathering the level of the EPS for operational life will not preclude fossil fuel-fired plants having to fit CCS to the whole of their capacity or gas-fired plants having to fit CCS if it is deemed Best Available Technique (BAT) by the EU42 for existing plant at some stage in the future. Nor
40
85% load factor for the purposes of EPS 41
The impact of the EPS possibly declining in the future for new plant is not discussed here. If such a change were to be made
it would require further legislation and be subject to its own Impact Assessment 42 Under the IED there is a process of information exchange on Best Available Technique (BAT), involving Member States,
NGOs and the Commission, whereby European reference documents (“BREFs”) on BAT are drawn up by the Commission.
The conclusions on BAT reached are formally adopted by the Commission. Once a technique is deemed BAT, Member States
must reflect this in permit conditions. In GB, these are applied through Environmental Permits.

33
will this option prevent other mechanisms, such as CfDs or the carbon price floor from incentivising retrofit of CCS.
Option 2 Introduce an EPS as an annual limit on the amount of carbon dioxide that a plant can emit, equivalent to 450gCO2/KWh for plant operating at baseload43. The level would be grandfathered until 2018, after which the level may remain the same or change. This option has been included because it represents the minimum scope of grandfathering and therefore the lower bound of what grandfathering provision it would be possible to legislate for given that the government has committed to the principle of grandfathering.
The EPS will be applied to new fossil fuel plant at the point of consent from 2014. It is estimated that the construction period for new CCGT plants is two years, for new supercritical coal plant it is three years and IGCC plants it’s five years44. This means that it’s estimated that the earliest that a new fossil fuel plant that falls under the EPS, a CCGT, will become operational is 2016. At point of investment, the developers of that plant would only have two years of clarity over the emissions limit that the plant would be subject to while operating. A supercritical coal plant consented in 2014 would only have one year of certainty on the EPS level, while an IGCC consented in 2014 would not have any operational period where there was certainty over the EPS level it would operate under. It is assumed that grandfathering would not be applied to the level of the EPS for any fossil fuel-fired plant that was consented after 2018.
Option 3 Introduce an EPS as an annual limit on the amount of carbon dioxide that a plant can emit, equivalent to 450gCO2/KWh for plant operating at baseload45. The level would be grandfathered until 2045, after which the level would remain the same or change if there is a need to limit emissions. As set out above, it is assumed that the earliest a new fossil fuel plant that falls under the EPS could become operational is 2016. This plant would have 29 years of clarity over the emissions limit that the plant would be subject to while operating even though the level of the EPS may subsequently reduce for new plant46. The later that new fossil plant become operational within the period 2014-2045, the shorter the period of clarity over the emissions limit. Grandfathering the level of the EPS until 2045 will not preclude coal-fired plants having to fit CCS to the whole of their capacity or gas-fired plants having to fit CCS if it is deemed Best Available Technique (BAT) by the EU47 for existing plant before then. Nor will this option prevent other mechanisms, such as the carbon price floor, incentivising retrofit of CCS.
Baseline
43
85% load factor for the purposes of EPS 44
https://www.gov.uk/government/uploads/system/uploads/attachment_data/file/65714/2127-electricity-generation-cost-
model-2011.pdf
45
85% load factor for the purposes of EPS 46
The impact of the EPS possibly declining in the future for new plant is not discussed here. If such a change were to be made
it would require further legislation and be subject to its own Impact Assessment 47 Under the IED there is a process of information exchange on Best Available Technique (BAT), involving Member States,
NGOs and the Commission, whereby European reference documents (“BREFs”) on BAT are drawn up by the Commission.
The conclusions on BAT reached are formally adopted by the Commission. Once a technique is deemed BAT, Member States
must reflect this in permit conditions. In GB, these are applied through Environmental Permits.
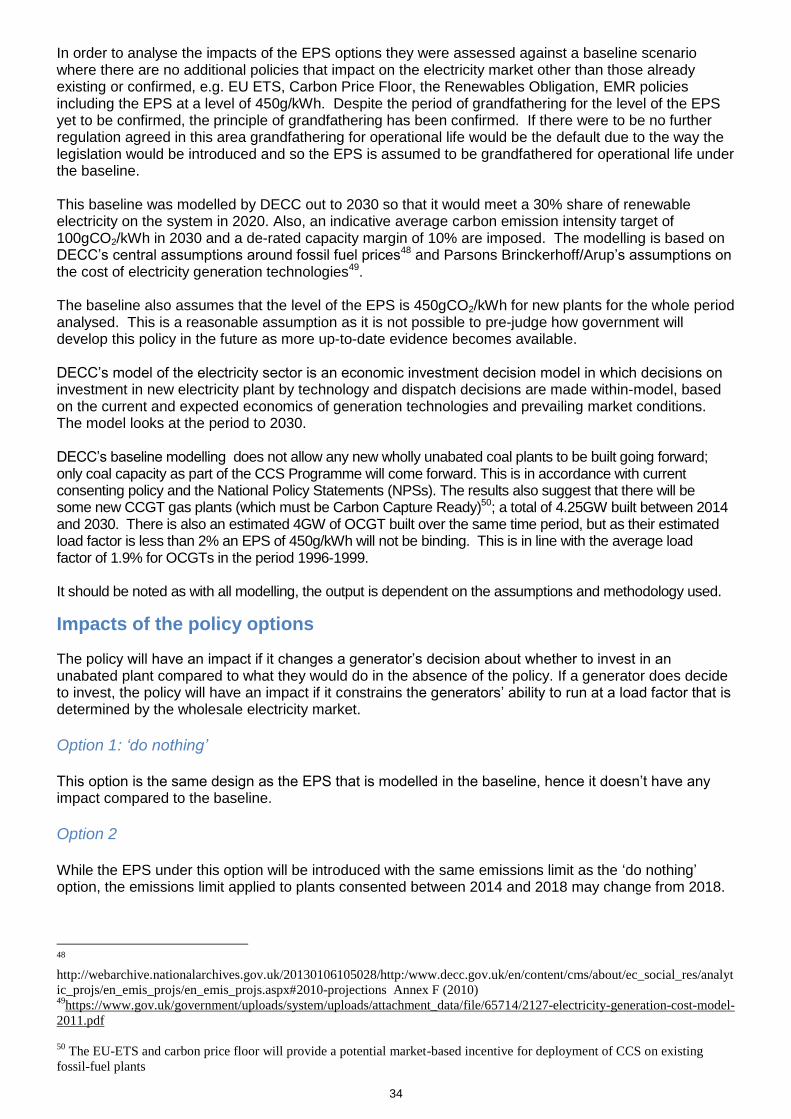
34
In order to analyse the impacts of the EPS options they were assessed against a baseline scenario where there are no additional policies that impact on the electricity market other than those already existing or confirmed, e.g. EU ETS, Carbon Price Floor, the Renewables Obligation, EMR policies including the EPS at a level of 450g/kWh. Despite the period of grandfathering for the level of the EPS yet to be confirmed, the principle of grandfathering has been confirmed. If there were to be no further regulation agreed in this area grandfathering for operational life would be the default due to the way the legislation would be introduced and so the EPS is assumed to be grandfathered for operational life under the baseline. This baseline was modelled by DECC out to 2030 so that it would meet a 30% share of renewable electricity on the system in 2020. Also, an indicative average carbon emission intensity target of 100gCO2/kWh in 2030 and a de-rated capacity margin of 10% are imposed. The modelling is based on DECC’s central assumptions around fossil fuel prices48 and Parsons Brinckerhoff/Arup’s assumptions on the cost of electricity generation technologies49. The baseline also assumes that the level of the EPS is 450gCO2/kWh for new plants for the whole period analysed. This is a reasonable assumption as it is not possible to pre-judge how government will develop this policy in the future as more up-to-date evidence becomes available. DECC’s model of the electricity sector is an economic investment decision model in which decisions on investment in new electricity plant by technology and dispatch decisions are made within-model, based on the current and expected economics of generation technologies and prevailing market conditions. The model looks at the period to 2030. DECC’s baseline modelling does not allow any new wholly unabated coal plants to be built going forward; only coal capacity as part of the CCS Programme will come forward. This is in accordance with current consenting policy and the National Policy Statements (NPSs). The results also suggest that there will be some new CCGT gas plants (which must be Carbon Capture Ready)50; a total of 4.25GW built between 2014 and 2030. There is also an estimated 4GW of OCGT built over the same time period, but as their estimated load factor is less than 2% an EPS of 450g/kWh will not be binding. This is in line with the average load factor of 1.9% for OCGTs in the period 1996-1999. It should be noted as with all modelling, the output is dependent on the assumptions and methodology used.
Impacts of the policy options
The policy will have an impact if it changes a generator’s decision about whether to invest in an unabated plant compared to what they would do in the absence of the policy. If a generator does decide to invest, the policy will have an impact if it constrains the generators’ ability to run at a load factor that is determined by the wholesale electricity market.
Option 1: ‘do nothing’ This option is the same design as the EPS that is modelled in the baseline, hence it doesn’t have any impact compared to the baseline. Option 2 While the EPS under this option will be introduced with the same emissions limit as the ‘do nothing’ option, the emissions limit applied to plants consented between 2014 and 2018 may change from 2018.
48
http://webarchive.nationalarchives.gov.uk/20130106105028/http:/www.decc.gov.uk/en/content/cms/about/ec_social_res/analyt
ic_projs/en_emis_projs/en_emis_projs.aspx#2010-projections Annex F (2010) 49
https://www.gov.uk/government/uploads/system/uploads/attachment_data/file/65714/2127-electricity-generation-cost-model-
2011.pdf
50
The EU-ETS and carbon price floor will provide a potential market-based incentive for deployment of CCS on existing
fossil-fuel plants

35
This option introduces regulatory risk compared to the baseline. Although the level at which the EPS will be introduced at is not binding on CCGTs, at point of investment an investor will not know what emissions limit its plant will be subject to following the end of grandfathering, which could affect the plants load factor within a given year and hence its revenue. When making an investment decision an investor will appraise a project’s projected load factor and hence projected revenue base on market fundamentals over that time period. Responses to the informal consultation on grandfathering the EPS51 indicated that investors would heavily discount any revenue gained once grandfathering had come to an end, potentially assigning no value to the plant beyond this point. The cost of capital for such projects would be higher than the cost of capital for such projects under the baseline due to the increase in regulatory risk. The introduction of regulatory risk will be in addition to an already difficult investment environment for new CCGTs in the baseline. Provisional project finance analysis carried out on the new CCGTs in the baseline, using DECC assumptions, suggests that these projects will need to operate for almost 20 years before they break even. The breakeven point represents the time when all debt has been repaid. The amount of time to generate the return on equity that investors require will differ between projects and it is not possible to accurately predict this. Long periods are needed to break even because low carbon generation technology, such as nuclear and wind have lower short run marginal costs than CCGTs and therefore dispatch ahead of CCGTs. The increase in low carbon generation capacity in the baseline suppresses CCGTs ability to dispatch and therefore its ability to earn revenue. It is estimated that CCGTs will achieve an average load factor of 41% in 2030 under the baseline compared to an average load factor of 62% over the period 2006-201052 (with the newer more efficient CCGTs assumed to achieve load factors above the average). It is not possible to estimate accurately the way in which investors may discount the revenue gained once grandfathering has come to an end or the increase in cost of capital as this will vary from project to project. As a result, it was not possible to analyse the effect of these changes within the DECC DDM. However, given that this option only provides a maximum of two years of the certainty of the emissions limit that the plant will be subject to, compared to an estimated operational life of at least 30 years for a fossil fuel-fired plant, and combined with informal consultation responses and the project finance analysis, it is considered that investors would not invest in new CCGT plant. Analysis from DECC’s DDM model was used to assess the scenario assuming that no new CCGTs were commissioned from 2014 onwards53 compared to the DDM baseline scenario. The scenario with no new CCGTs built has an estimated negative net welfare change of £500m compared to the baseline. This is made up of a loss in consumer surplus (£3,900m54), but a gain in producer surplus (£3,400m55). The analysis indicates that the absence of new CCGT capacity consented from 2014 results in less retirements of existing unabated coal plants and higher load factors for existing unabated coal generation compared to the baseline in the 2020s (although it should be noted that there is still no new build of unabated coal plant in accordance with current consenting policies and the NPSs). This in turn leads to higher wholesale electricity prices, and higher emissions than in the baseline during the 2020s.
While the increase in emissions compared to the baseline requires more low carbon generation to be built and operated in order to meet the 100gCO2/kWh average emissions intensity ambition in 2030, the increase in the wholesale price means the costs of the CfD are less than in the baseline56. Yet this
51
Refer to Annex 1 for a list of respondents and summary of responses 52
Digest of Energy UK Statistics 2011, table 5.10
http://webarchive.nationalarchives.gov.uk/20130109092117/http://decc.gov.uk/assets/decc/11/stats/publications/dukes/2312-
dukes-2011--full-document-excluding-cover-pages.pdf 53
This scenario was imposed on the model 54
Discounted to 2011 55
Discounted to 2011 56
This is because the CfD for an individual plant will be the difference between the market reference price, which will track
the wholesale price closely, and the strike price (pre-agree level of revenue). As the wholesale price rises the CfD received by
the plant will fall. The modelling suggests that this effect outweighs the effect of having to provide CfDs for more low carbon
generation compared to the baseline.

36
estimated decrease in the cost of the CfD is not enough to offset the estimated increase in wholesale price that consumers will face, leading to an increase in overall costs to consumers.
Capacity payments need to keep the de-rated capacity margin at 10% are also higher under this scenario compared to the baseline due to the absence of new CCGTs consented from 2014.
It should be noted that this option provides more flexibility for the policy as the level of the EPS can be changed for fossil fuel plants consented from 2014 onwards after 2018. If the electricity market were to turn out differently from that modelled by the DDM and government considered that the EPS level needed to be changed for these plants it could be. However this would require a change to primary legislation. It is not possible to quantify this option value. Post 2030, it is assumed that no new CCGTs would be built under this option due to the absence of grandfathering. It is not possible to say if this would differ from the baseline as it has not been modelled post 2030.
Option 3 While the EPS under this option will be introduced with the same emissions limit as the ‘do nothing’ option, the emissions limit will applied to plants consented from 2014 will cease in 2045. This means that there is uncertainty over the EPS regime that generators will have to comply with after 2045 (if any), i.e. more uncertainty for investors compared to the baseline. Although the level at which the EPS will be introduced at is not binding on CCGTs, this may not be the case after 2045. Whether this increase in uncertainty has an impact, i.e. changes investment and dispatch decisions compared to the baseline is considered below. A decision to invest will be based on the projected return of a project over the expected operational lifetime of the plant. The question is whether the grandfathering period under Option 3 is long enough to earn sufficient returns? Given that investors will discount costs and revenues in the future, could a period less than operational life be sufficient? As set out in the Baseline section, DECC modelling suggests that a total of 4.25GW of new CCGT will be within scope of the EPS. The first of these plant becomes operational in 2020 and the last in 2023. Under Option 3 these plants will have between 25 and 22 years of years of clarity over the emissions limit that the plant would be subject to while operating. As stated above the provisional project finance analysis carried out on the new CCGTs in the baseline, using DECC assumptions, suggests that these projects will need to operate for a period of almost 20 years before they break even. The amount of time needed to generate the return on equity that investors require will differ between projects and it is not possible to accurately predict this and hence how developers may respond to such grandfathering periods. Each developer will have different appetites for risk meaning that the investment case of some projects will not be altered, while it will be for others. Generators responses to the informal consultation and our stakeholder engagement on grandfathering the EPS provide another source of evidence to assess this policy option. Generators responded suggesting grandfathering periods of between 20 years of operation and operational life would be needed to in order to be able to make an investment. The analysis suggests that the new CCGTs that are built in the baseline and fall within scope of the EPS will have between 25 and 22 years of grandfathering. This is longer than the estimated period required to pay back all debt, leaving time to make a return on the equity invested too. It also falls within the range of grandfathering periods put forward by generators responding to the informal consultation and through our stakeholder engagement. While it is not possible to accurately analyse the impact of this option, taking the evidence into account, it is considered unlikely (but not definitively so) that it will have an effect on investment decisions and therefore dispatch decisions (which are assumed to be determined by the market). Hence it’s considered that there is no impact compared to the baseline in this regards.

37
This conclusion seems reasonable as there is not a large amount of difference in the provision of certainty over the level of the EPS between Option 3 and the baseline. This is because, given discounting, the value of expected revenue beyond 25 years of operation is relatively small. Option 3 provides the benefit of greater policy flexibility. If necessary this option allows the Government to legislate to apply a lower level of the EPS instrument to all plants (including those that had been subject to a grandfathered level of the EPS up until that point), in the five years preceding 2050 to meet The legally binding target of an 80% emission reduction relative to the 1990 baseline. This is an important benefit of this option as this is an ambitious long term target that is expected to require the almost complete decarbonisation of electricity generation. At this stage there is uncertainty over what will be required in the years running up to 2050 to achieve the target and it would be imprudent to rule out the use of any policy to achieve this target in the future. Taking this all together, the analysis suggests that this option provides balance between not disincentivising investment compared to the baseline and it providing policy flexibility. Post 2030, it is assumed that no new CCGTs would be built under this option due to insufficient grandfathering periods (based on the analysis and informal consultation responses). It is not possible to say if this would differ from the baseline as it has not been modelled post 2030.
The spectrum of grandfathering periods The length of the grandfathering period of the EPS presented under Options 1 and 2 in this IA are towards the extremes of the set of possible grandfathering periods. In principle any period between these two could be chosen. It is expected that if a grandfathering period between two years and operational lifetimes were chosen then the impact would fall between the estimated costs and benefits of the options analysed here (i.e. between a NPV of £0 and -£500 million). This is because a two year grandfathering period under Option 2 provides the least amount of regulatory certainty with regard to the EPS and therefore has the greatest potential to affect investment decisions compared to the baseline. At the same time, grandfathering period of more than the expected lifetime of the plant would not have a material effect on investment decision compared to the baseline. Any choice of grandfathering period that is less than the operational life of the plant will include additional administrative costs (as outlined below) and uncertainty for businesses compared to the baseline. Given these reasons and informal consultation responses, a grandfathering period between the two options would involve greater revenue uncertainty and higher investor discount factors relative to the baseline. However it is not possible to accurately predict how investors may respond to more moderate grandfathering periods. Each developer will have different appetites for risk and each project will have different financing arrangements meaning that at grandfathering periods of, say, 20 years, the investment case of some projects will not be altered, while it will be for others.
Cost to business of administering an EPS The baseline, against which the options in this IA are compared against, includes the preferred option from the previous EPS IA which was to introduce an EPS of 450gCO2/kWh with grandfathering of the level assumed to be for operational life from the point of consent. Option 1 is the same as the preferred option in the previous EPS IA. This means this option has no additional administrative costs compared to the baseline. However, if the EPS is not grandfathered for operational life, as under Option 2, additional administrative costs may be incurred if there is a change in level of the EPS for existing plants consented from 2014. At this stage it is not possible to estimate when a level change may occur or how many times. However, should Government decide to change the level of the EPS after 2018 under Option 2, the change in policy and the amendment to regulations will be the subject of another impact assessment.

38
Under Option 3, further legislation would be needed to limit emissions from fossil fuel plant after 2045. If this were to happen then additional administrative costs may be incurred, but this is outside the scope of this IA.
Net cost to business of the EPS More detailed analysis of the net cost to business of the impact of the EPS and administering it will be set out and scored in an Impact Assessment accompanying Secondary Legislation. This will provide more detail on the practicalities of how the regime will operate. There is no immediate requirement on business from the Primary Legislation of the EPS.
Electricity Bills Impacts Option 1
This option is the same design as the EPS that is modelled in the baseline, hence it doesn’t have any impact compared to the baseline.
Option 2 Option 2 is estimated to have an effect on electricity bills as the assumed impact of the option changes the pattern of new plant and therefore impacts on operation. The estimated average annual impacts in absolute and percentage terms are summarised below.
Average annual impact compared to baseline (2016-2020)
Average annual impact compared to baseline (2021-2025)
Average annual impact compared to baseline (2026-2030)
Domestic consumer bill57
£0.30 (0.1%) £16.60 (3%) £7.80 (1.3%)
Non-domestic consumer bill58
£823 (0.1%) £39,858 (2.6%) £17,426 (1.1%)
As the table shows, this option would increase bills compared to the baseline.
Option 3
As previously explained, while it is not possible to accurately analyse the impact of this option, given the evidence it is considered unlikely option 3 will change the pattern of new electricity plant build compared to the baseline. Hence, it is unlikely this option is would impact on the market-dictated operation pattern of the existing electricity generation fleet. Given this it is not considered that there will be any impact on wholesale electricity prices or on consumer electricity bills.
Fossil fuel price sensitivities The analysis presented above was carried out using DECC’s central fossil fuel prices projections. This section discusses the effect of carrying out the analysis using DECC’s high and low fossil fuel price projections.
Option 1 This option is the same design as the EPS that is modelled in the baseline; hence it doesn’t have any impact compared to the baseline.
57
The domestic impacts are for an "average" household 58
The industrial impacts are for a medium industrial electricity user, i.e. annual consumption of 11,000 MWh per annum
(Eurostat definition)

39
Option 2 The analysis for Option 2 does change when carrying out the analysis using DECC’s high and low fossil fuel prices. The baseline under the low fossil fuel price scenario suggests that 9.8GW of new CCGT would be consented, built and begin operation between 2014 and 2030. The low fossil fuel price scenario with no new CCGTs consented from 2014 has an estimated negative net welfare change of £4.3bn compared to the baseline. This is made up of a loss in consumer surplus and producer surplus compared to the baseline. The loss in consumer surplus is driven by the increase in the wholesale price as a result of existing CCGTs staying on the system for longer compared to the baseline, while the loss in producer surplus is due to higher producer costs. These higher producer costs result from more nuclear plant being built in the late 2020s in order to become operational in the 2030s (the model only considers the market to 2030) as the existing CCGTs that stayed on the system for longer come to the end of their expected operation lifetimes. The baseline under the high fossil fuel price scenario suggests that 9.8GW of new CCGT would be consented, built and begin operation between 2014 and 2030. Under the high fossil fuel price scenario with no new CCGTs consented from 2014, it’s estimated that there is a small increase in net welfare of £200m compared to the baseline. This increase in net welfare is made up of a loss in consumer surplus that is more than offset by an increase in producer surplus. The loss is consumer surplus is mainly driven by higher wholesale prices compared to the baseline as existing unabated coal plants generate more and there are fewer retirements of existing CCGTs. There is also an increase in capacity payments. Producers gain because of the large transfer from consumers to producers from the increased wholesale price.
Central fossil fuel
price scenario Low fossil fuel price scenario
High price scenario
Net welfare change -£500m -£4,300m59 £200m
Net change in consumer surplus
-£3,900m -£1,000m -£4,900m
Net change in producer surplus
£3,400m -£3,200m £5,100m
Option 3 Under both low and high fossil fuel price scenarios, the modelling for the baseline suggests that there will be no new unabated coal plants being built going forward (this is in accordance with consenting policy and the National Policy Statements) indicating that Option 3 will not have an impact in this regard. Under the high fossil fuel price baseline scenario, new CCGT gas plants become operational between 2020 and 2023 implying grandfathering periods of 22-25 years. Provisional project finance analysis suggests that, under a high fossil fuel price scenario, plants would need almost 20 years of operational life to breakeven, but this does not take into account the amount of time needed to generate the return on equity that investors will require. As under the central fossil fuel price scenario, it is considered, given this period of grandfathering and responses to the informal consultation, it is unlikely that there would be a change in investment decisions or operation patterns compared to the baseline (although it has not been possible to accurately analyse this). Under the low fossil fuel price baseline scenario, new CCGT gas plants become operational between 2025 and 2030 implying grandfathering periods of 15-20 years. While the lower end of the range of grandfathering periods suggested by generators responding to the informal consultation and through stakeholder engagement is 20 years, provisional project finance analysis suggests that, under a low fossil fuel price scenario, plants would need almost 15 years of operational life to breakeven. New CCGTs need less time to pay back their debt under a low fossil fuel price scenario because they have higher rates of dispatch as this scenario favours gas-fired generation compared to coal.
59
Figures have been rounded to nearest £100m

40
The breakeven point represents the time when all debt has been paid. The amount of time needed to generate the return on equity that investors require will differ between projects and it is not possible to accurately predict this and hence how developers may respond to such grandfathering periods. Each developer will have different appetites for risk meaning that the investment case of some projects will not be altered, while it will be for others. While it is not possible to accurately analyse the impact of this option under the low fossil fuel price scenario, it is considered likely that there would be fewer new CCGTs built than under the low fossil fuel price baseline. The estimated impact of Option 2 was that no new CCGTs consented post 2014 would be built leading to an estimated cost of £4.3 billion under the low fossil fuel price scenario. This can be interpreted as an upper bound of the estimated cost of Option 3 under the low fossil fuel price scenario; it’s possible that the costs of this scenario will be lower. This cost estimate needs to be set against the potential benefit of the flexibility of Option 3 with regards to being able to legislate and reduce the level of EPS for plants previously benefitting from grandfathering to help meet the emissions reduction target in 2050 if needed.
Specific Impact Tests Economic Impact The analysis presented in this IA suggests that there will be no impact on either generators’ decisions to invest in plants, or generators’ operation decisions compared to business as usual baseline under Option 1. Given this the policy has no quantified economic effects. Option 2 does have an impact on generators’ decisions to invest in CCGTs plants (and therefore also impacts on other generators’ operating decisions) compared to the baseline. The details of this analysis are set out above. The analysis suggests that it is unlikely that Option 3 will result in an impact on either generators’ decisions to invest in plants, or generators’ operation decisions under the compared to the baseline under the central and high fossil fuel price scenarios. However, under the low fossil fuel price scenario it is considered likely that there would be an impact on generators’ decisions to invest in CCGTs plants in the second half of the 2020s (and therefore also impacts on other generators’ operating decisions). The details of this analysis are set out above. Environmental Impact As the analysis suggests that Option 1 will not lead to a change in electricity generation compared to the business as usual baseline, at this time it is felt that there are no environmental impacts of the policy options presented. Option 2 leads to higher emissions of CO2 during the 2020s under the central and high fossil fuel price scenarios as unabated coal stays in the generation mix for longer compared to the baseline, but the emission intensity ambition of 100g/kWh is still met in 2030 (more low carbon generation is built, compared to the baseline, to achieve this). Under the low fossil fuel price scenario there is estimated to be a small decrease in emissions in the 2020s compared to the baseline as existing CCGT capacity remains on the system longer rather than unabated coal and there is an increase in low carbon generation. As the analysis suggests that under the central and high fossil fuel price scenarios Option 3 is unlikely to lead to a change in electricity generation compared to the business as usual baseline, it is felt that there are no environmental impacts of the policy options presented over the period (2014-2030) that we have been able to quantitatively analyse. However, there may be possible environmental benefits of this option after 2045; it allows the UK to legislate to apply a lower level of the EPS instrument to all plants (including those that had been subject to a grandfathered level of the EPS up until that point), in the five years preceding 2050 to meet its legally binding target of an 80% emission reduction relative to the 1990 baseline if necessary. Under the low fossil fuel price scenario, it is considered likely, that Option 3 will result in fewer new CCGTs built than under the low fossil fuel price baseline. At the extreme, it’s possible that no new

41
CCGTs consented post 2014 would be built under the low fossil fuel price scenario. This is estimated to lead to a small decrease in emissions in the 2020s as existing CCGT capacity remains on the system longer rather than unabated coal and there is an increase in low carbon generation capacity compared with the baseline. However, it is possible that some new CCGTs will be built, as in the low fossil fuel price baseline, and so the environmental impact will be less. Fuel Poverty Given the estimated bill impacts for Option 2 presented above, this option would have a negative impact on fuel poverty. Under the low fossil fuel price scenario, it is considered likely Option 3 will result in no new CCGTs in the second half of the 2020s. The DDM analysis carried out to estimate the impact of Option 2 under the low fossil fuel price scenario is applicable here and suggests that this will result in an increase in the wholesale price and so this would have a negative impact on fuel poverty. Other impacts No direct wider impacts are anticipated from either of the options. This includes impacts on equality, human rights and the justice system.
Preferred option The preferred option is Option 3, introducing an EPS as an annual limit on the amount of CO2 a plant can emit, equivalent to 450gCO2/kWh for plant operating at baseload, grandfathered until 2045. This option is best aligned with the policy objective as it provides the opportunity for the UK to reduce emissions from fossil fuel plant within scope of the EPS in the years preceding 2050 if necessary, while also providing a period of investor certainty over the EPS regime that they will have to operate under. But if necessary Option 3 also allows the UK to legislate to apply the EPS instrument to all plants in the five years preceding 2050 if needed to meet its legally binding target of an 80% emission reduction relative to the 1990 baseline. This is expected to require the almost complete decarbonisation of electricity generation. While it has not been possible to accurately analyse the impact of Option 3, project finance analysis and informal consultation responses have been used to assess the most likely outcome

42
Annex 1
Respondents for informal consultation and stakeholder engagement
AEP
Alstom
Carbon Capture Storage Association
CoalImp
Coalpro
E.ON
EDF Energy
Environment Agency
ESBI
ExxonMobil
Jon Gibbins, Professor, University of Edinburgh
McGrigors LLP
Peel Energy
RWE npower
Scottish Power
SEPA
SSE
Tata Steel
UK Coal Mining
Summary of responses
While there was not complete agreement amongst generators over the mimimum length of grandfathering needed to provide sufficient certainty over the EPS regime in order make investment decisions, many advocated grandfathering for operational life. A number of generators also stated that if the grandfathering period were to be limited to anything less than operational life, they would heavily discount the projected revenues beyond the end of the grandfathering period increasing risk and hurdle rates for potential new CCGTs.
Overall, the responses from generators on the subject of the grandfathering period ranged from suggestions of 20 years of operation to operational life.
A couple of responses from non-generators supported a grandfathering period shorter than operational life as they were concerned about compatibility with climate change targets and incentivising CCS on CCGTs.

43
Annex 2
Economics of new gas-fired electricity generation
Drivers of investment
Investment in new gas generation is fundamentally driven by the expected future profitability of these plants. That expected profitability is in turn determined by the expected revenues and costs that these plants will receive over the course of their economic lives. Revenues are largely driven by wholesale electricity prices, while costs are largely driven by the fixed costs associated with building and maintaining the plant, and the variable costs associated with the cost of fuel and the cost of carbon. Chart 1: below shows the historic electricity and gas prices.
The wholesale gas price and the wholesale electricity price broadly move together as for much of the year, gas-fired generation is the marginal plant and therefore sets the wholesale electricity price. A key measure of the profitability of gas plant is the so-called “clean spark spread”60. The current clean spark spread is low, as a result of low electricity prices and high gas prices relative to its closest competitor, coal. The low electricity prices are driven by excess amounts of generation capacity. As can be seen from chart 2 below, clean spark spreads have been falling, while clean dark spreads, which measure the profitability of coal have remained relatively high, thanks to the relatively low cost of coal and the current low cost of carbon. Chart 2: Clean Dark and Spark Spreads Feb 2009 - March 2012
60
The “clean spark spread” represents the difference between the baseload wholesale electricity price60
and combined gas and carbon costs, for a reference (49% efficient) gas generator. The “clean dark
spread” shows the corresponding measure for a reference coal generator

44
The immediate outlook for gas plant is difficult. Looking forward During the second half of this decade there are strong reasons to believe that the economics of gas-fired generation will improve. DECC’s current forecasts suggest that wholesale electricity prices will increase and a key reason for this expected increase is that it is expected that current excess capacity margins will decline later in the decade as a result of the retirement of existing coal and nuclear plant. However, in the 2020s the effects of the EMR policies are expected to become apparent as we decarbonise the electricity market. For example CfDs are expected to be the increase the amount of nuclear and wind generation, which has a lower marginal cost than gas-fired generation. This means that as the amount of this type of generation increases gas-fired generation will dispatch less. For an investor considering investing this will depress expected revenues. Not only it is considered that dispatch from gas-fired generation will decline compared to today, but for CCGTs the pattern of dispatch will change too. Nuclear generation runs almost constantly throughout the year, whereas wind plants will only generate when it’s windy. Generation from CCGTs will be needed to meet demand, i.e. be in merit, more when there is less generation from wind plants. This means that CCGTs (as well as other types of flexible generation) could have a very important role to play in the future generation mix as the electricity market is decarbonised. Investors in CCGTs face much market uncertainty. The introduction of the EPS could potentially add to this by creating policy uncertainty. The EPS limits emissions from new fossil fuel plants and it is possible that in the future the level of the EPS will be reduced from 450gCO2/kWh through legislation. Depending on the level of the EPS, the number of hours the plant can run may be restricted and this will impact on the revenue stream. Without grandfathering the level of the EPS, investors will not know what emissions limit they will be subject to during the lifetime of the plant. This creates uncertainty around the revenue stream, which is one of the key concerns when considering whether to invest. Grandfathering provides clarity to developers over the emissions limits that their plant will face for a set period of time, and hence clarity over what load factors they can run their plant at under the EPS during that time. For the period of grandfathering, new fossil fuel-fired plants are not exposed to any additional uncertainty than they would be without the EPS.
-15
-10
-5
0
5
10
15
20
25
Spre
ad (
£/M
Wh
)
Clean Dark Spread (£/MWh) Clean Spark Spread (£/MWh)Source: DECC