title how much should we reduce greenhouse gas emissions ... · 4 how much should we reduce...
TRANSCRIPT
Title How much should we reduce greenhouse gas emissions inorder to combat the global warming problem?
Author(s) Matsuoka, Yuzuru
Citation SANSAI : An Environmental Journal for the GlobalCommunity (2006), 1: 1-20
Issue Date 2006-01
URL http://hdl.handle.net/2433/108261
Right
Type Journal Article
Textversion publisher
Kyoto University

How much should we reduce greenhouse gas emissions in order
to combat the global warming problem?
YUZURU MATSUOKA
Abstract: Climate stabilization is one of the most serious problems that humanity faces this century. National climate policies in some European countries consider an increase of 2"C in the global mean temperature on that of the pre-industrial era to be a level of dangerous climate change. These countries have established action plans for the next 50 years in order to avoid overshooting this target. I reviewed the research on dangerous levels of climate change and analyzed the required reduction rates for greenhouse gas emissions. Based on this review, I discuss the required counter-measures and their feasibilities in order to overcome the global warming problem and to get through the first half of this century.
Keywords: global warming, climate stabilization, greenhouse gases, carbon dioxide.
Introduction
1
In the 1990s, the sCIence of climate change developed rapidly and much new
knowledge was gained. Many views have been expressed regarding the causes of climate change, but it has now been confirmed that greenhouse gases, primarily those
resulting from human activity, are a major contributing factor. Future projections based on this knowledge have also been announced and climate change is predicted to have a serious negative effect on the world in the future.
The UK, France and other European nations have announced plans to reduce greenhouse gas emissions by 45-80% by 2050 based on their projections. Under the Kyoto Protocol to the United Nations Framework Convention on Climate Change
(popularly known as simply the Kyoto Protocol), the UK is required to reduce greenhouse gas emissions by 12.5%, while France has a reduction target of ±O%. Compared with these Kyoto Protocol agreed levels, the new targets represent major
reductions. In order to achieve these targets, major reform of the energy supply system and energy efficiency will be needed, in addition to major lifestyle changes on the part

2 How much should we reduce greenhouse gas emissions?
of the general public. The objective of this article is to identify the level of dangerous
climate change, to determine the relationship between this level and the reduction
targets and to discuss their feasibility.
Long-term targets and CO2 reduction programs in the climate policy of European nations
Before the Kyoto Conference of 1997, the European Union proposed the following
targets for long-term climate stabilization:
• Limiting the CO2 concentration in the atmosphere to 550 parts per million (ppm).
• Limiting temperature rise to within 2°C above pre-industrial levels.
Subsequently, each of the plans put forward recently by European nations used these
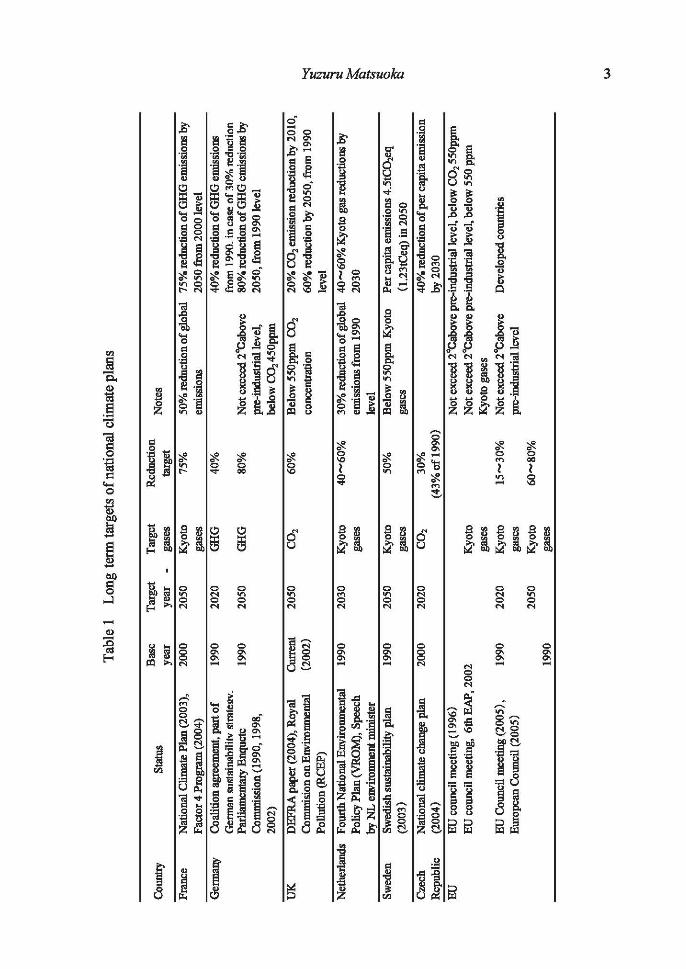
targets as a reference. Table 1 shows the targets of individual European nations. The
UK and France have established CO2 concentration objectives of 550 ppm and 450 ppm
respectively, and both have established their own CO2 reduction targets based on these
objectives. The assessment procedure is as follows:
1. Determine the worldwide emissions that will enable the target for atmospheric Co,
concentration to be achieved.
2. Assume that the per capita emissions in every country in the world will be the same.
3. Calculate an emission level that will not be exceeded after a certain year in the future.
For example, the UK plan assumes that the world population and economy will
change according to the SRES A2 scenario (IPCC 2000), and national CO2 emissions
are calculated so that per capita emissions in the nation will be equal to the worldwide
average emission allowance after 2050.
Climate change levels and impact
The level at which climate change must be stabilized depends on the estimated degree
of the impact of climate change. In the Third Assessment Report of the
Intergovernmental Panel on Climate Change (IPCC), released in 2001 (!pCC 200 1 b),
five reasons for concern were raised regarding the impact of global warming, and the
extent of the average global temperature rise predicted to have a major impact was
reported on from these five perspectives. The first concern was the impact on unique
Tab
le I
L
ong
term
targ
ets
of n
atio
nal
clim
ate
plan
s
Col
Ulb
y S
tatu
s B
ase
Tar
get
Tar
get
Red
ucti
on
Not
es
yea
r y
ear
gase
s 1a
Iget
Fra
nce
Nat
iona
l Cli
mat
e P
lan
(200
3),
2000
20
50
Kyo
to
75%
50
% re
duct
ion
of g
loba
l 7
5%
redu
ctio
n o
f GH
G e
ntis
sion
s by
F
acto
r 4
Pro
gram
(200
4)
gase
s em
issio
ns
2050
fro
m 2
000
leve
l
Ger
man
y C
oali
tion
agr
eem
ent,
part
of
1990
20
20
GH
G
40%
40
% r
educ
tion
of G
HG
em
issi
ons
Ger
man
sus
tain
abil
itv
stra
tel!V
. fr
om 1
990.
in ca
se: o
f 30
% r
educ
tion
Parl
iam
enta
ry E
nque
te
1990
20
50
GH
G
80%
N
ot e
xcee
d 2"
Cab
ove
80
% re
duct
ion
of G
HG
ent
issi
ons
by
Com
mis
sion
(199
0, 1
998,
pr
e-in
dust
rial
1eve
~ 20
50, f
rom
199
0 le
vel
2002
) be
low
co, 4
50pp
m
UK
D
EF
RA
pap
er (2
004)
, Rey
al
Cor
rent
20
50
CO
, 60
%
Bel
ow 5
50pp
m C
O,
20
% C
O, e
mis
sion
red
ucti
on b
y 20
10,
ConmmsiononEmrnn~m&
(200
2)
conc
entr
atio
n 6
0%
redu
ctio
n by
205
0, f
rom
199
0 ~
Pol
luti
on (
RC
EP
) le
vel
~ N
ethe
rlan
ds
Fou
rth
Nat
iona
l Env
irom
nent
a1
1990
20
30
Kyo
to
40
-60
%
30%
redu
ctio
n o
f glo
bal
40-6
0"10
Kyo
to g
as r
educ
tion
s by
P
olic
y P
lan
(VR
OM
), S
peec
h ga
ses
emis
sion
s fr
om 1
990
2030
~
by N
L e
nvir
onm
ent m
inis
ter
leve
l !:t
S
wed
en
Sw
edis
h su
stai
nabi
lity
pla
n 50
%
Bel
ow 5
50pp
m K
yoto
Pc
r ca
pita
em
issi
ons
4.5'
tC0:
2eq
" 19
90
2050
K
yoto
c
(200
3)
gase
s ga
ses
(1.2
3tC
eq)
in 2
050
~
Cze
ch
Nat
iona
l cli
mat
e ch
ange
pla
n 20
00
2020
C
O,
30%
40
% re
duct
ion
of pe
r ca
pita
em
issi
on
Rep
ohli
c (2
004)
(4
3% o
f19
90
) by
203
0
EU
E
U c
ounc
il m
eeti
ng (
1996
) N
ot e
xcee
d 2"
Cab
ove pr
e-in
dust
rial
1eve
~ be
low
CO
,55
0p
pm
EU
cou
ncil
mee
ting
, 6
thE
AP
,20
02
K
yoto
N
ot e
xcee
d 2"
Cab
ove pr
e-in
dust
rial
1eve
~ be
low
550
pp
m
gase
s K
yoto
gas
es
EU
Cou
ncil
mee
ting
(20
05),
19
90
2020
K
yoto
1
5-3
0%
N
ot e
xcee
d 2"
Cab
ove
Dev
elop
ed c
owtt
ries
E
urop
eao
Cou
ocil
(20
05)
gase
s pr
e-in
dust
rial
1eve
l
2050
K
yoto
6
0-8
0%
1990
ga
ses
'"

4 How much should we reduce greenhouse gas emissions?
and threatened ecosystems that are already feeling the effects of climate change.
Examples include the impact on semi -arid regions that constitute marginal regions for
agriculture, such as the Sahel regions of West Africa, as well as regions that have
experienced degradation of coastal wetlands, coral bleaching and coral death. With
regard to these phenomena, even a temperature increase of approximately 1°C would
have a serious impact. The second concern was extreme climate events - the increase in the number of floods, typhoons, heat waves and so on. An increase of approximately
1.5°C in the average global temperature would increase the risk to life, property, crops
and ecosystems in areas such as coastal lowlands, river flood plains and so on, that are
susceptible to extreme weather events. The uneven distribution of impacts provided the
third reason for concern. A temperature rise of approximately 2_3°C would boost crop
production in regions such as Russia and the Ukraine but would have a catastrophic
effect on other regions. Whether the effects would occur locally or selectively in either
developing or developed nations is also of great concern. The balance between
developing and developed nations is a particularly difficult problem. The fourth area for
concern is the global aggregate impact. This will be particularly great if the average
global temperature should increase by more than 2_3°C. Finally, the fifth reason for
concern is large-scale, irreversible and catastrophic events such as the shutdown of
thermohaline circulation, the collapse of the West Antarctic ice sheet (WAlS), the mass
extinction of forests and so on. The IPCC estimates that the threshold for the occurrence
of such events is a temperature rise of approximately 5°C. Recent studies have
estimated the threshold to be lower, at around 2-4°C. (Table 2)
The aforementioned EU proposal to limit the global temperature rise to within 2°C of
pre-industrial levels uses the present temperature as a reference point in proposing a
permissible temperature rise target of 1.4°C (2°C minus the temperature rise to date,
which stands at 0.6 °C on pre-industrial levels). Accordingly, this value is equivalent to
a target set mainly from the standpoint of reasons for concern two through to five listed
above. With regard to the first reason for concern, it goes without saying that it would
be most desirable to avoid posing any danger to those unique ecosystems already
threatened by the impact of climate change. However, as will be discussed later, even a
target of 2°C represents an enormous value that will necessitate vast reductions in
greenhouse gas emissions. Achieving this target will require not only a drastic
transformation in the system of energy supply and demand but great changes in
socioeconomic systems as well. Considering the relationship between such climate
stabilization targets and the difficulties involved in climate mitigation policy, it is
necessary to study the relevant factors and set a target that is not only feasible but also
ensures a low risk of impact from climate change.

1987
1988
1989
1990
1995
1996
1996
2DO
I 2D
OI
2D03
2002
2004
20
04
2004
20
04
2004
Tab
le 2
L
evel
s o
f dan
gero
us /
not d
ange
rous
clim
ate
chan
ge
Lev
els
of d
ange
rous
I no
t dan
gero
us c
lim
ate
chan
ge
Spe
ed o
f te
mpe
ratu
re r
ilC
<O
.I"C
1dec
adc,
spc
od o
fSL
R<
2-3
cm
/dec
ade.
Est
imat
ion
Mth
spe
cies
cha
nge
ofn
atu
ral
ecos
yste
ms,
nw
rim
um m
ovilU
! so
ced
of f
ores
ts a
nd s
ocia
l inf
rut:
ruct
urcs
. T
empe
ratu
re ris
e<2"
C~ S
peed
oft
cmpc
ratu
re r
ise<
O.0
3"C
/ de
cade
.
Spe
ed o
fSL
R <
I-2
cm
/decad
e.
Low
risk
: te
mpe
ratu
re r
iac<
1 'C
t hi
gh ri
sk:
>2"C
. Sp
eed
of
tem
pera
ture
ril
JC<
O.l
"C/d
ccad
c. S
LR
<O
.2 ...
. 0.5
m, l
IJIe
ed o
fSL
R
<2
0-5
Om
m/ d
ecad
e.
NO
teH
WM
O'U
NE
P (
1988
) A
&
UII
I1II
tU)1
of
th~
tli
scu.
uion
s a
nd
I'e
caft
nllm
dati
mu
of
the
wor
ksho
ps h~l
d in
Vm
ach(
1987
) an
dBel
lagi
o(19
87)
, WC
IP-I
. WM
OI1
D-N
o.22
5, 5
3pp.
Su
sin
, W
., I
aeg
er).
, di
Pri
mio
, J.
C.
and
Fis
her,
W.,
(19
88)
The
Cli
mal
il P
Yo
bkm
bet
wu
n S
cim
u a
nd
P
oliti
cs,
KF
A lu
elic
h.
UN
EP
lBci
jcr
Inff
titut
c (1
989)
T
he F
"II
Ra
ng
e o
f Re&
pDns
a to
An
tici
pa
ted
Cli
mat
ic Chan~,
Uni
ted
Nat
ioD
l Env
iron
men
t Pro
gram
me
GE
MS
and
The
Bci
jer
Inlt
itut
e, 1
82p.
Par
k, R
A.,
Tre
han,
M.S
., M
aule
l,P
.W.
and
How
c,R
.C.
(198
9) T
bc e
ffec
ts o
f se
a le
vel
rise
on
U.S
. co
uta
l ~ands, i
nP
otm
tia
l Ef(
ecl8
of G
loba
l Cli
mat
e C
hanR
e on
the
Uni
ted
Stat
es,
U.S
. EP
A, W
ashi
nJdo
n D
.C.
Rijl
bC11
D8D
, F
.R.
and
Sw
art,
R.J
., 1
990,
T
arge
tJ a
nd
Ind
kakw
ll o
f C
lim
atic
Cha
nge,
The
Sto
ckho
lm
Env
iron
mcn
tall
nsti
tute
, 16
6p.
Tcm
pcra
twc
rilJC
< I .
... 2
"C fr
om p
rc-i
ndua
tria
l era
, IJp
eed
<O
.2"C
/ W
BO
U (1
995)
Set
mar
iolo
t' t
he d
eriv
atio
n o
f glo
bal C
01,.
&lu
ctio
n ta
rpu
an
d tm
pim
nenl
Dti
on s
trat
egie
s.
deca
de.
Sta
tem
ent o
n th
e oc
casi
on o
fth
c F
irst
Con
fere
nce
of t
he P
arti
es t
o th
e F
ram
c\W
rk C
onve
ntio
n o
n C
lilD
ll1c
Cba
nil:c
in
Ber
lin. B
rcm
crha
vcn.
T
empe
ratu
re r
illC
<t .
... 2"
C, I
pccd
<O
.1 ..
.. O.2
"C/d
ecad
c, 8
LR
<2
0
Alc
amo,
J l
ind
Krc
ilcm
an,
E.
(199
6)
Ba
ckg
rovn
d &
po
rt p
rep
are
d f
or
the
Wor
k.ri
Kp
on
Qau
mti
fied
...
. 4O
cm, r
educ
tion
of C
O2
cmin
ion<
2 ...
. 4%
/yca
r.
Em
wio
n L
imit
atiO
ll R
edau
:tio
n O
bjec
tive
s at
the
Thi
rd M
eetin
g o
f th
e A
d H
oc
Gro
up o
n th
e B
erli
n
Tem
pera
ture
ris
e<
I ...
. 2"C
, ap
ced
<0
.1 ..
.. 0.2
"C/d
ccad
e, S
LR
<2
0
.... 4
Ocm
, red
ucti
on o
f CO
2 c
min
ion
<0
.5 ...
. L5
%/y
car.
N
ot
inte
nsit
y w
ater
sho
rtag
e in
vul
nera
ble
reg
ioo
s<4
50
.... 6
50pp
m.
Ab
ov
e 1"
C te
mpe
ratu
re i
ncr
cuc,
cor
al b
leac
hing
MU
occ
ur
glob
ally
.
Tol
erab
le li
mit
s of
mos
l: n
atum
l eco
syst
ems
am 1
-2"C
.
Ris
k o
fWA
IS c
olla
pse
is n
ot s
mal
l by
2"C
glo
bal t
empe
ratu
re
incr
ease
or
45()
ppm
CO
2.
Ris
k o
fmC
shu
tdow
n is
no
t sm
all b
y 3"
C g
loba
l tem
pera
ture
in
crea
se w
ithi
n 1 0
0 V
CIlI
lI.
Bad
infl
uenc
e to
eco
nom
ic s
ecto
rs b
y 3
.... 4
"C te
mpe
ratu
re r
ile.
Shu
tdow
n o
fmC
by
700p
pm C
O2.
WA
IS c
olla
pse
by 2
-4"C
or
55O
ppm
C02
.
Ris
k of
Orc
cnll
lOd
icc
mee
t col
laps
e by
1"C
tem
pera
ture
incr
ease
.
500/
0 o
f eco
sylf
lcm
s ca
n ad
apt 0
.1 "
C/ d
ecad
e. 3
0%
ClIO
ada
pt 0
.3"C
/
deca
de, r
apid
deg
rada
tion
by
4'"C
/ de
cade
.
Man
date
. Fra
mew
ork
Con
vent
ion
on C
limat
e C
haru
!:c. O
cncV
L 2
8 F
cbnw
v.
Mat
mok
a,Y
., M
orita
,T. a
nd K
aWllI
him
a,Y
. et a
I. (1
996)
Bac
kgro
rmdp
apeT
prep
ared
for
theA
dH
oc
Gro
up
on
the
Ber
lin
Man
dat6
• F
ram
ewor
k C
onve
ntio
n on
Cli
mat
e C
hang
e, G
enev
a. 8
-19
July
199
6 P
any,
M,N
. Am
ell,
T.
McM
ich
aclc
tal.
(2001)GlobaIE1W~ntaIChan~ (
pa
rtA
) 11
(3),
181
-183
.
Sm
ith,
J. B
., S
chel
lnhu
bcr,
H-J
. and
MiIZ
ll, M
M.Q
. (2
001)
in
eds
., 1
. 1. M
cCar
thy
ct al
. Cli
maJ
e C
hang
e 20
01,
Cam
brid
ge:
Cam
brid
ge U
nive
rsity
Pre
ss, 9
13-9
67.
Ham
, W. (
20
03
)Ba
ckg
rmm
dR
epo
rt to
tJu
Gu
ma
nA
dvi
&o
ry C
Oll1
lCil
on
Glo
bal C
hang
e (W
BG
U)
Spe
cial
R
cpo
rt9
4.
ON
eill
, B. C
. an
d O
ppen
heim
er, M
. (2
00
2)S
cim
u 2
96
(55
75)
1971
-197
2.
Rit
z, S
. and
Sm
ith,
J.
(200
4) G
loha
lEnv
iron
men
tal C
hang
e 14
(3):
201
-218
Kel
ler,
K.,
Bol
ker,
B.
M
and
Bra
dfor
d, D
. F.
(20
04)
Jou
ma
l ofE
nvir
onm
enta
lEco
nom
icll
an
d
Man
afm
Jlm
t. 4
8(1)
.723
-741
. O
ppen
heim
er, M
IIO
d A
lley
, R.B
. (2
004)
Cli
mat
ic C
hang
e 64
, 1-1
0.
Han
llCn,
J. (
2004
) Sci
mti
fic
Am
mcQ
II 2
90(3
), 6
8-77
.
Lee
man
s, R
an
d E
ickh
out,
B.
(200
4) G
loba
lEnv
irom
nmJa
l Cha
nge
(pa
rtA
) 14
, 21
9-22
8.
SL
R:
sea-
leve
l ri
se
WA
IS:
Wel
1:A
ntar
ctic
icc
.hee
l m
c: th
erm
ohal
ine
circ
ulat
ion
~ ~ ~ ,.. ~ v.

6 How much should we reduce greenhouse gas emissions?
The relationship of atmospheric stabilization targets, temperature change and emissions
The ultimate objective of the United Nations Framework Convention on Climate Change signed at Rio de Janeiro in June 1992 is "the stabilization of greenhouse gas concentrations in the atmosphere at a level that would prevent dangerous anthropogenic interference with the climate system." The Framework Convention elaborates: "Such a level should be achieved within a time-frame sufficient to allow ecosystems to adapt naturally to climate change, to ensure that food production is not threatened and to enable economic development to proceed in a sustainable manner,"
So what is the relationship between these targets for the stabilization of atmospheric concentrations, temperature change and the difficulty of emissions reductions? A model for calculating greenhouse gas emissions, the circulation of substances in the atmosphere and oceans and the accompanying climate change was used to study this relationship (Hijioka et al. 2005).
First, the target period for the analysis was set at 1990-2200, taking into consideration the time scale for a global thermal response. Emission reductions were planned so target concentrations for atmospheric stabilization would not be exceeded during this period. The climate sensitivity, I a value of long-term global
.., • ~ I'l 8 • X G 0
~ 'li • 0 .• ~
25 150
20 lOa
No reductio
15 50 • 4'C
• - - -- .. • 10 a
5 • - - -50
o -loa 1990 2010 2030 2050 2070 2090 2110 2130 2150
Year
Fig. 1 Targets ofcIimate change and emission of Kyoto gases
j ... 0
'" ~ '0 ~ • c 0 •• • ·E • .~
• 110 Ii .c 0

Yuzuru Matsuoka 7
mean temperature change when the atmospheric e02 concentration is doubled, was set to 2.6°e, and the time preference2 between present and future was set to 4% per year. Figure 1 shows the emissions of the six greenhouse gases listed in the Kyoto Protocol (hereafter "Kyoto gases")' for which the target concentration is 450-600 ppm and for which stabilization targets are not imposed. In the case of a target concentration of 450 ppm, drastic reductions (45% reduction as compared with 1990 levels by 2030) must be implemented immediately. In the case of a target concentration of 550 ppm, slight reductions (28% reduction as compared with 1990 levels by 2030) are needed, while a target concentration of 600 ppm represents a 48% increase as compared with 1990 levels by 2030. These target values are the equivalent values of e02 concentrations, which would cause the same amount of temperature change as all the main causes of climate change4 (hereafter "RF equivalent concentration"). Since they include sulfate aerosols, organic carbons and other substances that have cooling effects, the values that convert only Kyoto gases into e02 concentrations (hereafter "Kyoto gas concentration") will be higher by several dozen ppm. Moreover, as the Kyoto gas concentrations include methane, nitrous oxide and other Kyoto gases in addition to eo2, they will be higher than the e02 concentration alone by several ppm to several dozen ppm.
While the temperature will continue to rise throughout the entire period, the increase will be approximately 1. 8°e for a target concentration of 450 ppm and 2.4°e for a target concentration of 550 ppm. Table 3 shows a comparison of these changes in temperature increase, organized by target concentration. As this table shows, the temperature increase as of the year 2150 for a target concentration of 475 pm will be 1.98°e, indicating that the target concentration corresponding to the 2°e target in the previous section is approximately 475 ppm. 5
However, this relationship is greatly dependent on climate sensitivity. Table 3 shows the temperature changes for a climate sensitivity of 2.6°e, but the lPee says that the range for climate sensitivity is 1.5-4.5°e, and some studies contend that the range is even greater. Figure 2 shows the probability that the rise in long-term, global average temperature will not exceed the target temperature rise when this uncertainty is taken into account and the target concentration is set to 450-600 ppm.6
In short, for the 450 ppm target, the probability that the temperature rise will not exceed 2°e is approximately 64%, while for the 475 ppm target, the probability is approximately 51%, and for the 550 ppm target the probability is approximately 24%.

00
Tab
le 3
T
arge
ts o
f clim
ate
chan
ge, a
tmos
pher
ic c
once
ntra
tions
and
em
issi
ons
(a)
Tem
pera
ture
cha
nge
md
sea
-lev
el c
hang
e
Tar
get
Tem
pera
ture
cha
nge
Sea
leve
l cha
nge
(22m
} ("
C fr
om I!
!::-in
dust
rial e
ra)
(m fr
om 1
990)
~ 19
90
2050
21
00
2150
20
50
2100
21
50
No
redu
ctio
n 0.
60
1.98
3.
53
4.45
0.
11
0.25
0.
40
~
RF
equi
vale
nt c
once
ntra
tion
targ
ets
(incl
ude
natu
ral c
ause
s)
::! 45
0 0.
60
1.56
1.
75
1.78
0.
09
0.15
0.
20
" 47
5 0.
60
1.70
1.
94
1.98
0.
10
0.16
0.
22
~
500
0.60
1.
80
2.12
2.
17
0.10
0.
18
0.23
'"
550
0.60
1.
88
2.44
2.
52
0.10
0.
20
0.26
6'
600
0.60
1.
90
2.71
2.
84
0.10
0.
21
0.29
" is:
(b)
Atm
osp
her
ic c
once
ntra
tion
s ~ '" OJ
Tar
get
RF
equ
iv.
conc
entr
atio
n C
O2 co
ncen
trat
ion
Kyo
to g
ases
~
(EE
m)
(ppm
) (1
?El
(CO
:zeq
uiv.
,ppm
) "
1990
20
50
2100
19
90
2050
21
00
1990
20
50
2100
'"
Nor
cdu
ctio
n
348.
5 59
0.2
855.
2 35
3.3
522.
5 66
7.3
393.
4 65
6.2
888.
4 ~
RF
equ
ival
ent
con
cen
trat
ion
targ
ets
(incl
ude
natu
ral
cau
ses)
~ 45
0 34
8.5
450.
0 45
0.0
353.
3 43
8.0
433.
4 39
3.4
469.
9 45
9.1
475
348.
5 47
5.0
475.
0 35
3.3
448.
0 45
4.6
393.
4 49
7.1
485.
5 C
500
348.
5 49
9.9
500.
0 35
3.3
460.
0 47
5.5
393.
4 52
0.6
509.
7 !:l '"
550
348.
5 54
1.2
550.
0 35
3.3
491.
3 52
1.2
393.
4 56
7.9
561.
9
~ 60
0 34
8.5
559.
9 60
0.0
353.
3 51
7.0
567.
5 39
3.4
608.
2 61
5.7
'" (C
) E
mis
sion
s ::!
Tar
get
CO
2 em
issi
ons
Kyo
to g
as e
mis
sion
s ~.
G
HG
em
issi
ons
c· (p
pm)
(GtC
/lear)
(G
tCoq
tyea
r)
(GtC
oqty
oar )
~
1990
20
20
2050
21
00
1990
20
20
2050
21
00
1990
20
20
2050
21
00
." N
o re
duct
ion
7.10
10
.00
13.8
1 12
.70
9.86
14
.11
19.1
1 17
.68
11.8
6 14
.27
19.1
3 17
.69
RF
equ
ival
ent c
once
ntra
tion
targ
ets
(incl
ude
natu
ral c
ause
s)
450
7.10
8.
38
2.95
1.
70
9.86
9.
87
4.02
2.
54
11.8
6 10
.03
4.04
2.
55
475
7.10
8.
38
4.33
2.
32
9.86
11
.11
5.84
3.
16
11.8
6 11
.26
5.86
3.
18
500
7.10
8.
38
5.12
2.
89
9.86
11
.23
6.90
3.
73
11.8
6 11
.38
6.92
3.
75
550
7.10
10
.00
7.93
3.
93
9.86
13
.26
10.3
4 4.
76
11.8
6 13
.41
10.3
6 4.
78
600
7.10
10
.00
11.1
3 4.
97
9.86
13
.58
13.8
4 5.
81
11.8
6 13
.74
13.8
6 5.
83

Yuzuru Matsuoka 9
• 450 ppm
~ 47_ ~ ~ "-"-Ii ." 0.75
I J i d .•
:l' '!l u u 0
~ ~
0.25 0
.j;' {i
£ 1.5 2 2.5 3
Target, Tt.a;ot ('t)
Fig. 2 Probability of exceeding target temperature rise
The path to sustainable development and climate stabilization
The emission paths leading to climate stabilization that are shown in Figure 1 - the
model used to calculate these emission paths - are based on the economics-based approach promoted by Solow et al. (1974). This approach takes the Hicks-Lindahl
concept as the base of economic development; it magnifies the flow of income and economic welfare attainable to the extent that it will not waste the stock of assets that produce income (atmospheric environment). In this concept, the environment is held to
be one part of the capital that produces income, and priority is put on economic efficiency. The paper by Wigley, Richels and Edmonds that appeared in the January 1996 issue of Nature (Wigley et al. 1996) is well known for proposing emission paths
based on such economic concepts and pointing out problems associated with these emission paths. In that paper, the authors conducted the same type of calculations as those shown in Figure 1 and pointed out that, if the aim was to stabilize the CO2
atmospheric concentration at 550 ppm in the future, several routes were available that
would enable Co. emissions to be reduced in this manner. The authors also asserted that, rather than immediately commencing reduction measures as recommended by the IPee, emissions should instead be left to take their course until 2010 or 2020 and
10 How much should we reduce greenhouse gas emissions?
reduction measures introduced afterwards and all at once. This, they argued, would have lower economic costs. Their reasons were as follows:
• Setting the time preference to a comparatively large value and paying the costs in the future would be cheaper.
• Capital could be upgraded smoothly over a period of about 20 years. • In the future, progress in technical innovation will lower the cost of technologies.
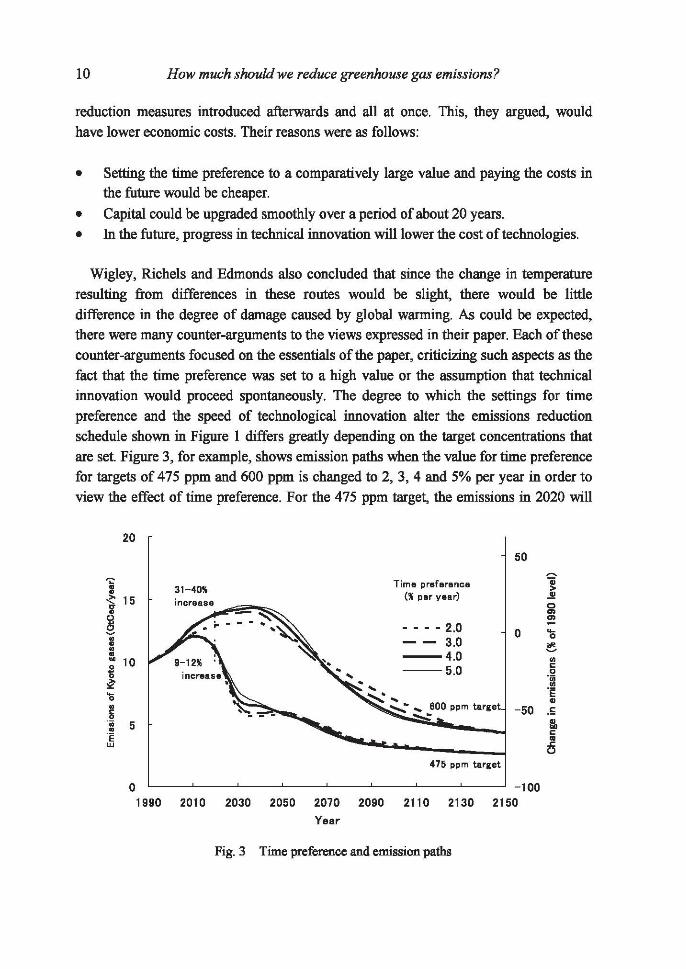
Wigley, Richels and Edmonds also concluded that since the change in temperature resulting from differences in these routes would be slight, there would be little difference in the degree of damage caused by global warming. As could be expected, there were many counter-arguments to the views expressed in their paper. Each of these counter-arguments focused on the essentials of the paper, criticizing such aspects as the fact that the time preference was set to a high value or the assumption that technical innovation would proceed spontaneously. The degree to which the settings for time preference and the speed of technological innovation alter the emissions reduction schedule shown in Figure I differs greatly depending on the target concentrations that are set. Figure 3, for example, shows emission paths when the value for time preference for targets of 475 ppm and 600 ppm is changed to 2, 3, 4 and 5% per year in order to view the effect of time preference. For the 475 ppm target, the emissions in 2020 will
20
50 ~
'" Time preference 'ii I 31-40% > ~ 15 increase
(" per year) .!!
2' 0 ... ~
... - - - - 2.0 0 'l; • 3.0 • -- ~ • • --4.0 .. 10 0
~ --5.0 c 0
:?l .~ .. 'E ~ • • -50 .5 <
0 - - -.. 5 II. • c 'E • w .s:: 0
475 ppm target
0 -100 1990 2010 2030 2050 2070 2090 2110 2130 2150
Year
Fig. 3 Time preference and emission paths

Yuzuru Matsuoka 11
vary narrowly between an increase of 9% (for a time preference of 2% per year) and
12% (for a time preference of 5% per year) on 1990 levels. However, for the 600 ppm
target, the increase will be 31-40%. The effect of time preference on targets for CO2
concentration varies considerably. It is also thought that the speed of technical progress,
especially the speed of improvements in energy efficiency, will have a great effect on
future emission paths. Figure 4 shows the results of a study conducted to determine the
impact of these developments on emission paths. The figure shows the path when, for
example, this value is varied within the range of 0.1-1.5% per year for a target of 475
ppm. In this case, the difference was relatively slight, with the increase as of 2020
varying between 12-15% compared with 1990 levels. In other words, the selection of
time preference and the estimation of the speed of technical innovation will affect the
emissions reduction schedule to some extent. However, for a severe target of 475 ppm
(or 2°C), emissions in all cases must be reduced by approximately 40% of 1990 levels
by around 2050. The result is not greatly changed by differences in the selection of time
preference and the estimation of the speed of technical innovation.
Discussions such as that of the United Nations Framework Convention on Climate
Change and of Wigley et al. (1996) define the level of dangerous climate change with
atmospheric stabilization concentrations. However, since the speed of climate change in
14
12
• § 4 •• •• E w
2
o 19SO 2010
_of ........ efficiency
irrpl"Ol6'1'el'1t ("perYlIIlr)
_··_··0.1 --0.2 .••. 0.5 ....... 1.0 --1.5
25
o
-25 ~ • §
:~ -50~
.5
~~~~----------J -75 !
2030 2050 2070 2OSO 2110 2130 Yo ..
Fig.4 Speed of technology progress and emission paths
-100 2150

12 How much should we reduce greenhouse gas emissions?
general will vary even for the same target concentration, in other words, it depends on the emission path, it is possible that these variations will also determine the degree of
adaptability of natural ecosystems or change the probability of the occurrence of unexpected phenomena such as ocean circulation changes. From this environmental capacity standpoint, discussions that focus on stabilization concentrations alone are inadequate, and attention must also be paid to the speed of climate change. The speed of
climate change has been used as an indicator of dangerous climate change levels so far (Table 2). In discussions of emission allowance that took into account the speed of
climate change (for example, Matsuoka 1998), the primary objective was to establish a
"danger zone" on the two-dimensional plane of climate change speed and change
quantity shown in Figure S. The threshold for the danger level was determined based on
knowledge such as past ecosystem response and the speed at which vegetation is able to adapt to climate fluctuations. In this, a temperature rise variation of I_2°C and a change rate of approximately O.I.Q.2"C per decade were olkn usad. Such change rate targets
were determined from the adaptability of plant species and the speed of movement
observed in the postglacial period and so on. These ranges are shown as the lightly shaded area in Figure 5. The solid line in Figure 5 is the path of temperature change
given by the emission path shown in Figure 1~ the points indicate the passing points
every 10 years starting from 1990. For the 450 ppm targe~ the level goes slightly
0.35
J 0.30
P 0.25 -f 0.20
~ i! 0.15 ~ ~ ! 0.10 'l; 1: 0.05
.1 0.00
o 1 2 3 4 5 Temperature change from 1990 (OC)
Fig.5 Temperab= change and 'Peed oftcmpemtm"c change

Yuzuru Matsuoka 13
outside the speed threshold around 2010, but it returns immediately to the shaded area. For the 475 ppm target, the level enters the danger zone before 2010 but returns to the
shaded area around 2030. For the 600 ppm target, the level enters the danger zone and thereafter does not return to the shaded area.
There are advantages and disadvantages to this kind of discussion, in which the speed
of climate change is used as an indicator of the danger level. First, the addition of the speed of climate change to the danger level indicators is more appropriate than a discussion of change levels alone. However, this approach involves much greater
uncertainty than the discussion of change levels themselves. For example:
1. What value should be used for the speed threshold? 2. To what degree does the speed of global average temperature change represent a
danger to individual regions?
3. How should we evaluate the diverse adaptability of global ecosystems to the speed of climate change?
This third point was also raised by Leemans and Eickhout (2004). In the light of all three uncertainties, we must say that serious problems remain when using the speed of change as an indicator of the danger level.
Reduction targets for Japan
up to now, each of the studies has focused on global emission allowances. How should
these global emissions be allocated to individual countries? This is the so-called burden share problem, and it is the subject of heated debate regarding equity, emission responsibility, reduction capacity and so on. In this debate, the Contraction and
Convergence (C&C) approach proposed by Meyer (2000) shows clear equity in the sense that per capita emissions for every country in the world are identical after the convergence year; for this reason, this approach has been used in the aforementioned
target-setting in the UK and France. The C&C approach comprises three main points. The first is setting the years for
when contraction is expected to begin and convergence finish. The second point is the
reduction rule during the contraction period. The third point is the extent to which the trading of emission allowances is permitted among individual countries and regions.
Since total global emissions will vary depending on the contraction method, the emission allowances following the convergence year will change as well. If reduction contraction is conducted so that total Kyoto gas emissions from all regions will become

14 How much should we reduce greenhouse gas emissions?
equal to the global emissions path shown in Figure I, the regional emissions following the convergence year will be equal to the global emissions multiplied by the population
ratio (regional population/world population). Table 4 shows the per capita emissions and necessary reduction rate during the convergence period assessed using this method for Japan, other developed nations (including countries in the former Soviet Union and
Eastern Europe) and developing nations. As this table shows, the per capita emissions
in 2050 is 0.43 tCeq / (person· year) for a target concentration of 450 ppm, 0.62 tCeq / (person· year) for a target concentration of 475 ppm, and 0.74 tCeq/ (person· year) for a target concentration of 500 ppm.
Emissions for Japan are equivalent to 12%, 18% and 21%, respectively compared
with 1990 levels. To put it another way, the reduction rate needed in 2050 to reach a target of 475 ppm (equivalent to 2°C) is 100-18 = 82% compared with 1990 levels. This value is dependent on the population setting for 2050. 82% assumes a median
value for the Japanese and world populations. When the population for Japan alone is changed to a high and a low value, the figure becomes 81 % and 84%, respectively. In
Table 4 Target concentrations and allowable emissions
Per capita _(%0£1990) emissm
(tCccV(Clpoycm) World I_ DC IllC TaJBOI: 450 IP'"
2050 0.43 41 12 11 81 2100 0.24 26 4 6 52
TaJBOI: 4751P'" 2050 0.62 59 18 15 118 2100 0.30 26 6 7 65
TaJBOI: 500 IP'" 2050 0.74 ~ 21 18 139 2100 0.36 38 7 8 77
TaJBOI: 550 IP'" 2050 1.10 105 32 27 20!
2100 0.46 48 8 11 98 TaJBOI: 600 IP'"
2050 1.48 140 43 36 279 2100 0.56 59 10 13 120
PqJJiaIicn asSUl11ii<n World,SR&<; B1
Iapan: Fsti:nati:n by NIPSSR, 2004 1990 526 1.24 U.7 39.9 2050 93.7 1.01 13.8 19.8 2100 104.1 0.64 13.1 91.1
DC: d:vekp:d COODbies IllC: less dcvclopcd COODbies (dcwlq:iqj COODbies)

Yuzuru Matsuoka 15
all cases, a reduction rate of more than 80% is needed. When the same calculations are performed for the developing world, the results are an 18% (~118-100) increase over
1990 levels and a 41 % (~100-59) reduction in per capita emissions. The necessary reduction rate decreases as the target concentration increases. For a target of 600 ppm (a temperature rise of just under 3°C), the reduction rate for Japan is 57% and the rate of
increase for the developing world is 179%. These calculations use the C&C approach and, when analyzing the results, it is
necessary to have a clear understanding of the advantages and disadvantages of this
method. The most important feature of this approach is that an equal per capita emissions allowance is provided for every country and region of the world, regardless
of whether their current emissions are high or low. This is an extremely simple rule and in this sense it is both persuasive and equitable. However, it leaves major problems unresolved with regard to economic efficiency. Second, there is the problem of great
inequity in terms of reduction burden. While the targets for developed countries are severe, some regions in the developing world will not reach their emission allowances for the next 50 years. Many revised proposals are currently being prepared to resolve
these problems and further study that includes these proposals will be needed before this approach can be applied widely.
Feasibility of Japan's 80% reduction
As noted above, Kyoto gas emissions must be reduced by approximately 80% in the first half of this century to keep the increase in global mean temperature to 2°C or less
on pre-industrial levels. European nations are drawing up plans to reduce emissions by 60-80% by 2050 and are therefore in line with this goal. In order for this goal to be achieved in the next 45 years (before 2050), a speed of transformation that is
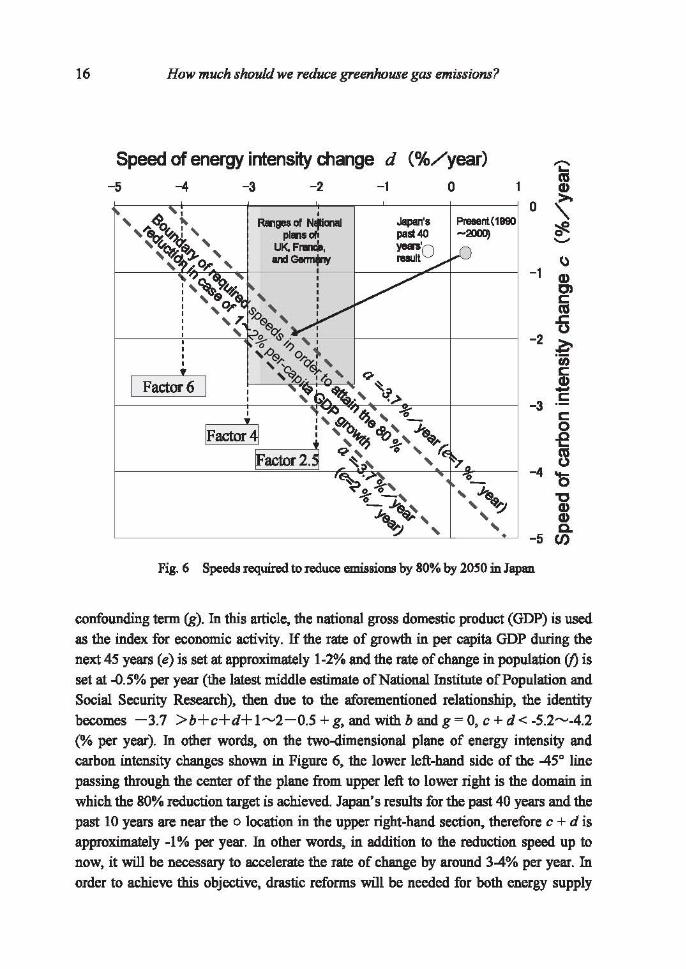
significantly faster than the pace of societal change will be needed. This section will focus on how this may be achieved, using Figure 6 for purposes of illustration.
For purposes of simplicity, I assume the target gas for reduction is limited to CO2.
Considering the increased emissions from 1990 to 2005, an 80% reduction on 1990 levels represents a reduction of approximately 82% on 2005 levels. In order to achieve the reduction in the next 45 years, a reduction speed of 3.7% per year or more will be
needed. This will be shown as a « -3.7%, with a negative value indicating a decrease in emissions). An identity exists on the a. 7 The a is a sum of following changing rates; the
rate of change in the ratio of carbon dioxide capture and storage" (b), the rate of change in carbon intensity ( c), the rate of change in energy intensity (d), the rate of change in per capita economic activity (e), the rate of change in population (j), and the
16 How much should we reduce greenhouse gas emissions?
Speed of energy intensity change d (%/year)
-5 -4 -3 -2 -1 o
"C
3l C.
-5 en Fig. 6 Speeds required to reduce emissions by 80% by 2o,0 in Japan
confounding term (g). In this article, the natiooal gross domestic product (GDP) is used as the index for economic activity. If the rate of growth in per capita GDP during the next 45 years (e) is set at approximately 1-2% and the rate of change in population (j) is set at -0.5% per year (the latest middle estimate of National Institute ofPopuiation and Social Security Research), then due to the aforementioned relationship. the identity becomes -3.7 >b+c+d+1-2-0.5 + g, and with b and g ~ 0, c + d < -5.2--4.2 (0/0 per year). In other words, on the two-dimensional plane of energy intensity and carbon intensity changes shown in Figure 6, the lower left-hand side of the 45° line passing through. the center of the plane from upper left to lower right is the domain in which the 80% reduction target is achieved. Japan's results for the past 40 years and the past 10 years are near the 0 location in the upper right-hand sectio~ therefore c + dis approximately -1 % per year. In other words. in addition to the reduction speed up to
now. it will be necessary to accelerate the rate of change by around 3-4% per year. In order to achieve this objective, drastic reforms will be needed for both energy supply

Yuzuru Matsuoka 17
and demand in the next 45 years. This will involve implementing sigoificant
improvements in energy efficiency and socio-economic efficiency· and quadrupling
macroscopic energy efficiency (equivalent to the speed of improvement of energy
intensity at 3% per year, or the reduction of primary energy to approximately 50% by
2050), while at the same time using compelling policies to introduce carbon-neutral
energy to cut carbon intensity in half (that is, by improving carbon intensity by 1.5%
per year).
European nations plan to implement similar measures. However, while this kind of
major transformation of energy systems is being planned, there are also plans that
anticipate reducing the speed of reduction by 1-2% per year (b = -1 ~-2% per year)
througb the introduction of carbon dioxide capture and storage. The speed of
transformation of socioeconomic systems needed for atmospheric stabilization is of a
scale unprecedented in history, and reaffirms the severity of the global restrictions that
have been imposed in the first half of the 21 st centory and the challenging efforts that
are needed.
Conclusion
This study has reviewed the research into the level of dangerous climate change and has
studied the degree of greenhouse gas reductions necessary to avoid reaching this level.
The results can be summarized as follows.
1. With regard to the level of dangerous climate change, there has been a great deal of
discussion and research since the Villach and Bellagio conferences of the 1980s.1O
At the very least, we are beginning to see a convergence of the debate on the view
that an increase in global mean temperature of more than 2°C on pre-industrial
levels will have serious consequences.
2. The objective of the United Nations Framework Convention on Climate Change is
to stabilize atmospheric concentrations. From the standpoint of controlling climate
change, it is appropriate to use a parameter value in which all the causes of climate
change are concentrated as the indicator of atmospheric concentration (RF
equivalent concentration). The EU uses the GHG concentration value, which only
covers Kyoto gases, as an indicator. This value is normally several dozen ppm
higber than the RF equivalent concentration.
3. In order to restrain the increase in global mean temperature to 2°C or less on

18 How much should we reduce greenhouse gas emissions?
pre-industrial levels, the target concentration (RF equivalent concentration) must be made approximately less than 475 ppm. This is equivalent to a Kyoto gas concentration of approximately 500 ppm. The temperature rise for a target of 550 ppm for Kyoto gas concentration will change year by year, but it will be approximately 2.5°C by 2150.
4. These temperature increases will change depending on the climate sensitivity. The aforementioned estimation is for a climate sensitivity of 2.6°C. Considering the uncertainty of climate sensitivity mentioned by the IPCC, there is an approximate 10% probability that, for a target of 475 ppm, the long-term rise in global mean temperature will exceed 3°C on pre-industrial levels. The probability is approximately 50% in the case of 2°C and 98% in the case of 1°C.
5. When emissions are reduced using the 475 ppm target, the rate of change in global mean temperature will reach the maximum value (0.24°C per decade) around 2020 but will fall to 0.2°C per decade or below by 2030 and will decrease thereafter. With regard to the danger level for the rate of temperature change, there are still many unknowns but, up to now, values of 0.1-0.2°C per decade have been proposed.
6. If the target concentration is set to 475 ppm, worldwide Kyoto gas emissions should be reduced to 60% of 1990 levels by 2050. Even if the time preference and technical progress settings are changed, there will be little change in this value.
7. Kyoto gas emissions per capita in 2050 for a target of 475 ppm will be 0.6 tCeq per year. If this value is used to assess reduction targets for Japan, the emission allowance in 2050 will be approximately 20% (an 80% reduction) as compared with 1990 levels. The introduction of emissions trading and carbon dioxide capture/storage methods can help lower this target, but careful study will be needed to determine the appropriate degree of introduction.
8. In order to meet the target of an 80% reduction, drastic transformations of the energy supply and demand system will be needed over the next 45 years. Future study will need to determine what changes in energy efficiency and the energy mix will be appropriate. However, to give one example, the target can be achieved by
quadrupling existing energy efficiency and cutting carbon intensity in half

Yuzuru Matsuoka 19
Notes
I In the past, the !PCC has advocated a raoge of 1.5-4.S'C for the value of climate change. In its Third Assessment Report (!pCC, 200Ia), a raoge of 1.7-4.2'C, derived from seven climate models, was revised as the value for climate sensitivity used for future projections. My article uses 2.6 °C as the value for climate sensitivity. This is not only the median value of the seven climate sensitivity values determined by the models used in the Third Assessment Report, but is also the median value for the log-normal distribution with 1.5-4.S'C as the 90"/0 confidence interval. 2 Time preference relates to people's preference to enjoy benefit in the present rather than to delay it into the future. The rate oftime preference is the rate at which the present value of utility declines as the time at which it is enjoyed moves further into the future (Markaodya et aI. 2001). 3 The Kyoto gases are: carbon dioxide, methaoe, nitrous oxide, hydrofluorocarbons (HFCs), pertluorocarbons (PFCs) and sulfur hexafluoride (SF6). The model proposed by Hijioka et aI. uses nine main types ofHFCs and three main types ofPFCs in its analysis. 4 In this study, the main causes of climate change are considered to be Kyoto gases as well as chlorofluorocarbons (CFCs), hydrochlorofluorocarbons (HCFCs), tropospheric ozone, the direct aod indirect effect of aerosols (sulfate aerosols, black carbon, organic carbon), changes in solar radiation, and albedo changes resulting from changes in land use. , The following relationship exists between the target concentration (C, RF equivalent concentration) aod the long-term change in global meao temperature (AT "",v).
AToq";v = AT,..C02 log, ( ~ ) where AT 2XC02: climate sensitivity, Co: pre-industrial CO2 concentration (280 ppm). The target concentration that will ensure AT equiv = 2°C when these values are used is 477 ppm. 6 The 90"/0 confidence interval for climate sensitivity was set between I.S-4.S'C. It is assumed to have a log-normal distribution. 7 a = b + c + d + e + f + g, where a: rate of emissions reduction (% per year), b: rate of change in the ratio of carbon capture and sequestration (C02 emissions/C02 generation), c: rate of change in carbon intensity (CO, generation/primary energy), d: rate of change in energy intensity (primary energy/GDP), e: rate of change in per capita GDP,f rate of change in population, g: confounding term. R Carbon dioxide capture and storage is an emission reduction measure consisting of the separation ofC~ from industrial and energy-related sources, transport to a storage location and long-tenn isolation from the atmosphere. 9 The socio-economic efficiency represents an overall energy efficiency of the socio-economic system including the effects of social, economical and cultural obstacles to the use of technologies and creating/accepting the prodoced utility. 10 In the 1980s, a series of international workshops were carried out by the International Council of Scientific Unions, the World Meteorological Organization, and the United Nations Environment Program. The International Conference on the Assessment of the Role of Carbon Dioxide and of Other Greenhouse Gases in Climate Variations and Associated impacts, held at Villacb, Austria in October 1985, and further workshops held in Villach and in Bellagio, Italy, in 1987, were famous for their contribution to developing global recognition of the climate change problem.
References Hijioka, Y, Masu~ T., Takahashi, K., Matsuoka, Y, Harasawa, H. (2006) 'Development of a support tool
for greenhouse gas emissions control policy to mitigate the impact of global warming,' Errvironmental
Economics and Policy Studies, accepted for publication. !PCC (2000) Special Report on Emissions Scenarios: A Special Report of Working Group III of the
Intergovernmental Panel on Climate Change, Cambridge University Press. - (200Ia) Climate Change 2001: The Scientific Basis, Cambridge University Press. - (2001b) Climate Change 2001: Impact, Adoptation, and fUlnerability, Cambridge University Press.

20 How much should we reduce greenhouse gas emissions?
Markandya, A, Perelet, R., Mason, P., Taylor, T. (2001) Dictionary of Environmental Economics, Earthscao.
Matsuoka, Y (1998) 'Rationale of quantitative targets of CO, emission reduction from the view points of global climate cbaoge,' Environmental research, pp. 27-30.
Meyer, A (2000) Contraction & Convergence: The Global Solution to Climate Change, Green Books for the Schumacher Society, 92pp.
Solow, R. (1974) 'Intergenerational equity aod exhaustible resources,' Review of Ecanomic Studies, Symposium volume.
Wigley, T.M.L., Richels, R., and Edmonds, J.A (1996) 'Economic and environmental choices in the stabilisation of atmospheric CO, concentrationa,' Nature, 379, pp. 242-245.
Yuzuru Matsuoka is a full professor at the Graduate School of Global Environmental Studies, Kyoto
University. He graduated from Kyoto University's sanitary engineering department in 1976 and has more
than 30 years' experience as an environmental aod sanitary engineer, having worked at the National
Institute for Environmental Studies, Nagoya University and Kyoto University. His recent research focuses on the integrated assessment modeling of global environmental issues, particularly climatic change. His Asia Pacific integrated assessment mode~ known as "AIM". has achieved world renown.