title imaging defects in a plate with complex geometries
TRANSCRIPT
RIGHT:
URL:
CITATION:
AUTHOR(S):
ISSUE DATE:
TITLE:
Imaging defects in a plate withcomplex geometries
Hayashi, Takahiro
Hayashi, Takahiro. Imaging defects in a plate with complex geometries.Applied Physics Letters 2016, 108(8): 081901.
2016-02-22
http://hdl.handle.net/2433/229083
© 2016 AIP Publishing LLC.; The full-text file will be made open to thepublic on 22 February 2017 in accordance with publisher's 'Terms andConditions for Self-Archiving'
Imaging defects in a plate with complex geometriesTakahiro Hayashi
Citation: Appl. Phys. Lett. 108, 081901 (2016);View online: https://doi.org/10.1063/1.4942599View Table of Contents: http://aip.scitation.org/toc/apl/108/8Published by the American Institute of Physics
Articles you may be interested inVibration energy analysis of a plate for defect imaging with a scanning laser source techniqueThe Journal of the Acoustical Society of America 140, 2427 (2016); 10.1121/1.4964275
Rapid thickness measurements using guided waves from a scanning laser sourceThe Journal of the Acoustical Society of America 126, 1101 (2009); 10.1121/1.3177268
Interaction of a scanning laser-generated ultrasonic line source with a surface-breaking flawThe Journal of the Acoustical Society of America 115, 172 (2004); 10.1121/1.1630997
Ultrasonic imaging of small surface-breaking defects using scanning laser source techniqueAIP Conference Proceedings 615, 356 (2002); 10.1063/1.1472820
Rapid, long range inspection of chemical plant pipework using guided wavesAIP Conference Proceedings 557, 180 (2001); 10.1063/1.1373757
Reflection and transmission of Lamb waves at an imperfect joint of platesJournal of Applied Physics 113, 074901 (2013); 10.1063/1.4791711
A Self-archived copy inKyoto University Research Information Repository
https://repository.kulib.kyoto-u.ac.jp
Imaging defects in a plate with complex geometries
Takahiro Hayashia)
Graduate School of Engineering, Kyoto University, Kyoto 615-8540, Japan
(Received 23 December 2015; accepted 8 February 2016; published online 23 February 2016)
This paper discusses a defect imaging technique using signals containing multiple reflected waves,
for a plate with complex geometries, in which direct waves from a generating point to a receiving
point cannot be measured. This technique utilizes a characteristic of flexural vibrations wherein the
amplitude of the received signals is approximately inversely proportional to the thickness of the
source of the elastic wave when a laser pulse is applied to the surface of the plate. First, a theoretical
modal analysis elucidated that the amplitude distributions obtained by scanning the laser source of
the elastic waves consist of thickness distributions and spurious distributions caused by multiple
reflections in the plate. The amplitude distributions were then experimentally obtained for a
complex-shaped plate with an artificial defect. The distributions were found to consist of a defect
image as well as spurious images, and this agreed well with the theoretical discussions. Clearer defect
images with small spurious images were obtained even for a plate with complex geometries by taking
an average of the images obtained at multiple frequencies. VC 2016 AIP Publishing LLC.
[http://dx.doi.org/10.1063/1.4942599]
Ultrasonic defect identification techniques are widely
used for the non-destructive evaluation of structures.1 In the
most popular and basic ultrasonic pulse echo method, defects
are located using the arrival time of an echo signal and the
speed of the waves in the material. The synthetic aperture fo-
cusing technique (SAFT)2,3 and phased array,4 in which sev-
eral ultrasonic sensor elements transmit and receive signals
which are then processed to create defect images, have also
became popular techniques. Waves travelling along a straight
path between ultrasonic transducers and reflective objects
such as defects are generally used to create such defect
images, and waves that are reflected and refracted from the
edges of the object and resonant vibrations in the object are
not considered in these techniques. In particular, in low-
frequency ultrasonic inspections such as guided-wave test-
ing,5–7 we often encounter the problem of it not being possible
to separate the direct waves and reflected waves, and therefore
defects cannot be identified. In such cases, low-frequency
vibrations resonate in the object and defects can be detected
by measuring the shift in the resonant frequencies. For exam-
ple, in facility diagnosis, we often use impact hammer testing,
in which audible sound is generated by impacting the object
with a hammer and the object is evaluated from the resonant
frequencies of the sound. Resonant spectroscopy in the ultra-
sonic range has also been studied.8 Ogi et al.9 successfully
measured the elastic-stiffness coefficients of thin films using
non-contact resonant ultrasonic spectroscopy with electro-
magnetic acoustic transducers. However, resonant spectros-
copy generally evaluates characteristics of a whole vibration
region and cannot be used for defect location and imaging.
Recently, topological sensitivity analysis10–16 has been
developed as an effective means of defect imaging based on
signals originating from multiple reflections from an object.
In the imaging method, wave fields for time-reversed inci-
dent waves from array sensors in objects with and without
defects are calculated first, and then the space function
obtained from the difference of the wave fields gives the
defect images.10,11 Rodriguez et al. created images of artifi-
cial defects in bulky media and plates by accelerating the
calculation speed in the topological imaging.12 They also
proposed the application of topological imaging to defect
imaging in a complex geometry where there is no straight
path from an ultrasonic transducer to a particular region of
interest.13 Defect images of the region were obtained by
measuring the wave fields of an intact medium in advance
and by detecting echo signals at a single transducer location
in the inspected object.14 Although topological imaging can
create defect images of an object with complex geometries at
a single transducer location, measurements in a reference
medium of the same shape and with the same boundary con-
ditions except for the defects are required, which limits its
application to practical non-destructive evaluation. This pa-
per describes a simple defect imaging technique for a plate
with complex geometries without either reference media
measurements or the calculation of wave fields.
A previous study developed a defect imaging technique
in which a flexural A0 mode of Lamb waves generated by
laser pulse applied to a thin plate is measured.17 In this study,
the hybrid calculation technique combining the semi-
analytical finite element and finite element methods revealed
that the amplitude in the A0 mode is approximately inversely
proportional to the thickness of the laser spot; this is effective
for a plate with rounded defects in the low-frequency range
below the A1 cut-off frequency. Moreover, two-dimensional
images of the thickness distribution were obtained by applica-
tion of the scanning laser source technique with a fixed ultra-
sonic receiving transducer. Then, the study used calculations
and experiments to prove that defect images could be obtained
even in a plate with square notches, with these images becom-
ing clearer in the lower frequency thickness product (fd)
range.18 The use of a low fd range enabled us to use air-
coupled ultrasonic sensors instead of contact ultrasonica)Electronic mail: [email protected]. Tel./Fax:þ81-75-383-3797.
0003-6951/2016/108(8)/081901/4/$30.00 VC 2016 AIP Publishing LLC108, 081901-1
APPLIED PHYSICS LETTERS 108, 081901 (2016)
A Self-archived copy inKyoto University Research Information Repository
https://repository.kulib.kyoto-u.ac.jp
transducers as receivers and thus realize a completely non-
contact defect imaging technique.19 The defect imaging tech-
niques utilize a characteristic of the flexural vibrations
wherein relatively large flexural vibrations are generated
when a laser beam is emitted in the vicinity of or on a defect
which is a thin area in a plate. In these studies, the direct
waves propagating in a straight path between laser emission
spots and receiving transducers were mainly used for defect
imaging. However, considering the characteristic whereby rel-
atively large flexural vibrations are generated in defective
areas by laser emission, we can infer that the imaging tech-
nique can also be applied to plates with complex geometries
where only refracted and reflected waves are measured. To
prove this, theoretical discussions using modal analysis of fi-
nite element modeling and experimental results are shown
below.
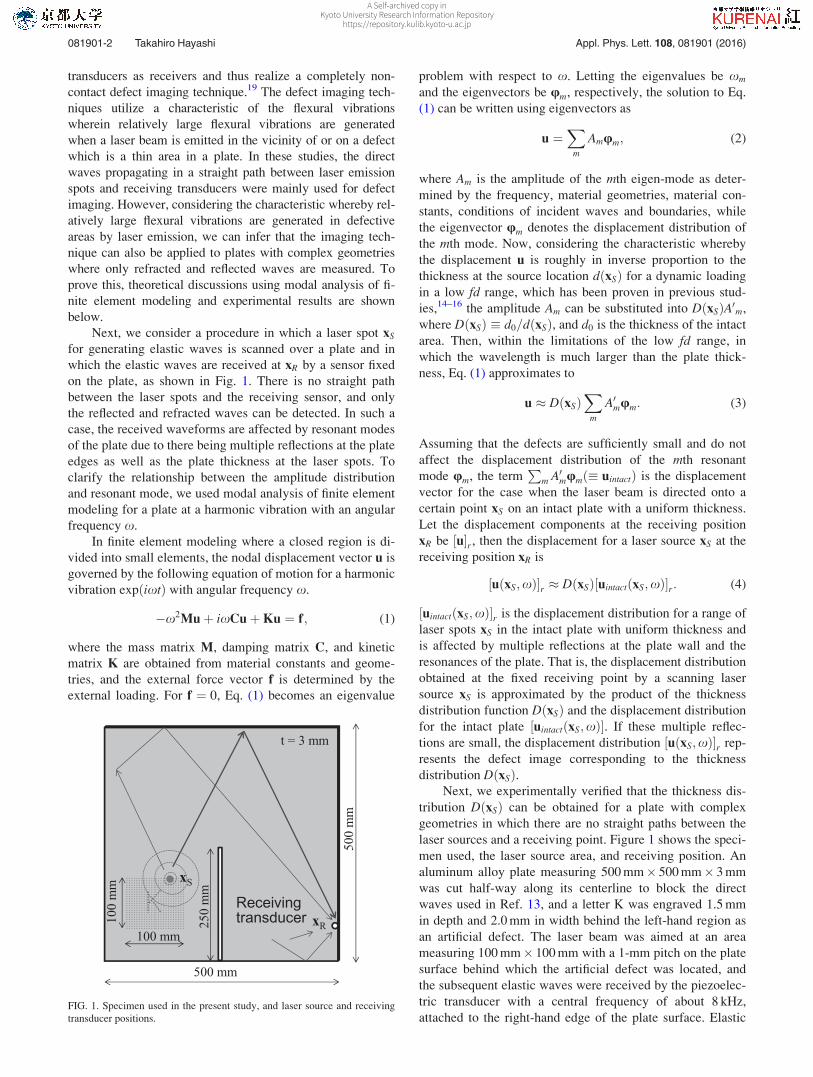
Next, we consider a procedure in which a laser spot xS
for generating elastic waves is scanned over a plate and in
which the elastic waves are received at xR by a sensor fixed
on the plate, as shown in Fig. 1. There is no straight path
between the laser spots and the receiving sensor, and only
the reflected and refracted waves can be detected. In such a
case, the received waveforms are affected by resonant modes
of the plate due to there being multiple reflections at the plate
edges as well as the plate thickness at the laser spots. To
clarify the relationship between the amplitude distribution
and resonant mode, we used modal analysis of finite element
modeling for a plate at a harmonic vibration with an angular
frequency x.
In finite element modeling where a closed region is di-
vided into small elements, the nodal displacement vector u is
governed by the following equation of motion for a harmonic
vibration expðixtÞ with angular frequency x.
�x2Muþ ixCuþKu ¼ f; (1)
where the mass matrix M, damping matrix C, and kinetic
matrix K are obtained from material constants and geome-
tries, and the external force vector f is determined by the
external loading. For f ¼ 0, Eq. (1) becomes an eigenvalue
problem with respect to x. Letting the eigenvalues be xm
and the eigenvectors be um, respectively, the solution to Eq.
(1) can be written using eigenvectors as
u ¼X
m
Amum; (2)
where Am is the amplitude of the mth eigen-mode as deter-
mined by the frequency, material geometries, material con-
stants, conditions of incident waves and boundaries, while
the eigenvector um denotes the displacement distribution of
the mth mode. Now, considering the characteristic whereby
the displacement u is roughly in inverse proportion to the
thickness at the source location dðxSÞ for a dynamic loading
in a low fd range, which has been proven in previous stud-
ies,14–16 the amplitude Am can be substituted into DðxSÞA0m,
where DðxSÞ � d0=dðxSÞ, and d0 is the thickness of the intact
area. Then, within the limitations of the low fd range, in
which the wavelength is much larger than the plate thick-
ness, Eq. (1) approximates to
u � DðxSÞX
m
A0mum: (3)
Assuming that the defects are sufficiently small and do not
affect the displacement distribution of the mth resonant
mode um, the termP
m A0mumð� uintactÞ is the displacement
vector for the case when the laser beam is directed onto a
certain point xS on an intact plate with a uniform thickness.
Let the displacement components at the receiving position
xR be ½u�r, then the displacement for a laser source xS at the
receiving position xR is
½uðxS;xÞ�r � DðxSÞ½uintactðxS;xÞ�r: (4)
½uintactðxS;xÞ�r is the displacement distribution for a range of
laser spots xS in the intact plate with uniform thickness and
is affected by multiple reflections at the plate wall and the
resonances of the plate. That is, the displacement distribution
obtained at the fixed receiving point by a scanning laser
source xS is approximated by the product of the thickness
distribution function DðxSÞ and the displacement distribution
for the intact plate ½uintactðxS;xÞ�. If these multiple reflec-
tions are small, the displacement distribution ½uðxS;xÞ�r rep-
resents the defect image corresponding to the thickness
distribution DðxSÞ.Next, we experimentally verified that the thickness dis-
tribution DðxSÞ can be obtained for a plate with complex
geometries in which there are no straight paths between the
laser sources and a receiving point. Figure 1 shows the speci-
men used, the laser source area, and receiving position. An
aluminum alloy plate measuring 500 mm� 500 mm� 3 mm
was cut half-way along its centerline to block the direct
waves used in Ref. 13, and a letter K was engraved 1.5 mm
in depth and 2.0 mm in width behind the left-hand region as
an artificial defect. The laser beam was aimed at an area
measuring 100 mm� 100 mm with a 1-mm pitch on the plate
surface behind which the artificial defect was located, and
the subsequent elastic waves were received by the piezoelec-
tric transducer with a central frequency of about 8 kHz,
attached to the right-hand edge of the plate surface. ElasticFIG. 1. Specimen used in the present study, and laser source and receiving
transducer positions.
081901-2 Takahiro Hayashi Appl. Phys. Lett. 108, 081901 (2016)
A Self-archived copy inKyoto University Research Information Repository
https://repository.kulib.kyoto-u.ac.jp
waves were generated by a fiber laser that can output laser
pulses at a high repetition rate. The output of the fiber laser
equipment could be controlled using external modulation
signals, as shown in Fig. 2. Narrowband burst waves were
generated by the laser output at a repetition rate of 120 kHz
modulated by square signals from 6 kHz to 10 kHz with a 1-
ms duration. The frequency-controlled laser output enabled
the conduction of defect imaging experiments at different
frequencies.
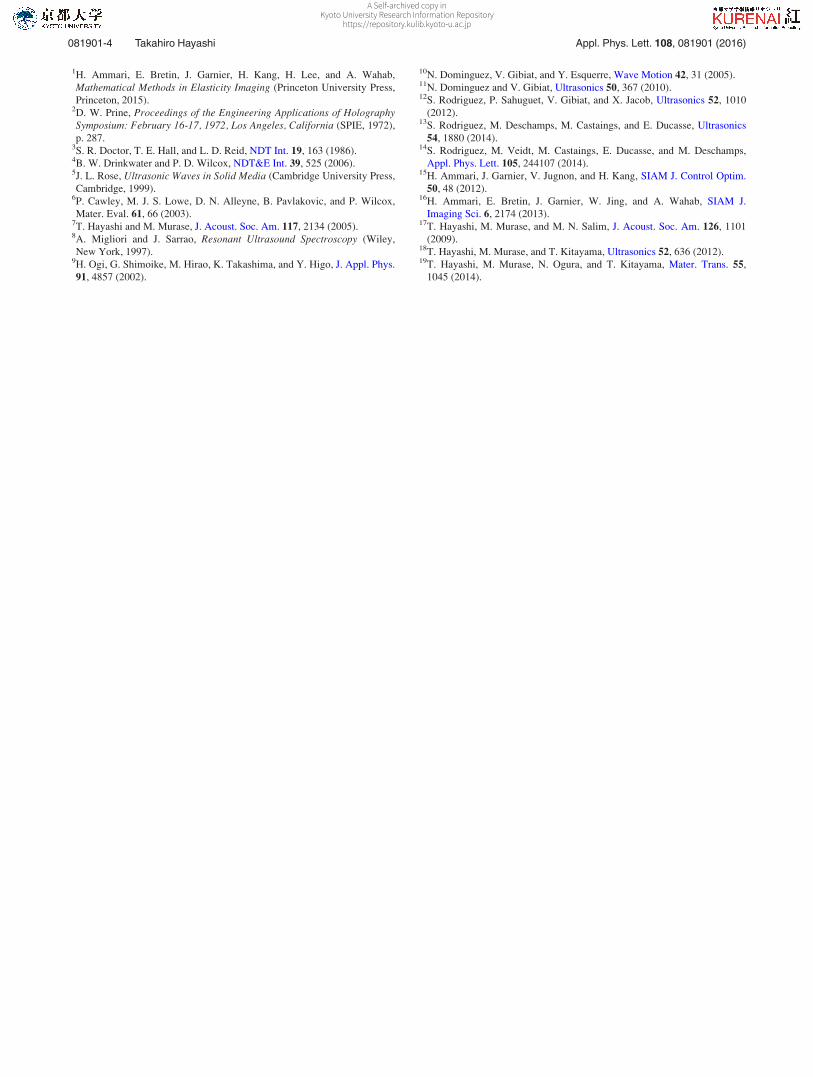
Figure 3 shows a waveform and its Fourier spectrum for
a certain location of the laser source when 8-kHz modulation
signals were applied. The signals received by the piezoelec-
tric transducer were amplified up to 60 dB by a pre-amplifier,
digitized by an analog-to-digital converter, and then filtered
by a band-pass filter from 2 to 12 kHz on a personal com-
puter. We can see, in waveform (a), that a large number of
wave packets appear after about 1 ms due to multiple reflec-
tions, and almost all of the waves disappear after 20 ms due
to the attenuation in the plate and leakage into the air. The
frequency spectrum (b) exhibits a distinct peak at about
8 kHz, which proves that frequency components correspond-
ing to the modulation signal were generated appropriately in
the experimental system.
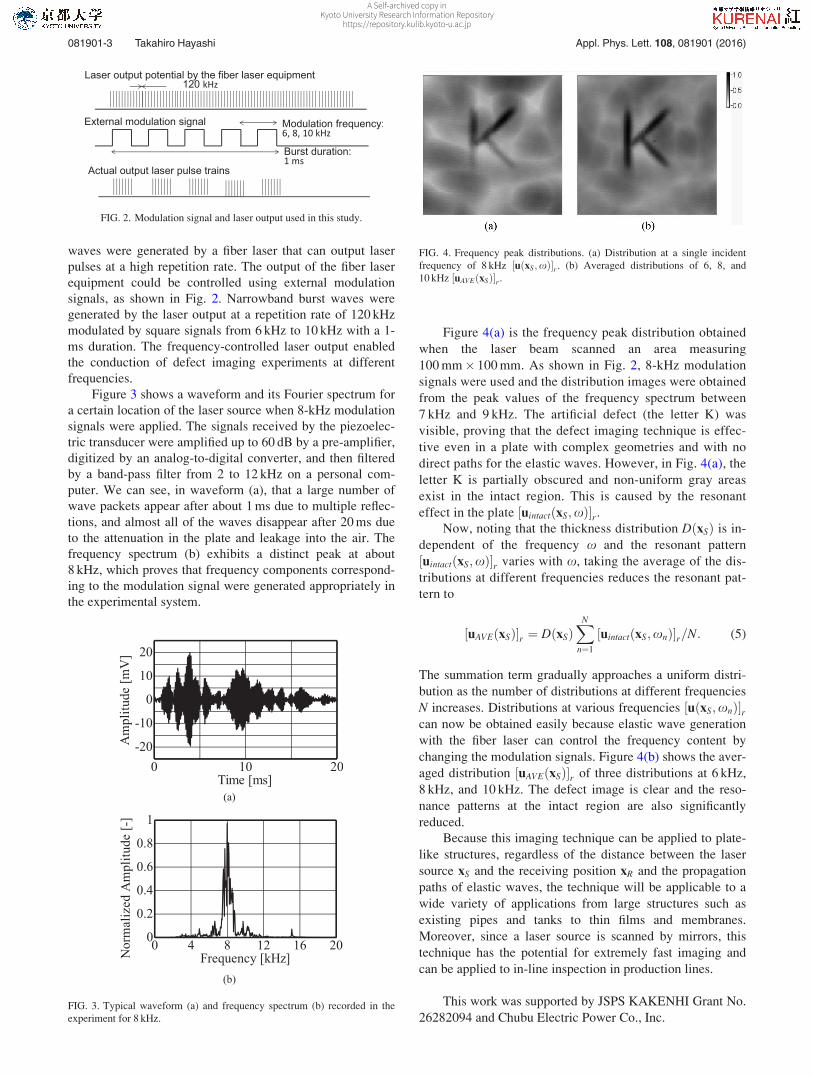
Figure 4(a) is the frequency peak distribution obtained
when the laser beam scanned an area measuring
100 mm� 100 mm. As shown in Fig. 2, 8-kHz modulation
signals were used and the distribution images were obtained
from the peak values of the frequency spectrum between
7 kHz and 9 kHz. The artificial defect (the letter K) was
visible, proving that the defect imaging technique is effec-
tive even in a plate with complex geometries and with no
direct paths for the elastic waves. However, in Fig. 4(a), the
letter K is partially obscured and non-uniform gray areas
exist in the intact region. This is caused by the resonant
effect in the plate ½uintactðxS;xÞ�r.Now, noting that the thickness distribution DðxSÞ is in-
dependent of the frequency x and the resonant pattern
½uintactðxS;xÞ�r varies with x, taking the average of the dis-
tributions at different frequencies reduces the resonant pat-
tern to
½uAVEðxSÞ�r ¼ DðxSÞXN
n¼1
½uintactðxS;xnÞ�r=N: (5)
The summation term gradually approaches a uniform distri-
bution as the number of distributions at different frequencies
N increases. Distributions at various frequencies ½uðxS;xnÞ�rcan now be obtained easily because elastic wave generation
with the fiber laser can control the frequency content by
changing the modulation signals. Figure 4(b) shows the aver-
aged distribution ½uAVEðxSÞ�r of three distributions at 6 kHz,
8 kHz, and 10 kHz. The defect image is clear and the reso-
nance patterns at the intact region are also significantly
reduced.
Because this imaging technique can be applied to plate-
like structures, regardless of the distance between the laser
source xS and the receiving position xR and the propagation
paths of elastic waves, the technique will be applicable to a
wide variety of applications from large structures such as
existing pipes and tanks to thin films and membranes.
Moreover, since a laser source is scanned by mirrors, this
technique has the potential for extremely fast imaging and
can be applied to in-line inspection in production lines.
This work was supported by JSPS KAKENHI Grant No.
26282094 and Chubu Electric Power Co., Inc.
FIG. 2. Modulation signal and laser output used in this study.
FIG. 3. Typical waveform (a) and frequency spectrum (b) recorded in the
experiment for 8 kHz.
FIG. 4. Frequency peak distributions. (a) Distribution at a single incident
frequency of 8 kHz ½uðxS;xÞ�r . (b) Averaged distributions of 6, 8, and
10 kHz ½uAVEðxSÞ�r .
081901-3 Takahiro Hayashi Appl. Phys. Lett. 108, 081901 (2016)
A Self-archived copy inKyoto University Research Information Repository
https://repository.kulib.kyoto-u.ac.jp
1H. Ammari, E. Bretin, J. Garnier, H. Kang, H. Lee, and A. Wahab,
Mathematical Methods in Elasticity Imaging (Princeton University Press,
Princeton, 2015).2D. W. Prine, Proceedings of the Engineering Applications of HolographySymposium: February 16-17, 1972, Los Angeles, California (SPIE, 1972),
p. 287.3S. R. Doctor, T. E. Hall, and L. D. Reid, NDT Int. 19, 163 (1986).4B. W. Drinkwater and P. D. Wilcox, NDT&E Int. 39, 525 (2006).5J. L. Rose, Ultrasonic Waves in Solid Media (Cambridge University Press,
Cambridge, 1999).6P. Cawley, M. J. S. Lowe, D. N. Alleyne, B. Pavlakovic, and P. Wilcox,
Mater. Eval. 61, 66 (2003).7T. Hayashi and M. Murase, J. Acoust. Soc. Am. 117, 2134 (2005).8A. Migliori and J. Sarrao, Resonant Ultrasound Spectroscopy (Wiley,
New York, 1997).9H. Ogi, G. Shimoike, M. Hirao, K. Takashima, and Y. Higo, J. Appl. Phys.
91, 4857 (2002).
10N. Dominguez, V. Gibiat, and Y. Esquerre, Wave Motion 42, 31 (2005).11N. Dominguez and V. Gibiat, Ultrasonics 50, 367 (2010).12S. Rodriguez, P. Sahuguet, V. Gibiat, and X. Jacob, Ultrasonics 52, 1010
(2012).13S. Rodriguez, M. Deschamps, M. Castaings, and E. Ducasse, Ultrasonics
54, 1880 (2014).14S. Rodriguez, M. Veidt, M. Castaings, E. Ducasse, and M. Deschamps,
Appl. Phys. Lett. 105, 244107 (2014).15H. Ammari, J. Garnier, V. Jugnon, and H. Kang, SIAM J. Control Optim.
50, 48 (2012).16H. Ammari, E. Bretin, J. Garnier, W. Jing, and A. Wahab, SIAM J.
Imaging Sci. 6, 2174 (2013).17T. Hayashi, M. Murase, and M. N. Salim, J. Acoust. Soc. Am. 126, 1101
(2009).18T. Hayashi, M. Murase, and T. Kitayama, Ultrasonics 52, 636 (2012).19T. Hayashi, M. Murase, N. Ogura, and T. Kitayama, Mater. Trans. 55,
1045 (2014).
081901-4 Takahiro Hayashi Appl. Phys. Lett. 108, 081901 (2016)
A Self-archived copy inKyoto University Research Information Repository
https://repository.kulib.kyoto-u.ac.jp