titration curves and buffering capacities of … · titration curves and buffering-capacities of...
TRANSCRIPT

TECHNICAL BULLETIN NO. 11
TITRATION CURVESAND BUFFERING CAPACITIES
OF HAWAllAN SOILS
YOSHITO MATSUSAKAG. DONALD SHERMAN
MAY 1950
UNIVERSITY OF HAWAII AGRICULTURAL EXPERIMENT STATION

TITRATION CURVESAND BUFFERING-CAPACITIES
OF HAWAIIAN SOILS
YOSHITO MATSUSAKAG. DONALD SHERMAN
UNIVERSITY OF HA WAIlCOLLEGE OF AGRICULTURE
AGRICULTURAL EXPERIMENT STATIONHONOLULU, HAWAll MAY 1950
TECHNICAL BULLETIN No. 11

CONTENTS
PAGE
AnsTRACT 5
REVIEW OF LITERATURE 7
METHODS OF ANALYSIS 8
DESCRIPTION OF SOILS 9
Chemical analyses of low humic latosol; humic ferruginous
latosol ; humic latosol ; hydrol humic latosol; reddish prairie
and brown forest soils; red desert and reddish-brown soils;
and of gray hydromorphic and dark magnesium clay soils.
EXPERII\1ENTAL R ESULTS 19
Titration curves of the latosol groups ; of reddish prairie ,
brown forest, red desert, and reddish-brown soils; of the gray
hydromorphic and dark magnesium clay soils; and of clay
fractions of certain soils. Influence of organic matter on
nature of titration curve. Variation of titration curves of
different soil families of each great soil group. Relation ship
between silica-sesquioxide ratio and nature of titration curve ;
between clay content and degree of buffering of soil; and be-
tween "free oxide" content and buffering capacity.
SUMMARY
LITERATUR E CITED
FIGURES 1-10
24
25
27

ABSTRACT
In the development of a liming program for the acid soils of theHawaiian Islands, it was found that soils of the various great soilgroups varied greatly in their lime requirement for correction ofsimilar degrees of acidity. This variation in lime requirementappeared to be associated with the differences in the bufferingcapacities of the soils. Titration curves were made on more thana hundred soils selected from the typical profiles of the soil familiesbelonging to the various great soil groups. The results of this studyhave justified the following conclusion regarding the nature of thetitration curves and buffering capacities of the tropical and subtropical soils of the Hawaiian Islands:
The buffering capacity of Hawaiian soils was much lower thanthat found for soils of the temperate regions. The buffering capacityof the soils of the different great soil groups varied greatly; however,there was very little variation in the degree of buffering exhibitedby the soils of the different soil families of each group. Each soilgroup has a typical titration curve. The soils of the low humiclatosol and humic ferruginous latosol have the lowest bufferingcapacity, and the soils of the hydro I humic latosol and brown forestgroups exhibit the greate st degree of buffering.
The organic matter fraction of the soil affects the degree ofbuffering above soil reaction of pH 5.5. It is most "active" inneutral and alkaline portions of the titration curves. However, theorganic matter fraction does not influence the nature of the curve.The general character of the titration curve is determined by thenature of the clay minerals. The kaolinite and iron oxide claysgive rise to titration curves having a low buffering capacity andmontmorillonite and hydrated aluminum oxide clays give titrationcurves having a high buffering capacity. The silica-sesquioxide ratioof the clay fraction of the soil or the quantity of clay in the soil wasnot related to the degree of buffering exhibited by the titration curveof the soil. This is probably due to the large amount of " free oxides"found in these soils. There is a direct relation ship between thecation exchange capacity of the soil and its buffering capacity. Thehigher the cation exchange capacity the greater buffering would beexhibited by the titration curve of the soil.
THE AUTHORS
YOSHITO MATSUSAKA-Assistant in Soil Chemistry, Department of Soils and Agricultural Chemistry.
G. DONALD SHERMAN-Chemist and Chairmanof the Department of Soils and Agricultural Chemistry.

ACKNOWLEDGMENTSThe authors wish to acknowledge the assistance
of the following: Dr. J. H. Beaumont for encouragement and many suggestions, Mary I. Fuss forassistance in the preparation of the manuscript, andYoshihiko Kawano for the preparation of all thegraphs included in the manuscript.

TITRATION CURVES AND BUFFERING CAPACITIESOF HAWAIIAN SOILS
YOSHITO MATSUSAKA AND G. DONALD SHERMAN
The potentiometric titration of the clay acids of soils has been used tocharacterize certain properties of soils. Such titration curves provide information regarding the neutralization point of the soil-thus the point of equivalence.Of more practical importance, these curves give the buffering capacity of thesoil, which is one of the factors to be considered in the development of a soundliming program for any type of soil. The available information on typical titration curves of tropical soils is very meager and incomplete. The HawaiianIslands have within their boundaries a wide representation of typical tropicalsoils, and, therefore, it is the purpose of this article to present the typical andcharacteristic titration curves of the great soil groups occurring in the islands.This information will be very useful in the management of soils in Hawaii andwill also provide information on this important property of tropical soils.
REVIEW OF LITERATURE
Sharp and Hoagland (16) in 1916 used electrometric titration curves tostudy the lime requirement of soils. They are credited as being the first toapply this method to the study of soils. Since then, the method has beenwidely used throughout the world for this purpose. Titration curves depict thebuffering capacity of soils. Buffering capacity is the capacity of the soil toresist a change in reaction with the addition of a base or acid. A soil with ahigh buffering capacity does not readily change its pH value. It is generallybelieved that the buffering of soils is affected by the amount and nature of theclay. Bradfield (4) has shown that soil clays are weak alumino-silicic acidsand that buffering is due to their dissociation phenomena. Bradfield's findingshave been substantiated by Truog (21). Other workers (1, 14) have foundthat the buffering capacity of soils varies directly with the amount of clay andthe silica-sesquioxide ratio. According to Baver (3) organic matter increasesthe buffering capacity of soils in the reaction range higher than pH 5.5. Healso reported that the removal of free Al20a, Fe 20a, and Si02 did not appreciably affect the buffering capacity. The application of large amounts of phosphate had no effect. Buffering capacity is thus a function of the soil colloidsand is primarily affected by the nature of the inorganic colloidal acids. Insoils having a high content of organic matter, the organic colloidal acids playan important role in the buffering of the soil in the alkaline reaction range.Anderson and Byers (1) and Runk (14) found that the buffering capacity ofsoils increased with higher organic matter content.
7
8 HAWAII AGRICULTURAL EXPERIMENT STATION
METHODS OF ANALYSISSoil samples are air-dried and passed through a 20-mesh sieve. Exchange
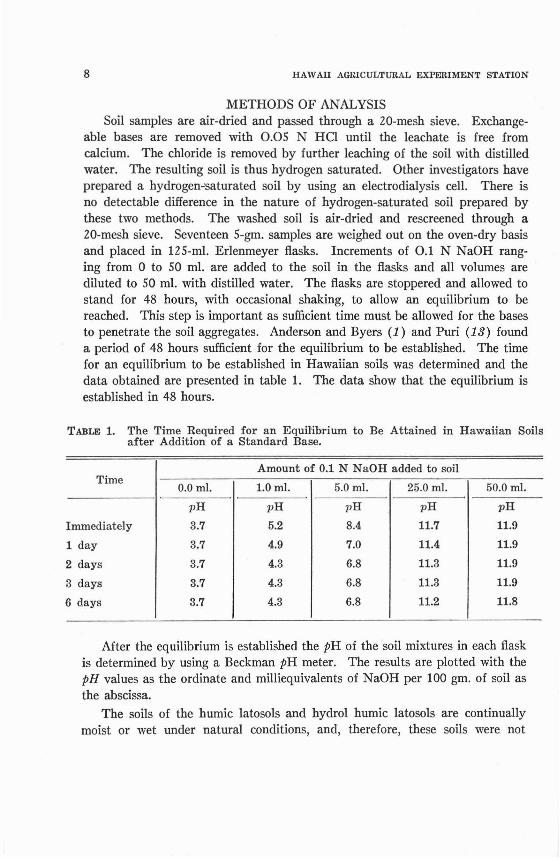
able bases are removed with 0.05 N Hel until the leachate is free fromcalcium. The chloride is removed by further leaching of the soil with distilledwater. The resulting soil is thus hydrogen saturated. Other investigators haveprepared a hydrogen-saturated soil by using an electrodialysis cell. There isno detectable difference in the nature of hydrogen-saturated soil prepared bythese two methods. The washed soil is air-dried and rescreened through a20-mesh sieve. Seventeen 5-gm. samples are weighed out on the oven-dry basisand placed in 125-ml. Erlenmeyer flasks. Increments of 0.1 N NaOH ranging from a to 50 ml, are added to the soil in the flasks and all volumes arediluted to 50 ml. with distilled water. The flasks are stoppered and allowed tostand for 48 hours, with occasional shaking, to allow an equilibrium to bereached. This step is important as sufficient time must be allowed for the basesto penetrate the soil aggregates. Anderson and Byers (1) and Puri (13) founda period of 48 hours sufficient for the equilibrium to be established. The timefor an equilibrium to be established in Hawaiian soils was determined and thedata obtained are presented in table 1. The data show that the equilibrium isestablished in 48 hours.
TABLE 1. The Time Required for an Equilibrium to Be Attained in Hawaiian Soilsafter Addition of a Standard Base.
Amount of 0.1 N NaOH added to soilTime
0.0 m!. 1.0 m!. 5.0 m!. 25.0 m!. 50.0 ml.
pH IJH pH pH pH
Immediately 3.7 5.2 8.4 11.7 11.9
1 day 3.7 4.9 7.0 11.4 11.9
2 days 3.7 4.3 6.8 11.3 11.9
3 days 3.7 4.3 6.8 11.3 11.9
6 days 3.7 4.3 6.8 11.2 11.8
After the equilibrium is established the pH of the soil mixtures in each flaskis determined by using a Beckman pH meter. The results are plotted with thepH values as the ordinate and milliequivalents of NaOH per 100 gm. of soil asthe abscissa.
The soils of the humic latosols and hydrol humic latosols are continuallymoist or wet under natural conditions, and, therefore , these soils were not

BUFFERING CAPACITY 010' HAWAII SOILS !J
allowed to dry. They were brought into the laboratory in a wet condition andwere kept moist throughout the entire procedure. This was done because it isknown that certain irreversible changes occur in these soils with drying.
Organic matter was removed from the soil by the addition of 6 percentH202 and heating to and maintaining a temperature of 60°C. This treatmentis continued until the evolution of gas with additions of H 202 ceases. The soilis then washed several times with distilled water and treated in the same manneras the soil sample. Organic matter content is determined and calculated bythe method described by Walkley (22).
The clay was separated by the method of Piper (12) with a few minormodifications. The total cation exchange capacity was determined by the useof neutral normal ammonium acetate as the replacing agent.
DESCRIPTION OF SOILS
Most Hawaiian soils are developed under a humid tropical climate whichfavors intense chemical weathering. The soil parent materials are derived fromthe volcanic lavas, cinders, and ashes which have poured out from the volcanoesat various periods in the geological history of the Hawaiian Islands. The intense weathering of these volcanic materials at different periods causes the ageof the soil to be very important. This is the reason for the occurrence of manydifferent groups of tropical soils in an area as small as the Hawaiian Islands.The primary minerals of the parent materials have weathered to secondary clayminerals , alumino-silicate minerals, which in turn have, with advancement ofsoil age, broken down into the free oxides of iron and aluminum. Kaolinitetype of clay mineral appears to be the dominant alumino-silicate mineral inHawaiian soils (6 , 20).
Laterization is the dominant soil-forming process in the Hawaiian Islands.Under laterization silica is leached from the soil solum and iron and aluminumare concentrated. In the senile stages of weathering the soil clay minerals breakdown with one of the sesquioxides, either alumina or iron oxide, becomingstabilized and becoming the dominant oxide of the soil. Under alternating wetand dry conditions kaolinite is decomposed and silica and aluminum are leachedfrom the soil solum with iron being stabilized as goethite and hematite. Titaniumwill be stabilized as anatase if present in appreciable quantities. The endproduct of soil weathering under an alternating wet and dry tropical season isthe heavy laterite crust of the humic ferruginous latosol. Under continuouslywet condtions kaolinite is decomposed. Under these condtions silica and ironare leached from the soil solum leaving an aluminous clay which probably isbauxite. Tanada (20) found that the Si02/ AIP a, SiOjFe20a, and SiOjTi02

10 H AWAII AGRICULT URAL EXPERIME NT STATION
ratios and the kaolinite content decreases with increase in rainfall . Accordingto Sherman (17) the same thing can happen with age of weathering. Dean(6) and Ayres ( 2 ~ have reported that the C:N ratio and the organic mattercontent of the soil increase with rainfall.
Soil samples representing the following ten important great soil groups werestudied : low humic latosol, humic ferruginous latosol, humic latosol, hydrolhum ic latosol, redd ish prairie, brown forest, reddi sh brown, red desert, darkmagnesium clays, and gray hydromorphic. The se great soil groups have beenidentified by Cline et al. (5) in the soil survey report for the Hawaiian I slands.
Low humic latosols, the red soils of the Hawaiian Islands , are the bestagricultural soils and on them most of the sugar cane and pineapple s are grown.These soils have excellent physical properties and respond well to fertilization.The soils of low humic latasols are found at low elevations, usually from sealevel to 1,500 feet. They are developed under a rainfall ranging from 15 to 80inches per year. The A horizon of the soil profile is weak and shallow, usuallyless than a foot in th ickness. The B horizon is from 2 to 3 feet thick andgrades gradually into the C horizon. These soils have a high clay content, 50percent or more, but have the physical properties of a silty clay loam. Thedominan t clay mineral of th is group has been identified as the kaolinite type(6, 20).
The chemical analysis of a typical soil of the low humic latosol shows thatthe soil solum has a very high content of both iron and aluminum oxides. Thesilica-sesquioxide rat io is low, ranging from 1.2 to 1.8. One of the distinguishing characteristics of the low humic latosol is its high manganese content. Thecation exchange capaci ty of these soils is low, ranging from 15 to 30 milliequivalents per 100 gm. The soil reaction of the virgin soils ran ges from pH 6.0 to7.5; but these soils have become very acid, pH 3.5-4.5, under cultivation because of the extensive use of ammonium sulfate as a fertilizer. The base saturation is medium in the virgin soil, but, likewise, under cultivation the basesaturation has been greatly reduced. These soils have a low organic mattercontent as compared to other Hawaiian soils, the usual range being 2.5 to 4.0percent. A typical chemical analysis of a soil of the low humic latosol groupis given in table 2.
Humic ferruginous latosols are developed at somewhat higher elevation andunder slightly higher rain fall than the low humic latosols. The annual rainfall ranges from 35 to 150 inches. These soils are usually found on slopes wherethere is lateral movement of water th rough the soil solum over an imperviou slayer. The color of these soils varies from a grayish-purple to a reddish-purple.

BUFFERING CAPACITY OF HAWAII SOILS 11
These soils are characterized by an abnormall y high apparent specific gravity,resulting from an accumulation of heavy minerals in the surface horizon.The lower portion of this horizon (A2 ) is hard and cemented and has the properties of the ferruginous laterite crust. The B horizon is yellowish-brown toreddish-brown, structureless, extremely friable, and has the phy sical propertiesof a silt loam in nature but contain s more than 60 percent clay on mechanicalanalysis. The C horizon is usually an impervious nonconformity or a veryplastic clay.
TABLE 2. Th e Chemical An alysi s of Soil and Clay F ractions of a Typical Low HumicLatosol , Molokai Family.
Horizon Depth Si02Al
20s Fe20s Ti02
MnOSi0 2
R 2O::
Soil An alysis In ch es P ercent P er cent Percent P C1'Cent Percen t
A 0- 8 30.4 33.8 23.8 5.2 0.34 1.05
B1
8-18 33.2 32.0 23.2 5.2 0.02 1.20
B2 18+ 30.9 32.4 26.2 5.8 0.02 1.06
Clay Analysi s
A 0- 8 32.2 32.2 22.8 3.2 0.26 1.17
B1
8-18 36.5 32.8 21.0 3.4 0.10 1.33
B2 18+ 32.6 30.2 23.8 4.8 0.10 1.22
The humic ferruginous latosols are the most highly leached soils in Hawaii.Kaolinite has been almost completely decomposed and the silica and aluminahave leached from the soil solum. Iron and tit anium oxides have accumulated,the former throu gh the entire soil solum and the latter only in the surfacehorizon. These soils usually contain approximately SO percent iron oxide and20 percent titanium oxide. The silica-sesquioxide ratios of these soils rangefrom 0.1 to 1.1. The profound leaching of these soils cannot be entirely attributed to their present medium rainfall but may be due to one or a combinationof the following factors: (1) leaching by lateral movement of water throu ghthe pervious soil solum over an impervious substratum, (2) age, and (3) higherrainfall in the past. Because of the inten se leaching these soils are strongly acid,have a low base content , and a low base saturation. The pH of these soilsranges from 4.0 to 6.5 and the cation exchange capacity ranges from 2 to 15milliequivalents per 100 gm. of soil. Table 3 presents a chemical analysis of asoil profile of the Naiwa family , a very old soil, and shows the composition of asoil approaching the end-point of lateritic weathering (18) .

TAB
LE3.
Che
mic
alA
nal
ysi
sof
aH
umic
Fer
rug
inou
sL
ato
sol,
Nai
wa
Fam
ily,
aT
ypi
cal
Fer
rug
ino
us
Lat
erit
eC
rust
ofth
eH
awai
ian
Isla
nds
.(D
ata
from
She
rman
etal
.(1
8).
)
IC
atio
nI
Ex
-B
ase
Si0
2H
ori
zon
Dep
th]J
HS
i02
Al 2
03
Fe~O
:;T
iOa
MnO
c han
geS
atu
ra-
Cap
acit
yti
on·R
2O
a-
m.e
./l0
0In
ches
Per
cen
tP
erce
nt
Per
c en
tP
erce
nt
Per
cent
gm
.P
erce
nt
A1
0-3
4.1
10.8
10.7
38.2
19.4
0.21
31.8
7.0
0.47
A2
13-
54.
25.
517
.948
.524
.70.
297.
410
.70.
19
A2
25-
114.
23.
89.
947
.525
.00.
312.
821
.10.
16
A-B
11-1
34.
05.
712
.667
.29.
40.
178.
810
.30.
18
B13
-27
4.3
5.5
7.6
78.5
7.2
0.08
18.8
3.3
0.16
C2
7+
4.3
22.8
21.7
35.4
3.3
0.19
18.6
3.9
0.87
TAB
LE4.
Ch
emic
alA
nal
ysis
ofC
ollo
ids
ofH
um
icL
ato
sol,
Kap
oho
Fam
ily,
aY
outh
fu
lH
um
icL
ato
sol
Pro
file
.(D
ata
from
Hou
gh,
Gile
,an
dFo
ster
(9).
)
Dep
thSiO~
AIP
aF
e 20
3T
i02
Mn
OS
i02
R~03
Inch
esP
erce
nt
Per
cen
tP
erce
ntP
erce
nt
Per
cen
t
0-9
22.8
426
.06
16.6
02.
060.
371.
05
9-17
23.2
6I
26.4
617
.37
2.51
0.40
1.05
17-2
524
.25
I27
.08
18.2
42.
550.
351.
05
.... l-:l =: ;I- ~ ~ £ s c: ~ c: :<l
;l t'" t'l ~ ~ '" t;j Z "'3 ~ s Z

BUFFERING CAPACITY o~' HAW All SOILS 13
The soils of humic latosols and hydrol humic latosols are developed under aheavy rainfall. The latter are formed under the heaviest rainfall in the Hawaiian Islands and the former are developed under an annual rainfall of 50 to 150inches. The rainfall is rather evenly distributed throughout the year and thussupports a heavy vegetative cover over these soils. The organic matter contentof the humic latosol ranges from 10 to 15 percent. The soils belonging to thehumic latosols are found from sea level to 3,000 feet above sea level, usuallyon wet mountain slopes. Under the wet condition the kaolinite clay is decomposing, and because of the lack of aeration iron oxides are slowly beingreduced and are leaching from the soil solum. The silica content of these soilsis very low due to its removal by leaching. Under these conditions the aluminumoxide is the stable oxide of the soil. The silica-sesquioxide ratio of the humiclatosol is approximately 0.5. These soils are strongly acid, pH 4.5 to 6.0, andhave very low base saturation. However, the cation exchange capacity of thesoil is high, approximately 45 milliequivalents per 100 gm. of soil. Accordingto Ayres (2) a large portion of the cation exchange capacity resides in theorganic matter fraction of these soils. The volume weight of the soils belonging to humic latosols is about 1.0 for soils developed on lavas and less than 1.0for soils developed on volcanic ash.
The characteristic physical properties of the humic latosols are a granularstructure in the A horizon and a clay which forms a ribbon when pressedbetween one's fingers. The aggregates of the A horizon are very water stable .The B horizon is made up of a reddish-brown to yellowish-red clay which isquite plastic in some of the profiles.
The soils belonging to the hydrol humic latosols are formed in the regionsof the Hawaiian Islands which receive the heaviest annual rainfall, 120 to 300inches. These soils are found at elevations ranging from 500 to 6,000 feet abovesea level. The vegetation is luxuriant and similar to that of the tropical rainforest. Because of the cool, moist climate these soils have a very high organicmatter content, 15 to 35 percent. The organic matter content is not detectablefrom any physical indications as the soil has the appearance of a relatively pureclay. The A horizon is well developed being a dark brown layer of about afoot in thickness . The B horizon is yellowish-red or brown, smeary clay and,in the wetter areas, is usually mottled. The organic matter content is highthrough the entire soil solum. The C horizon is usually a partially decomposedvolcanic ash or explosive volcanic materials ; however, many of these soils on thegeologically older islands are formed on lavas. One of the peculiar propertiesof the hydrol humic latosol is its great shrinkage of volume upon completedrying. For this reason the volume weight of these soils is extremely low, rang-

14 IIAWAII AGRICULTURAL EXPERIMENT STATION
ing from 0.1 to 1.0, and they have a tremendous water holding capacity of about160 percent of the dry weight. These soils will not swell after complete dehydration, thus the basic crystal structure must be altered on complete dehydration.
The soils of the hydrol humic latosol are considered to be the end-productsof laterization under continuously wet conditions. Under a wet climate iron isreduced and leached from the soil solum along with the silica. Aluminum oxideis the stable oxide and thus will be concentrated as bauxite or as one of theother hydrated aluminum oxides. The silica-sesquioxide ratio of these soilsusually is approximately 004. These soils are leached of their bases and arestrongly acid-pH 4.5 to 5.5. According to Ayres (2) the ultimate pH of thesesoils is high and most of them are at their ultimate pH or approaching it. Thecation exchange capacity of these soils is very high, ranging from 50 to 60milliequivalents per 100 gm. of soil. Again, Ayres (2) has found that as muchas 90 percent of the cation exchange capacity resides in the organic matter ofthese soils. A typical analysis of the clay is given in table 5.
TABLE 5. Chemical Analysis of Clay of Hydrol Humic Latosol, Hilo Family(Data from McGeorge (11).)
Si02 20.35 percentAl20a 47.95 percentFe
20 a 12.86 percent
SiO/R20a 0.61
The soils belonging to reddish prairie and brown forest soil groups are developed on recent volcanic ash materials on the slopes of mountain peaks of theislands of Maui and Hawaii in the regions of rainfall ranging from 25 to 100inches per year. These soils are generally very friable and support very productive crops wherever rainfall or irrigation water is adequate.
The reddish prairie soils are formed at elevations ranging from 500 to 2,000feet above sea level and in regions receiving an annual rainfall of 25 to 60 inches.The A horizon, which is a foot deep, is a dark friable silt loam. The B horizonis also a friable silt loam, lighter in color than the A horizon due to a muchlower content of organic matter. The calcium content of these soils is high, andis reflected in a near-neutral soil reaction and a base saturation of approximately90 percent. Calcium is the dominant cation of the exchangeable bases. Thesesoils are peculiar in that their silica-sesquioxide ratio is low, 0.5 to 1.0; thecation exchange capacity is relatively high, 50 to 60 milliequivalents per 100 gm.of soil.
The brown forest soils have developed at high elevations, usually from 2,000to 8,000 feet, and under higher annual rainfall, 40 to 100 inches. These soilsare darker than the reddish prairie soils because of their higher content of

TAB
LE6.
Th
eC
hem
ical
Com
posi
tion
ofT
yp
ical
Pro
file
so
fth
eR
eddi
shP
rair
iean
dB
row
nF
ore
stS
oils
.
Cat
ion
Bas
eS
i02
Soil
No.
Dep
thp
HS
i02
Al 2
0g
Fe 2
0g
Ti0
2M
nOE
x-
Sat
ura
-ch
ang
etio
nR
20
gC
apac
ity
Inch
esP
erce
ntP
erce
ntP
erce
ntP
erce
ntP
erce
nt
m.e
./l0
0P
erce
ntB
row
ngm
.F
ore
st
47-5
070-
106.
520
.229
.514
.13.
221.
2266
.26
69.0
0.89
47-5
0810
-26
7.0
28.1
36.0
16.2
3.64
0.85
69.5
176
.91.
03
47-5
092
6+
6.8
25.8
33.1
21.0
4.84
0.70
63.1
069
.40.
94
Red
dish
Pra
irie
47-5
100-
66.
433
.72
26.4
115
.62
4.41
0.74
56.9
897
.21.
58
47-5
116-
127.
023
.98
28.6
318
.20
4.8
10.
4848
.58
97.6
1.02
47-5
12'
12-2
47.
423
.46
31.2
018
.20
5.02
0.45
41.5
998
.20.
93
47-5
1324
-38
7.7
26.0
031
.81
18.0
54.
840.
3947
.16
99.8
1.02
til c:: i 51 C)
Q > ~ Q ::l >< ~ tI: > ~ tn o 8 rn f-"
c:n

TAB
LE7.
Th
eC
hem
ical
Com
posi
tion
ofth
eSo
ilC
lays
fro
mT
yp
ical
Pro
file
sof
the
Red
dish
Pra
irie
and
Bro
wn
Fo
rest
Soi
ls.
Soi
lN
o.D
epth
pH
Col
loid
Si0
2A
1 20
3F
e 20
3T
i02
MnO
Si0
2
inSo
ilR
20
3
Bro
wn
Inch
esP
erce
nt
Per
cen
tP
erce
nt
Per
cen
tP
erce
nt
Per
cen
tFo
rest
47-5
040-
96.
234
.83
7.68
16.8
033
.20
3.20
0.18
0.34
47-5
059-
176.
232
.42
9.5
829
.80
27.6
03.
400.
140.
35
47-5
0617
+5.
740
.27
9.54
29.0
33.4
04.
400.
100.
32-
---
-R
eddi
shP
rair
ie
47-5
100-
66.
456
.88
15.2
029
.00
23.2
03.
400.
330.
59
47-5
116-
127.
043
.92
17.0
041
.00
21.8
04.
600.
380.
53
47-5
1212
-24
7.4
42.2
217
.18
32.6
029
.40
4.80
0.36
0.57
47-5
13
24-3
07.
723
.96
17.7
230
.80
20.8
04.
800.
300.
68
......
C> ::::: > ~ ~ > C':l
;>;l o c:: ::; c:: ;>;l ::- " t'l .-: ~ ~ ;;: t'l Z ... ~ :. '"3 (5 Z

n UF FER I N G CAPAC I TY OF HA WA II SOILS 17
organic matter. Th e physical and chemical properti es of the brown forest andreddish prairie soils are very similar as is shown in the data presented in tables6 and 7. Because of the higher rainfall and greate r leaching, the base saturation of the brown forest soils is lower than reddish prairie and ranges from 20to 60 percent. The brown forest soils are more acid with their soil reactio nranging from pH 4.0 to 6.0. The silica-sesquioxide ratio of the clay fraction ofthe brown forest soils is extremely low, 0.6, but the cation exchange capacity isvery high, usually about 60 to 80 milliequivalents per 100 gm. of soil. This isan anomaly since the two factors, silica-sesquioxide ra tio and cation exchangecapacity, are usually directly related. This might suggest the presence of aunique type of clay in these soils.
Red desert and reddish-brown soils are found in the arid regions of theHa waiian Islands. These soils are formed on a wide variety of volcanic materials and have weathered only slightly, thus primary minera ls are abundant inthese soils. The reddish-brown soils have a deeper profile since they receive ahigher annual rainfall than the red desert soils.
The red desert soils have developed at elevations ranging from sea level to2,000 feet and under a rainf all ranging from 5 to 20 inches per year. The soilis very shallow. Gypsum and calcium carbonate are found as coati ng on thesoil gran ules. These soils have a neutral to alkaline reaction and a fairly highcation exchange capacity.
The reddish-brown soils are found from sea level to 3,000 feet. They havedeveloped under an annual rainfall ranging from 20 to 50 inches. These soilsdo have a grass cover and thus have a higher organic matter conten t than thered desert but lower than the reddish prairie. The se soils have a neutral reaction and are base saturated with exchangeable calcium as the dominant cation.The silica-sesquioxide ra tio for these soils is appro ximately 3.0, which is aboutthe highest found in the zonal soils of the islands. The typical chemical analysisis presented in tabl es 8 and 9.
The gray hydromorphic soils are found in the lowlands such as the floorsof the mountain valleys and level lands near the ocean. Th e level topography,poor dra inage, and the accumulation of magnesium salts are dominant factor sin their development. The calcium and magnesium salts are brought into thissoil in the drainage waters from the higher elevati ons and are accumulated inthese soils. This gives rise to a very heavy plasti c clay which is easily dispersed.
The soils of the dark magnesium clays have developed in very arid regionshaving an annual rainfall of 10 to 30 inches. These soils have a high accumulation of calcium and magnesium salt s in which the latter dominates to producemagnesium salinization with the occurrence of dolomitization in small area s

TAB
LE8.
Ch
emic
alA
nal
ysis
ofa
Typ
ical
Pro
file
ofR
eddi
sh-B
row
nSo
il.
Fro
mC
line,
M.
G.
etal
.(S
oil
Sur
vey
ofth
eH
awai
ian
Isla
nds
(5).
)
Sam
ple
Cat
ion
Bas
eS
i02
No.
pH
Si0
2A
l 20
aF
e 20
aT
i02
MnO
Ex
-S
atu
ra-
R2
0a
Dep
thch
a ng
eti
onC
apac
ity
m.e
./l0
0In
ches
Per
cent
Per
cent
Per
cent
Per
cen
tP
erce
nt
gm.
Per
cen
t
47-5
150-
36.
443
.52
16.0
013
.60
2.80
0.40
49.3
464
.12.
99
47-5
1'6
3-6
6.4
51.6
615
.80
10.9
02.
700.
3735
.02
87.9
3.86
47-5
176-
126.
245
.88
20.2
012
.10
2.10
0.34
·47
.49
70.3
2.79
47-5
181 2
+6.
638
.40
23.4
015
.40
3.00
0.46
55.4
994
.81.
97
TAB
LE9.
Ch
emic
alA
nal
ysi
sof
Col
loid
alF
ract
ions
ofa
Typ
ical
Red
dish
-Bro
wn
Soi
lP
rofi
le.
(Fro
mH
ough
,G
ile,
and
Fos
ter
(9).
)
Dep
thpH
Si0
2A
l 20
aF
e 20
aT
i02
Si0
2
R2
0a
Inch
esP
erce
nt
Per
cen
tP
erce
ntP
erce
nt
0-10
6.9
30.5
428
.13
13.8
52.
931.
40
10-2
17.
445
.90
24.3
310
.61
1.45
2.50
21-4
07.
335
.88
26.8
115
.09
2.35
1.67
I-'
00 :Il ~ .... § o c: ~ ~ ~ s: l'l Z >-3 ~ :5 z

BUFFERING CAPACITY OF H AWAII SOILS 19
(19) . When wet these soils are plastic clays and as these clays dry, wide anddeep cracks will develop. The se soils have a very high cation exchange capacity,60 to 80 milliequivalents per 100 gm. of soil.
EXPERIMENTAL RE SULTS
Titration curves were prepared for more than 100 soil samples represent ingthe major great soil groups occurring in the Hawaiian Islands. The curvespresented in figures 1, 2, and 3 are the typical tit ra tion curves for these soils.
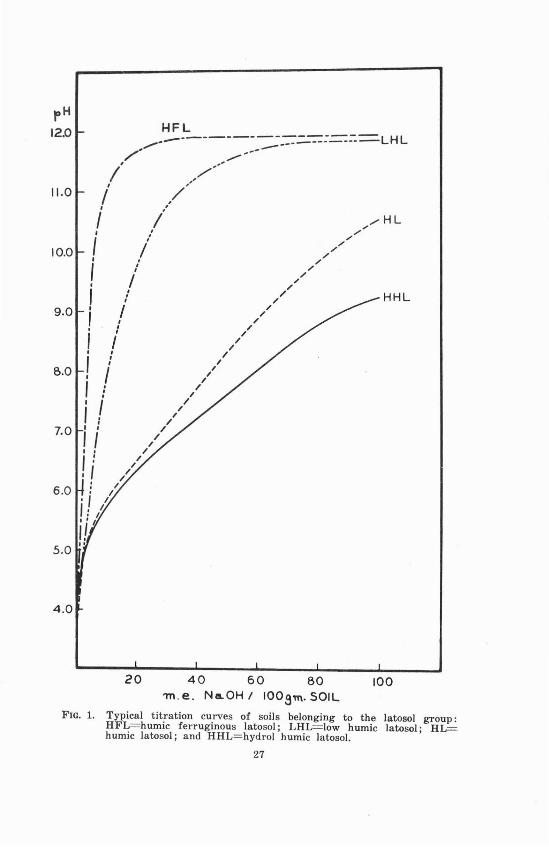
The titration curves of the latosol groups are shown in figure 1. The curvesfor these soils indicate great variation in buffering capacities. The titrationcurve for the humic ferruginous latosol was made on the soil from the A2
horizon-the ferruginous horizon- of the Na iwa family. Thi s horizon is considered to be the ferruginous laterit e crust which is the end-product of laterization under a wet-and-dry-season climate. The highly leached condition is reflected in the very low buffering capacity . On the other hand the tit ration curveof a soil from the Akaka family of the hydrol humic latosol group, a soil developed under 250 to 300 inches annual rainfall, shows a great buffering capacity. Thi s soil is rich in the aluminum oxides which are probably the endprodu ct of lat erization under continuously wet conditions. While this soil hasa very high organic matter content (17.62 percent) the buffering capacity is dueonly in part to this factor . The curves of the soils belonging to the low humiclatosol and the humic latosol lie between these two extremes. The soils of thelow humic latosol are weakly buffered, and the nature of the curve is similar tothat found for the soils of the humic ferruginous latosol. The soils of the humiclatosols have a much greater buffering capacity and possess a curve which resembles that found for the soils of the hydrol humic latosol. The titrationcurves for the soils of the humic ferruginous latosols and the low humic latosolsshow either no break or very small break in their curves, usually between pH5.5 to 6.5; whereas the curves for the soils of the humic latosols and hydrolhumic latosols develop very pronounced breaks between pH 5.0 and 6.5.
The titration curves shown in figure 2 are for soils belonging to the reddishprairie, brown forest, red desert , and reddish-brown soil groups. The curves ofthe soils of the reddish prairie, red desert , and reddish-brown soil groupsare similar in nature and in their degree of buffering. The soils of thebrown forest group have a much higher buffering capacity. All of these soilsshow a break in their ti tration curves between pH 5.0 and 6.5 and again at pH9.0 except for the soils of the brown forest group. Th e clays of these soils areof the montmorillonite type, even in the soils of the reddish prairie and brownforest groups which have a very low silica-sesquioxide ratio.

20 II AW AII AGRICULT URAL EXPERI I\IENT STATION
In figure 3 are shown the tit ration curves of soils belonging to dark magnesium clays and the gray hydromorphic groups. The curves of these are similarin nature and in degree of buffering. The curves of these soils show bufferingbetween pH 5.0 and 7.0. The soils of the Waimanalo family and the darkcolored soils of the Molokai family of the low humic latosol will exhibit curvessimilar to these curves. Thi s is probably due to the fact that these soils havemontmori llonite type of clay, whereas the majority of the soils belonging to thelow humic latosols have a kaolinite type of clay.
The data presented in figure 4 show the titration curve of the clay fract ionof certain soils. These data are presented to show if there is a difference in thenature of the titrat ion curves between the soil and its clay fraction. In everycase the titratio n curves are similar for the clay fraction and the whole soil.Th e curves for the clays show a much greater degree of buffering. The buffering of the titration curve of the clay fraction is initiated at a lower pH thanthat found for its soil. Th e greatest buffering capacity was found for the clayfraction of a soil from the dark magnesium clay group, which has the greatestcontent of clay of the montmorillonite type.
Since many of the soils of the Hawaiian Islands have a high organic mattercontent (7) , it was considered possible that a part of the buffering of the titration curves might be due to the organic matter fraction. In table 10 are givendata which show the organic matter content of Hawaiian soils before and aftertreatment with hydrogen peroxide. These soils represent Hawaiian soils whichhave a low, medium, and high organic matter content. The titration curves ofthese soils are shown in figures 5, 6, and 7. The organic matter content of thesoil of the dark magnesium clay group (2.77 percent) is too low to have mucheffect on its buffering capacity. However, in the case of the soil of hydrolhumic latosol group the reducti on of the organic matter content from 17.62percent to 1.20 percent greatly decreased the buffering capacity of the soil. Thesoil belonging to the reddish prairie group showed 5.66 percent organic mattercontent and a slight decrease in buffering with the removal of the organic matter.The results obtained from these soils have indicated that the effect of organicmatt er on the buffering of soils is the greatest at a soil reaction higher than pH5.5. This agrees with the findings of Anderson and Byers (1) and Baver (3).Saeki (1 5) reported that humus substances in soil are more soluble in thealkaline range and are precipitated in an acid medium. Thus the higher buffering capacity in the neutral to alkaline range may be attributed to a greaterdissociation of the organic compounds. However, it is evident from the titration curves in figures 5, 6, and 7 that the type of the soil clay determines thenature of the buffering curve for each soil. Th e titration curves for any parti-

BUFFERING CAPACITY OF HAWAII SOILS 21
cular soil, with or without organic matter, are quit e similar, while the titrationcurves of the three different soils aft er the removal of the organic matter showno similarity to each other. Thus the removal of organic matter does not alterthe general nature and character of the titration curve of the Hawaiian soils.
TABLE 10. Organic Matter Content of Soil befor e and after H20
2Treatment.
Before H20
2Treatment After
Soil No. Soil Type Natural IWa shed withH
20
2
Soil 0.05N HCl Treatment
Percent ! Percent Percent
49-256 Hydrol Humic Latosol 17.30 i 17.62 1.20
48-569 Reddish Prairi e 4.99 i 5.66 1.27I
i48-571 Dark Magnesium Clay I 2.78 i 2.77 0.74I
I
The experimental results show that the buffering capacitie s of Hawaiian soilsare much lower than those found for soils developed under a temperate climate.The work of Anderson and Byers (1) has shown that the soils of the podsols,gray brown podsolic, chernozems, and prairie groups are highly buffered andthat the titration curves of these soils exhibit a level break in the curve-apoint where the clay acids are neutralized by the added base. The Hawaiiansoils do not exhibit this break in their tit ration curves. The only Hawaiiansoils having a pronounced break are those of the dark magnesium clay, grayhydromorphic, and the Waimanalo family of the low humic latosol groups. Theclays of these soils are of the montmorillonite type.
The difference in the degree of buffering between the tropical and temperatezone soils is probably due to the nature of the soil clays. In general the montmorillonite type of clays is dominant in the soils of the temperate zone andkaolinite type of clay is dominant in tropica l soils. The high negative chargeof the montmor illonite type of clays causes greater adsorption of cations andbases, thus giving a higher buffering capacity to the soil. On the other hand ,the kaolinite type of clay has a low negative charge which results in a low adsorptive capacity for cations and a low buffering capacity.
Although titration curves of Hawaiian soils vary greatly, each soil grouphas its own characteristic curve which appears to be as much an inherent property as cation exchange capacity, chemical composition, profile characteristics,or textural composition. Soils developed under similar environmental conditions have similar types of clay acids, and since buffering capacit y is determined

22 H AWAII AGRICULTURAL EXPERIMENT STATION
by the type of clay, it is logical to believe that similar soils will have similartitration curves. For instance, soils of the low humic latosols collected fromthe islands of Kauai, Hawaii , and Oahu have very similar curves. The titration curves of six soil families (Molokai , Lahaina, Wahiawa, Kahana, Kohala,and Waialua) of the low humic latosol group are presented in figure 8. Thebuffering capacitie s and the general shape of the curves are similar. The titration curve of the soils of the Waimanalo family of the low humic latasol is notincluded in figure 8, since this soil is of minor importance and does not possessproperties usually associated with the low humic latosol. The Waimanalosoils, in the authors' opinion, should be classified as a dark magnesium claysince they possess every property of that soil group.
The soils of the humic ferruginous latosols are the one exception in thattheir titration curves show, in most cases, a weak buffering but in a few youthful soils exhibit considerable buffering. This 'variation may be explained thus:the soils of this group represent the end-product of laterization under a wetand dry season climate, and hence the relative degree of decomposition of thekaolinite clay and the resulting free oxide accumulation may be the importantfactor responsible for this variation. The soils of this group showing thegreatest iron and titanium oxide content s have the lowest degree of bufferingin their titration curves.
Titration curves can be considered as a relatively definite property of thevarious great soil groups, and they are used as a tool for classifying and identi fication of soils. Puri (13) , Runk (14) , and Baver (3) also believe that eachsoil has its own characteristic titration curve. Anderson and Byers (1) havestated : " Further attention should be given to the usefulness of titration curvesas a means of detecting similarities and differences in soil colloids. Perhaps nocriteria thus far utilized are more satisfactory as a means for comparing theacid character of soil colloids than are titration data over a wide range ofhydrogen-ion concentration. Some colloids may be similar at one pH andwidely different in another range."
In Hawaiian soils, the buffering capacity does not seem to be related toeither the silica-sesquioxide ratio or amount of clay in the soil. A closerelationship between these factors has been reported for soils of the temperateregions (1 , 3 ) . The silica-sesquioxide ratio is generally low in Hawaiian soilsbecause of the occurrence of lateritic weathering and low quartz content of thesoil parent material , basalt. In table 11 are given the silica-sesquioxide ratiosof soils of the humic ferruginous latosol and low humic latosol, two of the weakest buffered soils, as 0.7 and 1.5, respectively , and soils of the hydrol humiclatosol and brown forest, the strongest buffered soils, as 0.4 and 0.3, respective-

B UFFERI N G CAPAC ITY OF HAWAII SOILS 23
Soil
Low Humic Latosol . . .F erruginous Humic LatosolH um ic Lat osolHydrol H um ic LatosolRedd ish PrairieBrown F or estReddish BrownDark Magnesium ClaysGray H ydr omor phic
ly. The soils of the reddish-brown group which have a medium bufferingcapa city have a silica-sesquioxide ratio of 3.0. Individual members of thesegroups vary great ly in thei r silica-sesquioxide rati o, but again there does notappea r to be any relat ionship between th is ratio and buffering capacity.
TABLE 11. Average Si lica-S esquioxid e Ratios of H awaiian Soil s.
S j O~
Rp:;
1.50.70.50,;10.50.33.03.02.0
In figure 9 is shown grap hically the lack of a relationship between the claycontent and buffering capacity of the soil. The clay content of soils 47-249and 47-504 is approx imately the same, but the former is the least bufferedwhile the latt er is stro ngly buffered. Soil 48-456 has the highest clay conten t,60 percent , and yet its buffering capaci ty is about the same as that of 47-249,which has 34 percent clay.
Th e abnormally high Fe.O, content of Hawaiian soils, ranging from 20 to50 percent of the soil with a few as high as 75 percent , may be respsonsible forthe lack of a relationship between the buffering capacity and the silica-sesquioxide ratio and also the clay content of the soil. Brad field (4- ) has shown thatthe colloids of Al (OH) 3 have a greater buffering capacity than the colloids ofFe(OH) a and SiOz' Th e chemical composition of Ha waiian soils varies greatly,ranging from the extremely high Fe.O, content and low SiOz and AlP :! contentof the soils of the humic ferru ginous latosols to the high AlzO,: content and lowSiOz and Fe.O, content of the soils of the hydrol humic latosol group. Thu s,it is probable that soil havin g a high clay content and a low silica-sesquioxideratio may be very high in relatively inert FePa, as hematite, and low in AlzOa,and as a result the titration curves may only show weak buffering. This wouldexplain the weak buffering of the soils of the humic ferruginous latosol andlow humic latosol groups.
Another import ant factor to be considered is the high content of " freeoxides" in Hawaiian soils. Fujimoto et al. (8 )have report ed the "free oxide" content of a humic ferruginous latosol soil to be 65 percent and a "free iron oxide"

J1AWAll AGRICULT URAL EXPEIUMENT STATION
content of 52 percent. Baver (3) has found that removal of the " free oxides"does not materially affect the titration curves. Kelley et al. (10) have foundthat presence of " free iron oxide" makes the silica-sesquioxide ratio less significant. It is then reasonable to assume that with such a high content of " freeiron oxide" in Ha waiian soils, the silica-sesquioxide ratio would not be asignificant factor .
In figure 10 is shown graphically the relationship which exists between theca tion exchange capacity of the soil and the degree of buffering shown in thetitration curve. Th ere appears to be a direct relation ship between the degreeof buffering in the titration curve and the cation exchange capacity of the soil.The evidence gathered from the titration curves of a large number of soilsamples would indicat e a very positive relationship between cation exchangecapacity and buffering capacity of the soil.
It is reasonable to believe that new clay types exist in Hawaii judging fromthe variations in buffering capacity and in the nature of the titration curves ofthe soils, and from the nonconformities which exist with generally acceptedrelat ionships of buffering capacity with the silica-sesquioxide ratio s, and claycontent. Further studies such as chemical analysis, dehydration curves, differential thermal analysis, and X-ray diffract ion methods may help to identifythe nature of the type of clay minerals occurring in Hawaiian soils.
SUMMARY
As a result of studying the titration curves of over 100 Hawaiian soil samples the following conclusions appear to be justified:
1. The buffering capacity of Ha waiian soils is much lower than that ofsoils of the temperate climate regions.
2. The buffering capaci ty of the great soil groups varies greatly betweeneach group. Th e soils of the low humic latosols and humic ferruginous latosolsare the least buffered, and the soils of the hydrol humic latosol and brown forestgroups exhibi t the greatest buffering .
3. The organic matter of the soil affects the degree of buffering in a soilreacti on above pH 5.5. It is most "active" in neutral and alkaline portions ofthe titration curves. However, the nature of the soil clay determines thecharacter of the titration curve.
4. The silica-sesquioxide ratio of the soil and clay fraction is not relatedto the buffering capacity of the soil.
5. Th e clay content of the soil does not influence the degree of bufferingof the soil.
6. Neither the silica-sesquioxide rati o nor the clay content of the soil hasthe same significance in Hawaiian soils tha t it does in soils of temperate regions.

BUFFERING CAPACITY OF HAWAII SOILS 25
This may be due to the high content of Fe20 " and "free oxides" found inHawaiian soils.
7. There is a direct relationship between the cation exchange capacity ofthe soil and its buffering capacity. The higher the cation exchange capacitythe greater will be the buffering capacity of the soil.
8. Each soil group has a characteristic titration curve. Thus the natureof the clay minerals determines the nature of the titration curve and the degreeof buffering exhibited by the soil.
LITERATURE CITED(1) ANDERSON, M. S., and BYERS, H. G.
1936. NEUTRALIZATION CURVES OF THE COLLOIDS OF SOILS REPRESENTATIVE OFTHE GREAT SOIL GROUPS. U. S . Dept. Agr. Tech. Bul. 542, 38 pp.
(2 ) AYRES, A. S.1943. SOILS OF HIGH-RAINFALL AREAS IN THE HAWAIIAN ISLANDS. Hawaii
Agr. Expt. Sta. Tech. Bul. 1, 41 pp.(3) . BAVER, L. D .
1931. THE NATURE OF SOIL BUFFER ACTION. Jour. Amer. Soc. Agron. 23:587-605.
(4) BRADFIELD, R.1923. THE NATURE OF THE CIIEMICAI, RELATIONS OF COLLOIDAL CLAY. Colloid
Symposium Monograph 1: 369-391. Dept. Chemistry, University ofWisconsin, Madison.
(5) CLINE, M. G., et. al.(In pres s) SOIL SURVEY OF THE HAWAIIAN ISLANDS. U . S. D ept. Agr. Soil
Survey Bul.(6) DEAN, L. A .
1947. DIFFERENTIAL THERMAL ANALYSES OF HAWAIIAN SOILS. Soil Sci. '63 :95-105.
(7)1937. THE EFFECT OF RAINFALL ON CARBON AND NITROGEN CONTENTS AND
CARBON-NITROGEN RATIOS OF HAWAIIAN SOILS . S oil S ci. Soc. Amer.,Proc. 2: 455-459.
(8) FU.TIMOTO, GIICHI, SHERMAN, G . DONALD, and CIIANG, ADA E.1948. THE CHEMICAL COMPOSITION OF THE SEPARATED MINERAL FRACTIONS OF
A FERRUGINOUS HUMIC LATOSOL PROFILE. Soil S ci. Soc. Amer., Proc.13: 166-169.
(9) HOUGH, G . J., GILE, P . J ., and FOSTER, Z. C.1941. ROCK WEATHERING AND SOIL PROFILE DEVELOPMENT IN THE HAWAIIAN
ISLAND S. U . S . D ept. Agr. Tech. nul. 752, 32 pp.(10) KELLEY, W. P ., DORE, W. H., WOODFORD, A. 0., and BROWN, S. M.
1939. THE COLLOIDAL CONSTITUENTS OF CALIFORNIA SOILS. Soil Sci. 48: 201255.
(11) MCGEORGE, W. T.1917. COMPOSITION OF HAWAIIAN SOIL PARTICLES. Hawaii Agr, Expt. Sta.
Bul. 42, 12 pp.(12) PIPER, C. S.
1944. SOIL AND PLANT ANALYSIS. 368 pp. Interscience Pub. Inc., New York.(13) PURl, A. N.
1938. TITRATION CURVES AND DISSOCIATION CONST ANTS OF SOIL ACIDS. SoilSci. 45: 359-3'67.
(14) RUNK, C. R.1925. HYDROGEN-ION CONCENTRATION, BUFFER ACTION, AND SOIL TYPE AS A
GUIDE TO THE} USE OF LIME. Jour. Am er. Soc. Agron. 17: 345-353.

26 HAWAII AGRICULTURAL EXPERIMENT STATION
(15 ) SAEKI, H .1939. SOILS AND FERTILIZERS. No.2; STUDIES ON H UM US- CLAY COMPLEXES.
'I'a ihoku Imp. Univ., Faculty Sci. and Agr., Mem, Vol. 2 5, 200 pp.(16) SHARP, L. T., and HOAGLA ND, D . R.
1 91 6 . ACIDITY AND ADSORPTION IN SOILS AS MEASURED BY THE HYDROGEN ELECTRODE. Jour. AgT. Res. 7 : 123-145.
( 17 ) SUERIIIAN, G. DONALD .1949. FACTORS INFLUE NCI NG TH E DEVELOPMENT OF LATERITI C AND LATERITE
SOILS IN THE HAWAIIAN ISLANDS. P acific Sci. 3 : 3 0 7-3 14 .( 18 ) --- FOSTER, Z. C., and FUJIMOTO, C. K .
1948. SOME OF THE PROPERTIES OF THE FERRUGINOUS IIUMI C LATOSOLS OF THEHAWAIIAN ISLAND S. Soil Sci. Soc. Amer., Proc. 13: 471-476.
(19) --- KANEHIRO, Y., and F UJIMOTO, C. K.1947 . DOLOMITIZATION IN SEMI-ARID II AWAII AN SOILS. Pacific S ci. 1 : 3 8 -44 .
(20) TANADA, T.( In pres s) CERTAIN PROPERTIES OF THE INORGANIC COLLOIDAL FRACTION OF
HAWAIIAN SOILS . Jour. Soil Sci. [ G t . Brit . ](21) TRUOG, E .
1925 . TIlE COLLOID CHE MISTRY OF SOILS. C oll oid Symposium M onograph 3:228-240. Chemical Catalog Company, Inc., New York, N. Y.
(22) WALKLEY, A.1935. AN EXAMINATION OF METHODS FOR DETERMINING ORGANIC CARBON AND
NITROGEN IN SOILS. J ou r. AgI'. Sci. 2 5 : 5 9 8-6 09 .
pH12.0
11 .0
10.0
9.0
B.O
7.0
6.0
5.0
~~---------===:==::'==LHL......~ - ---/' ...... ~ ~-
/ ,,/'.., ,
I ,/i /'i /i ,..I /
I ! HHL, /Ij ii !I II f, II :I I
I Ii !I I
4 .0
10020 40 60 BO'TTl .e. Ne.OH I 100,9m. SOIL
F IG. 1. T yp ical titration curves of soils belonging to the latosol grou p:H FL=humic ferruginous latosol ; LH L=low humic latosol; H L=humic la to sol ; a nd HH L=hydrol hu mic latosol.
27

pH12.0
10020 40 6 0 BOIT\.e. Na.OH 11003'\'1'\. SOIL
FIG. 2. Typical ti tration curves of soils belonging to the younger zonal soils:RD=red desert j RB= r edd ish -b rown j RP= -eddish prairie j a nd BF =brown forest .
28

pH12.0
11.0
10.0
9.0
8.0
7.0
6.0
5 .0
;./
//
/I
II
IIIIIIIII
II
II
II
II
'I'I
'I'I
'I'/
'/'/
'/'/
//
/v
10020 40 60 80rn.e . Na.OH ! 100S"".SOIL
FIG 3. Typical t itration curves of soils belon ging to th e intrazonal magn esium group s : GH =gray hydr omor phic and DMC=dark magnesiumcla ys.
29

30
pH12.0
~_-----LHL
11.0
10.0
9.0
8.0
7.0
20 40 60 80 100-m.e . Na.OH / 1003"" SOIL
FI G. 4. Typical ti trat ion curves of soil clays: LHL=low humic Iatosol ;HL=humic latosol; RP=reddi sh prairie ; and DM C= dark magnesiu mclays.

pH
12.0
11.0
10.0
9.0
B.O
7.0
6.0
5.0
4.0
ORG ANIC M AT T E R
REMOVED , .... -,"/'
/'
/' ORGANI C M ATTER/ '-- NOT REMOV ED
II
II
II
II
IIIIII
II
I
10020 40 60 80m.e , Na.OH I 100.3m . SOIL
F IG. 5. T itratio n curves of a soil of the dark magn esium clay group. showing no effect of organic matter on the bufferi ng capacity.
ai

pH
12.0
ORGANIC MATTERREMOVED
11.0
10.0
9.0
B.O
7.0
6.0
5 .0
....--.,"'"'"/
///
/<. ORGANIC MATTER// <, NOT REMOVED
//
//
//
//
//
I/
/I
II
II
II
II
II
'I
4.0
10020 40 60 80m.e , Na.OH I 100 sm. SOIL
F IG. 6. T itrat ion curves of a soil of the reddish prairie group, showing sligh teffect of organic ma t ter on the buffering ca pacity.
32

pH
12.0
11.0
10.0ORGANIC MATTER
REMOVED
9.0
8.0
7.0
6.0
5 .0
4.0
20 40 60 80 100-rn.e , NaOH I lOa$"" SOIL
FIG. 7. T it ration cu rves of a soil of th e hydrol humic latosol group, showingthe effect of or gan ic matter on th e buffering ca pacity.
33

pH
12.0
11.0
10.0
9.0
8.0
7.0
6.0
N-3
5.0
4.0
10020 40 60 80rn.e . NaOH / 100311\. SOIL
F IG. 8. T ypical titration curves of soils f r om soil fa mil ies of th e low humiclatosol group : N- l = Molokai famly; N-2= Lahaina f amily ; N-3=Wahiawa fam ily; N-4=Kahana family; N- 5= Koha la fam ily ; andN-6 = Waia lua fam ily.
34

HFL-2
pH
12 .0
11.0
10 .0
9.0
B.O
7.0
6 .0
5 .0
4 .0
HFL-I _----:-...::.=-''....------.i->: ,--,- ."....-: -:, ,
/ ,ILHL
" /, ,/ /: 'i ,I
, /, ,I /I ,i II ', II , ...-- SF
"I .>I .......
1/ ........... -- .......II ............... ----....ill .",.-" *,,
.... 'I ...'. "":/ /'II I
1//
20 40 6 0 BO 100m.e. NaOH I 1003m. SOIL
F IG. 9. Ti tration curves of soils show ing la ck of relati onsh ip betw een clayconte n t and buffering ca pacit y: HFL-1= humic f errugi nous la t osol,soil no. 47-249, 34.34 percent cla y content; LH L= low humic la tosol,soil no. 48-456,60.00 percent clay conte nt ; H F L-2=humic ferruginousla tosol, soil no. 47-251, 53.34 percen t clay content; a nd BF=brownforest , soil no. 47-504, ~4 .83 percen t cla y conte nt.
35

HL
I"H12.0
11.0
10 0
9.0
8.0
7.0
6.0
5.0
4.0
_---------------------HFL... ... - -------. - LHL
.: .------,. ,-I ..I , /
" /I ,I II I
I ,I, I'
: /, ,I :
: /I II ,I I
: II :I I
: II ,I 'I 'I II •I I
i iI iI ,I,I I
'i
20 40 60 807l1. e. Na..OH / 100.9"'. SOIL
100
F IG. 10. T itration curves of soils showing close rela ti ons hip between ca tio nexchange cap acity and bu ffering ca pacity : H F L=humic fer ruginousla tosol, 2.89 m.e.l100 gm . ; LHL=low humic Iatosol, 14.18 m.e./100gm. ; HL=humic latosol, 45.08 m.e./100 gm. ; and BF=brown forest ,8!l.21 m.e./100 gm,
36

UNIVERSITY OF HAW AllCOLLEGE OF AGRICULTURE
AGRICULTURAL EXPERIMENT STATIONHONOLULU, HAWAII
GREGG M. SINCLAIRPresident of the University
H. A. WADS WORTHDean of the College
J. H. BEAUMONTDirector of the Experiment Station