titre de la presentation power point...2016/11/08 · 3q16 3q15 9m16 9m15 exceptionals exchange...
TRANSCRIPT

3Q16 Results November 8, 2016
November 8, 2016
Disclaimer
This media release may contain objectives and comments relating to the objectives and strategy of Natixis. Any such objectives inherently depend on assumptions, project considerations, objectives and expectations linked to future and uncertain events, transactions, products and services as well as suppositions regarding future performances and synergies.
No assurance can be given that such objectives will be realized. They are subject to inherent risks and uncertainties and are based on assumptions relating to Natixis, its subsidiaries and associates, and the business development thereof; trends in the sector; future acquisitions and investments; macroeconomic conditions and conditions in Natixis' principal local markets; competition and regulations. Occurrence of such events is not certain, and outcomes may prove different from current expectations, significantly affecting expected results. Actual results may differ significantly from those implied by such objectives.
Information in this media release relating to parties other than Natixis or taken from external sources has not been subject to independent verification, and Natixis makes no warranty as to the accuracy, fairness or completeness of the information or opinions herein. Neither Natixis nor its representatives shall be liable for any errors or omissions or for any harm resulting from the use of this media release, its contents or any document or information referred to herein. Figures in this presentation are unaudited.
2

Slight increase in AuM to €798bn at Sept. 30, 2016, an €11bn rise vs. June 30. Margins were flat in the US YoY, and improved in Europe over 9M16
Strong growth in total turnover for Insurance to €5.5bn in 9M16 (up 25% vs. 9M15)
3Q16 buoyed by very solid CIB results
(1) See note on methodology (2) Based on CRR-CRD4 rules as reported on June 26, 2013, including the Danish compromise - without phase-in except for DTAs on tax-loss carryforwards and pro forma of additional phase-in of DTAs following ECB regulation 2016/445
3 November 8, 2016
SFS
INVESTMENT SOLUTIONS
CORE BUSINESSES ACTIVITY NATIXIS’ 3Q16 & 9M16
CIB
RESULTS(1)
Natixis’ net revenues increased 8% in 3Q16 to more than €2.1bn, driven primarily by CIB (net revenues +15% vs. 3Q15 excl. CVA/DVA)
Cost of risk normalized at 30bps in 3Q16
Earnings capacity of €315m, up 14% vs. 3Q15 and up 3% in 9M16 to more than €1bn, despite the sharp jump in contribution to the Single Resolution Fund
ROE from core businesses stood at 12.6% for 9M16
Global Markets: robust business, with very sound performances from Fixed income (revenues up 39% vs. 3Q15)
Steady showing from M&A and structured finance, with proportion of revenues generated from fees of 36% (a gain of 1pp vs. 3Q15)
Continuation of strong momentum witnessed since start of 2016 in Specialized financing
Generation of 104bps of CET1 ratio(2) since start of 2016, i.e. close to €1.2bn, including €700m beyond the minimum 50% payout, for distribution in the absence of external growth
CAPITAL GENERATION

Sound foundations for the new 2018-2020 strategic plan
4
First steps of the new 2018-2020 strategic plan
Transformation and Business Efficiency(1): €250m in cost savings from end-2019
(25% end-2017, 65% end-2018 and 100% end-2019) SFS: creation of a business line bringing together all payment
activities at Natixis on behalf of Groupe BPCE
November 8, 2016
(1) Plans will be subject to the consultation process with employee representatives
November 8, 2016
5
Agenda
1. 3Q16 and 9M16 results
2. Business division results
3. First steps of the new 2018-2020 strategic plan
4. Conclusion
November 8, 2016
Exceptional items(1)
November 8, 2016 6
(1) See note on methodology
In €m 3Q16 3Q15
9M16 9M15
Exceptionals
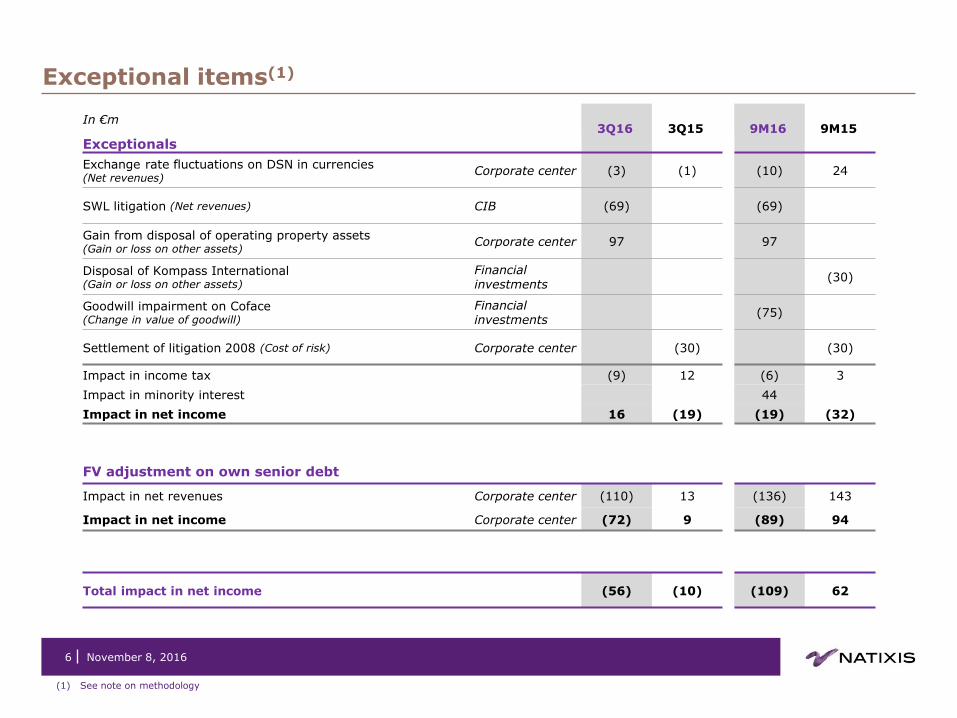
Exchange rate fluctuations on DSN in currencies (Net revenues)
Corporate center (3) (1) (10) 24
SWL litigation (Net revenues) CIB (69) (69)
Gain from disposal of operating property assets (Gain or loss on other assets)
Corporate center 97 97
Disposal of Kompass International (Gain or loss on other assets)
Financial investments
(30)
Goodwill impairment on Coface (Change in value of goodwill)
Financial investments
(75)
Settlement of litigation 2008 (Cost of risk) Corporate center (30) (30)
Impact in income tax (9) 12 (6) 3
Impact in minority interest 44
Impact in net income 16 (19) (19) (32)
FV adjustment on own senior debt
Impact in net revenues Corporate center (110) 13 (136) 143
Impact in net income Corporate center (72) 9 (89) 94
Total impact in net income (56) (10) (109) 62

Pre-tax profit up 16% in 3Q16
November 8, 2016
(1) See note on methodology (2) See note on methodology and excluding IFRIC 21 impact
• Net revenues rose 8% vs. 3Q15, of which +7% for core businesses, with a strong contribution from CIB, which gained 15% excluding CVA/DVA over the same period
• Significant improvement in Cost/Income ratio(2) in 3Q16, down 1.8pp vs. 3Q15 to 70.9%, while gross operating income gained 17% YoY to €659m. Gross operating income for core businesses rose 14% over the same period
• Cost of risk up YoY in 3Q16, but dropped sharply vs. 2Q16 and 1Q16 (-22%), confirming normalization and a return to the guidance range of 30-35bps (30bps in 3Q16)
• ROE(2) for core businesses improved by 60bps vs. 3Q15 to 11.0%
• ROTE(2) rose substantially, up 100bps vs. 3Q15 to 9%
7
Pro forma and excluding exceptional items(1) In €m
3Q16 3Q15 3Q16
vs. 3Q15
Net revenues 2,106 1,956 8%
of which core businesses 1,955 1,821 7%
Expenses (1,447) (1,393) 4%
Gross operating income 659 563 17%
Provision for credit losses (69) (54) 29%
Pre-tax profit 601 519 16%
Income tax (213) (197) 8%
Minority interest (34) (20) 67%
Net income (gs) – restated 354 301 17%
In €m 3Q16 3Q15 3Q16
vs. 3Q15
Restatement of IFRIC 21 impact (39) (26)
Net income (gs) – restated excl. impact IFRIC
315 275 14%
ROTE excluding IFRIC 21 impact 9.0% 8.0%
In €m 3Q16 3Q15 3Q16
vs. 3Q15
Exceptional items (56) (10)
Reinstatement of IFRIC 21 impact 39 26
Net income (gs) – reported 298 291 2%
November 8, 2016
(1) See note on methodology (2) See note on methodology and excluding IFRIC 21 impact
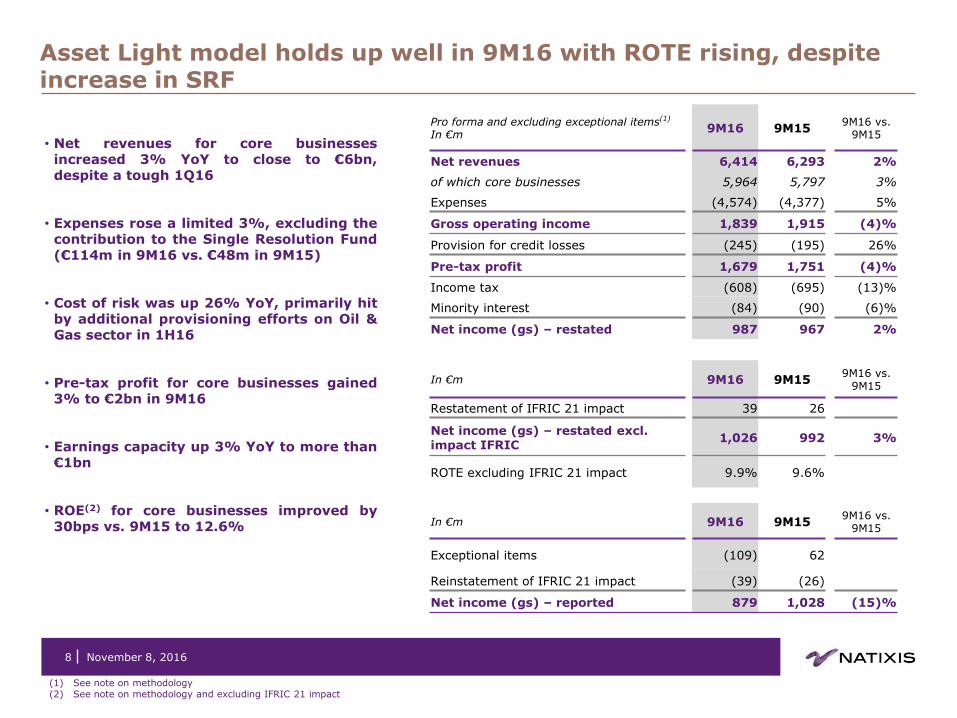
• Net revenues for core businesses increased 3% YoY to close to €6bn, despite a tough 1Q16
• Expenses rose a limited 3%, excluding the contribution to the Single Resolution Fund (€114m in 9M16 vs. €48m in 9M15)
• Cost of risk was up 26% YoY, primarily hit by additional provisioning efforts on Oil & Gas sector in 1H16
• Pre-tax profit for core businesses gained 3% to €2bn in 9M16
• Earnings capacity up 3% YoY to more than €1bn
• ROE(2) for core businesses improved by 30bps vs. 9M15 to 12.6%
8
Pro forma and excluding exceptional items(1) In €m
9M16 9M15 9M16 vs.
9M15
Net revenues 6,414 6,293 2%
of which core businesses 5,964 5,797 3%
Expenses (4,574) (4,377) 5%
Gross operating income 1,839 1,915 (4)%
Provision for credit losses (245) (195) 26%
Pre-tax profit 1,679 1,751 (4)%
Income tax (608) (695) (13)%
Minority interest (84) (90) (6)%
Net income (gs) – restated 987 967 2%
In €m 9M16 9M15 9M16 vs.
9M15
Restatement of IFRIC 21 impact 39 26
Net income (gs) – restated excl. impact IFRIC
1,026 992 3%
ROTE excluding IFRIC 21 impact 9.9% 9.6%
In €m 9M16 9M15 9M16 vs.
9M15
Exceptional items (109) 62
Reinstatement of IFRIC 21 impact (39) (26)
Net income (gs) – reported 879 1,028 (15)%
Asset Light model holds up well in 9M16 with ROTE rising, despite increase in SRF
November 8, 2016 9
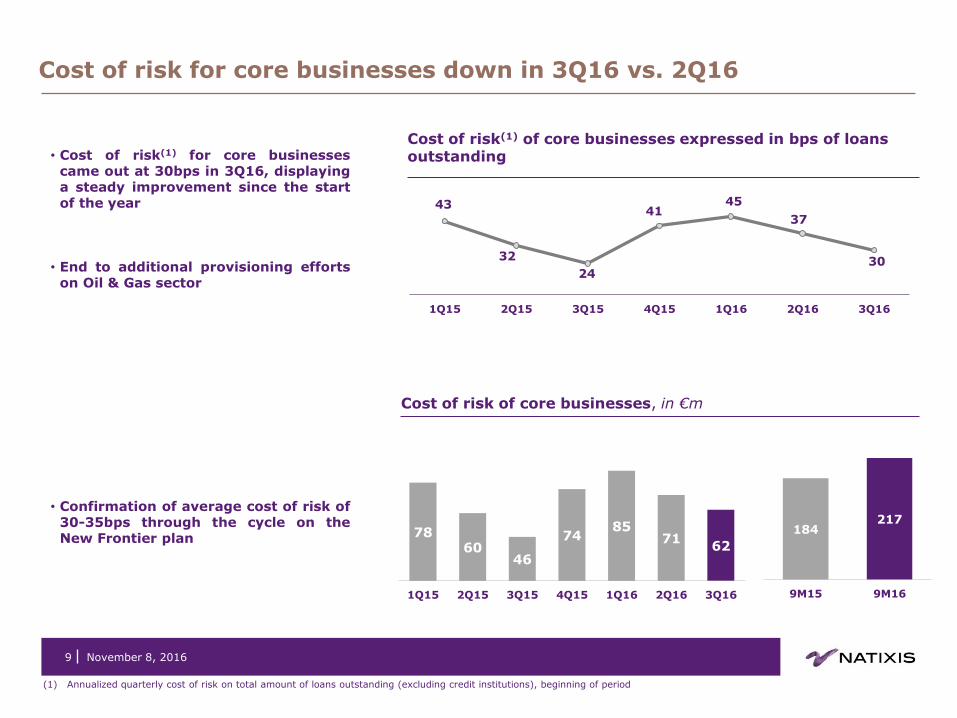
Cost of risk for core businesses down in 3Q16 vs. 2Q16
Cost of risk(1) of core businesses expressed in bps of loans outstanding
Cost of risk of core businesses, in €m
(1) Annualized quarterly cost of risk on total amount of loans outstanding (excluding credit institutions), beginning of period
• Cost of risk(1) for core businesses came out at 30bps in 3Q16, displaying a steady improvement since the start of the year
• End to additional provisioning efforts on Oil & Gas sector
• Confirmation of average cost of risk of 30-35bps through the cycle on the New Frontier plan
43
32
24
41 45
37
30
1Q15 2Q15 3Q15 4Q15 1Q16 2Q16 3Q16
78 60
46
74 85
71 62
1Q15 2Q15 3Q15 4Q15 1Q16 2Q16 3Q16
184 217
9M15 9M16
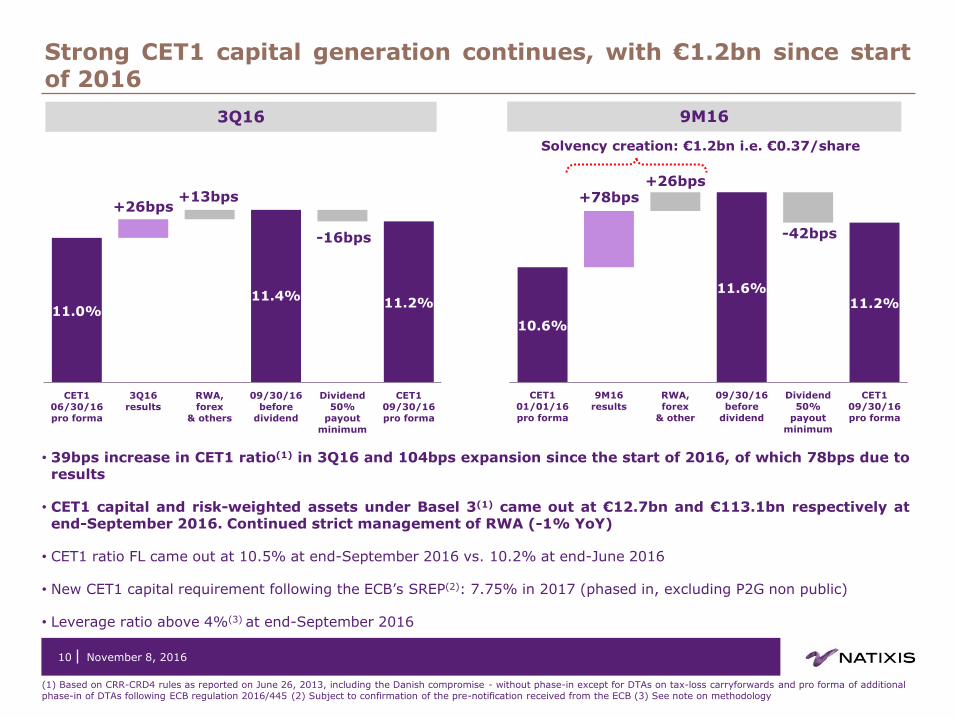
Strong CET1 capital generation continues, with €1.2bn since start of 2016
November 8, 2016
(1) Based on CRR-CRD4 rules as reported on June 26, 2013, including the Danish compromise - without phase-in except for DTAs on tax-loss carryforwards and pro forma of additional phase-in of DTAs following ECB regulation 2016/445 (2) Subject to confirmation of the pre-notification received from the ECB (3) See note on methodology
• 39bps increase in CET1 ratio(1) in 3Q16 and 104bps expansion since the start of 2016, of which 78bps due to results
• CET1 capital and risk-weighted assets under Basel 3(1) came out at €12.7bn and €113.1bn respectively at end-September 2016. Continued strict management of RWA (-1% YoY)
• CET1 ratio FL came out at 10.5% at end-September 2016 vs. 10.2% at end-June 2016
• New CET1 capital requirement following the ECB’s SREP(2): 7.75% in 2017 (phased in, excluding P2G non public)
• Leverage ratio above 4%(3) at end-September 2016
10
11.0% 11.4%
11.2%
+26bps +13bps
-16bps
CET1
06/30/16
pro forma
3Q16
results
RWA,
forex
& others
09/30/16
before
dividend
Dividend
50%
payout
minimum
CET1
09/30/16
pro forma
10.6%
11.6% 11.2%
+78bps +26bps
-42bps
CET1
01/01/16
pro forma
9M16
results
RWA,
forex
& other
09/30/16
before
dividend
Dividend
50%
payout
minimum
CET1
09/30/16
pro forma
3Q16 9M16
Solvency creation: €1.2bn i.e. €0.37/share

11
Agenda
1. 3Q16 and 9M16 results
2. Business division results
3. First steps of the new 2018-2020 strategic plan
4. Conclusion
November 8, 2016

November 8, 2016
Contribution from Asset management declines and is partly offset by strong momentum for Insurance
(1) See note on methodology and excluding IFRIC 21 impact
Insurance
12
• Overall turnover of €5.5bn in 9M16: +25% vs. 9M15 (excluding reinsurance agreement with CNP)
• Life insurance (excluding reinsurance agreement with CNP):
Roll-out of offering across all Caisses d’Epargne (CE) network finalized in mid-October
32% jump in life insurance turnover in 9M16 vs. 9M15
AuM of €46.5bn at end-September 2016 (+7% YoY), including 19% in unit-linked policies
Net inflows doubled vs. 9M15 to €1.8bn, including close to €0.9bn in new business with CE network
Unit-linked policies made up 37% of net inflows in 9M16
• P&C:
9% YoY increase in turnover in 9M16, driven by car and home insurance segments across the two networks
Combined ratio of 92.3% in 9M16
• Personal protection and Borrower’s insurance:
9% growth in turnover in 9M16 vs. 9M15
Asset management: outflows continued in the US, and this should be put in context after record high inflows in 2014 and 2015
Insurance: robust growth across all businesses
In €m 3Q16 3Q15 3Q16
vs. 3Q15 9M16
9M16 vs. 9M15
9M16 vs. 9M15 constant exchange
rate
Net revenues 804 840 (4)% 2,460 (2)% (2)%
o/w Asset management 609 666 (9)% 1,858 (4)% (4)%
o/w Insurance 155 141 10% 478 9%
o/w Private banking 34 34 flat 101 (2)%
Expenses (558) (569) (2)% (1,727) flat flat
Gross operating income 246 271 (9)% 733 (6)% (6)%
Provision for credit losses 0 3 0
Gain or loss on other assets 0 0 19
Pre-tax profit 249 276 (10)% 759 (4)% (4)%
Cost/Income ratio(1) 69.8% 68.1% +1.7pp 70.0% +1.3pp
ROE after tax(1) 12.9% 14.2% -1.3pp 13.7% -1.9pp
Investment Solutions

384 400
USA Europe
Asset management: AuM flat since start of 2016
AuM In €bn
Net revenues In €m
1,134
492 -9%
+7%
-2%
+8%
x% 9M16 vs. 9M15
Change per geographical area
Net revenues in 9M16 and AuM at end-September 2016
November 8, 2016
Per asset manager, excluding distribution platform and Holding
Asset management
13
Assets under management, in €bn
(1) Run off of Aurora
• US: net revenues continued to contract in 9M16 vs. 9M15 due to the decline in average AuM, partly offset at the end of the quarter by a positive market effect. Adaptability of the model with a 7% drop in expenses over the same period
• 9M16 margin in US flat excluding perf. fees at more than 39bps on the back of contributions from alternative strategies (AEW, Alpha Simplex) and steady expansion in margin in Europe at close to 13bps (DNCA)
• Outflows of €8bn in 3Q16 mainly concentrated on Harris. Solid resilience from Loomis in 9M16 as a result of the recent rebound in performances. In Europe, net inflows of close to €5bn in 9M16
In €m 3Q16 3Q15 3Q16
vs. 3Q15 9M16
9M16 vs. 9M15
9M16 vs. 9M15 constant exchange
rate
Net revenues 609 666 (9)% 1,858 (4)% (4)%
o/w Perf. fees 12 18 (31)% 61 (27)% (27)%
Expenses (434) (455) (5)% (1,343) (3)% (3)%
Gross operating income
176 211 (17)% 515 (8)% (8)%
Provision for credit losses
0 0 0
Gain or loss on other assets
0 0 19
Pre-tax profit 175 212 (17)% 533 (5)% (5)%
Investment Solutions
787 779 775 774 798
-8
-4 -1(1)
+24
AuM at
June 30,
2016
Net
inflows
Forex
effect
Perimeter
effect
Market
effect
AuM at
September
30, 2016

(1) Public filings, NGAM (2) Casey Quirk and BCG with NGAM analysis (3) Active specialties includes Equity: int’l, EM, Global, Small Cap & Fixed: EM, Global HY, unconstrained
Estimated cumulative global industry net flows(2) 2016-2020
34%
42%
38%
8%
47% 23%
-63%
-24%
44% 51%
BCG/NGAM Casey
Quirk / NGAM
100%
100%
Multi-asset / Solutions
Alternatives
Active Specialties(3)
Passive
Active core (Benchmark Aware)
14 November 8, 2016
60
80
100
120
140
160
180
200
220
2Q11 2Q12 2Q13 2Q14 2Q15 2Q16
NGAM NGAM AMG Invesco
Franklin T. Rowe Old Mutual Legg Mason
Eaton Vance Blackrock Amundi Aberdeen
UBS Schroders
Net revenue growth(1), indexed at 100 as of 2Q11
(ex perf. fees)
NGAM: the strongest revenue growth the last five years
Investment Solutions
Passive products have enjoyed most inflows. However, industry revenue growth is coming from higher alpha/alternatives commanding higher fees (see Appendix) with a very positive outlook
NGAM is ranked 10th in terms of net revenues and 17th in terms of AuM among all players (see Appendix)

November 8, 2016
(1) See note on methodology and excluding IFRIC 21 impact (2) 9M revenues excluding exceptional item annualized on RWA end of period. Excluding CVA/DVA desk: 5.0% in 9M16 and 4.4% in 9M15 (3) See note on methodology
9M16 marked by sharp rise in ROE(1) to 11.4%, up 160bps vs. 9M15
CIB
15
• Robust growth for net revenues, up 15% YoY excluding CVA/DVA, mainly driven by Fixed income (revenues +39% vs. 3Q15) and M&A. Net revenues gained 4% in 9M16 in line with the New Frontier plan
• Very sound performances from Americas (revenues +30% vs. 3Q15) and Asia platforms (revenues +27% vs. 3Q15)
• Fixed expenses rose 3% in 3Q16 to €401m and increased 5% in 9M16
• Cost of risk of €50m vs. €62m on average over the first two quarters of 2016, which were marked by provisions on the Oil & Gas sector
• RWA still well under control, down 9% YoY to €64.9bn
• O2D strategy: strong improvement in RWA profitability with net revenues/RWA ratio(2) of 5.1% in 9M16 vs. 4.3% in 9M15
In €m 3Q16 3Q15 3Q16
vs. 3Q15 9M16
9M16 vs. 9M15
Net revenues 826 665 24% 2,494 8%
Net revenues excl. CVA/DVA 813 706 15% 2,455 4%
Expenses (468) (416) 13% (1,462) 7%
Gross operating income 358 250 43% 1,032 9%
Provision for credit losses (50) (36) 41% (175) 24%
Pre-tax profit 310 217 43% 868 6%
Cost/Income ratio(1) 58.0% 64.1% (6.1)pp 58.2% (0.4)pp
ROE after tax(1) 11.5% 7.4% +4.1pp 11.4% +1.6pp
Figures excluding exceptional item(3)
CIB
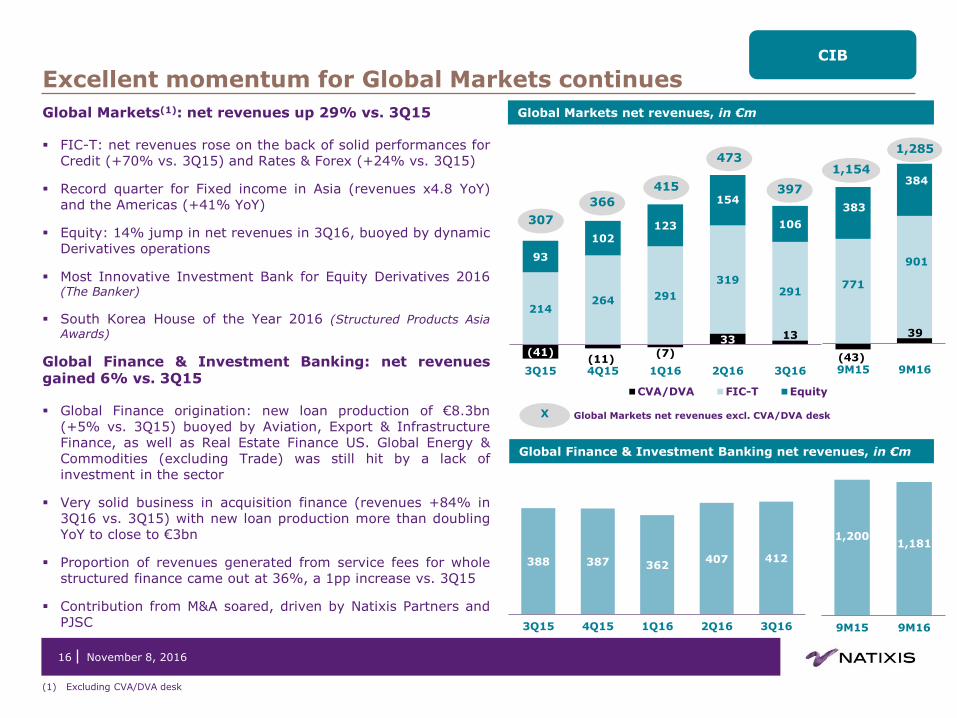
Excellent momentum for Global Markets continues
16
(1) Excluding CVA/DVA desk
(41) (11)
(7)
33 13
214 264 291
319 291
93
102 123
154
106
3Q15 4Q15 1Q16 2Q16 3Q16
CVA/DVA FIC-T Equity
397
307
366
415
473
Global Markets net revenues, in €m
Global Markets net revenues excl. CVA/DVA desk X
9M15 9M16
383
771
384
901
(43)
1,285
1,154
388 387 362 407 412
3Q15 4Q15 1Q16 2Q16 3Q16
Global Finance & Investment Banking net revenues, in €m
9M15 9M16
1,200 1,181
39
Global Markets(1): net revenues up 29% vs. 3Q15
FIC-T: net revenues rose on the back of solid performances for Credit (+70% vs. 3Q15) and Rates & Forex (+24% vs. 3Q15)
Record quarter for Fixed income in Asia (revenues x4.8 YoY) and the Americas (+41% YoY)
Equity: 14% jump in net revenues in 3Q16, buoyed by dynamic Derivatives operations
Most Innovative Investment Bank for Equity Derivatives 2016 (The Banker)
South Korea House of the Year 2016 (Structured Products Asia Awards)
Global Finance & Investment Banking: net revenues gained 6% vs. 3Q15
Global Finance origination: new loan production of €8.3bn (+5% vs. 3Q15) buoyed by Aviation, Export & Infrastructure Finance, as well as Real Estate Finance US. Global Energy & Commodities (excluding Trade) was still hit by a lack of investment in the sector
Very solid business in acquisition finance (revenues +84% in 3Q16 vs. 3Q15) with new loan production more than doubling YoY to close to €3bn
Proportion of revenues generated from service fees for whole structured finance came out at 36%, a 1pp increase vs. 3Q15
Contribution from M&A soared, driven by Natixis Partners and PJSC
November 8, 2016
November 8, 2016
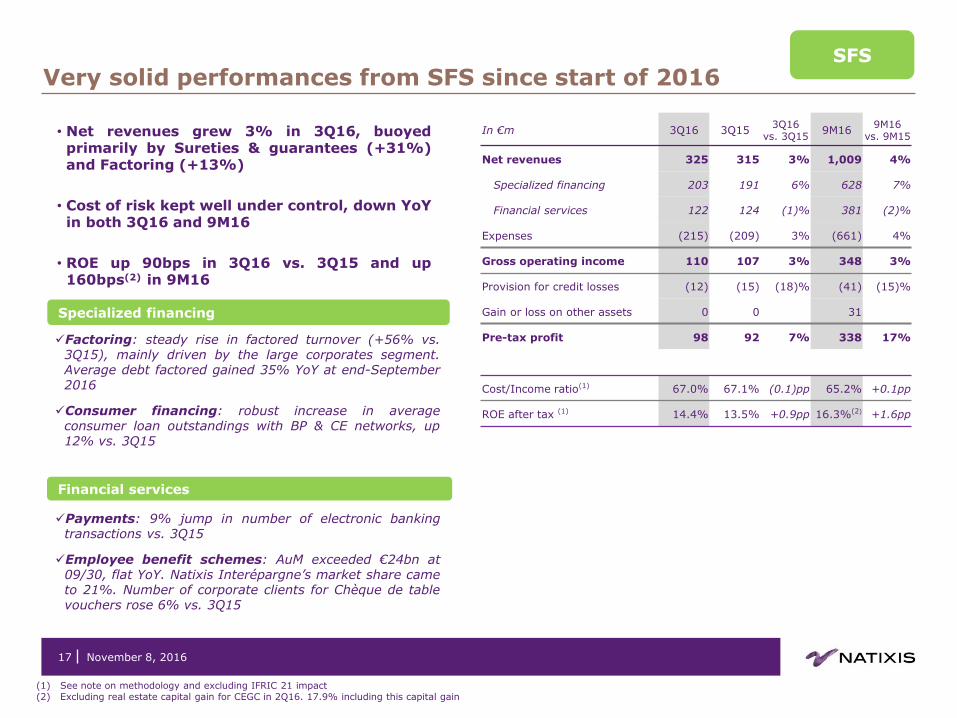
SFS
(1) See note on methodology and excluding IFRIC 21 impact (2) Excluding real estate capital gain for CEGC in 2Q16. 17.9% including this capital gain
Specialized financing
Financial services
• Net revenues grew 3% in 3Q16, buoyed primarily by Sureties & guarantees (+31%) and Factoring (+13%)
• Cost of risk kept well under control, down YoY in both 3Q16 and 9M16
• ROE up 90bps in 3Q16 vs. 3Q15 and up 160bps(2) in 9M16
Factoring: steady rise in factored turnover (+56% vs. 3Q15), mainly driven by the large corporates segment. Average debt factored gained 35% YoY at end-September 2016
Consumer financing: robust increase in average consumer loan outstandings with BP & CE networks, up 12% vs. 3Q15
Payments: 9% jump in number of electronic banking transactions vs. 3Q15
Employee benefit schemes: AuM exceeded €24bn at 09/30, flat YoY. Natixis Interépargne’s market share came to 21%. Number of corporate clients for Chèque de table vouchers rose 6% vs. 3Q15
17
Very solid performances from SFS since start of 2016
In €m 3Q16 3Q15 3Q16
vs. 3Q15 9M16
9M16 vs. 9M15
Net revenues 325 315 3% 1,009 4%
Specialized financing 203 191 6% 628 7%
Financial services 122 124 (1)% 381 (2)%
Expenses (215) (209) 3% (661) 4%
Gross operating income 110 107 3% 348 3%
Provision for credit losses (12) (15) (18)% (41) (15)%
Gain or loss on other assets 0 0 31
Pre-tax profit 98 92 7% 338 17%
Cost/Income ratio(1) 67.0% 67.1% (0.1)pp 65.2% +0.1pp
ROE after tax (1) 14.4% 13.5% +0.9pp 16.3%(2) +1.6pp
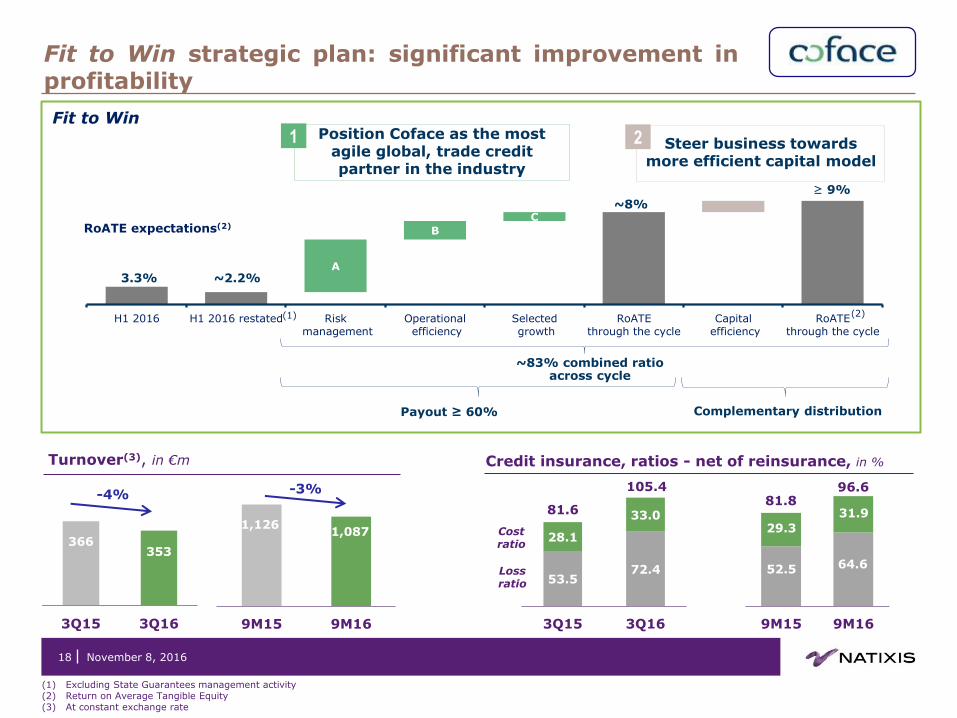
Fit to Win strategic plan: significant improvement in profitability
November 8, 2016
(1) Excluding State Guarantees management activity (2) Return on Average Tangible Equity (3) At constant exchange rate
18
Position Coface as the most agile global, trade credit partner in the industry
1 Steer business towards more efficient capital model
2
A
B
C
H1 2016 H1 2016 restated Risk management
Operational efficiency
Selected growth
RoATEthrough the cycle
Capital efficiency
RoATEthrough the cycle
RoATE expectations(2)
3.3%
~8%
~83% combined ratio
across cycle
~2.2%
≥ 9%
Payout ≥ 60% Complementary distribution
(1) (2)
Fit to Win
Turnover(3), in €m
53.5 72.4
28.1
33.0
3Q15 3Q16
Loss ratio
Cost ratio
Credit insurance, ratios - net of reinsurance, in %
105.4
81.6
9M15 9M16
64.6 52.5
29.3
31.9 81.8
96.6
9M15 9M16
-4% -3%
1,126 1,087
366 353
3Q15 3Q16

19
Agenda
1. 3Q16 and 9M16 results
2. Business division results
3. First steps of the new 2018-2020 strategic plan
4. Conclusion
November 8, 2016

20
Transformation and Business Efficiency(1): €250m in cost savings fully captured by the end of 2019
Natixis will invest €220m to promote the industrialization, transformation and digitalization of its businesses in order to reduce costs by €250m per year from end-2019. These efficiency gains will be done at constant business scope.
One-off investment costs
€220m (over 2017 & 2018)
Recurring annual cost savings
€250m locked in
at end-2019
~50% to modernize IT and invest in new technologies
~50% to manage impact of transformation
Swift ramp-up to reach target:
25%
65%
100%
End-2017 End-2018 End-2019
€65m €160m €250m
Cost savings on business efficiency
Constant business line perimeter
November 8, 2016
(1) Plans will be subject to the consultation process with employee representatives

21
Transformation and Business Efficiency(1): four areas for action
Areas for action % of annual savings Emblematic projects
Organizational optimization and simplification
Digitalization and process automation
IT streamlining
Tightened cost control
35%
30%
20%
15%
Bringing IT resources in-house in Portugal
Optimization of sales organization
New life insurance organization
Delayering
Digital Business Transformation
Roll-out of virtual assistants
IT applications decommissioning
New platform for managing margin calls
Optimization of purchasing and of intermediation costs
60% of transformation projects already under way Direct monitoring by Senior Management Committee
November 8, 2016
(1) Plans will be subject to the consultation process with employee representatives

Acceleration in transformation of SFS model
22 November 8, 2016
SFS
Grouping together all Payments operations within Natixis for Groupe BPCE:
A key strategic business and a source of growth and value creation, promoting greater competitiveness for the Banques Populaires and Caisses d’Epargne networks
Strategy to target European markets and take advantage of new digital business models, with the aim of becoming one of the leaders in Europe on mobile payment, e-commerce and local banking solutions
‒ Planned acquisition of S’Money and it’s subsidiaries (Le Pot Commun, E-Cotiz, Depopass) to capitalize on digital expertise and new practices
Ambitious external growth policy, which is a vital source of development to complement organic expansion
‒ Exclusive negotiations for the acquisition of PayPlug, innovative player in the field of "merchant services"

23
Agenda
1. 3Q16 and 9M16 results
2. Business division results
3. First steps of the new 2018-2020 strategic plan
4. Conclusion
November 8, 2016

24 November 8, 2016
Conclusion
Very sound performances in 3Q16 and 9M16 in line with the main targets of the New Frontier plan:
Strong growth in core business revenues in 3Q16, up 7% vs. 3Q15, while ROTE(1)
gained 100bps to 9%
Earnings capacity grew 3% in 9M16 to more than €1bn, despite the increase in contribution to SRF, while ROE(1) for core businesses came to 12.6%, up 30bps YoY
Strict control of RWA, down 9% YoY for CIB and down 1% for Natixis over the same period
Generation of 104bps of CET1 ratio (€1.2bn) since start of 2016 to 11.6%(2)
Preparation of the new strategic plan:
Launch of Transformation and Business Efficiency program(3), which will generate savings of €250m from end-2019
Grouping all Payments operations and investments in a business undergoing profound transformation
(1) See note on methodology (2) Based on CRR-CRD4 rules as reported on June 26, 2013, including the Danish compromise - without phase-in except for DTAs on tax-loss carryforwards and pro forma of additional phase-in of DTAs following ECB regulation 2016/445 (3) Plans will be subject to the consultation process with employee representatives

25
Appendix – Detailed Results (3Q16) A
November 8, 2016
Contents
November 8, 2016 26
NGAM rankings 27 Financial structure and balance-sheet
Regulatory capital in 3Q16 & financial structure Basel 3 38
Natixis’ income statement Leverage ratio 39
3Q16 results: from data excluding non-operating items to reported data
28 Normative capital allocation 40
9M16 results: from data excluding non-operating items to reported data
29
ROE & ROTE Natixis 41
Natixis – Consolidated 30 Refinancing 42-43
Natixis – Breakdown by Business division 31 Balance sheet 44
IFRIC 21 effects by business line 32
Business line income statement Risks
Investment Solutions 33 EAD 45
Corporate & Investment Banking 34 VaR 46
Specialized Financial Services 35 Doubtful loans 47
Financial Investments 36 Corporate center 37
Note on methodology 48-49
27
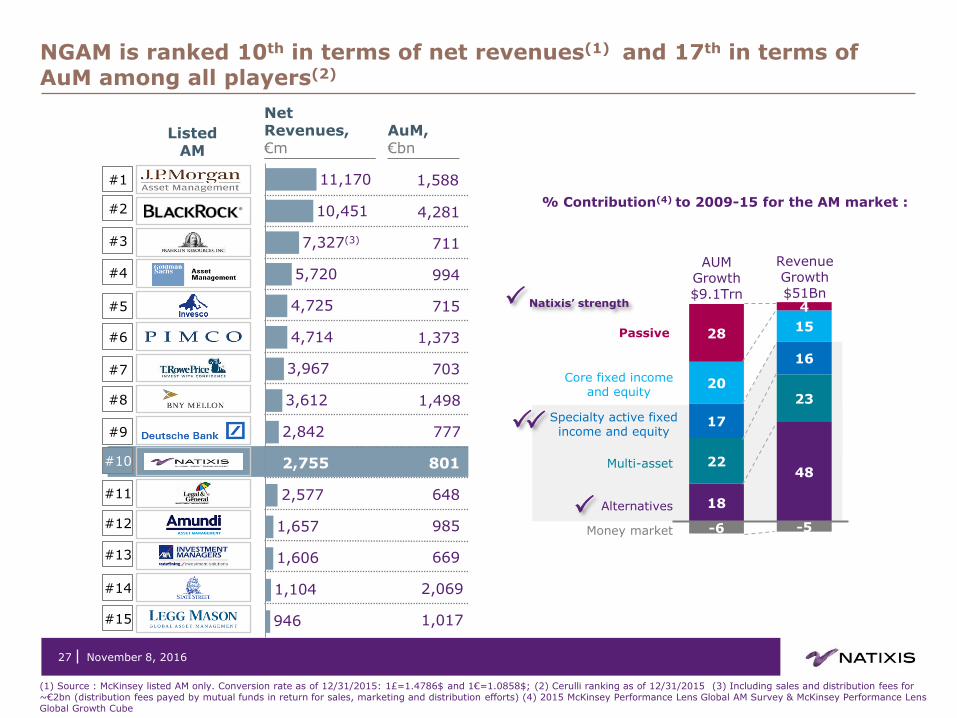
NGAM is ranked 10th in terms of net revenues(1) and 17th in terms of AuM among all players(2)
3,612
946
1,657
2,577
1,104
1,606
2,755
2,842
3,967
5,720
10,451
4,714
4,725
7,327(3)
11,170 1,588
4,281
711
994
715
1,373
703
1,498
777
801
648
985
669
2,069
1,017
#1
#2
#3
#4
#5
#6
#7
#8
#9
#10
#11
#12
#13
#14
#15
(1) Source : McKinsey listed AM only. Conversion rate as of 12/31/2015: 1£=1.4786$ and 1€=1.0858$; (2) Cerulli ranking as of 12/31/2015 (3) Including sales and distribution fees for ~€2bn (distribution fees payed by mutual funds in return for sales, marketing and distribution efforts) (4) 2015 McKinsey Performance Lens Global AM Survey & McKinsey Performance Lens Global Growth Cube
November 8, 2016
Net Revenues, €m
AuM, €bn
Listed AM
-6 -5
18
48 22
23
17
16
20
15 28
4
Revenue Growth $51Bn
AUM Growth $9.1Trn
Passive
Core fixed income and equity
Multi-asset
Alternatives
Money market
Specialty active fixed income and equity
% Contribution(4) to 2009-15 for the AM market :
Natixis’ strength
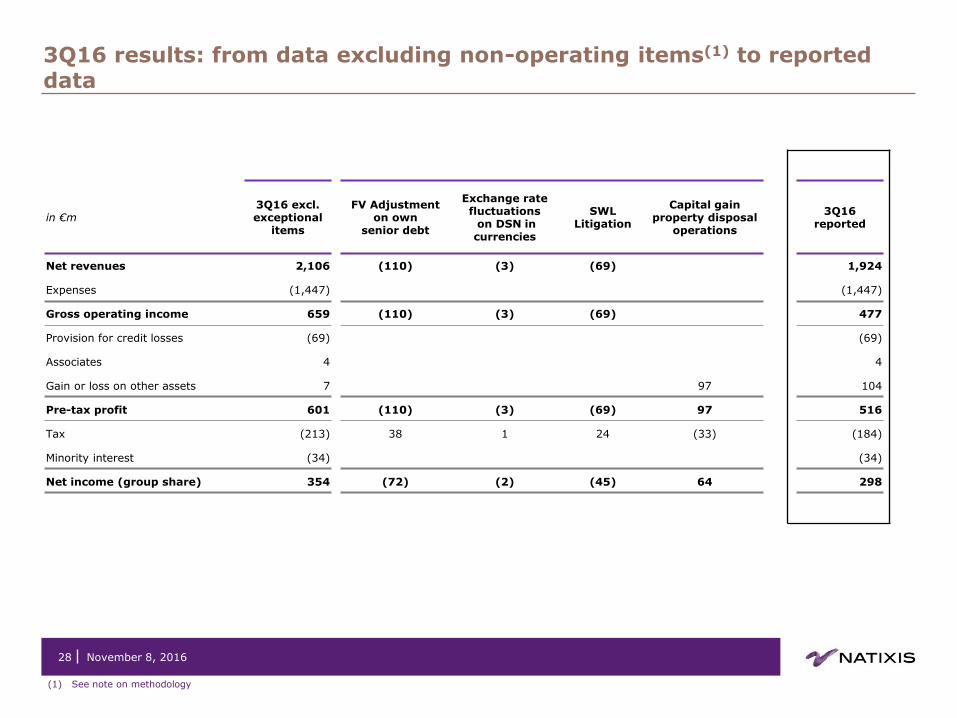
3Q16 results: from data excluding non-operating items(1) to reported data
28
(1) See note on methodology
November 8, 2016
in €m 3Q16 excl. exceptional
items
FV Adjustment on own
senior debt
Exchange rate fluctuations on DSN in currencies
SWL Litigation
Capital gain property disposal
operations
3Q16 reported
Net revenues 2,106 (110) (3) (69) 1,924
Expenses (1,447) (1,447)
Gross operating income 659 (110) (3) (69) 477
Provision for credit losses (69) (69)
Associates 4 4
Gain or loss on other assets 7 97 104
Pre-tax profit 601 (110) (3) (69) 97 516
Tax (213) 38 1 24 (33) (184)
Minority interest (34) (34)
Net income (group share) 354 (72) (2) (45) 64 298

9M16 results: from data excluding non-operating items(1) to reported data
29
(1) See note on methodology
November 8, 2016
in €m
9M16 excl. non
exceptional items
FV Adjustment
on own senior debt
Exchange rate fluctuations on DSN in currencies
SWL Litigation
Capital gain property disposal
operations
Impairment in Coface goodwill
9M16
reported
Net revenues 6,414 (136) (10) (69) 6,198
Expenses (4,574) (4,574)
Gross operating income 1,839 (136) (10) (69) 1,624
Provision for credit losses (245) (245)
Associates 19 19
Gain or loss on other assets 67 97 164
Change in value of goodwill 0 (75) (75)
Pre-tax profit 1,679 (136) (10) (69) 97 (75) 1,486
Tax (608) 47 4 24 (33) (567)
Minority interest (84) 44 (40)
Net income (group share) 987 (89) (7) (45) 64 (31) 879

30
Natixis – Consolidated
November 8, 2016
in €m 1Q15 2Q15 3Q15 4Q15 1Q16 2Q16 3Q16
3Q16 vs. 3Q15
9M15 9M16
9M16 vs. 9M15
Net revenues 2,190 2,301 1,969 2,244 2,063 2,211 1,924
(2)%
6,459 6,198
(4)%
Expenses (1,553) (1,431) (1,393) (1,578) (1,605) (1,522) (1,447)
4%
(4,377) (4,574)
5%
Gross operating income 637 870 576 666 458 689 477
(17)%
2,082 1,624
(22)%
Provision for credit losses (78) (64) (83) (66) (88) (88) (69)
(17)%
(225) (245)
9%
Associates 9 13 8 16 8 7 4
(42)%
30 19
(37)%
Gain or loss on other assets 0 (30) 2 (3) 29 31 104
(28) 164
Change in value of goodwill 0 0 0 0 0 (75) 0
0 (75)
Pre-tax profit 568 789 502 614 407 564 516
3%
1,859 1,486
(20)%
Tax (239) (312) (190) (230) (172) (211) (184)
(3)%
(741) (567)
(23)%
Minority interest (42) (27) (20) (68) (34) 28 (34)
(90) (40)
(55)%
Net income (group share) 287 450 291 316 200 381 298 2%
1,028 879 (15)%

31
3Q16
Natixis – Breakdown by Business division
in €m Investment Solutions
CIB SFS Financial
Investments Corporate
Center
Natixis reported
Net revenues 804 757 325 137 (100) 1,924
Expenses (558) (468) (215) (151) (55) (1,447)
Gross operating income 246 289 110 (14) (155) 477
Provision for credit losses 0 (50) (12) (7) 0 (69)
Net operating income 246 239 98 (20) (155) 408
Associates 5 3 0 (3) 0 4
Other items (2) 0 0 7 99 104
Pre-tax profit 249 242 98 (17) (56) 516
Tax (184)
Minority interest (34)
Net income (gs)
298
November 8, 2016
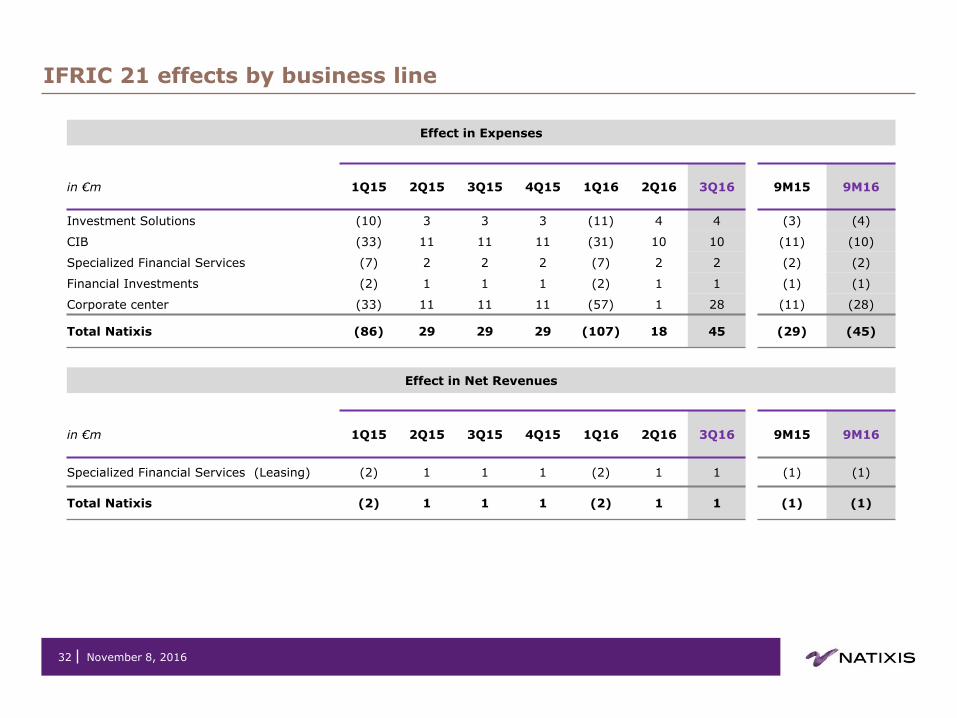
IFRIC 21 effects by business line
32 November 8, 2016
Effect in Expenses
in €m 1Q15 2Q15 3Q15 4Q15 1Q16 2Q16 3Q16
9M15 9M16
Investment Solutions (10) 3 3 3 (11) 4 4 (3) (4)
CIB (33) 11 11 11 (31) 10 10 (11) (10)
Specialized Financial Services (7) 2 2 2 (7) 2 2 (2) (2)
Financial Investments (2) 1 1 1 (2) 1 1 (1) (1)
Corporate center (33) 11 11 11 (57) 1 28 (11) (28)
Total Natixis (86) 29 29 29 (107) 18 45
(29) (45)
Effect in Net Revenues
in €m 1Q15 2Q15 3Q15 4Q15 1Q16 2Q16 3Q16
9M15 9M16
Specialized Financial Services (Leasing) (2) 1 1 1 (2) 1 1 (1) (1)
Total Natixis (2) 1 1 1 (2) 1 1
(1) (1)

33
Investment Solutions
(1) Normative capital allocation methodology based on 10% of the average RWA-including goodwill and intangibles
November 8, 2016
in €m 1Q15 2Q15 3Q15 4Q15 1Q16 2Q16 3Q16 3Q16
vs. 3Q15
9M15 9M16
9M16 vs. 9M15
Net revenues 823 846 840 1,006 825 832 804 (4)% 2,509 2,460 (2)%
Asset Management 639 633 666 817 626 623 609 (9)% 1,938 1,858 (4)%
Private Banking 34 36 34 41 34 33 34 flat 103 101 (2)%
Insurance 140 156 141 146 167 156 155 10% 438 478 9%
Expenses (583) (576) (569) (648) (590) (579) (558) (2)% (1,728) (1,727) flat
Gross operating income 240 270 271 357 234 253 246 (9)% 781 733 (6)%
Provision for credit losses (1) 0 3 1 0 0 0 2 0
Net operating income 239 270 274 358 234 253 246 (10)% 784 734 (6)%
Associates 5 7 4 6 4 2 5 16% 16 11 (33)%
Other items (2) (2) (2) (2) 18 (2) (2) (6) 14
Pre-tax profit 242 275 276 362 256 253 249 (10)% 794 759 (4)%
Cost/Income ratio 70.8% 68.1% 67.7% 64.5% 71.6% 69.6% 69.4% 68.9% 70.2%
Cost/Income ratio excluding IFRIC 21 effect 69.6% 68.5% 68.1% 64.8% 70.2% 70.0% 69.8% 68.7% 70.0%
RWA (Basel 3 – in €bn) 14.7 14.3 14.4 15.3 16.4 17.0 17.3 21% 14.4 17.3 21%
Normative capital allocation (Basel 3) 3,899 4,170 4,666 4,672 4,350 4,381 4,467 (4)% 4,245 4,399 4%
ROE after tax (Basel 3)(1) 15.1% 17.2% 14.4% 16.6% 13.9% 14.0% 13.1% 15.5% 13.7%
ROE after tax (Basel 3) excluding IFRIC 21 effect(1) 15.8% 17.0% 14.2% 16.4% 14.5% 13.8% 12.9% 15.6% 13.7%
34
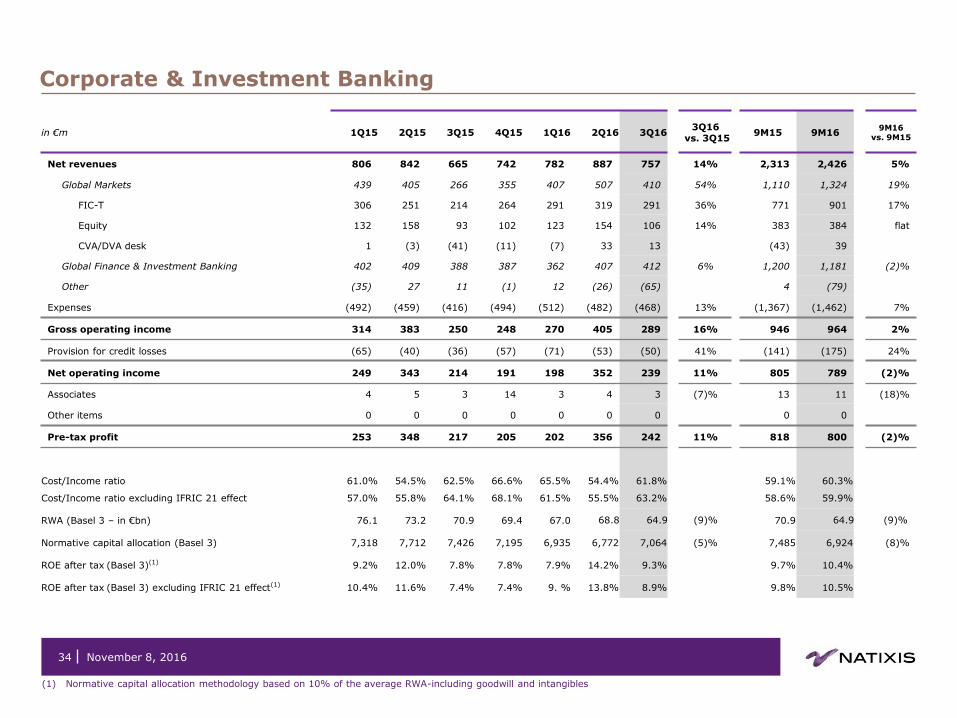
Corporate & Investment Banking
November 8, 2016
(1) Normative capital allocation methodology based on 10% of the average RWA-including goodwill and intangibles
in €m 1Q15 2Q15 3Q15 4Q15 1Q16 2Q16 3Q16 3Q16
vs. 3Q15
9M15 9M16
9M16 vs. 9M15
Net revenues 806 842 665 742 782 887 757 14%
2,313 2,426
5%
Global Markets 439 405 266 355 407 507 410 54% 1,110 1,324 19%
FIC-T 306 251 214 264 291 319 291 36% 771 901 17%
Equity 132 158 93 102 123 154 106 14% 383 384 flat
CVA/DVA desk 1 (3) (41) (11) (7) 33 13 (43) 39
Global Finance & Investment Banking 402 409 388 387 362 407 412 6% 1,200 1,181 (2)%
Other (35) 27 11 (1) 12 (26) (65) 4 (79)
Expenses (492) (459) (416) (494) (512) (482) (468) 13%
(1,367) (1,462)
7%
Gross operating income 314 383 250 248 270 405 289 16%
946 964
2%
Provision for credit losses (65) (40) (36) (57) (71) (53) (50) 41%
(141) (175)
24%
Net operating income 249 343 214 191 198 352 239 11%
805 789
(2)%
Associates 4 5 3 14 3 4 3 (7)% 13 11 (18)%
Other items 0 0 0 0 0 0 0
0 0
Pre-tax profit 253 348 217 205 202 356 242 11%
818 800
(2)%
Cost/Income ratio 61.0% 54.5% 62.5% 66.6% 65.5% 54.4% 61.8% 59.1% 60.3%
Cost/Income ratio excluding IFRIC 21 effect 57.0% 55.8% 64.1% 68.1% 61.5% 55.5% 63.2% 58.6% 59.9%
RWA (Basel 3 – in €bn) 76.1 73.2 70.9 69.4 67.0 68.8 64.9 (9)% 70.9 64.9
(9)%
Normative capital allocation (Basel 3) 7,318 7,712 7,426 7,195 6,935 6,772 7,064 (5)% 7,485 6,924
(8)%
ROE after tax (Basel 3)(1) 9.2% 12.0% 7.8% 7.8% 7.9% 14.2% 9.3% 9.7% 10.4%
ROE after tax (Basel 3) excluding IFRIC 21 effect(1) 10.4% 11.6% 7.4% 7.4% 9. % 13.8% 8.9% 9.8% 10.5%

35
Specialized Financial Services
November 8, 2016
(1) Normative capital allocation methodology based on 10% of the average RWA-including goodwill and intangibles
in €m 1Q15 2Q15 3Q15 4Q15 1Q16 2Q16 3Q16 3Q16
vs. 3Q15
9M15 9M16
9M16 vs. 9M15
Net revenues 324 335 315 334 343 341 325 3% 974 1,009 4%
Specialized Financing 193 203 191 206 214 211 203 6% 586 628 7%
Factoring 35 35 35 38 38 39 40 13% 105 117 11%
Sureties & Financial Guarantees 40 47 35 37 55 43 46 31% 122 144 17%
Leasing 48 49 51 60 51 58 48 (4)% 148 158 7%
Consumer Financing 65 66 65 65 65 66 64 (3)% 197 194 (1)%
Film Industry Financing 4 5 5 5 5 6 5 6% 14 16 11%
Financial Services 131 133 124 128 129 130 122 (1)% 388 381 (2)%
Employee Savings Scheme 32 35 28 33 33 35 29 3% 96 96 1%
Payments 72 72 72 71 72 72 71 (1)% 216 215 (1)%
Securities Services 27 25 24 25 24 23 23 (6)% 76 70 (8)%
Expenses (218) (211) (209) (218) (225) (220) (215) 3% (638) (661) 4%
Gross operating income 105 125 107 116 118 121 110 3% 337 348 3%
Provision for credit losses (14) (20) (15) (10) (13) (17) (12) (18)% (49) (41) (15)%
Net operating income 91 105 92 106 105 104 98 7% 288 307 7%
Associates 0 0 0 0 0 0 0 0 0
Other items 0 0 0 0 0 31 0 0 31
Pre-tax profit 91 105 92 105 105 135 98 7% 288 338 17%
Cost/Income ratio 67.5% 62.8% 66.2% 65.4% 65.7% 64.6% 66.2% 65.4% 65.5%
Cost/Income ratio excluding IFRIC 21 effect 64.7% 63.7% 67.1% 66.3% 63.4% 65.4% 67.0% 65.1% 65.2%
RWA (Basel 3 – in €bn) 14.4 14.3 13.0 13.6 13.7 14.8 14.6 12% 13.0 14.6 12%
Normative capital allocation (Basel 3) 1,692 1,689 1,680 1,551 1,629 1,626 1,730 3% 1,687 1,662 (2)%
ROE after tax (Basel 3)(1) 13.8% 15.9% 14.0% 17.3% 16.9% 21.8% 14.8% 14.6% 17.8%
ROE after tax (Basel 3) excluding IFRIC 21 effect(1) 15.2% 15.4% 13.5% 16.7% 18.3% 21.3% 14.4% 14.7% 17.9%
36
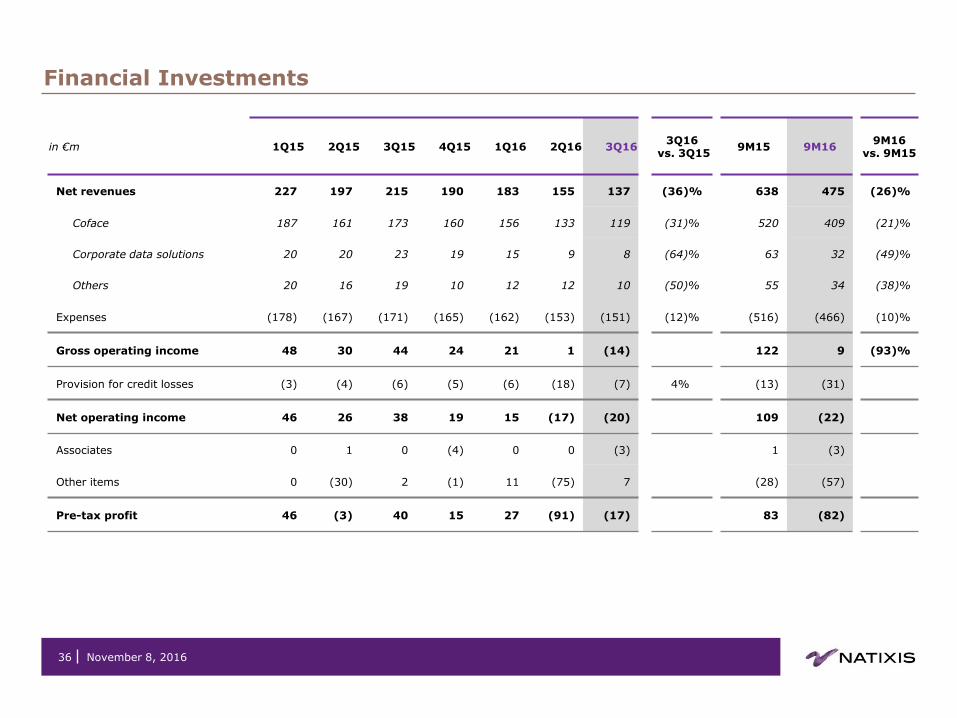
Financial Investments
November 8, 2016
in €m 1Q15 2Q15 3Q15 4Q15 1Q16 2Q16 3Q16 3Q16
vs. 3Q15
9M15 9M16
9M16 vs. 9M15
Net revenues 227 197 215 190 183 155 137 (36)%
638 475
(26)%
Coface 187 161 173 160 156 133 119 (31)%
520 409
(21)%
Corporate data solutions 20 20 23 19 15 9 8 (64)%
63 32
(49)%
Others 20 16 19 10 12 12 10 (50)%
55 34
(38)%
Expenses (178) (167) (171) (165) (162) (153) (151) (12)%
(516) (466)
(10)%
Gross operating income 48 30 44 24 21 1 (14)
122 9
(93)%
Provision for credit losses (3) (4) (6) (5) (6) (18) (7) 4%
(13) (31)
Net operating income 46 26 38 19 15 (17) (20)
109 (22)
Associates 0 1 0 (4) 0 0 (3)
1 (3)
Other items 0 (30) 2 (1) 11 (75) 7
(28) (57)
Pre-tax profit 46 (3) 40 15 27 (91) (17)
83 (82)
37
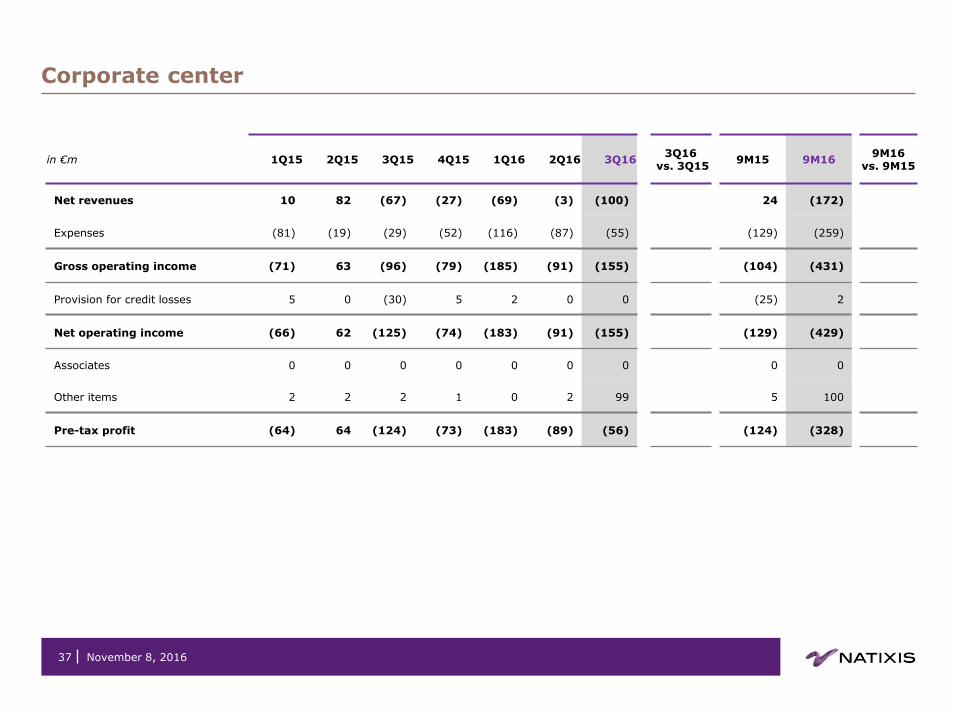
Corporate center
November 8, 2016
in €m 1Q15 2Q15 3Q15 4Q15 1Q16 2Q16 3Q16 3Q16
vs. 3Q15
9M15 9M16
9M16 vs. 9M15
Net revenues 10 82 (67) (27) (69) (3) (100)
24 (172)
Expenses (81) (19) (29) (52) (116) (87) (55)
(129) (259)
Gross operating income (71) 63 (96) (79) (185) (91) (155)
(104) (431)
Provision for credit losses 5 0 (30) 5 2 0 0
(25) 2
Net operating income (66) 62 (125) (74) (183) (91) (155)
(129) (429)
Associates 0 0 0 0 0 0 0
0 0
Other items 2 2 2 1 0 2 99
5 100
Pre-tax profit (64) 64 (124) (73) (183) (89) (56)
(124) (328)

38
Regulatory capital in 3Q16 & financial structure Basel 3
(1) Including capital gain following reclassification of hybrids as equity instruments (2) Statutory balance sheet
Regulatory reporting, in €bn
Breakdown of risk-weighted assets In €bn
09/30/2016
Credit risk 77.7
Internal approach 64.1
Standard approach 13.6
Counterparty risk 7.9
Internal approach 7.0
Standard approach 0.9
Market risk 11.3
Internal approach 5.5
Standard approach 5.8
CVA 3.5
Operational risk - Standard approach 12.7
Total RWA 113.1
In €bn 3Q15 CRD4 phased
4Q15 CRD4 phased
1Q16 CRD4 phased
2Q16 CRD4 phased
3Q16 CRD4 phased
CET1 Ratio 11.0% 11.0% 11.1% 11.1% 11.3%
Tier 1 Ratio 12.1% 12.1% 12.6% 12.6% 12.8%
Solvency Ratio 14.4% 14.3% 15.1% 15.0% 15.1%
Tier 1 capital 13.9 13.7 14.1 14.3 14.5
RWA 114.4 113.3 111.4 112.9 113.1
In €bn 3Q15 4Q15 1Q16 2Q16 3Q16
Equity group share 18.6 19.2 19.5 18.8 19.1
Total assets(2) 513 500 514 535 522
November 8, 2016
19.1
12.7 14.5
17.1 (3.4)
(0.5) (0.5) (1.9)
1.7
2.6
Sh
are
ho
lde
r's
eq
uit
y
To
tal p
rud
en
tia
l
Cap
ita
l
CET1
cap
ital
Tie
r 1
Ca
pit
al
Go
od
wil
l &
in
tan
gib
les
Div
ide
nd
Oth
er
de
du
cti
on
s
Hyb
rid
s r
ecla
ssif
icati
on
in T
ier
1(1
)
Tie
r 2 C
ap
ital
Ad
dit
ion
al
Tie
r 1

39
Leverage ratio
€bn 09/30/2016
Tier 1 capital (1) 14.9
Total prudential balance sheet 437.6
Adjustment on derivatives (57.0)
Adjustment on repos (2) (30.6)
Other exposures to affiliates (39.2)
Off balance sheet commitments 36.0
Regulatory adjustments (3.7)
Total leverage exposures 343.1
Leverage ratio 4.3%
(1) Without phase-in except for DTAs on tax loss carryforwards - supposing replacement of existing subordinated issuances when they become ineligible (2) Repos with clearing houses cleared according to IAS32 standard, without maturity or currency criteria
November 8, 2016
According to the rules of the Delegated Act published by the European Commission on October 10, 2014 , including the effect of intragroup cancelation - pending ECB authorisation

40
Normative capital allocation
Normative capital allocation and RWA breakdown at end-September 2016 – under Basel 3
(1) See note on methodology (2) Net tangible book value = Book value – goodwill - intangible assets (3) Calculated on the basis of 3,135,564,243 shares - end of period
In €bn RWA
(end of period) In % of the total
Average Goodwill and intangibles
Average capital allocation
beginning of period
ROE after tax
9M16
CIB 64.9 63% 0.1 6.9 10.4%
Investment Solutions 17.3 17% 2.8 4.4 13.7%
SFS 14.6 14% 0.3 1.7 17.8%
Financial Investments 5.6 6% 0.2 0.7
TOTAL (excl. Corporate Center) 102.4 100% 3.4 13.7
November 8, 2016
in €bn 09/30/2016
Shareholders’ equity (group share) 19.1
Deduction of hybrid capital instruments (1.6)
Deduction of gain on hybrid instruments (0.3)
Net book value 17.2
Restated intangible assets(1) 0.7
Restated goodwill(1) 2.9
Net tangible book value(2) 13.6
in €
Net book value per share(3) 5.49
Net tangible book value per share(3) 4.34
Net book value as of September 30, 2016 Earnings per share (9M16)
in €m 09/30/2016
Net income (gs) 879
DSN interest expenses on preferred shares after tax (58)
Net income attributable to shareholders 821
Average number of shares over the period, excluding treasury shares
3,129,100,824
Earnings per share (€) 0.26

41
ROE & ROTE Natixis(1)
November 8, 2016
Net income attributable to shareholders
in €m 3Q16 9M16
Net income (gs) 298 879
DSN interest expenses on preferred shares after tax (21) (58)
ROE & ROTE numerator 277 821
ROTE ROE
in €m 09/30/2016 in €m 09/30/2016
Shareholders’ equity (group share) 19,070 Shareholders’ equity (group share) 19,070
DSN deduction (1,868) DSN deduction (1,868)
Dividends(2) provision (455) Dividends(2) provision (455)
Intangible assets (714) Exclusion of unrealized or deferred gains and losses recognized in equity (OCI)
(306) Goodwill (2,866)
ROTE Equity end of period 13,167 ROE Equity end of period 16,441
Average ROTE equity (3Q16) 13,092 Average ROE equity (3Q16) 16,403
3Q16 ROTE annualized 8.5% 3Q16 ROE annualized 6.8%
Average ROTE equity (9M16) 13,005 Average ROE equity (9M16) 16,356
9M16 ROTE annualized 8.4% 9M16 ROE annualized 6.7%
(1) See note on methodology (2) Dividend based on 50% of the net income attributable to shareholders excluding FV adjustment on own debt

42
Groupe BPCE’s MLT refinancing(1)
Robust liquidity reserves and diversified wholesale funding
November 8, 2016
(1) Natixis’ MLT refinancing is managed at BPCE level (2) Total Tier-2 capital raised in 2016: €3bn, including the issue distributed via the BP and CE retail banking networks
26%
7%
1%
1% 1%
63%
USD
JPY
GBP
AUD
CHF
Others
EUR
Liquidity reserves/(short-term funding +MLT and subordinated debt maturing within 1 year), expressed as a %
Diversification of the investor base (for the unsecured bond segment excl. buybacks)
Foreign currencies
37%
at Oct. 31, 2016
Q3-15 Q4-15 Q1-16 Q2-16 Q3-16
97% of the revised 2016 MLT wholesale funding plan already completed at Oct. 31, 2016
€22.2bn raised
Average maturity at issue: 7.5 years
Average rate: mid-swap +37bps
51% in public issues and 49% in private placements
Unsecured bond segment: €15.0bn
Senior: €12.7bn
Tier 2: €2.4bn(1)
Covered bond segment: €7.2bn
Liquidity reserves: €183bn at Sept. 30, 2016
€45bn in cash placed with central banks
€138bn of available assets eligible for central bank funding
152% 138% 137%
167% 153%

43
Groupe BPCE’s MLT refinancing(1)
November 8, 2016
(1) Natixis’ MLT refinancing is managed at BPCE level (2) Excluding SCF (Compagnie de Financement Foncier, the Group’s societe de credit foncier – a French legal covered bonds issuer) (3) Change in method on Dec. 31, 2012 related to modifications in the definition of customer classifications; previous periods not restated (4) Change in method on Dec. 31, 2013 following the adoption of new netting agreements between financial receivables and payables; previous periods not restated (5) Change in method on Dec. 31, 2014 following the transfer of subordinated debt issues to the network customers from the Shareholders’ equity item to the Customer deposits item on the cash balance sheet (6) The figures for December 31, 2015 include a deliberate over-centralization of regulated resources committed at the end of 2015, but completed at the very beginning of 2016.
Group customer loan/deposit ratio(2)
138%
128%
126%
121% 119% 117%
120%
Dec.2011
Dec.2012
Dec.2013
Dec.2014
Dec. 2015
June2016
Sept.2016
(3)
(4)
(5)
Liquidity reserves / ST funding, as a % 199 %
Liquidity reserves / (ST funding + MLT and sub. Maturing in ≤ 1 year), as a %
153 %
92
28
45
42
5
27
64
Sept. 30, 2016
MLT and sub. maturing in ≤ 1 year
Short-term funding outstandings
Assets eligible for the FED
Other eligible securities
Securities retained
Private receivables eligible for central
bank funding
Liquid assets placed with central banks
120
183 (6)
Liquidity reserves and ST funding (in €bn)

44
Balance sheet
Assets (in €bn) 09/30/2016 12/31/2015
Cash and balances with central banks 29.3 21.2
Financial assets at fair value through profit and loss
185.5 191.6
Available-for-sale financial assets 56.2 52.7
Loans and receivables 190.2 178.7
Held-to-maturity financial assets 2.2 2.3
Accruals and other assets 51.5 46.7
Investments in associates 0.7 0.7
Tangible and intangible assets 2.5 2.8
Goodwill 3.5 3.6
Total 521.6 500.3
Liabilities and equity (in €bn) 09/30/2016 12/31/2015
Due to central banks 0.0 0.0
Financial liabilities at fair value through profit and loss
150.1 159.0
Customer deposits and deposits from financial institutions
186.2 177.8
Debt securities 40.3 40.4
Accruals and other liabilities 49.4 43.1
Insurance companies’ technical reserves 68.8 52.9
Contingency reserves 1.7 1.7
Subordinated debt 4.7 4.9
Equity attributable to equity holders of the parent
19.1 19.2
Minority interests 1.3 1.3
Total 521.6 500.3
November 8, 2016

45
Regional breakdown(1) Sector breakdown(2)
(1) Outstanding: €289bn (2) Outstanding excl. financial sector: €178bn
EAD (Exposure at Default) at September 30, 2016
France 51%
EU 19%
US 16%
Asia & Oceania
5%
Africa & ME 4%
Latin America
3%
Europe 2%
12%
1%
1%
1%
1%
1%
1%
1%
1%
2%
2%
2%
2%
2%
2%
4%
4%
4%
5%
5%
7%
8%
8%
25%
Others
Technology
Aeronautics
Tourism
Medias
Pharma/Healthcare
Telecom
Public works
Consumer goods
Services
Food & agric.
Mechanical constr.
Automotive industry
Community services
Holdings
Base industries
Distribution
Electricity
International Trade
Transport
Securitization
Oil / Gas
Real Estate
Administrations
November 8, 2016

46
VaR
November 8, 2016
0
2
4
6
8
10
12
Sep-15 Oct-15 Nov-15 Dec-15 Jan-16 Feb-16 Mar-16 Apr-16 May-16 Jun-16 Jul-16 Aug-16 Sep-16
€ m
illio
n
• 3Q16 average VaR of €7.5m decreasing by 1% vs. 2Q16

Doubtful loans (inc. financial institutions)
47
In €bn 3Q15 4Q15 1Q16 2Q16 3Q16
Doubtful loans(1) 4.1 4.0 3.8 4.1 4.2
Collateral relating to loans written-down(1) (1.5) (1.3) (1.3) (1.4) (1.6)
Provisionable commitments(1) 2.7 2.7 2.6 2.6 2.6
Specific provisions(1) (1.8) (1.8) (1.7) (1.7) (1.7)
Portfolio-based provisions (1) (0.4) (0.4) (0.4) (0.4) (0.4)
Provisionable commitments(1)/ Gross debt 2.2% 1.9% 1.9% 2.0% 2.2%
Specific provisions/Provisionable commitments(1) 67% 65% 64% 64% 64%
Overall provisions/Provisionable commitments(1) 82% 79% 79% 80% 79%
(1) Excluding securities and repos
November 8, 2016

48
Note on methodology (1/2)
November 8, 2016
The results at 09/30/2016 were examined by the board of directors at their meeting on 11/08/2016. Figures at 09/30/2016 are presented in accordance with IAS/IFRS accounting standards and IFRS Interpretation Committee (IFRIC) rulings as adopted in the European Union and applicable at this date. 2015 figures are presented pro forma: (1) For the reclassification of the contribution to the Single Resolution Fund to current profit (previously booked under exceptional items).
The contribution is registered under Corporate Center expenses. The 2015 quarterly series have been restated accordingly.
(2) For the transfer of some expenses from Corporate Center to SFS. The 2015 series have been restated accordingly.
The 2015 & 1H16 quarterly series have been restated for the change in CIB organization announced on March 15 2016. The new presentation of businesses within CIB mainly takes into account the creation of a new business line: Global Finance & Investment banking housing all financing businesses (structured & plain vanilla financing), as well as M&A, Equity Capital Markets, and Debt Capital Markets.
Changes in rules as of January 1, 2016: The cost of subordination of Tier 2 debt issued, previously allocated to Corporate Center, is now reallocated to the business lines based on their normative capital. Application of an accounting change in 2015 due to the recognition of tax amortization of goodwill under deferred tax liability in the Investment Solutions division leading to an increase of the normative tax rate, and conversely to a decrease of the normative capital allocation. Business line performances using Basel 3 standards:
- The performances of Natixis business lines are presented using Basel 3 standards. Basel 3 risk-weighted assets are based on CRR-CRD4
rules as published on June 26th, 2013 (including the Danish compromise treatment for qualified entities).
- Natixis’ ROTE is calculated by taking as the numerator net income (group share) excluding DSN interest expenses on preferred shares after tax. Equity capital is average shareholders’ equity group share as defined by IFRS, after payout of dividends, excluding average hybrid debt, average intangible assets and average goodwill.
- Natixis’ ROE: results used for calculations are net income (group share), deducting DSN interest expenses on preferred shares after tax.
Equity capital is average shareholders’ equity group share as defined by IFRS, after payout of dividends, excluding average hybrid debt, and excluding unrealized or deferred gains and losses recognized in equity (OCI).
- ROE for business lines is calculated based on normative capital to which are added goodwill and intangible assets for the business line.
Normative capital allocation to Natixis’ business lines is carried out on the basis of 10% of their average Basel 3 risk-weighted assets. Business lines benefit from remuneration of normative capital allocated to them. By convention, the remuneration rate on normative capital is maintained at 3%.

49
Note on methodology (2/2)
November 8, 2016
Net book value: calculated by taking shareholders’ equity group share, restated for hybrids and capital gains on reclassification of hybrids as equity instruments. Net tangible book value is adjusted for goodwill relating to equity affiliates, restated goodwill and intangible assets as follows: Own senior debt fair-value adjustment: calculated using a discounted cash-flow model, contract by contract, including parameters such as swaps curve, and revaluation spread (based on the BPCE reoffer curve). Leverage ratio: based on delegated act rules, without phase-in except for DTAs on tax-loss carryforwards and with the hypothesis of a roll-out for non-eligible subordinated notes under Basel 3 by eligible notes. Repo transactions with central counterparties are offset in accordance with IAS 32 rules without maturity or currency criteria. Leverage ratio disclosed including the effect of intragroup cancelation - pending ECB authorization. Exceptional items: figures and comments on this presentation are based on Natixis and its businesses’ income statements excluding non- operating and/or exceptional items detailed page 6. Natixis and its businesses’ income statements including these items are available in the appendix of this presentation. Restatement for IFRIC 21 impact: the cost/income ratio and the ROE excluding IFRIC 21 impact calculation take into account as of June 30th 2016, ¾ of the annual duties and levies concerned by this new accounting rule. The impact for the quarter is calculated by difference with the former quarter. Earnings capacity: net income (group share) restated for exceptional items and the IFRIC 21 impact. Expenses: Sum of operating expenses and Depreciation, amortization and impairment on property, plant and equipment and intangible assets.
In €m 09/30/2016
Intangible assets 753
Restatement for Coface minority interest (39)
Restated intangible assets 714
In €m 06/30/2016
Goodwill 3,503
Restatement for Coface minority interest (165)
Restatement for Investment Solutions deferred tax liability
(499)
Restated goodwill 2,839

November 8, 2016 50