tivoli autonomic computing © 2003 ibm corporation a research agenda for business-driven it jeff...
TRANSCRIPT

Tivoli Autonomic Computing
© 2003 IBM Corporation
A Research Agenda forBusiness-Driven IT
Jeff Kephart (IBM Research)Steve White (IBM Research)Edie Stern (IBM Tivoli)

Tivoli Autonomic Computing
© 2003 IBM Corporation2
Business-Driven IT
We want a world in which businesses can respond flexibly to opportunities and threats
Flexible business requires flexible IT …

Tivoli Autonomic Computing
© 2003 IBM Corporation3
Is this flexible IT?
No – that’s what autonomic computing is supposed to fix!

Tivoli Autonomic Computing
© 2003 IBM Corporation4
The role of autonomic computing
Autonomic computing systems are:
– “Computing systems that manage themselves in accordance with high-level objectives from humans.”
• A Vision of Autonomic Computing, IEEE Computer, J. Kephart and D. Chess, Jan. 2003.
How high is “high”?
Business-driven IT: the high-level objectives are business objectives

Tivoli Autonomic Computing
© 2003 IBM Corporation5
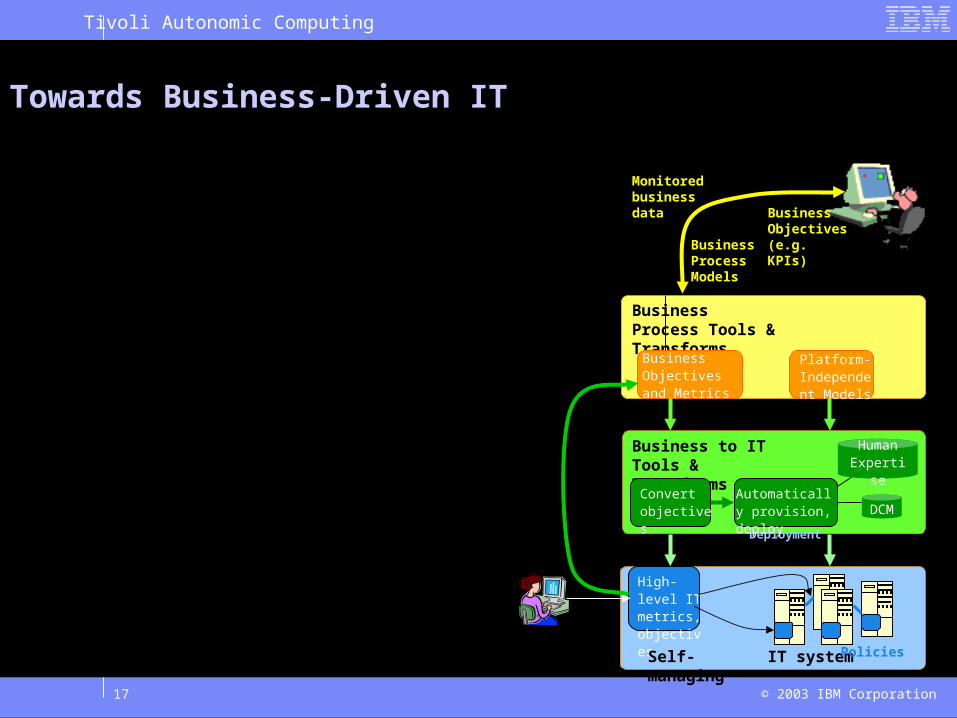
Towards Business-Driven IT
Business Objectives (e.g. KPIs)Business
Process Models
IT system
Monitored business data
Business to ITTools & Transforms
Automated Provisioning and
Deployment
Automatically provision, deploy DCM
Human Expertise
Policies
Business Process Tools & Transforms
Platform-Independent Models
Business Objectives and Metrics
DB policies
Network policies
IT Admins
Storage policies
Business Architects
Deployers and Domain Experts
High-level IT metrics, objectives
Human specification of low-level, platform-specific policies gives way to high-level discipline-specific objectives with tradeoffs
Convert objectives
Translation of models, metrics and objectives from business terms to IT terms will become increasingly automated
There will be continuous feedback between IT and business levels to calibrate business-to-IT transformations
Self-managing

Tivoli Autonomic Computing
© 2003 IBM Corporation6
Application Experts
Databaseexperts
and tools
Serverexperts
Networkexperts
and tools
Mainframe experts
Availability Management
Security Management
Change Management
Service Level Management
Information Lifecycle Mgmt.
From siloed policies to high-level IT objectives
Replace resource-oriented silos with horizontal process-oriented solutions
Workstationexperts
Server Policy
Network Policy
DBPolicy
Availability Objectives
Security Objectives
Performance Objectives
Change Objectives
Replace resource-oriented policies with objectives defined by management discipline; aggregate them
High-level IT metrics, objectives

Tivoli Autonomic Computing
© 2003 IBM Corporation7
Scenario: Managing to Performance and Availability Objectives
cpu, b
On Demand Env 1
Util(RT, DT)
Service-level utility
Application Manager
Resource-level utility
Models
NetUtil(cpu, b; )
Optimizer
Perf. Model
RT(cpu, b; )
Avail. ModelDT(b)
Cost ModelCost(cpu)
High-level IT metrics, objectives
Policies
eBrokerage transactions application
1 sec response time for Gold customers is OK. I don’t need faster than 0.75 sec; more than 2.0 sec is unacceptable.
50 min downtime/month is tolerable; 100 min is bad.
Good DownTime is slightly more important than good RT.
Objectives are defined as utility function for Response Time and Down Time, which captures tradeoffs
The system can now set these parameters to their optimal values, or advise a human administrator.
Composing utility with models yields an optimization problem in terms of low-level params that can be posed to an appropriate optimizer.
Models capture human expert knowledge about dependence of high-level IT metrics on lower level system knobs and observables like demand . They can be refined automatically.

IBM Research
© 2005 IBM CorporationResearch Challenges for AI and Autonomic Computing University of Alberta, November 21, 2005
Performance-Availability Tradeoffs using Utility Functionswith J. Strunk, B. Salmon, G. Ganger, CMU
Cost Function for Trace Processing Application
Availability Bandwidth (MB/sec)
Cost ($/yr/student)
$5000$10000$15000$20000
$25000$30000
Student waits for run on 27GB trace file once per day; costs $30/hr
Outage renders student 50% effective + sys admin spends 100% time fixing; costs $45/hr

Tivoli Autonomic Computing
© 2003 IBM Corporation9
Need interfaces and algorithms to support elicitation of high-level objectives
WebSphere XD uses templates to elicit average or percentile response-time objectives
E-commerce preference elicitation methods that help consumers to express complex tradeoffs will be adapted to systems administration
ACT-I project: Algorithms and Protocols for Impact Analysis
© 2005 IBM Corporation
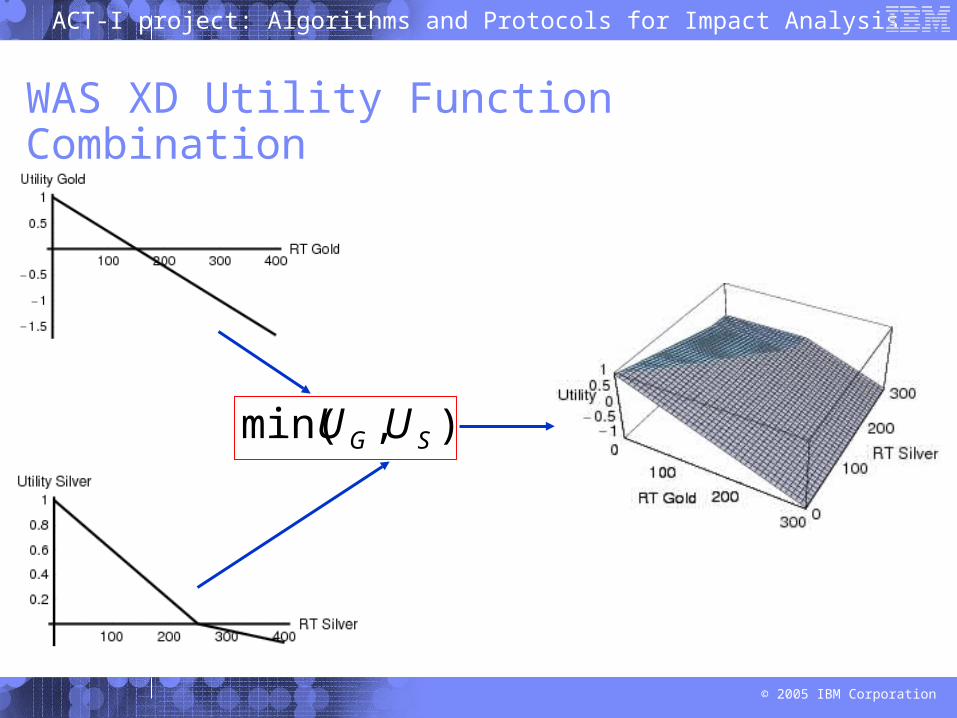
WAS XD Utility Function Combination
),min( SG UU

Utility-based Collaboration among Autonomous Agents
© 2006 IBM CorporationAAMAS-06: Hakodate , Japan
WebSphereXD-TIO Data Center
WebSphereXD WebSphereXDFreePool

ACT-I project: Algorithms and Protocols for Impact Analysis
© 2005 IBM Corporation
Control parameters
Suppose we have just two control parameters cpu = # processors
b = data backup interval (in minutes)
We want to choose (cpu, b) to optimize Util(rt,rpo) – Cost(rt,rpo)
We need to transform the utility function into control parameter space
We can do this using models that relate (cpu,b) to (rt,rpo)
NetUtil(rt, rpo) =
Util(rt,rpo) – Cost(rt,rpo) =
Util( rt(cpu, b; ), rpo(cpu, b ; )) – Cost(cpu, b) =
NetUtil(cpu,b; )
ACT-I project: Algorithms and Protocols for Impact Analysis
© 2005 IBM Corporation
Models
b
(sec-1)(b)
cpu
RT(msec)
= 10-4
= 10-3
= 5*10-3
rt(cpu, ; )
=10
0
1
2
3
4
5
6
0 1 2 3 4 5 6
b
rpo
rpo(b)
0
10
20
30
40
50
60
0 1 2 3 4 5 6
cpu
Co
stCost(cpu)
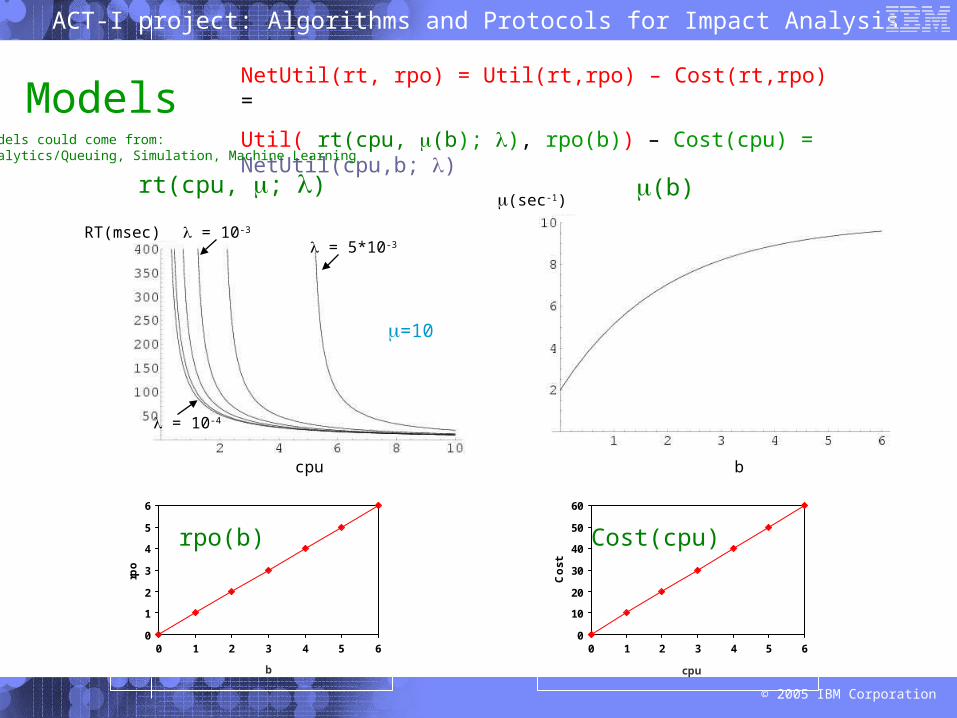
NetUtil(rt, rpo) = Util(rt,rpo) – Cost(rt,rpo) =
Util( rt(cpu, (b); ), rpo(b)) – Cost(cpu) = NetUtil(cpu,b; )Models could come from:Analytics/Queuing, Simulation, Machine Learning

ACT-I project: Algorithms and Protocols for Impact Analysis
© 2005 IBM Corporation
Net utility as function of control parameters
NetUtil(cpu, b; )Util(rt, rpo)
cpu
b
Unet
rpo
rt
U
rt
rpo cpu
b
ACT-I project: Algorithms and Protocols for Impact Analysis
© 2005 IBM Corporation
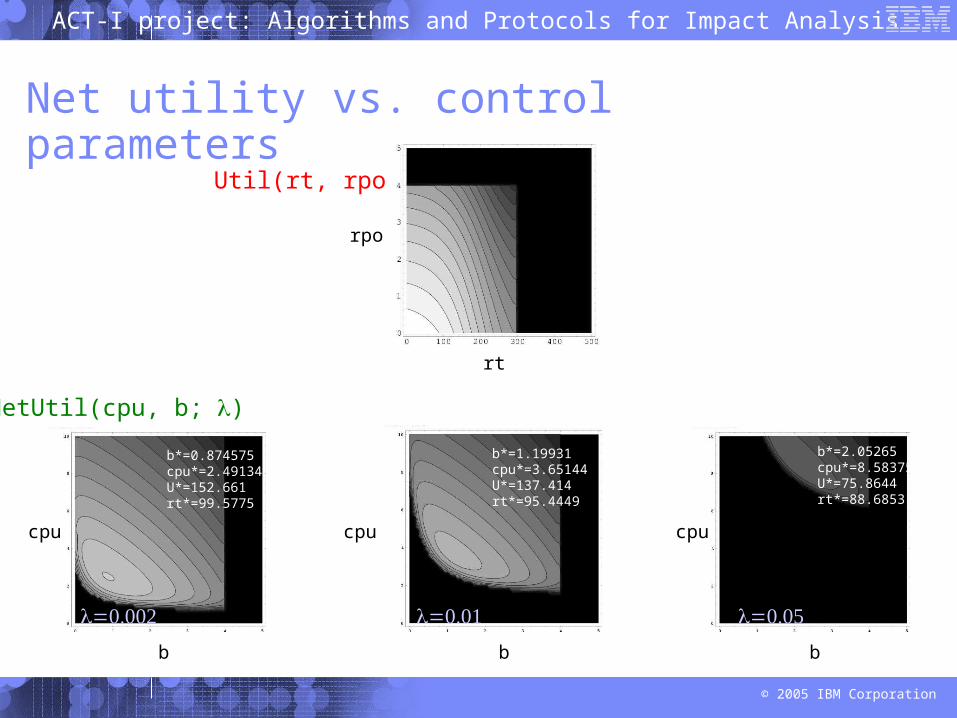
Net utility vs. control parameters
NetUtil(cpu, b; )
Util(rt, rpo)
rt
rpo
b
cpu
b*=0.874575cpu*=2.49134U*=152.661rt*=99.5775
b
cpu
b*=1.19931cpu*=3.65144U*=137.414rt*=95.4449
b
cpu
b*=2.05265cpu*=8.58375U*=75.8644rt*=88.6853
ACT-I project: Algorithms and Protocols for Impact Analysis
© 2005 IBM Corporation
Challenges at IT level
Elicit high-level IT objectives Manage to them Interactive effectively with administrators to
build trust
Tivoli Autonomic Computing
© 2003 IBM Corporation17
Towards Business-Driven IT
Business Objectives (e.g. KPIs)Business
Process Models
IT system
Monitored business data
Business to ITTools & Transforms
Automated Provisioning and
Deployment
Automatically provision, deploy DCM
Human Expertise
Policies
Business Process Tools & Transforms
Platform-Independent Models
Business Objectives and Metrics
High-level IT metrics, objectives
Convert objectives
Self-managing

© Motorola and IBM, 2005-2006Autonomic Systems and Networks – Theory and Practice Page 18
End-To-End Model-Based & Goal-Driven Deployment
“Rainforest” Deployment
DesignTool
Logical Application Structure
Developer
EAR
DBJSPTivoli
ProvisioningManager
Deployment Topology
EAR
DBJSP
Deployer
WEBServer
APPServer
DBServer
Logical Topology Model
RationalSoftware Architect
•Physical•Complete•Correct•Actionable
Automatically Combine Fine-Grained Best Practices Patterns To Transform the Logical Application Structure to a Physical Topology
Model Transformations(Best practices)
LdNode2
LdNode1
Firewall
VLAN1
VLAN2
LdNode1
LdNode2
Connection
Inse
rt F
irew
all
DomainExpert
LdNode2
LdNode1
Firewall
VLAN1
VLAN2
LdNode1
LdNode2
Connection
Inse
rt F
irew
all
LdNode2
LdNode1
Firewall
VLAN1
VLAN2
LdNode1
LdNode2
Connection
Inse
rt F
irew
all
Eilam et al. (IBM TJ Watson)

© Motorola and IBM, 2005-2006Autonomic Systems and Networks – Theory and Practice Page 19
Automated derivation of thresholds and goals from SLOs
Managed System Layer
AutomatedThreshold
Setting
Application Layer
Component
ComponentComponent
ComponentComponent
Componnet monitoring
Application Application Application
Component alerts
ManagementLayer
SLO violations
SLOs
Threshold setting
ApplicationMonitoring
Payroll BusinessInt App…
App Server DB2Server StorageServer
Disk Controller Disk Controller
Use statistical techniques to correlate SLO violations at Application Layer with monitored data in System Layer
Automatically set alert thresholds to desired false-positive / false-negative tradeoff
Originally presented at ICAC ‘05
Breitgand, Henis, Shehory (IBM Haifa)

Tivoli Autonomic Computing
© 2003 IBM Corporation20
Implications
Human specification of low-level platform- and resource-specific parameters and policies will be phased out.
Administrators will specify power, performance, availability and security objectives, and acceptable tradeoffs between them. Algorithms and interfaces for eliciting high-level IT objectives will emerge, as will standards for expressing them.
Models will capture human expert knowledge of how high level objectives relate to lower-level system parameters, and they will be refined automatically via feedback.
Resources will employ models in conjunction with optimization and planning technologies to manage to multiple objectives, both for deployment and runtime operations.
The entire stack of business-driven IT will be completed, as business objectives get transformed to high-level IT objectives that drive deployment and runtime operations. Standards for expressing business-level objectives will emerge.