tld uncertainties thesis - pdfs.semanticscholar.org€¦ · stockholm university karolinska...
TRANSCRIPT
Stockholm University Karolinska Institute Martha Hultquist
Analysis of the uncertainties in the
IAEA/WHO TLD postal dose audit programme
Thesis for Master of Science in Medical Radiation Physics
(Work conducted at the IAEA Dosimetry Laboratory)
I
Abstract
The International Atomic Energy Agency (IAEA) and the World Health Organisation (WHO)
operate the IAEA/WHO TLD postal dose audit programme. The purpose of the programme is to
verify the beam calibration in radiotherapy centres in developing countries and to check the
Secondary Standards Dosimetry Laboratories (SSDLs). Thermoluminescence dosimeters
(TLDs) are used as transfer dosimeters and the evaluation of these are done at the IAEA
Dosimetry Laboratory. In the present work the uncertainties in the process of dose
determination from TLD readings have been evaluated.
The analysis comprises the TLD reading reproducibility, uncertainties in the calibration
coefficient, and uncertainties in factors correcting for fading of TL signal, influence of TLD
holder, energy response and dose response non-linearity. The individual uncertainties were
combined to estimate the total uncertainty in the evaluated dose from TLD readings.
Experimental data from 2001-2005 were used in the analysis.
The total uncertainty has been estimated to be 1.2 % for irradiations with 60Co γ-rays and 1.6 %
for irradiations with high-energy X-rays. Results from irradiations by the Bureau International
des Poids et Mesures (BIPM), Primary Standard Dosimetry Laboratories (PSDLs), Secondary
Standard Dosimetry Laboratories (SSDLs) and reference centres compare favourably with the
estimated uncertainties.
The largest uncertainty components are in the energy correction factor (for high-energy X-rays)
with a value of 1.1 % and in the dose response non-linearity correction factor with a value of 0.9
%.
It has been shown that the acceptance limits of 5 % for TLD results of hospitals and 3.5 % for
SSDLs are justified when related to the uncertainties in the dose calculations and the uncertainty
in the determination of absorbed dose to water at the centre, as discussed in IAEA TRS-398
(IAEA, 2000), provided that it is followed.
II
Acknowledgements
First of all I would like to thank Dr. Joanna Izewska for giving me the opportunity to work on
this project at the IAEA and for supervising me.
I would also like to thank Mr. Pranabes Bera for introducing me to the IAEA TLD system and
for always being helpful and providing me with data. A big thanks also goes to Mr. Ladislav
Czap for being helpful and providing me with data.
Thanks also to Dr. Ahmed Meghzifane for the uncertainty analysis he has previously performed
on some relevant components.
Big thanks to Dr. Duncan Butler at the Australian Radiation and Nuclear Safety Agency
(ARPANSA) for providing me with the uncertainties in the reference irradiations performed
there.
I am also very grateful to Dr. Bo Nilsson and Dr. Mikael Andersson.
ABSTRACT ................................................................................................................................................ I ACKNOWLEDGEMENTS......................................................................................................................II 1 INTRODUCTION ...................................................................................................................................2 2 THE IAEA/WHO TLD POSTAL DOSE AUDIT PROGRAMME ....................................................3
2.1 GENERAL ............................................................................................................................................3 2.2 IRRADIATION PROCEDURE ..................................................................................................................4 2.3 EQUIPMENT ........................................................................................................................................6
3 THERMOLUMINESCENCE DOSIMETRY.......................................................................................9 3.1 ENERGY ABSORPTION .........................................................................................................................9 3.2 ENERGY RELEASE .............................................................................................................................10 3.3 FADING OF TL-SIGNAL .....................................................................................................................11 3.4 PHOTOTRANSFERRED THERMOLUMINESCENCE AND TRIBOTHERMOLUMINESCENCE.........................12 3.5 ENERGY RESPONSE ...........................................................................................................................12 3.6 DOSE RESPONSE................................................................................................................................12
4 EXPRESSION OF UNCERTAINTIES...............................................................................................14 4.1 TYPE A AND TYPE B EVALUATIONS..................................................................................................14 4.2 SENSITIVITY COEFFICIENTS...............................................................................................................15 4.3 COMBINED UNCERTAINTY ................................................................................................................15 4.4 EXPANDED UNCERTAINTY ................................................................................................................15
5 METHODS ............................................................................................................................................16 5.1 DETERMINATION OF THE DOSE FROM TLD READINGS ......................................................................16 5.2 UNCERTAINTIES IN TLD READING, CALIBRATION COEFFICIENT AND CORRECTION FACTORS............16
5.2.1 Mean TLD reading, M .............................................................................................................16 5.2.2 Calibration coefficient, N........................................................................................................16 5.2.3 Fading correction, ffad .............................................................................................................19 5.2.4 Holder correction, fhol ..............................................................................................................20 5.2.5 Energy correction, fengy ...........................................................................................................20 5.2.6 Dose response non-linearity correction, flin ............................................................................21
5.3 COMBINED UNCERTAINTY................................................................................................................22 5.4 UNCERTAINTY IN THE RATIO DTLD/DSTAT ...........................................................................................22 5.5 QA OF THE IAEA TLD SYSTEM .......................................................................................................22
6 RESULTS...............................................................................................................................................23 6.1 RESULTS OF UNCERTAINTY IN TLD READING, CALIBRATION COEFFICIENT AND CORRECTION FACTORS.................................................................................................................................................23
6.1.1 Uncertainty in mean TLD reading, M.....................................................................................23 6.1.2 Uncertainty in Calibration coefficient, N................................................................................24 6.1.3 Uncertainty in fading correction, ffad ......................................................................................26 6.1.4 Uncertainty in holder correction, fhol ......................................................................................29 6.1.5 Uncertainty in energy correction, fengy ....................................................................................29 6.1.6 Uncertainty in dose response non-linearity correction, flin .....................................................29
6.2 RESULTS OF COMBINED UNCERTAINTY .............................................................................................31 6.3 RESULTS OF UNCERTAINTY IN THE RATIO DTLD/DSTAT........................................................................31 6.4 RESULTS OF QA OF THE IAEA TLD SYSTEM....................................................................................33
7 DISCUSSION.........................................................................................................................................35 8 CONCLUSIONS....................................................................................................................................38 REFERENCES .........................................................................................................................................39
2
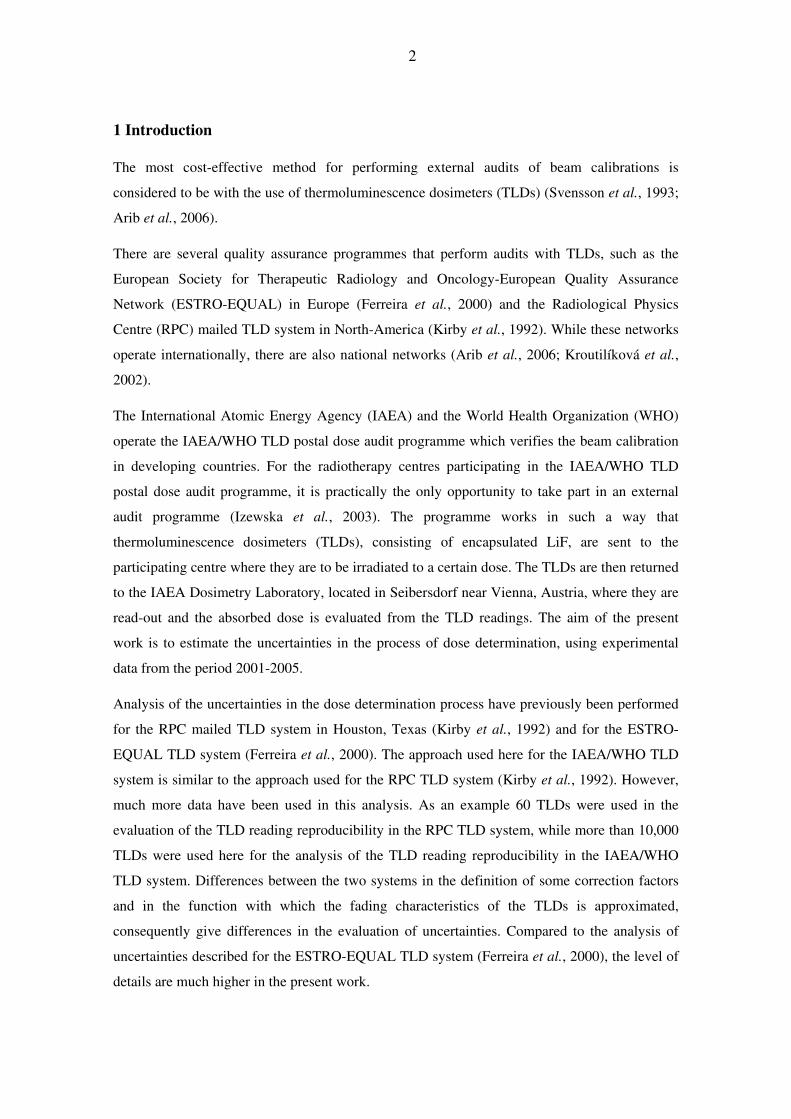
1 Introduction
The most cost-effective method for performing external audits of beam calibrations is
considered to be with the use of thermoluminescence dosimeters (TLDs) (Svensson et al., 1993;
Arib et al., 2006).
There are several quality assurance programmes that perform audits with TLDs, such as the
European Society for Therapeutic Radiology and Oncology-European Quality Assurance
Network (ESTRO-EQUAL) in Europe (Ferreira et al., 2000) and the Radiological Physics
Centre (RPC) mailed TLD system in North-America (Kirby et al., 1992). While these networks
operate internationally, there are also national networks (Arib et al., 2006; Kroutilíková et al.,
2002).
The International Atomic Energy Agency (IAEA) and the World Health Organization (WHO)
operate the IAEA/WHO TLD postal dose audit programme which verifies the beam calibration
in developing countries. For the radiotherapy centres participating in the IAEA/WHO TLD
postal dose audit programme, it is practically the only opportunity to take part in an external
audit programme (Izewska et al., 2003). The programme works in such a way that
thermoluminescence dosimeters (TLDs), consisting of encapsulated LiF, are sent to the
participating centre where they are to be irradiated to a certain dose. The TLDs are then returned
to the IAEA Dosimetry Laboratory, located in Seibersdorf near Vienna, Austria, where they are
read-out and the absorbed dose is evaluated from the TLD readings. The aim of the present
work is to estimate the uncertainties in the process of dose determination, using experimental
data from the period 2001-2005.
Analysis of the uncertainties in the dose determination process have previously been performed
for the RPC mailed TLD system in Houston, Texas (Kirby et al., 1992) and for the ESTRO-
EQUAL TLD system (Ferreira et al., 2000). The approach used here for the IAEA/WHO TLD
system is similar to the approach used for the RPC TLD system (Kirby et al., 1992). However,
much more data have been used in this analysis. As an example 60 TLDs were used in the
evaluation of the TLD reading reproducibility in the RPC TLD system, while more than 10,000
TLDs were used here for the analysis of the TLD reading reproducibility in the IAEA/WHO
TLD system. Differences between the two systems in the definition of some correction factors
and in the function with which the fading characteristics of the TLDs is approximated,
consequently give differences in the evaluation of uncertainties. Compared to the analysis of
uncertainties described for the ESTRO-EQUAL TLD system (Ferreira et al., 2000), the level of
details are much higher in the present work.
3
2 The IAEA/WHO TLD postal dose audit programme
2.1 General
The IAEA and the WHO started the IAEA/WHO TLD postal dose audit programme in 1969
(Izewska and Andreo, 2000; Izewska et al., 2002; Izewska et al., 2004). The motive of the
programme is to improve the accuracy and consistency of clinical dosimetry in radiotherapy
hospitals worldwide. Since 1981 the programme also audits Secondary Standard Dosimetry
Laboratories (SSDLs) with the objective of achieving consistency in basic dosimetry throughout
the world.
Initially the programme was developed for 60Co therapy units, but also includes since 1991
audits of high-energy X-rays produced by clinical accelerators.
The programme is a cooperation between the IAEA and the WHO and in general the WHO is
responsible for coordinating the distribution of the dosimeters, while the IAEA is responsible
for the technical aspects of the TLD programme, which includes the evaluation of the
dosimeters.
The maximum acceptable discrepancy between the dose stated by the centre and the dose
evaluated by the IAEA is 5 %. Should the discrepancy be larger, an additional audit is
performed. If the second audit also gives a deviation larger than the limit, the centre is offered
assistance from the IAEA in order to resolve the problem. For SSDLs the acceptance limit is 3.5
%. The participant receives a data sheet which is to be filled in. The provided information
should include the method used for determining the absorbed dose, which facilitates an
investigation in case of an unacceptable result.
In general a beam at a participating centre is checked biennially, except in cases when results
outside the acceptance limit have recently been encountered. Yearly checks are performed in
these cases.
Results of TLD irradiations performed during 1969-2003 in Eastern and South-Eastern Europe
and Latin America have previously been discussed elsewhere (Izewska et al., 2004, 2006) as
well as the results of TLD irradiations performed worldwide during 1998-2001 (Izewska et al.,
2003). Hospitals that regularly participate in the programme obtain better results than those
participating for the first time. Analysis of results from recent years show that the percentage of
centres participating for the first time and having results within the acceptance limit is 78 %,
while 90 % of the centres participating regularly have acceptable results (Izewska et al., 2004).
4
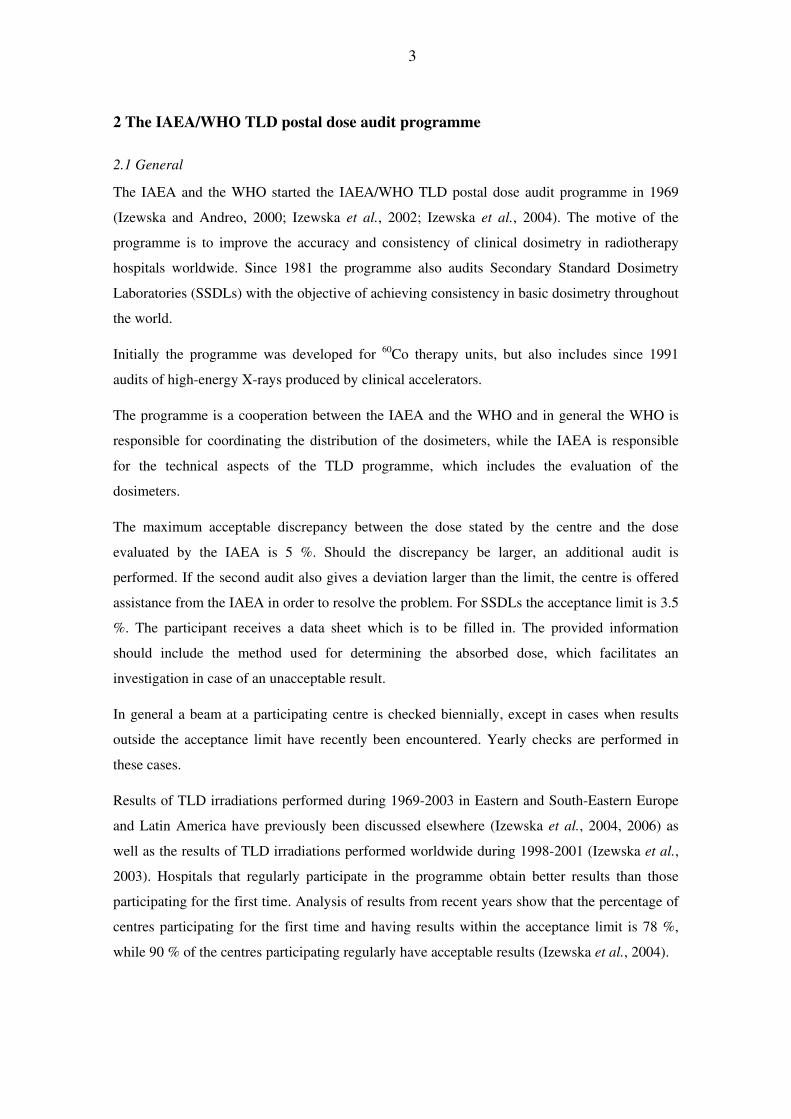
2.2 Irradiation Procedure
The procedure of the IAEA/WHO TLD postal dose audit programme is shown in Figure 1.
The participating radiotherapy centre is asked to irradiate two TL dosimeters in sequence to a
dose of 2 Gy to water. The irradiation is to take place under the conditions of 10 cm depth in
water, 10 cm x 10 cm field size and the nominal source-to-surface distance (SSD) or source-to-
axis distance (SAD) used clinically in the centre. Participating SSDLs are asked to irradiate
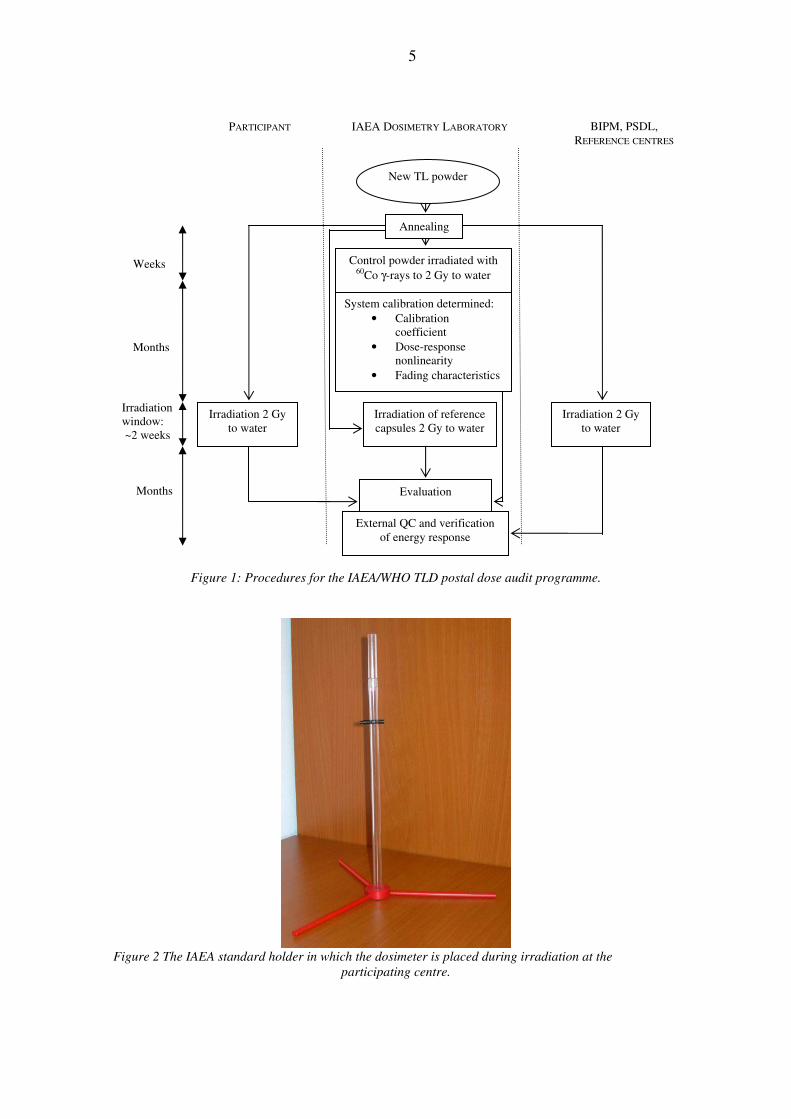
three TLDs under reference conditions. During irradiation the dosimeter is placed in a plastic
holder which is provided by the IAEA. The holder is shown in Figure 2.
It is requested that the irradiation takes place during a specific time frame (irradiation window)
which is usually the second half of the month. The calibration coefficient used in the dose
evaluation is determined from the so called reference capsules which are irradiated at the IAEA
within the same irradiation window as the participant's dosimeters, since it is important that the
fading is about the same for both types of dosimeters.
In addition to the TLDs that are to be irradiated, one control capsule that has already been
irradiated to 2 Gy at the IAEA is also sent to the centre. This dosimeter is used to detect
possible environmental influences during the transport and storage of the TLDs.
As an external quality control, reference irradiations are performed in every irradiation window
by the Bureau International des Poids et Mesures (BIPM) or by at least one Primary Standard
Dosimetry Laboratory (PSDL) and by a reference centre. Reference centres are leading
hospitals in IAEA Member States. The primary level laboratories and reference centres provide
the IAEA with irradiations with 60Co γ-rays. In addition, a few PSDLs and all reference centres
irradiate TLDs with high-energy X-ray beams. The reference irradiations are used as an external
verification of the accuracy of the dose determination by the IAEA and those performed at
reference centres are also used to verify the energy correction values.
For every annealed batch of LiF powder the system calibration, which includes the calibration
coefficient, dose response non-linearity and fading characteristics, is determined. Control
powder is irradiated with 2 Gy at the IAEA and is used to follow the fluctuations of the reader.
5
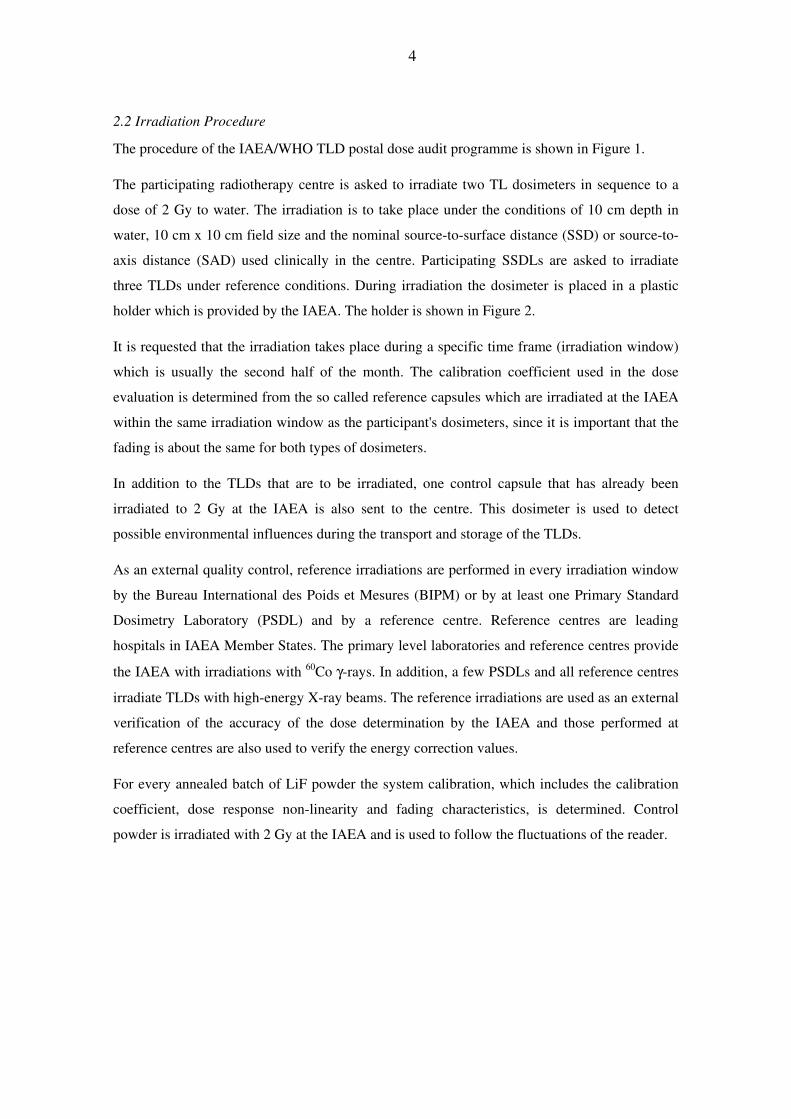
Figure 1: Procedures for the IAEA/WHO TLD postal dose audit programme.
Figure 2 The IAEA standard holder in which the dosimeter is placed during irradiation at the
participating centre.
IAEA DOSIMETRY LABORATORY PARTICIPANT
New TL powder
System calibration determined: • Calibration
coefficient • Dose-response
nonlinearity • Fading characteristics
Control powder irradiated with 60Co γ-rays to 2 Gy to water
Irradiation 2 Gy to water
Irradiation 2 Gy to water
Evaluation
BIPM, PSDL, REFERENCE CENTRES
External QC and verification of energy response
Annealing
Irradiation of reference capsules 2 Gy to water
Weeks
Months
Irradiation window: ~2 weeks
Months
6
2.3 Equipment
The IAEA TLD system for radiotherapy dosimetry has been described elsewhere (Izewska et
al., 2002). Virgin lithium fluoride powder, Li:Mg,Ti, type TLD-100 (Harshaw) is used as TL
material and before the powder is used it is annealed at 400 °C for 1 hour followed by fast
cooling and subsequent annealing at 80 °C for 24 hours. It is then stored for at least two weeks
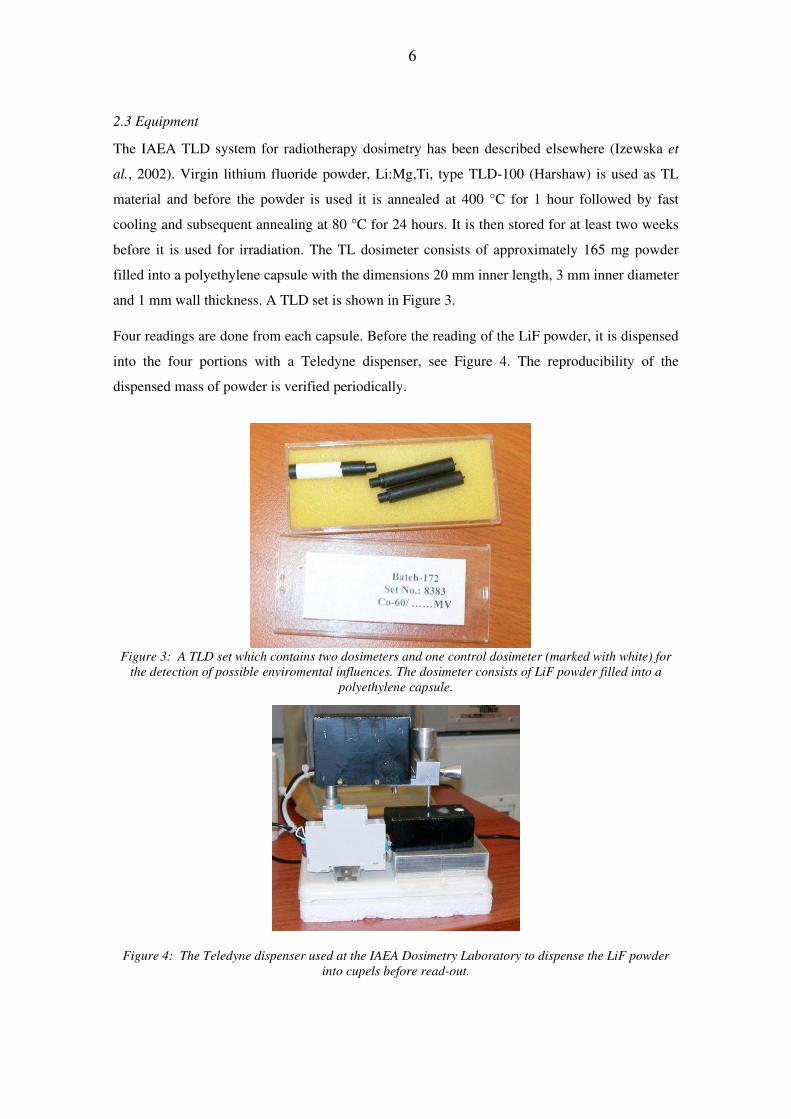
before it is used for irradiation. The TL dosimeter consists of approximately 165 mg powder
filled into a polyethylene capsule with the dimensions 20 mm inner length, 3 mm inner diameter
and 1 mm wall thickness. A TLD set is shown in Figure 3.
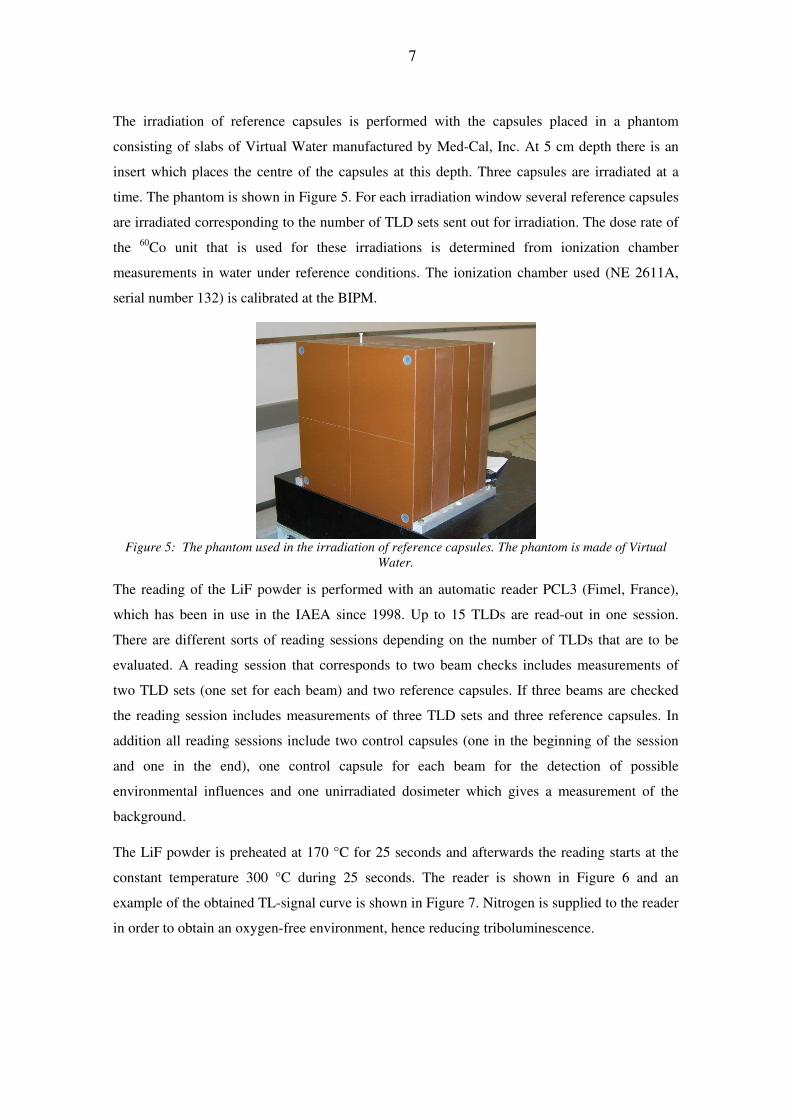
Four readings are done from each capsule. Before the reading of the LiF powder, it is dispensed
into the four portions with a Teledyne dispenser, see Figure 4. The reproducibility of the
dispensed mass of powder is verified periodically.
Figure 3: A TLD set which contains two dosimeters and one control dosimeter (marked with white) for the detection of possible enviromental influences. The dosimeter consists of LiF powder filled into a
polyethylene capsule.
Figure 4: The Teledyne dispenser used at the IAEA Dosimetry Laboratory to dispense the LiF powder into cupels before read-out.
7
The irradiation of reference capsules is performed with the capsules placed in a phantom
consisting of slabs of Virtual Water manufactured by Med-Cal, Inc. At 5 cm depth there is an
insert which places the centre of the capsules at this depth. Three capsules are irradiated at a
time. The phantom is shown in Figure 5. For each irradiation window several reference capsules
are irradiated corresponding to the number of TLD sets sent out for irradiation. The dose rate of
the 60Co unit that is used for these irradiations is determined from ionization chamber
measurements in water under reference conditions. The ionization chamber used (NE 2611A,
serial number 132) is calibrated at the BIPM.
Figure 5: The phantom used in the irradiation of reference capsules. The phantom is made of Virtual
Water.
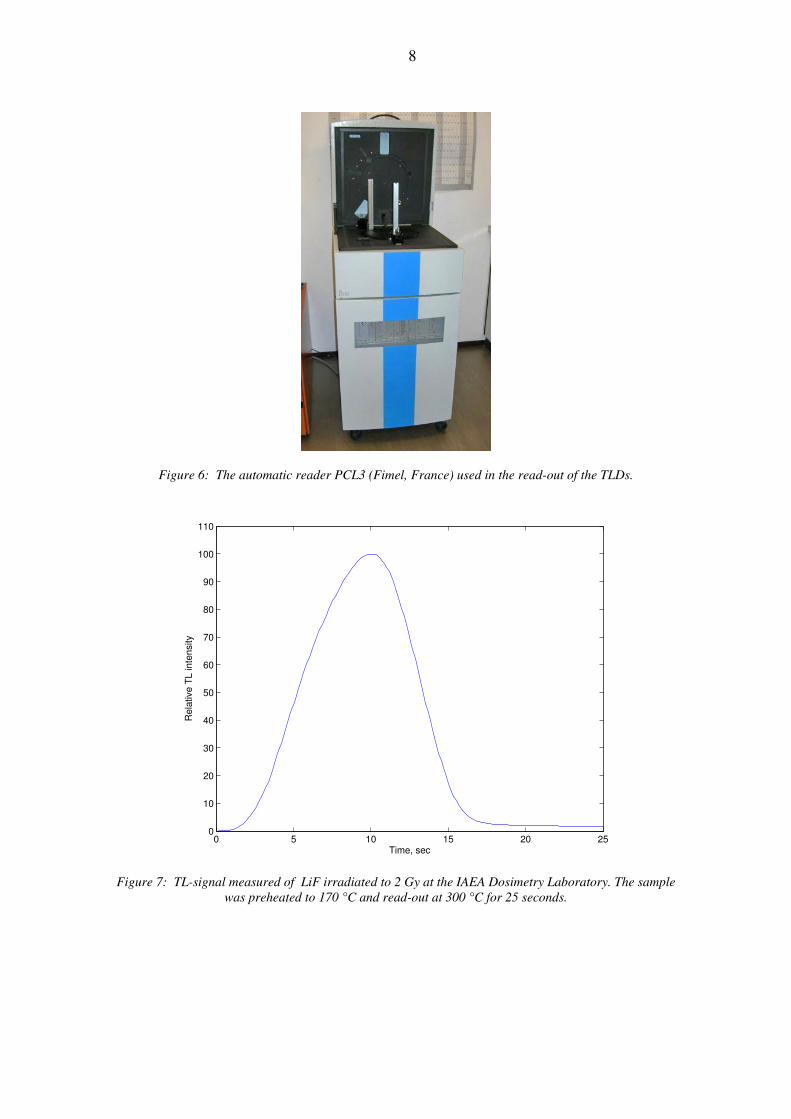
The reading of the LiF powder is performed with an automatic reader PCL3 (Fimel, France),
which has been in use in the IAEA since 1998. Up to 15 TLDs are read-out in one session.
There are different sorts of reading sessions depending on the number of TLDs that are to be
evaluated. A reading session that corresponds to two beam checks includes measurements of
two TLD sets (one set for each beam) and two reference capsules. If three beams are checked
the reading session includes measurements of three TLD sets and three reference capsules. In
addition all reading sessions include two control capsules (one in the beginning of the session
and one in the end), one control capsule for each beam for the detection of possible
environmental influences and one unirradiated dosimeter which gives a measurement of the
background.
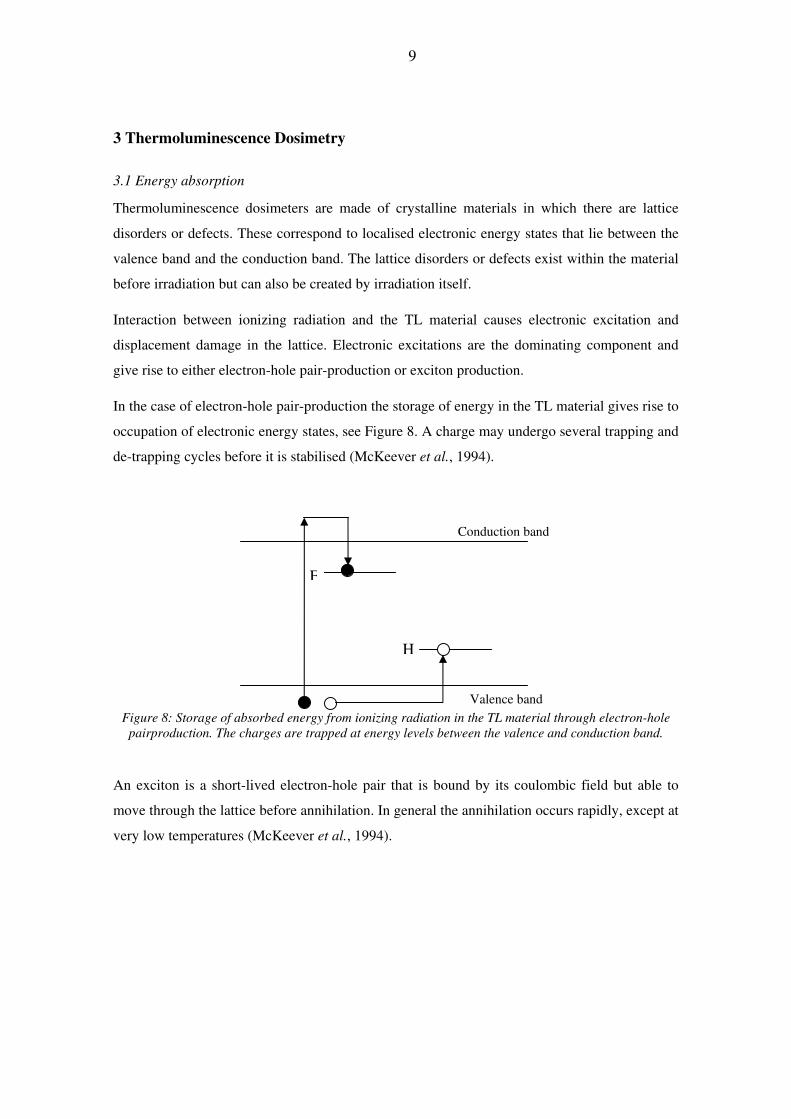
The LiF powder is preheated at 170 °C for 25 seconds and afterwards the reading starts at the
constant temperature 300 °C during 25 seconds. The reader is shown in Figure 6 and an
example of the obtained TL-signal curve is shown in Figure 7. Nitrogen is supplied to the reader
in order to obtain an oxygen-free environment, hence reducing triboluminescence.
8
Figure 6: The automatic reader PCL3 (Fimel, France) used in the read-out of the TLDs.
0 5 10 15 20 25
0
10
20
30
40
50
60
70
80
90
100
110
Time, sec
Rel
ativ
e TL
inte
nsity
Figure 7: TL-signal measured of LiF irradiated to 2 Gy at the IAEA Dosimetry Laboratory. The sample was preheated to 170 °C and read-out at 300 °C for 25 seconds.
9
3 Thermoluminescence Dosimetry
3.1 Energy absorption
Thermoluminescence dosimeters are made of crystalline materials in which there are lattice
disorders or defects. These correspond to localised electronic energy states that lie between the
valence band and the conduction band. The lattice disorders or defects exist within the material
before irradiation but can also be created by irradiation itself.
Interaction between ionizing radiation and the TL material causes electronic excitation and
displacement damage in the lattice. Electronic excitations are the dominating component and
give rise to either electron-hole pair-production or exciton production.
In the case of electron-hole pair-production the storage of energy in the TL material gives rise to
occupation of electronic energy states, see Figure 8. A charge may undergo several trapping and
de-trapping cycles before it is stabilised (McKeever et al., 1994).
Figure 8: Storage of absorbed energy from ionizing radiation in the TL material through electron-hole
pairproduction. The charges are trapped at energy levels between the valence and conduction band.
An exciton is a short-lived electron-hole pair that is bound by its coulombic field but able to
move through the lattice before annihilation. In general the annihilation occurs rapidly, except at
very low temperatures (McKeever et al., 1994).
E
H
Conduction band
Valence band
10
3.2 Energy release
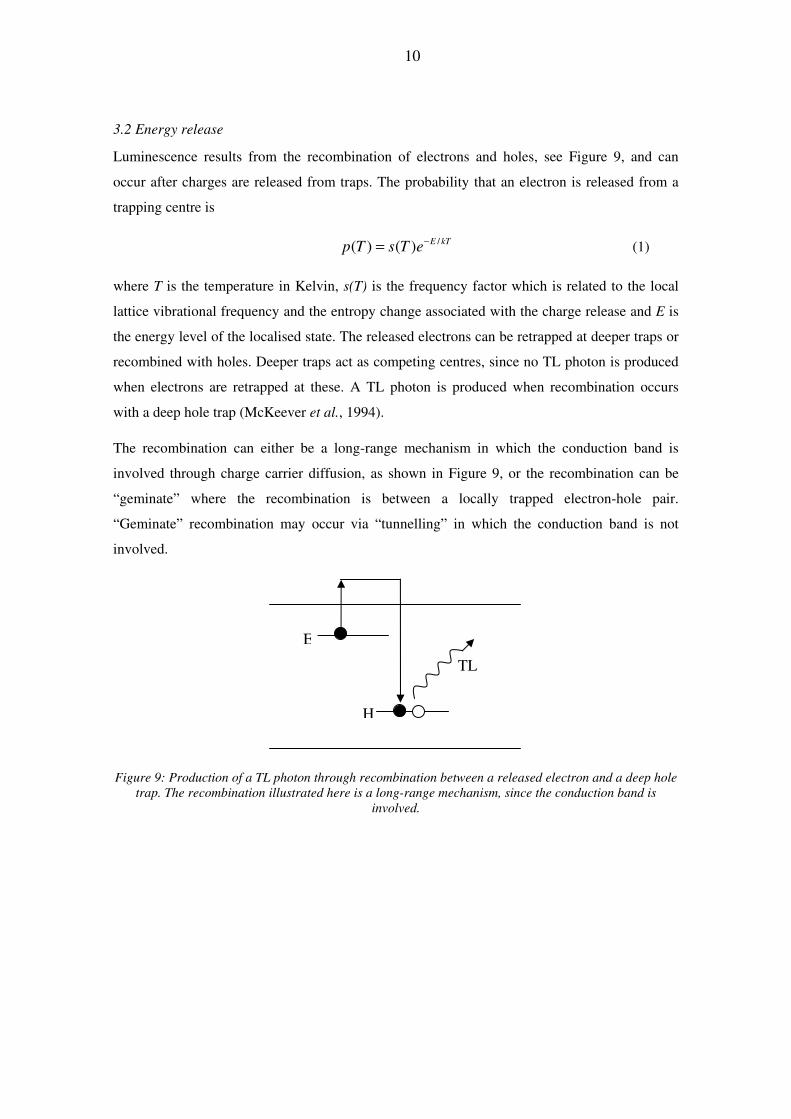
Luminescence results from the recombination of electrons and holes, see Figure 9, and can
occur after charges are released from traps. The probability that an electron is released from a
trapping centre is
/( ) ( ) E kTp T s T e−= (1)
where T is the temperature in Kelvin, s(T) is the frequency factor which is related to the local
lattice vibrational frequency and the entropy change associated with the charge release and E is
the energy level of the localised state. The released electrons can be retrapped at deeper traps or
recombined with holes. Deeper traps act as competing centres, since no TL photon is produced
when electrons are retrapped at these. A TL photon is produced when recombination occurs
with a deep hole trap (McKeever et al., 1994).
The recombination can either be a long-range mechanism in which the conduction band is
involved through charge carrier diffusion, as shown in Figure 9, or the recombination can be
“geminate” where the recombination is between a locally trapped electron-hole pair.
“Geminate” recombination may occur via “tunnelling” in which the conduction band is not
involved.
Figure 9: Production of a TL photon through recombination between a released electron and a deep hole trap. The recombination illustrated here is a long-range mechanism, since the conduction band is
involved.
E
H
TL
11
3.3 Fading of TL-signal
The TL-signal decreases, or fades, over time. The fading have several causes and includes
thermal fading, anomalous fading and fading due to optical effects. The dominant component is
thermal fading, in which the release of trapped charges is thermally induced. The probability of
this event is given by Equation 1, i.e. the thermal fading is dictated by the trap depth E and the
frequency factor s(T) (McKeever et al., 1994).
Anomalous fading is when the TL-signal decays significantly, even though it is not expected to
do so thermally. It is believed that there are two major causes for this: quantum mechanical
tunnelling of the trapped charge to the recombination site, and localised transitions which do not
take place via the delocalised bands (McKeever et al., 1994). Localised transition is thermally
induced occupation of an energy level from which a transition into the recombination centre is
allowed (McKeever and Chen, 1997).
Optical effects include optical excitation of the charge from the trap and consequently a
reduction in the TL-signal.
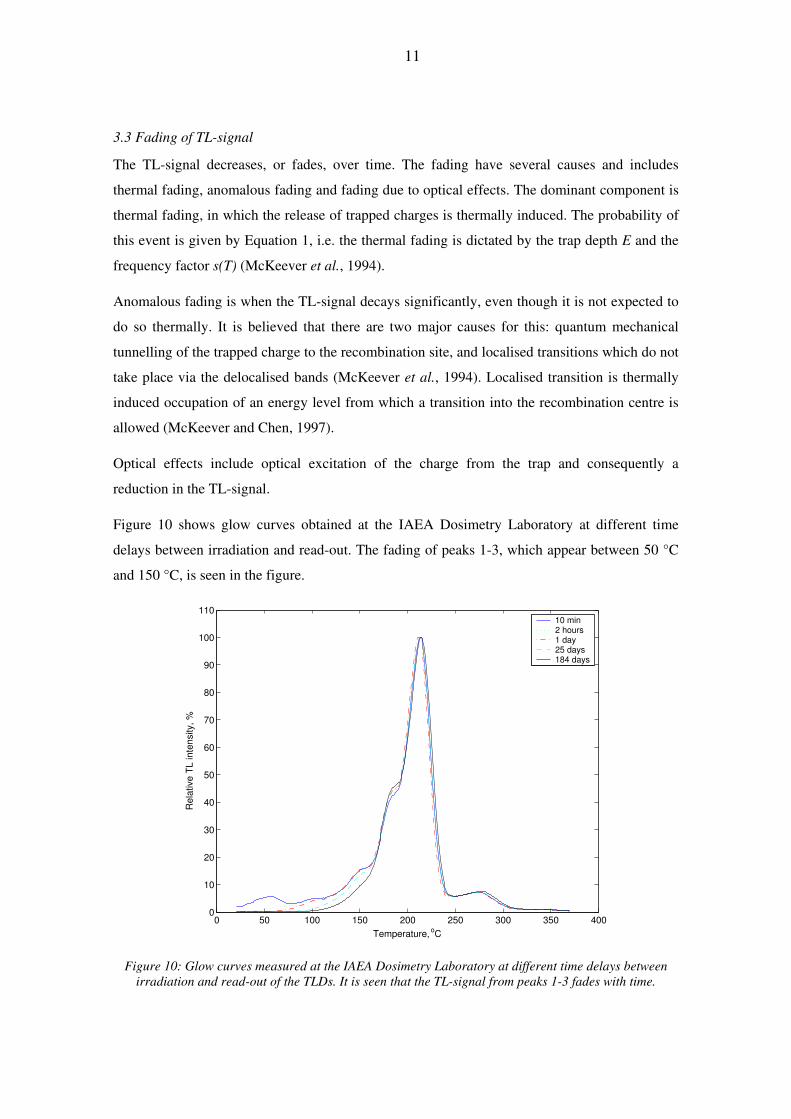
Figure 10 shows glow curves obtained at the IAEA Dosimetry Laboratory at different time
delays between irradiation and read-out. The fading of peaks 1-3, which appear between 50 °C
and 150 °C, is seen in the figure.
0 50 100 150 200 250 300 350 400
0
10
20
30
40
50
60
70
80
90
100
110
Temperature, oC
Rel
ativ
e TL
inte
nsity
, %
10 min2 hours1 day25 days184 days
Figure 10: Glow curves measured at the IAEA Dosimetry Laboratory at different time delays between irradiation and read-out of the TLDs. It is seen that the TL-signal from peaks 1-3 fades with time.
12
3.4 Phototransferred thermoluminescence and Tribothermoluminescence
Phototransferred thermoluminescence (PTTL) occurs when charges are transferred from deeper
traps into more shallow traps during optical absorption (McKeever and Chen, 1997). TL may
then result when the sample is heated.
Tribothermoluminescence is mechanically induced TL. It is mostly problematic with powdered
materials, but can be reduced by reading out the TLD in an oxygen-free atmosphere (Schulman
et al., 1960).
3.5 Energy response
For a given dose the detected TL-signal varies as a function of energy of the absorbed radiation,
due to the dependence of the TL material’s absorption coefficient on radiation energy. The
photon energy response is defined as
( )( )
/( )
/en m
Een ref
S Eµ ρµ ρ
= (2)
where (µen/ρ) is the mass energy absorption coefficient of the material and the subscripts m and
ref refer to the TLD material and to a reference material respectively (McKeever et al., 1994).
The relative energy response, RER, is defined as the ratio of the energy response of photons
with energy E to the response of 60Co γ−rays:
( )
( )60E
E
S ERER
S Co= (3)
When the application of the TLD is to determine the dose absorbed by human tissue, it is
preferable to have tissue-equivalent TLD materials (Zeff = 7.4). LiF has Zeff = 8.14 and is almost
tissue-equivalent.
3.6 Dose response
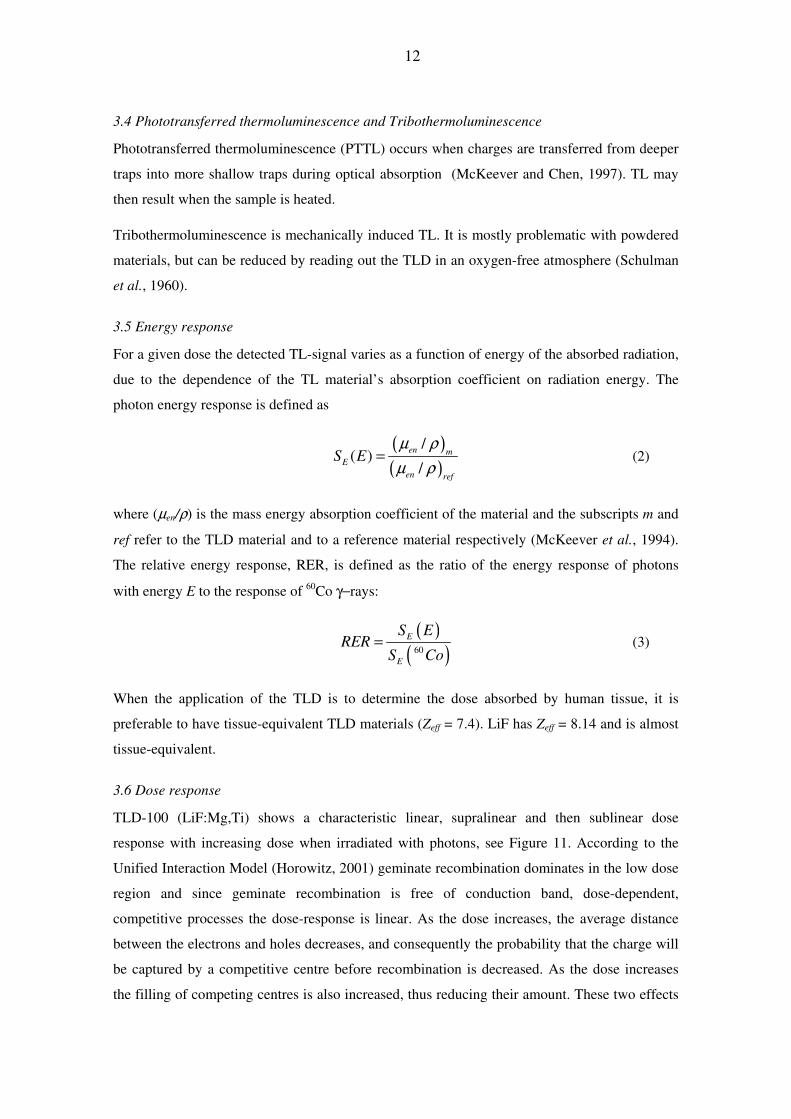
TLD-100 (LiF:Mg,Ti) shows a characteristic linear, supralinear and then sublinear dose
response with increasing dose when irradiated with photons, see Figure 11. According to the
Unified Interaction Model (Horowitz, 2001) geminate recombination dominates in the low dose
region and since geminate recombination is free of conduction band, dose-dependent,
competitive processes the dose-response is linear. As the dose increases, the average distance
between the electrons and holes decreases, and consequently the probability that the charge will
be captured by a competitive centre before recombination is decreased. As the dose increases
the filling of competing centres is also increased, thus reducing their amount. These two effects
13
of increasing dose are believed to cause the supralinear part of the dose-response curve
according to the model. Eventually the dose-repsonse curve reaches saturation and becomes
sublinear due to damage effects.
In a recent study of TLD-100, peaks 4 and 5 were found to be linear up to 1-5 Gy, while high-
temperature peaks were linear only up to 0.05-0.2 Gy (Massillon-JL et al., 2006). However, the
onset of supralinearity depends on a great number of instrumental, radiation field and material
parameters (Horowitz, 2001).
Log(D)
Log(
TL)
Figure 11: Schematic dose response curve for TLD-100. The TL-signal per unit dose is first linear,
supralinear and then sublinear with increasing dose.
14
4 Expression of uncertainties
The methodology used in the present work for estimating the uncertainties is based on the
recommendations of the ISO ”Guide to the Expression of Uncertainty in Measurement”
(ISO/IEC/OIML/BIPM, 1992). This section gives a brief summary of these recommendations.
4.1 Type A and Type B evaluations
In most cases the measurand Y is a function of the N measurable quantities X1, X2,...,XN, that is
Y=f(X1,X2,...,XN) (4)
and so the estimate y of the measurand Y depends on the input estimates x1,x2,...,xN for the values
of X1, X2,...,XN
y=f(x1,x2,...,xN) (5)
The standard uncertainty of the input estimate xi is denoted by u(xi) and can be evaluated either
as a Type A uncertainty or as a Type B uncertainty. Type A uncertainties are evaluated using
statistical analysis on a series of repeated observations, while evaluation of Type B uncertainties
are based on means other than statistical analysis. Examples of means to evaluate Type B
uncertainties are using an a priori distribution, using information from manufacturer's
specifications or using general knowledge of the behaviour and properties of relevant
instruments.
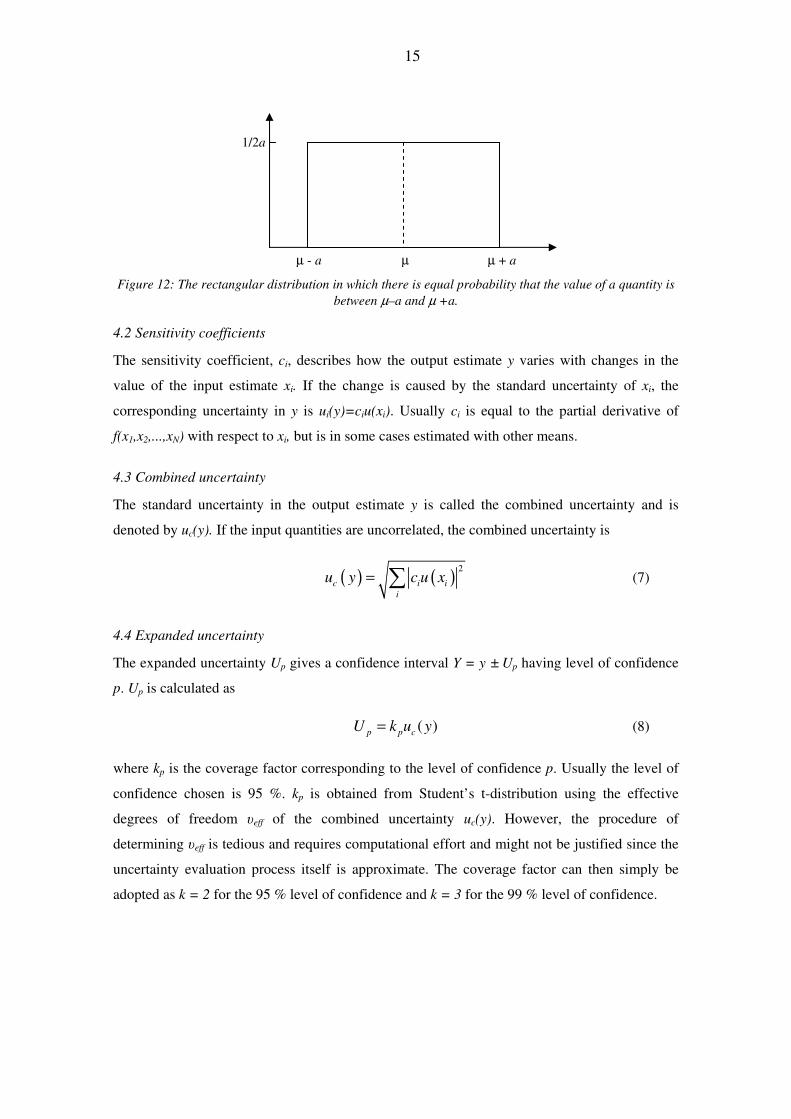
An example of a Type B uncertainty is the uncertainty in the positioning of an item. It is
recommended that the distribution used in this case is the rectangular distribution, which
implies that there is equal probability for the item to be positioned between the limits µ–a and
µ+a, where a is the estimated maximum displacement from the position µ, see Figure 12. The
uncertainty is then estimated as the standard deviation of the distribution, which is
3
aσ = (6)
15
Figure 12: The rectangular distribution in which there is equal probability that the value of a quantity is
between µ–a and µ +a.
4.2 Sensitivity coefficients
The sensitivity coefficient, ci, describes how the output estimate y varies with changes in the
value of the input estimate xi. If the change is caused by the standard uncertainty of xi, the
corresponding uncertainty in y is ui(y)=ciu(xi). Usually ci is equal to the partial derivative of
f(x1,x2,...,xN) with respect to xi, but is in some cases estimated with other means.
4.3 Combined uncertainty
The standard uncertainty in the output estimate y is called the combined uncertainty and is
denoted by uc(y). If the input quantities are uncorrelated, the combined uncertainty is
( ) ( ) 2
c i ii
u y c u x= � (7)
4.4 Expanded uncertainty
The expanded uncertainty Up gives a confidence interval Y = y ± Up having level of confidence
p. Up is calculated as
( )p p cU k u y= (8)
where kp is the coverage factor corresponding to the level of confidence p. Usually the level of
confidence chosen is 95 %. kp is obtained from Student’s t-distribution using the effective
degrees of freedom �eff of the combined uncertainty uc(y). However, the procedure of
determining �eff is tedious and requires computational effort and might not be justified since the
uncertainty evaluation process itself is approximate. The coverage factor can then simply be
adopted as k = 2 for the 95 % level of confidence and k = 3 for the 99 % level of confidence.
1/2a
µ - a µ + a µ
16
5 Methods
5.1 Determination of the dose from TLD readings
The absorbed dose to water at the position of the TLD is determined as
linengyholfad ffffNMD ⋅⋅⋅⋅⋅= (9)
where M is the mean of the TLD readings from the capsule, N is the calibration coefficient, ffad
is the fading correction factor, fhol is the holder correction factor, fengy is the energy correction
factor and flin is the dose response non-linearity correction factor.
5.2 Uncertainties in TLD reading, calibration coefficient and correction factors
5.2.1 Mean TLD reading, M
As mentioned earlier, four readings are done from each capsule and the TLD reading, M, which
is used in Equation 9 to determine the absorbed dose, is the mean of these readings. The
uncertainty in the mean TLD reading of a single capsule can be estimated as the arithmetic
mean of the distribution of standard deviations of the mean for a large number of TLDs that
have been irradiated with the same dose:
,
( )M i i
i i
s su M
l n l= =
⋅
� � (10)
where sM,i is the experimental standard deviation of the mean reading of the i:th capsule, si is the
standard deviation of the readings of the i:th capsule, n is the number of readings per capsule
(n = 4) and l is the total number of capsules in the distribution. l should be large in order to get
good statistics. The evaluation described here is of Type A.
5.2.2 Calibration coefficient, N
The calibration coefficient of the TLD system used in the dose evaluation is determined in each
reading session from the reference capsules according to
i
i i
DM B
Nm
−=�
(11)
where Di and Mi are the dose given to and the reading of the i:th reference capsule respectively,
B is the average background reading and m is the number of reference capsules. m is two or
three depending on the number of TLD sets being evaluated in the same reading session.
17
Reference capsules are irradiated at the IAEA in a 60Co γ-ray beam under reference conditions.
The uncertainty in the TLD calibration coefficient arises from the determination of the 60Co
dose rate, and the irradiation and reading of the TLDs. The combined relative uncertainty in the
calibration coefficient is calculated as
2 2 2 2 2( ) ( ) ( ) ( ) ( )
( ) i i ic
u D u M u D u irr u Mu N
m m+ + += =
�
(12)
where u � �D � is the relative uncertainty in the dose rate, u(irr) the relative uncertainty in the
irradiation of a TLD capsule and u(Mi) is the relative uncertainty in the reading of a capsule.
Since the average background reading is many orders of magnitude smaller than the reading of a
capsule, its contribution to the uncertainty is neglected.
The determination of the dose rate is done from ionization chamber measurements in water
following the IAEA TRS-398 code of practice (IAEA, 2000). The dose rate is determined as
0,
0D W stab elec VW
PTD N I k k k
T P= ⋅ ⋅ ⋅ ⋅ ⋅ ⋅� (13)
where ND,W is the calibration coefficient of the ionization chamber, I is the mean chamber
reading, kstab is the correction for the stability of the ionization chamber and electrometer, kelec is
the calibration coefficient of the voltmeter and capacitor, T and P are the measured temperature
and pressure, T0 and P0 are the reference temperature and pressure and kVW is the virtual water to
water correction. In addition to the uncertainties in the factors in Equation 13, the uncertainty in
the positioning of the chamber and the phantom also contributes to the uncertainty in the
determined dose rate.
The Type A and Type B uncertainties in ND,W are given in the calibration certificate from the
BIPM. The uncertainties in I, kstab, kelec, T and P have previously been estimated and are given in
an IAEA internal report1.
The Type A uncertainty in the mean ionization chamber reading was estimated as the standard
deviation of the mean of a series of readings. The uncertainty in kstab was estimated from a series
of output measurements and is treated as a Type B evaluation, since it is not determined during
each measurement. The uncertainties in the calibration of the voltmeter and capacitor, kelec, are
considered as Type B uncertainties.
1 DOLP.011 Appendix 2: ESTIMATION OF UNCERTAINTIES Explanatory note on the assessment of uncertainties of calibrations at the Agency Dosimetry Laboratory
18
The temperature measurements are performed with a thermometer placed inside a simulated
cavity ion chamber. The Type B uncertainty in the measured temperature was evaluated from
the estimated maximum difference between the temperature measured by the probe and the
temperature inside the ionization chamber, and from another component arising from the
resolution of the thermometer. Both components were assumed to have rectangular
distributions.
The uncertainty in the pressure measurements arises from the calibration of the barometer, its
resolution and the uncertainty in the mean readings. The uncertainty in the calibration was
evaluated as a Type B component from the maximum difference between the readings of the
barometer and that of the reference barometer during calibration and assuming a rectangular
distribution. The Type B component arising from the resolution was also assumed to have a
rectangular distribution and the uncertainty in the mean readings was Type A evaluated as the
standard deviation of the mean from a series of readings.
The uncertainties in the positioning of the chamber and phantom are estimated as the standard
deviation obtained from a rectangular distribution according to Equation 6. In the case of
chamber positioning the sensitivity coefficient, ccpos, is obtained from the normalized depth dose
curve that has been measured for the 60Co-unit, and is equal to the dose gradient per mm at the
depth of measurement (50 mm). Thus, the uncertainty in the dose rate due to chamber
positioning, ucpos� �D � is
( ) ( )cpos cposu D c u cpos= ⋅� (14)
where u(cpos) is the uncertainty in chamber positioning obtained from the rectangular
distribution according to Equation 6.
The ionization chamber measurements are carried out in a water phantom, whereas the
irradiation of the TLDs takes place in a virtual water phantom. A correction factor for this has
been established and the Type A uncertainty in the factor is determined from the reproducibility
of a series of measurements. The combined uncertainty in the dose rate is calculated as a
quadratic sum of the uncertainties in the above-mentioned components.
Uncertainty in the irradiation of the TLDs arises due to uncertainties in the positioning of the
TLDs and the phantom, and uncertainty in the timer of the 60Co machine. The Type B
evaluation of the uncertainty in the positioning of the TLDs in the virtual water phantom
follows the same procedure as with the positioning of the ionization chamber in the water
phantom. The Type B uncertainty in the timer is assumed to arise from its resolution.
19
The Type A evaluation of the uncertainty in the mean TLD reading from one capsule is
described in section 5.2.1.
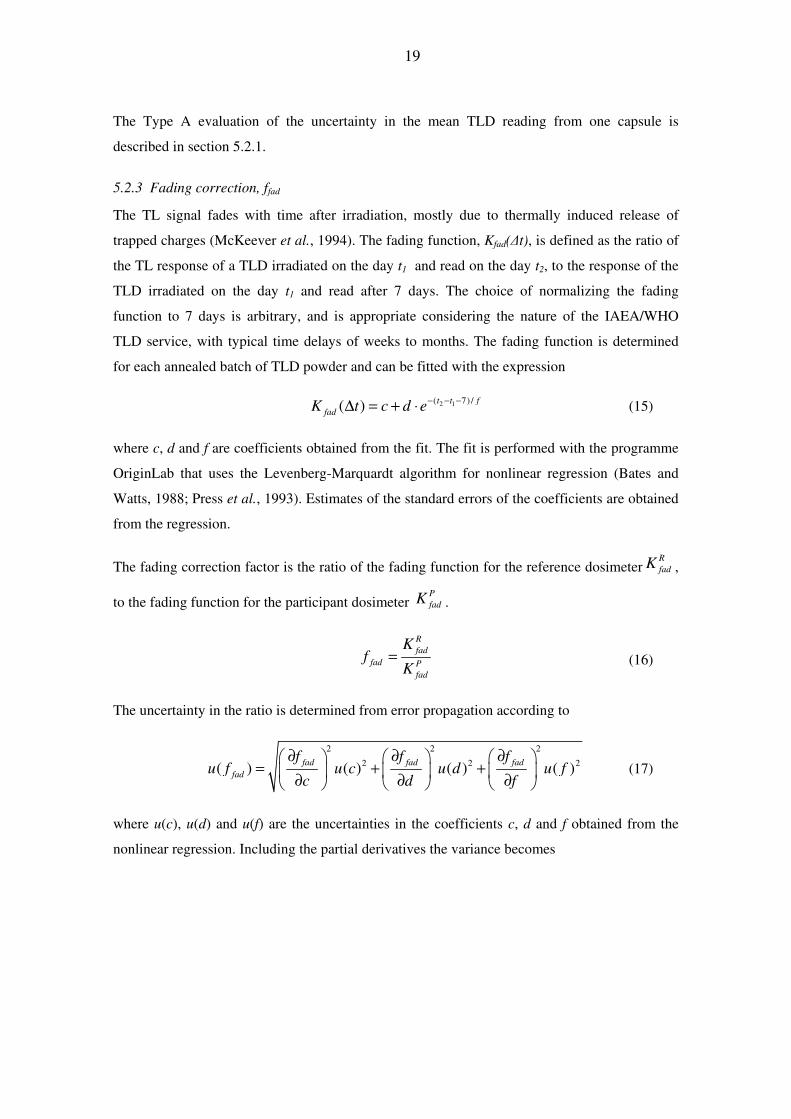
5.2.3 Fading correction, ffad
The TL signal fades with time after irradiation, mostly due to thermally induced release of
trapped charges (McKeever et al., 1994). The fading function, Kfad(�t), is defined as the ratio of
the TL response of a TLD irradiated on the day t1 and read on the day t2, to the response of the
TLD irradiated on the day t1 and read after 7 days. The choice of normalizing the fading
function to 7 days is arbitrary, and is appropriate considering the nature of the IAEA/WHO
TLD service, with typical time delays of weeks to months. The fading function is determined
for each annealed batch of TLD powder and can be fitted with the expression
2 1( 7) /( ) t t ffadK t c d e− − −∆ = + ⋅ (15)
where c, d and f are coefficients obtained from the fit. The fit is performed with the programme
OriginLab that uses the Levenberg-Marquardt algorithm for nonlinear regression (Bates and
Watts, 1988; Press et al., 1993). Estimates of the standard errors of the coefficients are obtained
from the regression.
The fading correction factor is the ratio of the fading function for the reference dosimeterRfadK ,
to the fading function for the participant dosimeter PfadK .
Rfad
fad Pfad
Kf
K= (16)
The uncertainty in the ratio is determined from error propagation according to
2 2 2
2 2 2( ) ( ) ( ) ( )fad fad fadfad
f f fu f u c u d u f
c d f
∂ ∂ ∂� � � � � �= + +� � � � � �∂ ∂ ∂� � � � � �
(17)
where u(c), u(d) and u(f) are the uncertainties in the coefficients c, d and f obtained from the
nonlinear regression. Including the partial derivatives the variance becomes
20
( ) ( )
( )( )
( ) ( )
( )( )
( ) ( ) ( ) ( ) ( ) [ ]( )
( )
2 27 / 7 / 7 / 7 /
2 222 2
27 / 7 / 14 /2
2
22
( )
7 7
P R R P
R P R P
t f t f t f t f
fad P Pfad fad
t f t f t t fR P R P
Pfad
d e e c e eu f u c u d
K K
cd t e t e d e t tu f
f K
− − − − − − − −
− − − − − + −
� � � �� � − − � �� � � �= +� � � �� � � �
� �� − − − + − �� �+� �� �
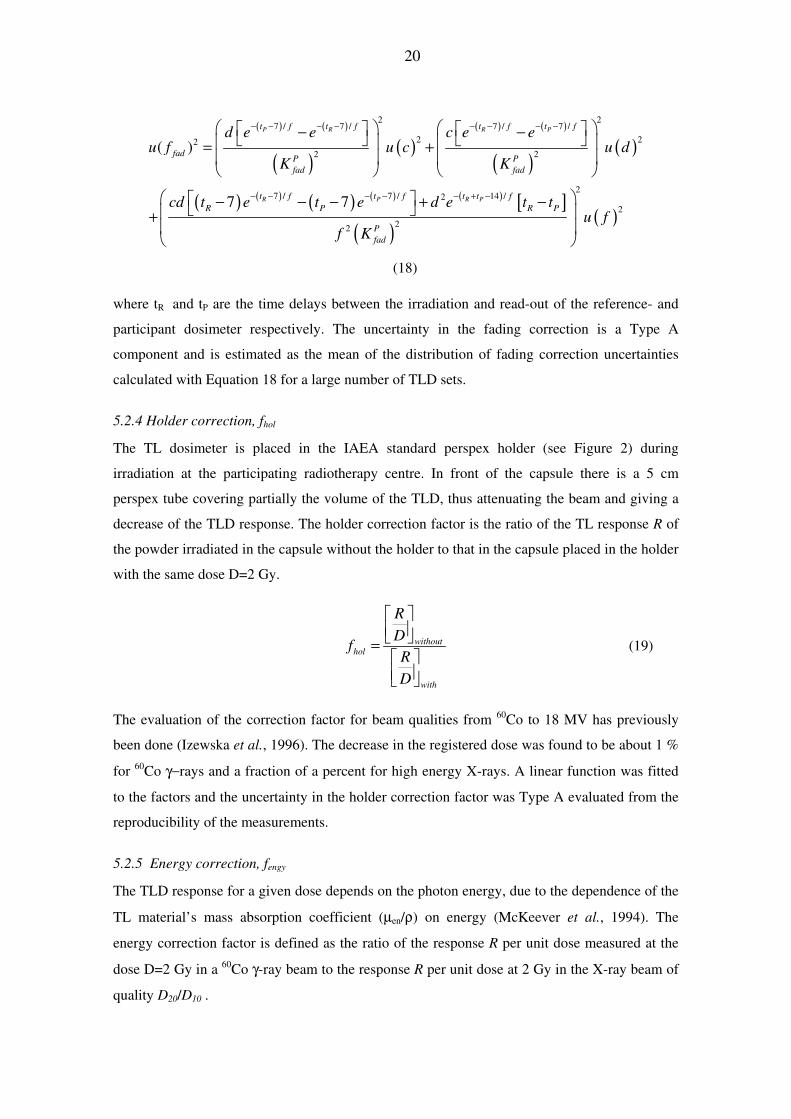
(18)
where tR and tP are the time delays between the irradiation and read-out of the reference- and
participant dosimeter respectively. The uncertainty in the fading correction is a Type A
component and is estimated as the mean of the distribution of fading correction uncertainties
calculated with Equation 18 for a large number of TLD sets.
5.2.4 Holder correction, fhol
The TL dosimeter is placed in the IAEA standard perspex holder (see Figure 2) during
irradiation at the participating radiotherapy centre. In front of the capsule there is a 5 cm
perspex tube covering partially the volume of the TLD, thus attenuating the beam and giving a
decrease of the TLD response. The holder correction factor is the ratio of the TL response R of
the powder irradiated in the capsule without the holder to that in the capsule placed in the holder
with the same dose D=2 Gy.
withouthol
with
RD
fRD
� � �=� � �
(19)
The evaluation of the correction factor for beam qualities from 60Co to 18 MV has previously
been done (Izewska et al., 1996). The decrease in the registered dose was found to be about 1 %
for 60Co γ−rays and a fraction of a percent for high energy X-rays. A linear function was fitted
to the factors and the uncertainty in the holder correction factor was Type A evaluated from the
reproducibility of the measurements.
5.2.5 Energy correction, fengy
The TLD response for a given dose depends on the photon energy, due to the dependence of the
TL material’s mass absorption coefficient (µen/ρ) on energy (McKeever et al., 1994). The
energy correction factor is defined as the ratio of the response R per unit dose measured at the
dose D=2 Gy in a 60Co γ-ray beam to the response R per unit dose at 2 Gy in the X-ray beam of
quality D20/D10 .
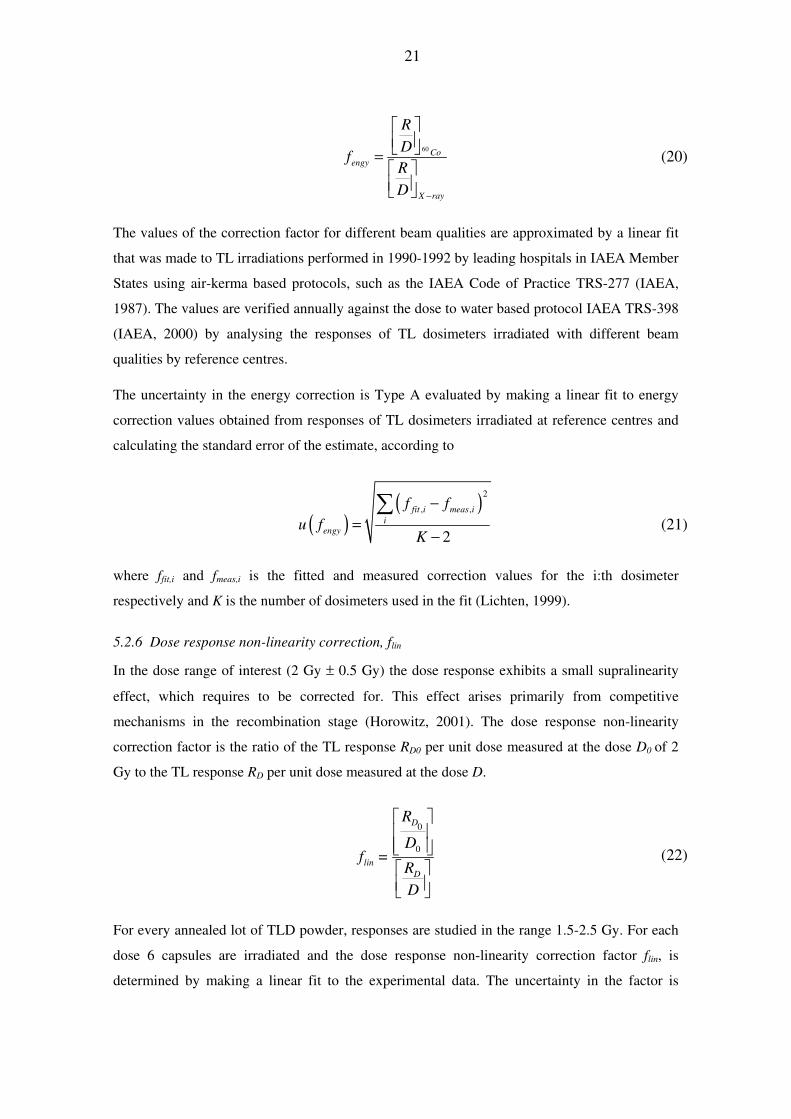
21
60 Co
engy
X ray
RD
fRD −
� � �=� � �
(20)
The values of the correction factor for different beam qualities are approximated by a linear fit
that was made to TL irradiations performed in 1990-1992 by leading hospitals in IAEA Member
States using air-kerma based protocols, such as the IAEA Code of Practice TRS-277 (IAEA,
1987). The values are verified annually against the dose to water based protocol IAEA TRS-398
(IAEA, 2000) by analysing the responses of TL dosimeters irradiated with different beam
qualities by reference centres.
The uncertainty in the energy correction is Type A evaluated by making a linear fit to energy
correction values obtained from responses of TL dosimeters irradiated at reference centres and
calculating the standard error of the estimate, according to
( )( )2
, ,
2
fit i meas ii
engy
f fu f
K
−=
−
� (21)
where ffit,i and fmeas,i is the fitted and measured correction values for the i:th dosimeter
respectively and K is the number of dosimeters used in the fit (Lichten, 1999).
5.2.6 Dose response non-linearity correction, flin
In the dose range of interest (2 Gy ± 0.5 Gy) the dose response exhibits a small supralinearity
effect, which requires to be corrected for. This effect arises primarily from competitive
mechanisms in the recombination stage (Horowitz, 2001). The dose response non-linearity
correction factor is the ratio of the TL response RD0 per unit dose measured at the dose D0 of 2
Gy to the TL response RD per unit dose measured at the dose D.
0
0
D
linD
R
Df =
RD
� � � �� � �
(22)
For every annealed lot of TLD powder, responses are studied in the range 1.5-2.5 Gy. For each
dose 6 capsules are irradiated and the dose response non-linearity correction factor flin, is
determined by making a linear fit to the experimental data. The uncertainty in the factor is
22
evaluated as Type A by calculating the standard error of the estimate in the same manner as for
the energy correction factor using Equation 21, as described in section 5.2.5.
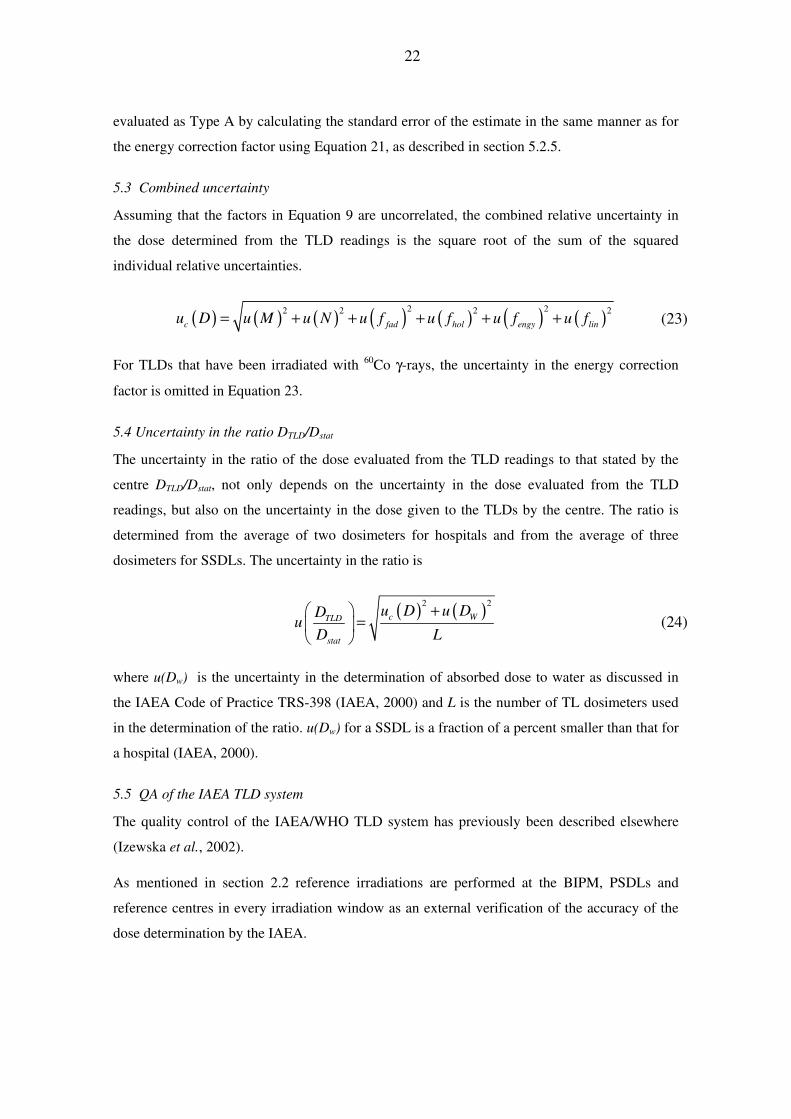
5.3 Combined uncertainty
Assuming that the factors in Equation 9 are uncorrelated, the combined relative uncertainty in
the dose determined from the TLD readings is the square root of the sum of the squared
individual relative uncertainties.
( ) ( ) ( ) ( ) ( ) ( ) ( )2 22 2 2 2c fad hol engy linu D u M u N u f u f u f u f= + + + + + (23)
For TLDs that have been irradiated with 60Co γ-rays, the uncertainty in the energy correction
factor is omitted in Equation 23.
5.4 Uncertainty in the ratio DTLD/Dstat
The uncertainty in the ratio of the dose evaluated from the TLD readings to that stated by the
centre DTLD/Dstat, not only depends on the uncertainty in the dose evaluated from the TLD
readings, but also on the uncertainty in the dose given to the TLDs by the centre. The ratio is
determined from the average of two dosimeters for hospitals and from the average of three
dosimeters for SSDLs. The uncertainty in the ratio is
( ) ( )2 2
c WTLD
stat
u D u DDu
D L
+� �=� �
� � (24)
where u(Dw) is the uncertainty in the determination of absorbed dose to water as discussed in
the IAEA Code of Practice TRS-398 (IAEA, 2000) and L is the number of TL dosimeters used
in the determination of the ratio. u(Dw) for a SSDL is a fraction of a percent smaller than that for
a hospital (IAEA, 2000).
5.5 QA of the IAEA TLD system
The quality control of the IAEA/WHO TLD system has previously been described elsewhere
(Izewska et al., 2002).
As mentioned in section 2.2 reference irradiations are performed at the BIPM, PSDLs and
reference centres in every irradiation window as an external verification of the accuracy of the
dose determination by the IAEA.
23
6 Results
The calculations of the uncertainties in the IAEA/WHO TLD postal dose audit programme were
performed as described in the previous section.
6.1 Results of uncertainty in TLD reading, calibration coefficient and correction factors
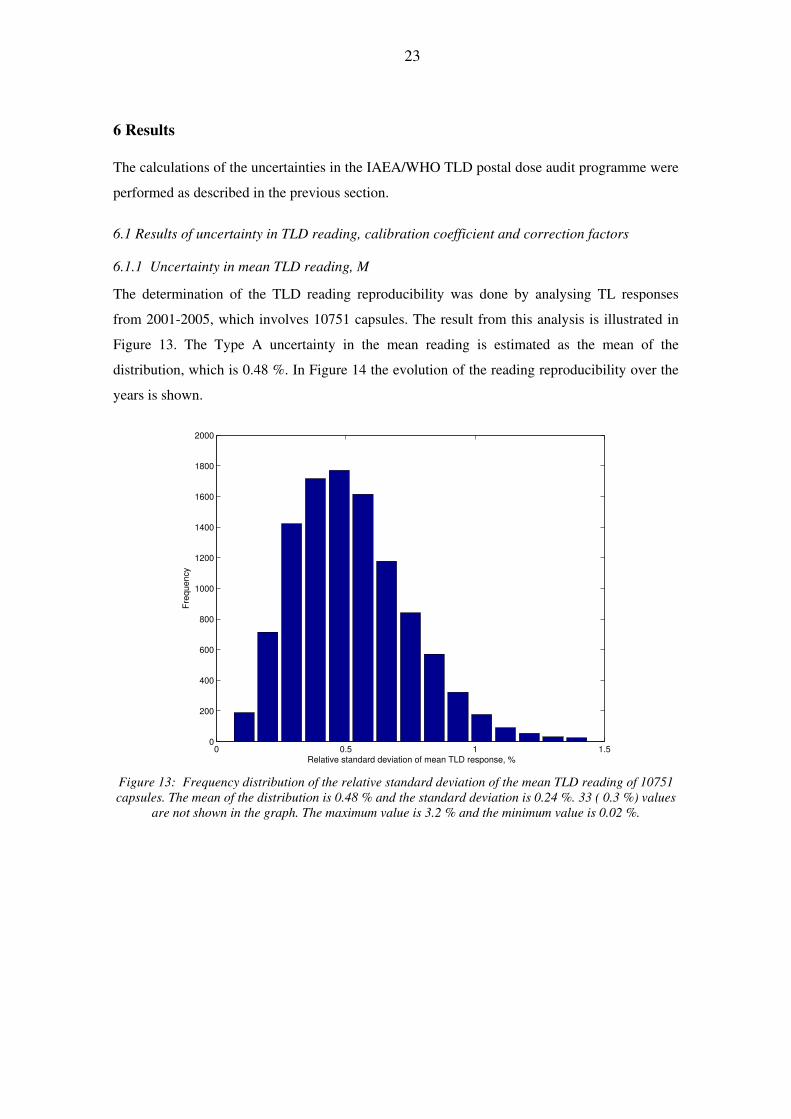
6.1.1 Uncertainty in mean TLD reading, M
The determination of the TLD reading reproducibility was done by analysing TL responses
from 2001-2005, which involves 10751 capsules. The result from this analysis is illustrated in
Figure 13. The Type A uncertainty in the mean reading is estimated as the mean of the
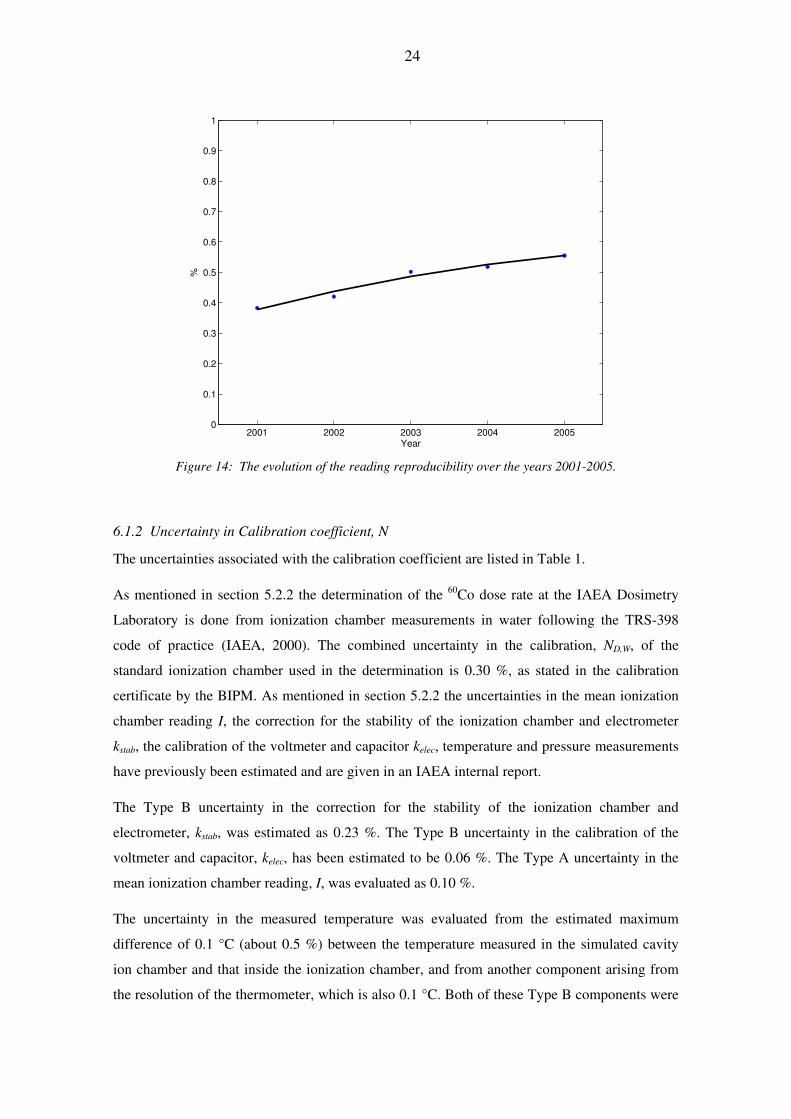
distribution, which is 0.48 %. In Figure 14 the evolution of the reading reproducibility over the
years is shown.
0 0.5 1 1.50
200
400
600
800
1000
1200
1400
1600
1800
2000
Relative standard deviation of mean TLD response, %
Freq
uenc
y
Figure 13: Frequency distribution of the relative standard deviation of the mean TLD reading of 10751 capsules. The mean of the distribution is 0.48 % and the standard deviation is 0.24 %. 33 ( 0.3 %) values
are not shown in the graph. The maximum value is 3.2 % and the minimum value is 0.02 %.
24
2001 2002 2003 2004 20050
0.1
0.2
0.3
0.4
0.5
0.6
0.7
0.8
0.9
1
Year
%
Figure 14: The evolution of the reading reproducibility over the years 2001-2005.
6.1.2 Uncertainty in Calibration coefficient, N
The uncertainties associated with the calibration coefficient are listed in Table 1.
As mentioned in section 5.2.2 the determination of the 60Co dose rate at the IAEA Dosimetry
Laboratory is done from ionization chamber measurements in water following the TRS-398
code of practice (IAEA, 2000). The combined uncertainty in the calibration, ND,W, of the
standard ionization chamber used in the determination is 0.30 %, as stated in the calibration
certificate by the BIPM. As mentioned in section 5.2.2 the uncertainties in the mean ionization
chamber reading I, the correction for the stability of the ionization chamber and electrometer
kstab, the calibration of the voltmeter and capacitor kelec, temperature and pressure measurements
have previously been estimated and are given in an IAEA internal report.
The Type B uncertainty in the correction for the stability of the ionization chamber and
electrometer, kstab, was estimated as 0.23 %. The Type B uncertainty in the calibration of the
voltmeter and capacitor, kelec, has been estimated to be 0.06 %. The Type A uncertainty in the
mean ionization chamber reading, I, was evaluated as 0.10 %.
The uncertainty in the measured temperature was evaluated from the estimated maximum
difference of 0.1 °C (about 0.5 %) between the temperature measured in the simulated cavity
ion chamber and that inside the ionization chamber, and from another component arising from
the resolution of the thermometer, which is also 0.1 °C. Both of these Type B components were
25
assumed to have rectangular distributions and sensitivity coefficients of 0.08, so the combined
uncertainty is 0.03 %.
Components contributing to the uncertainty in the pressure measurements are the uncertainty in
the calibration of the barometer, its resolution and the uncertainty in the mean readings. The
Type B uncertainty in the calibration was estimated from the maximum difference of 0.1 %
between the readings of the barometer and that of the reference barometer during calibration and
assuming a rectangular distribution. It is the dominating component with a value of 0.06 %. The
Type B component arising from the resolution of 0.005 kPa is negligible (0.003 %). The Type A
evaluation of the uncertainty in the mean readings gave a value of 0.03 %, so the combined
standard uncertainty in the pressure measurements is 0.07 %.
The Type A evaluation of the uncertainty in the virtual water to water correction factor gives a
value of 0.16 %.
Estimating the maximum deviation for the chamber from its position at 50 mm depth to be 0.1
mm, the standard deviation was obtained from the rectangular distribution and from the
normalized depth dose curve the sensitivity coefficient was estimated to be 0.52 % per mm. The
Type B evaluated uncertainty in the chamber positioning is thus 0.03 %.
The maximum error in the phantom positioning is estimated to be 0.1 mm and assuming a
rectangular distribution, this Type B component gives a very small contribution to the total
uncertainty (0.006 %).
As mentioned in section 5.2.2 the calibration coefficient is determined from reference capsules
that have been irradiated at the IAEA Dosimetry Laboratory under reference conditions to a
dose of 2 Gy to water. The main component in the uncertainty in the irradiation of the reference
capsules is the positioning of them in the virtual water phantom. This Type B component was
evaluated by assuming that the dose gradient per mm in the virtual water phantom is the same as
in the water phantom, estimating the maximum displacement of the TLDs in the phantom to be
0.1 mm and assuming a rectangular distribution. Thus, the estimated uncertainty in the
positioning of the TLDs is 0.03 %. The Type B uncertainty in the positioning of the phantom
was evaluated by estimating its maximum displacement to be 0.1 mm and assuming a
rectangular distribution. The contribution from this component to the combined uncertainty in
the calibration coefficient is very small (0.006 %). The uncertainty in the timer used when
irradiating the TLDs is evaluated as a Type B component and is assumed to arise from its
resolution, which is 0.01 s. In order to give the dosimeters a dose of 2 Gy, a few minutes are
required so the timer error is negligible.
26
The determination of the uncertainty in the reading of one TLD is described in section 6.1.1 and
is equal to 0.48 %.
The combined uncertainty in the calibration coefficient was calculated with Equation 12 in
section 5.2.2 for the cases when one, two and three reference capsules are used in the
determination of the coefficient, giving values of 0.65 %, 0.46 % and 0.37 % respectively. As
mentioned in Section 5.2.2, measurements of two or three reference capsules are done in a
reading session. As a conservative estimate of the uncertainty in the calibration coefficient, the
uncertainty calculated for two reference capsules is used. The estimate of the uncertainty in the
calibration coefficient is thus 0.46 %.
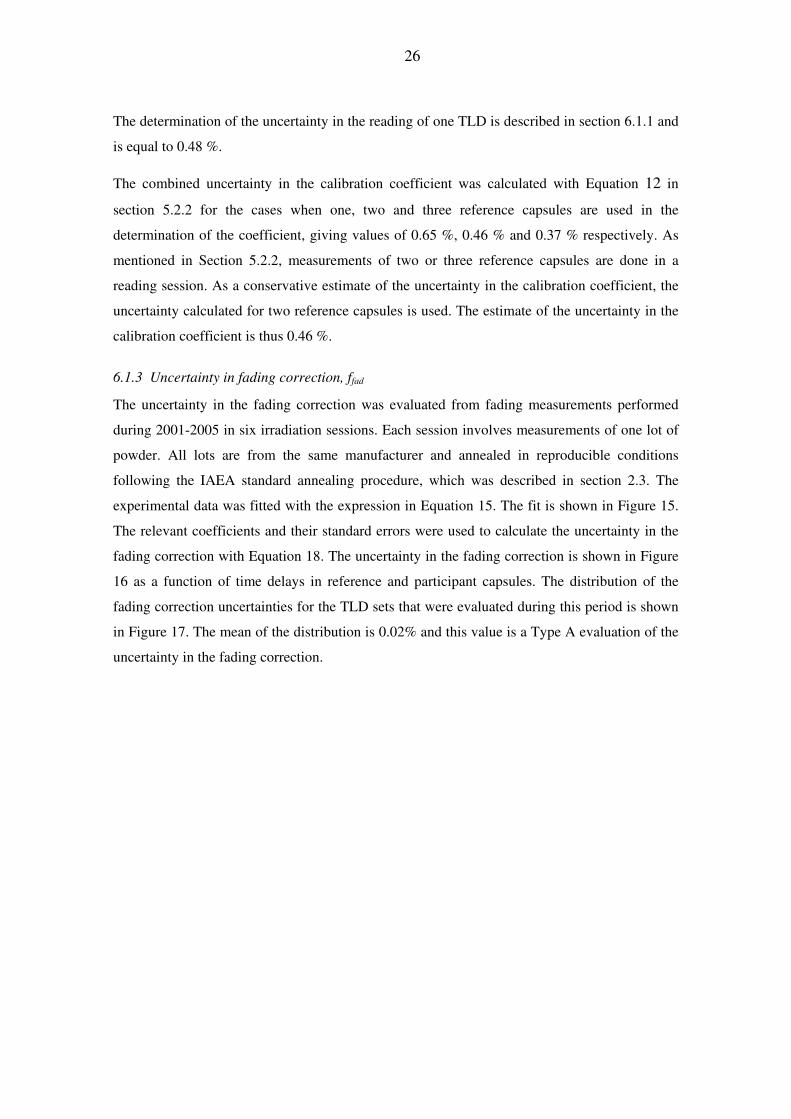
6.1.3 Uncertainty in fading correction, ffad
The uncertainty in the fading correction was evaluated from fading measurements performed
during 2001-2005 in six irradiation sessions. Each session involves measurements of one lot of
powder. All lots are from the same manufacturer and annealed in reproducible conditions
following the IAEA standard annealing procedure, which was described in section 2.3. The
experimental data was fitted with the expression in Equation 15. The fit is shown in Figure 15.
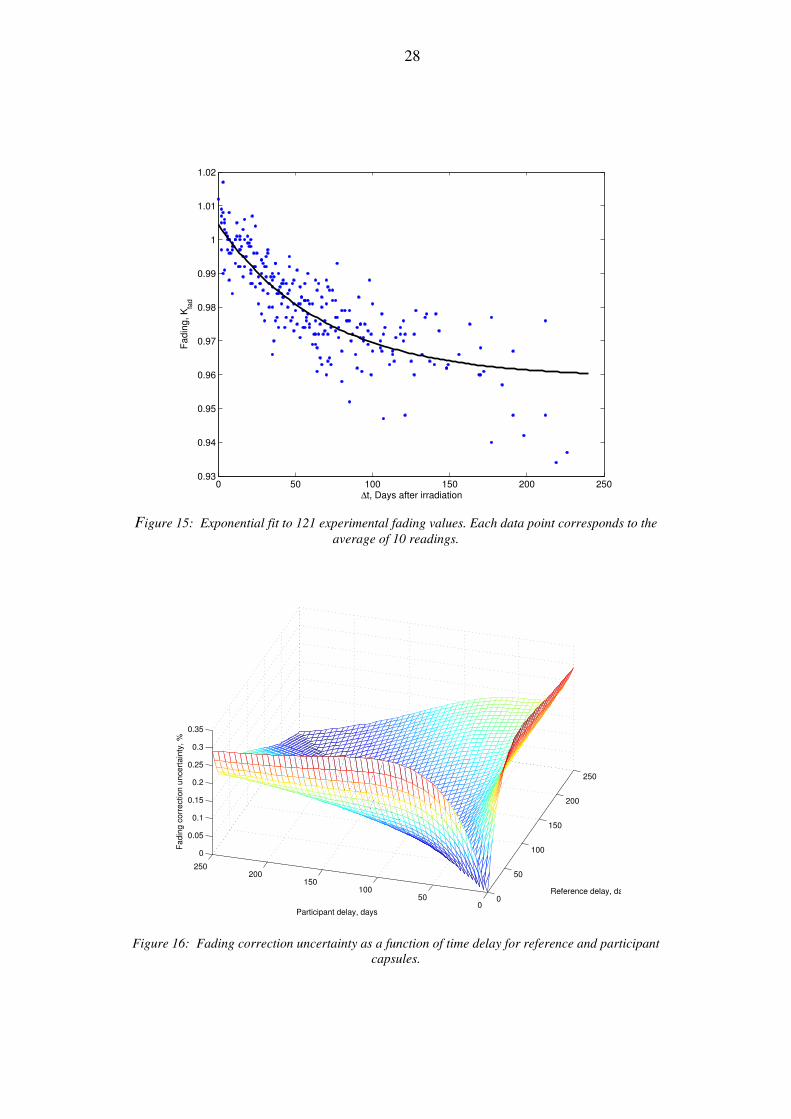
The relevant coefficients and their standard errors were used to calculate the uncertainty in the
fading correction with Equation 18. The uncertainty in the fading correction is shown in Figure
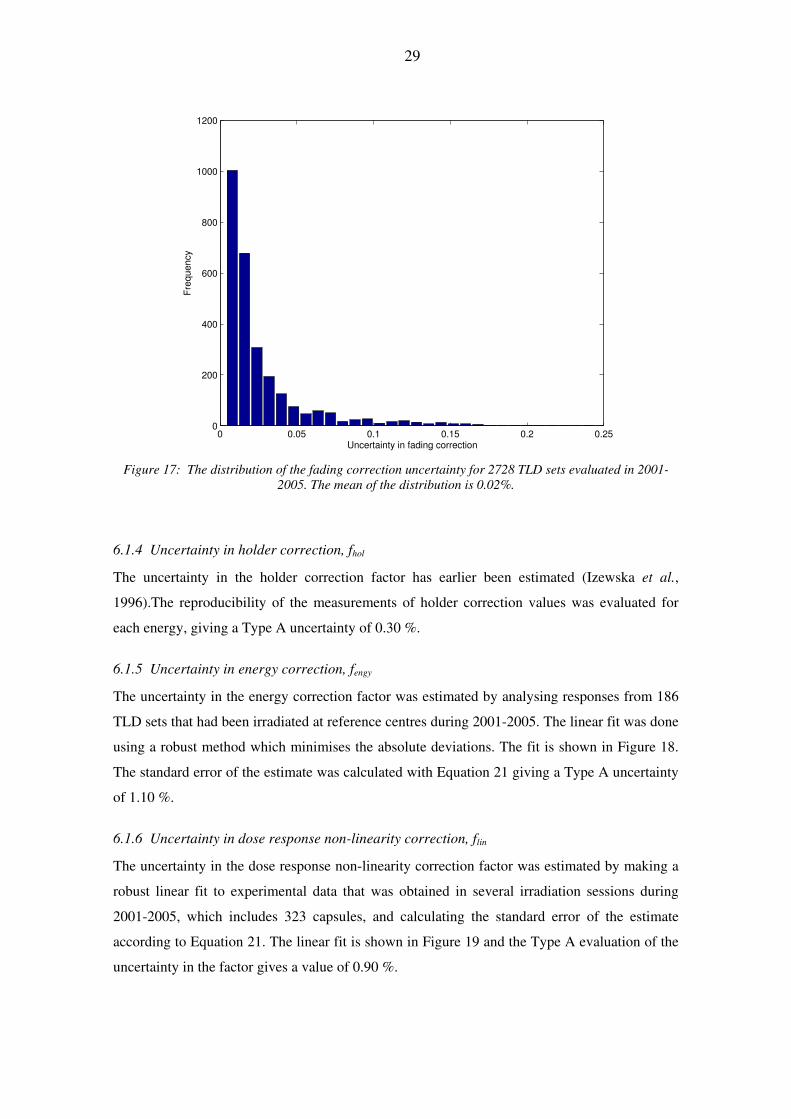
16 as a function of time delays in reference and participant capsules. The distribution of the
fading correction uncertainties for the TLD sets that were evaluated during this period is shown
in Figure 17. The mean of the distribution is 0.02% and this value is a Type A evaluation of the
uncertainty in the fading correction.

27
Table 1: One standard deviation values in % of components contributing to the uncertainty in the calibration coefficient. The first component is from the calibration certificate from BIPM, components 2-
6 are from an IAEA internal report and the last component was determined in section 6.1.1.
Relative Uncertainty, %
Factor Type A Type B Comb. A,B
Dose-rate 1 NDw 0.20 0.22 0.30
2 Mean reading 0.10 0.10
3 kstab 0.23 0.23
4 kelec 0.06 0.06
5 Temperature 0.03 0.03
6 Pressure 0.03 0.06 0.07
7 kVW 0.16 0.20
8 Chamber positioning 0.03 0.03
9 Phantom positioning 0.006 0.006
0.28 0.33 0.43
TLD irradiation 10 TLD positioning 0.03 0.03
11 Phantom positioning 0.006 0.006
0.03 0.03
TLD reading 12 Reading reproducibility 0.48 0.48
Combined One capsule 0.55 0.33 0.65
Two capsules 0.39 0.24 0.46
Three capsules 0.32 0.19 0.37
28
0 50 100 150 200 2500.93
0.94
0.95
0.96
0.97
0.98
0.99
1
1.01
1.02
∆t, Days after irradiation
Fadi
ng, K
fad
Figure 15: Exponential fit to 121 experimental fading values. Each data point corresponds to the
average of 10 readings.
0
50
100
150
200
250
050
100150
200250
0
0.05
0.1
0.15
0.2
0.25
0.3
0.35
Reference delay, days
Participant delay, days
Fadi
ng c
orre
ctio
n un
certa
inty
, %
Figure 16: Fading correction uncertainty as a function of time delay for reference and participant capsules.
29
0 0.05 0.1 0.15 0.2 0.25
0
200
400
600
800
1000
1200
Uncertainty in fading correction
Freq
uenc
y
Figure 17: The distribution of the fading correction uncertainty for 2728 TLD sets evaluated in 2001-2005. The mean of the distribution is 0.02%.
6.1.4 Uncertainty in holder correction, fhol
The uncertainty in the holder correction factor has earlier been estimated (Izewska et al.,
1996).The reproducibility of the measurements of holder correction values was evaluated for
each energy, giving a Type A uncertainty of 0.30 %.
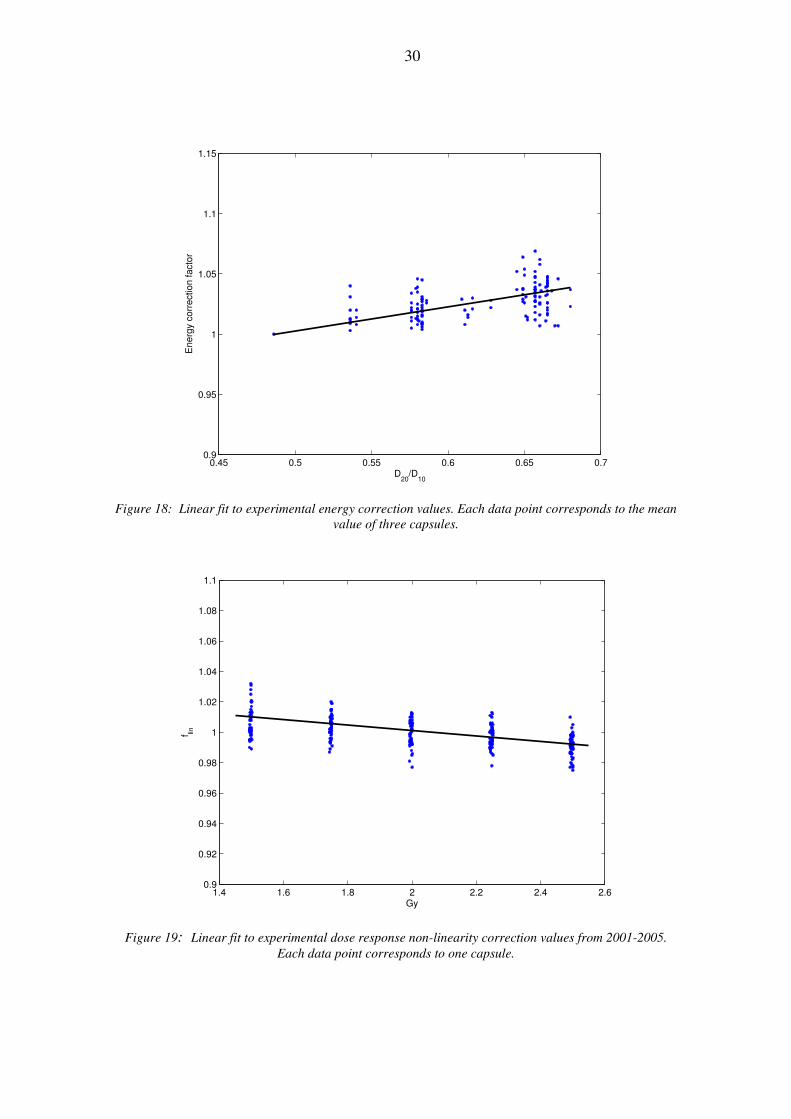
6.1.5 Uncertainty in energy correction, fengy
The uncertainty in the energy correction factor was estimated by analysing responses from 186
TLD sets that had been irradiated at reference centres during 2001-2005. The linear fit was done
using a robust method which minimises the absolute deviations. The fit is shown in Figure 18.
The standard error of the estimate was calculated with Equation 21 giving a Type A uncertainty
of 1.10 %.
6.1.6 Uncertainty in dose response non-linearity correction, flin
The uncertainty in the dose response non-linearity correction factor was estimated by making a
robust linear fit to experimental data that was obtained in several irradiation sessions during
2001-2005, which includes 323 capsules, and calculating the standard error of the estimate
according to Equation 21. The linear fit is shown in Figure 19 and the Type A evaluation of the
uncertainty in the factor gives a value of 0.90 %.
30
0.45 0.5 0.55 0.6 0.65 0.70.9
0.95
1
1.05
1.1
1.15
D20
/D10
Ene
rgy
corr
ectio
n fa
ctor
Figure 18: Linear fit to experimental energy correction values. Each data point corresponds to the mean value of three capsules.
1.4 1.6 1.8 2 2.2 2.4 2.60.9
0.92
0.94
0.96
0.98
1
1.02
1.04
1.06
1.08
1.1
Gy
f lin
Figure 19: Linear fit to experimental dose response non-linearity correction values from 2001-2005. Each data point corresponds to one capsule.
31
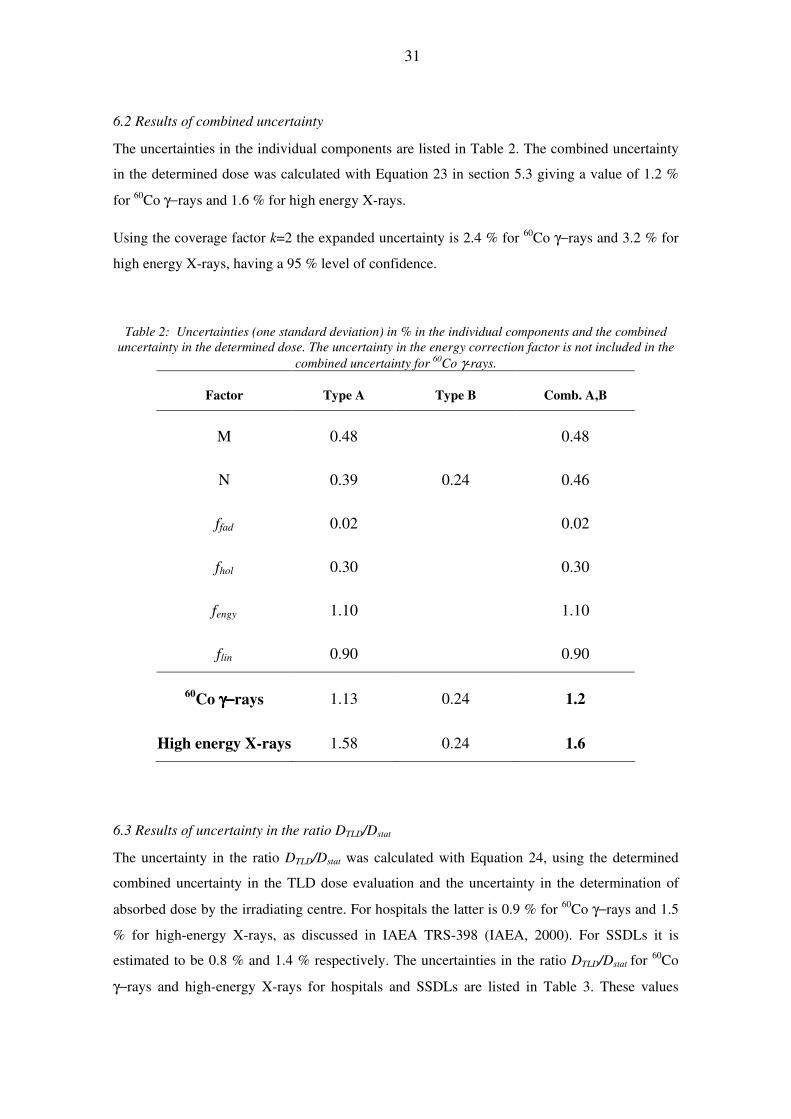
6.2 Results of combined uncertainty
The uncertainties in the individual components are listed in Table 2. The combined uncertainty
in the determined dose was calculated with Equation 23 in section 5.3 giving a value of 1.2 %
for 60Co γ−rays and 1.6 % for high energy X-rays.
Using the coverage factor k=2 the expanded uncertainty is 2.4 % for 60Co γ−rays and 3.2 % for
high energy X-rays, having a 95 % level of confidence.
Table 2: Uncertainties (one standard deviation) in % in the individual components and the combined uncertainty in the determined dose. The uncertainty in the energy correction factor is not included in the
combined uncertainty for 60Co γ-rays.
Factor Type A Type B Comb. A,B
M 0.48 0.48
N 0.39 0.24 0.46
ffad 0.02 0.02
fhol 0.30 0.30
fengy 1.10 1.10
flin 0.90 0.90
60Co γ−γ−γ−γ−rays 1.13 0.24 1.2
High energy X-rays 1.58 0.24 1.6
6.3 Results of uncertainty in the ratio DTLD/Dstat
The uncertainty in the ratio DTLD/Dstat was calculated with Equation 24, using the determined
combined uncertainty in the TLD dose evaluation and the uncertainty in the determination of
absorbed dose by the irradiating centre. For hospitals the latter is 0.9 % for 60Co γ−rays and 1.5
% for high-energy X-rays, as discussed in IAEA TRS-398 (IAEA, 2000). For SSDLs it is
estimated to be 0.8 % and 1.4 % respectively. The uncertainties in the ratio DTLD/Dstat for 60Co
γ−rays and high-energy X-rays for hospitals and SSDLs are listed in Table 3. These values
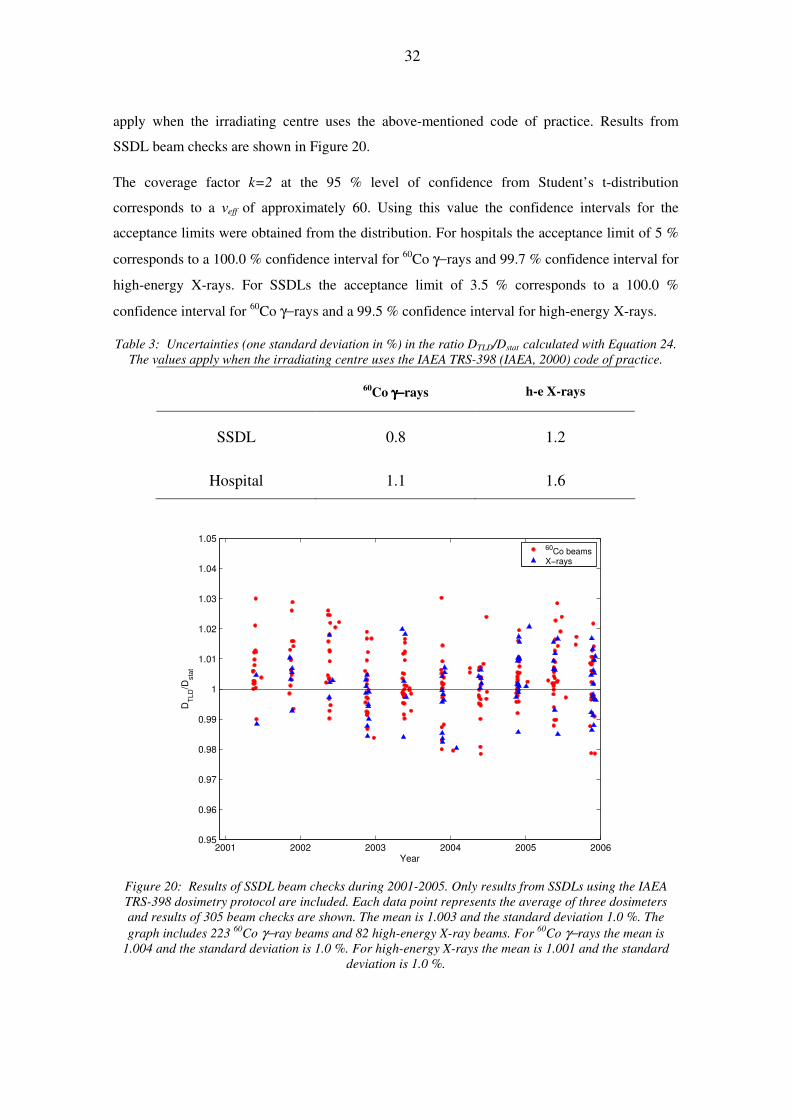
32
apply when the irradiating centre uses the above-mentioned code of practice. Results from
SSDL beam checks are shown in Figure 20.
The coverage factor k=2 at the 95 % level of confidence from Student’s t-distribution
corresponds to a �eff of approximately 60. Using this value the confidence intervals for the
acceptance limits were obtained from the distribution. For hospitals the acceptance limit of 5 %
corresponds to a 100.0 % confidence interval for 60Co γ−rays and 99.7 % confidence interval for
high-energy X-rays. For SSDLs the acceptance limit of 3.5 % corresponds to a 100.0 %
confidence interval for 60Co γ−rays and a 99.5 % confidence interval for high-energy X-rays.
Table 3: Uncertainties (one standard deviation in %) in the ratio DTLD/Dstat calculated with Equation 24. The values apply when the irradiating centre uses the IAEA TRS-398 (IAEA, 2000) code of practice.
60Co γ−γ−γ−γ−rays h-e X-rays
SSDL 0.8 1.2
Hospital 1.1 1.6
2001 2002 2003 2004 2005 20060.95
0.96
0.97
0.98
0.99
1
1.01
1.02
1.03
1.04
1.05
Year
DTL
D/D
stat
60Co beamsX−rays
Figure 20: Results of SSDL beam checks during 2001-2005. Only results from SSDLs using the IAEA TRS-398 dosimetry protocol are included. Each data point represents the average of three dosimeters and results of 305 beam checks are shown. The mean is 1.003 and the standard deviation 1.0 %. The graph includes 223 60Co γ−ray beams and 82 high-energy X-ray beams. For 60Co γ−rays the mean is
1.004 and the standard deviation is 1.0 %. For high-energy X-rays the mean is 1.001 and the standard deviation is 1.0 %.
33
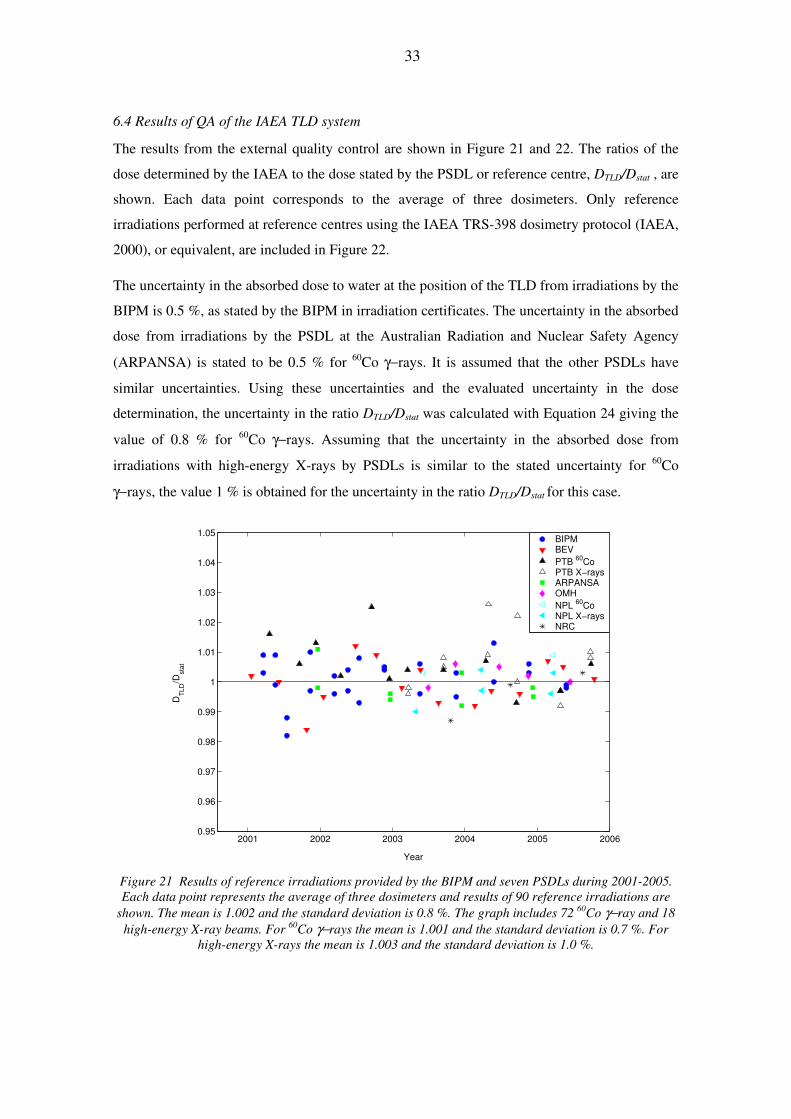
6.4 Results of QA of the IAEA TLD system
The results from the external quality control are shown in Figure 21 and 22. The ratios of the
dose determined by the IAEA to the dose stated by the PSDL or reference centre, DTLD/Dstat , are
shown. Each data point corresponds to the average of three dosimeters. Only reference
irradiations performed at reference centres using the IAEA TRS-398 dosimetry protocol (IAEA,
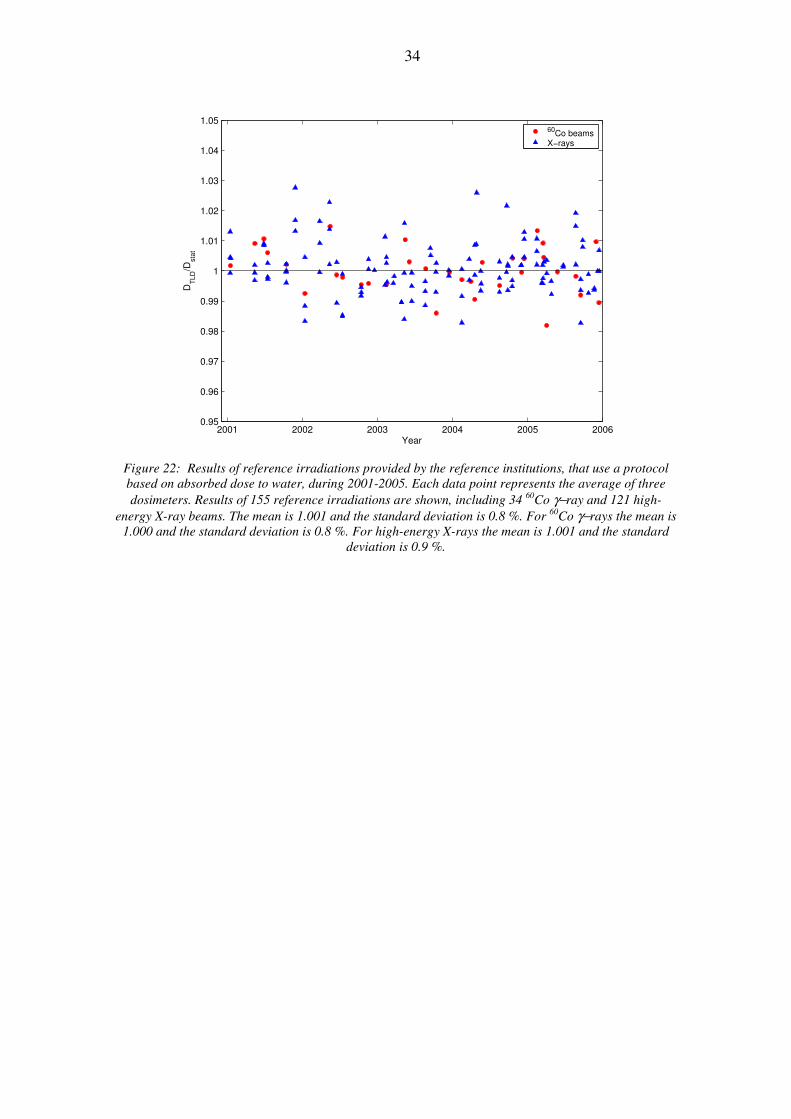
2000), or equivalent, are included in Figure 22.
The uncertainty in the absorbed dose to water at the position of the TLD from irradiations by the
BIPM is 0.5 %, as stated by the BIPM in irradiation certificates. The uncertainty in the absorbed
dose from irradiations by the PSDL at the Australian Radiation and Nuclear Safety Agency
(ARPANSA) is stated to be 0.5 % for 60Co γ−rays. It is assumed that the other PSDLs have
similar uncertainties. Using these uncertainties and the evaluated uncertainty in the dose
determination, the uncertainty in the ratio DTLD/Dstat was calculated with Equation 24 giving the
value of 0.8 % for 60Co γ−rays. Assuming that the uncertainty in the absorbed dose from
irradiations with high-energy X-rays by PSDLs is similar to the stated uncertainty for 60Co
γ−rays, the value 1 % is obtained for the uncertainty in the ratio DTLD/Dstat for this case.
2001 2002 2003 2004 2005 20060.95
0.96
0.97
0.98
0.99
1
1.01
1.02
1.03
1.04
1.05
Year
DTL
D/D
stat
BIPMBEVPTB 60CoPTB X−raysARPANSAOMHNPL 60CoNPL X−raysNRC
Figure 21 Results of reference irradiations provided by the BIPM and seven PSDLs during 2001-2005. Each data point represents the average of three dosimeters and results of 90 reference irradiations are
shown. The mean is 1.002 and the standard deviation is 0.8 %. The graph includes 72 60Co γ−ray and 18 high-energy X-ray beams. For 60Co γ−rays the mean is 1.001 and the standard deviation is 0.7 %. For
high-energy X-rays the mean is 1.003 and the standard deviation is 1.0 %.
34
2001 2002 2003 2004 2005 2006
0.95
0.96
0.97
0.98
0.99
1
1.01
1.02
1.03
1.04
1.05
Year
DTL
D/D
stat
60Co beamsX−rays
Figure 22: Results of reference irradiations provided by the reference institutions, that use a protocol based on absorbed dose to water, during 2001-2005. Each data point represents the average of three dosimeters. Results of 155 reference irradiations are shown, including 34 60Co γ−ray and 121 high-
energy X-ray beams. The mean is 1.001 and the standard deviation is 0.8 %. For 60Co γ−rays the mean is 1.000 and the standard deviation is 0.8 %. For high-energy X-rays the mean is 1.001 and the standard
deviation is 0.9 %.
35
7 Discussion
It is seen in Figure 13 that the distribution of standard deviations in the mean TLD reading from
one TLD is skewed toward higher values. Possible reasons for the askew distribution might be
damage of some cupels, that the powder isn’t heated properly from time to time and other
temporary failures in the reader and read-out process. In Figure 14 it is seen that the standard
deviation in the mean TLD reading from one capsule has insignificantly increased over the
years, probably due to the aging of the equipment. The automatic reader PCL 3 (Fimel, France)
has been in use in the IAEA since 1998 and it maintained excellent quality of operation
throughout the 8-year period.
The major components in the uncertainty in the calibration coefficient are the uncertainties in
the mean TLD reading and in the determination of the 60Co dose rate. It is seen from Equation
12 that the uncertainty in the calibration coefficient gets smaller as the number of reference
capsules increases. Usually two or three reference capsules are used in the determination of the
coefficient and the uncertainty calculated for two reference capsules is a conservative estimate
of the uncertainty in the calibration coefficient.
It is seen in Figure 16 that the uncertainty in the fading correction factor can be minimised by
irradiating the reference and user capsules as closely as possible in time. The importance of this
increase as the time delays decrease, since the slope of the fading function becomes greater, as
seen in Figure 15. It is seen in Figure 17 that for some TLD sets, that were evaluated during
2001-2005, the uncertainty in the fading correction factor has been considerably larger than the
estimated 0.02 %. The most common reason for this has been that some hospitals have
irradiated the TLDs much later than the requested irradiation window. However, an increase to
0.25 % in the fading correction uncertainty gives only a negligible change in the combined
uncertainty.
The largest contributors to the combined uncertainty in the dose determination are the
uncertainties in the energy correction factor (for high-energy X-rays) and in the dose response
non-linearity correction factor. Values of the energy correction factors obtained from the linear
fit in Figure 18 are the same as those used in the TLD dose evaluation and which were
determined from results of reference irradiations performed during 1990-1992 using air-kerma
based protocols, such as the IAEA TRS-277 (IAEA, 1987).
The estimated uncertainty in the dose evaluated from the TLD readings from one TLD of 1.2 %
for 60Co γ−rays and 1.6 % for high energy X-rays can be compared to the uncertainty of 2.3 %
36
estimated for the Radiological Physics Centre (RPC) mailed TLD system in Houston, Texas
(Kirby et al., 1992) and 1.6 % estimated for the ESTRO-EQUAL TLD process for 60Co γ-rays
(Ferreira et al., 2000) . The uncertainty reported for the energy correction factor in the RPC
TLD system is 1.1 % which is equal to the uncertainty in the same factor evaluated in the
present work. However, the largest contributor to the uncertainty in the RPC TLD system is the
uncertainty in the individual TLD readings, with a value of 1.5 %. The largest contributor to the
uncertainty in the ESTRO-EQUAL TLD process is reported to be the uncertainty in the
calibration coefficient, with a value of 1.5 %. This can be compared to 0.46 %, which is the
estimated uncertainty in the calibration coefficient in the present work.
The analysis shows that the dose calculated from the TLD readings is within 2.4 % (for 60Co γ-
rays) and 3.2 % (for high-energy X-rays) of the absorbed dose 95 % of the time. The uncertainty
in the ratio of the dose evaluated at the IAEA Dosimetry Laboratory to the dose stated by the
participant (DTLD/Dstat) depends on the code of practice used by the participating centre for the
determination of the absorbed dose. The lowest uncertainty is achieved when the participating
centre uses a dosimetry protocol that is based on absorbed dose to water, for instance the IAEA
TRS-398 (IAEA, 2000). When such a protocol is used, the acceptance limit of 5 % in the ratio
for hospitals corresponds to a 100.0 % confidence interval for 60Co γ-rays and a 99.7 %
confidence interval for high energy X-rays. For SSDLs the acceptance limit is 3.5 % which
corresponds to a confidence interval of 100.0 % for 60Co γ-rays and 99.5 % for high-energy X-
rays. The probability of getting a random result outside the acceptance limit is thus negligible in
this case.
The uncertainty in the ratio has been calculated for SSDLs and hospitals, that use an absorbed
dose to water based protocol (see section 6.2), and for the BIPM and PSDLs (see section 6.4).
The calculated uncertainties can be compared to the results in Figures 20-22.
The results from the SSDL beam checks in Figure 20 have standard deviations of 1.0 % for both 60Co γ-rays and high energy X-rays. This compares favourably to the calculated uncertainty of
1.2 % in the ratio for high energy X-rays but is slightly higher than 0.8 %, which is the
calculated uncertainty in the ratio for 60Co γ-rays. However, comparing the calculated
uncertainties with the results from reference irradiations indicates that the analysis may be
conservative. The standard deviations in the results from reference irradiations at the BIPM and
PSDLs, as seen in Figure 21, are 0.7 % for 60Co γ−rays and 1.0 % for high-energy X-rays. These
values can be compared to the calculated uncertainties 0.8 % and 1 % respectively. The results
shown in Figure 22 from reference irradiations at reference centres, that use the IAEA TRS-398
or equivalent, also have standard deviations close to 1 %. Since the reference centres are leading
37
hospitals in IAEA Member States with a precision comparable to that of SSDLs, these values
can be compared to the calculated uncertainties in the ratio for SSDLs (0.8 % for 60Co γ-rays
and 1.2 % for high-energy X-rays respectively).
38
8 Conclusions
An analysis of the uncertainties in the dose evaluation process in the IAEA/WHO TLD postal
dose audit programme has been performed. The analysis comprises uncertainties in the reading
of the dosimeters, uncertainties in the calibration coefficient, and uncertainties in correction
factors for fading, holder, energy dependence and dose response non-linearity.
It has been shown that the uncertainty in the calibration coefficient decreases as the number of
reference capsules used in the determination of the calibration coefficient increases. The largest
contributors to the uncertainty have been found to be the energy correction factor (for high
energy X-rays) and the dose response non-linearity correction factor, with uncertainties of 1.1 %
and 0.9 % respectively. In order to minimise the uncertainty in the fading correction factor, it
has been shown that it is of importance that the time gap between the irradiation of the reference
and user capsules is minimised, especially at small time delays. However, the contribution to the
combined uncertainty in the determined dose is low, even for larger time gaps.
The estimated uncertainty in the dose evaluated from the TLD readings from one TLD of 1.2 %
for 60Co γ−rays and 1.6 % for high energy X-rays can be compared to the uncertainty of 2.3 %
estimated for the Radiological Physics Center (RPC) mailed TLD system in Houston, Texas
(Kirby et al., 1992) and 1.6 % estimated for the ESTRO-EQUAL TLD process for 60Co γ-rays
(Ferreira et al., 2000).
When the participating centres use an absorbed dose to water based dosimetry protocol, it has
been shown that the probability of getting a random result outside the acceptance limit is
negligible.
Results from the external quality control indicate that the analysis may be conservative.
39
References
Arib M, Yaich A, Messadi A and Dari F 2006 Optimum parameters of TLD100 powder used for radiotherapy beams calibration check Medical Dosimetry 31 184-9
Bates D M and Watts D G 1988 Nonlinear regression analysis and its applications: John Wiley & Sons Inc)
Ferreira I H, Dutreix A, Bridier A, Chavaudra J and Svensson H 2000 The ESTRO-QUALity assurance network (EQUAL) Radiotherapy and Oncology 55 273-84
Horowitz Y S 2001 Theory of thermoluminescence gamma dose response: The unified interaction model Nuclear Instruments and Methods in Physics Research B 184 68-84
IAEA 1987 Absorbed dose determination in photon and electron beams. An international code of practice. In: Technical Report Series No 277, (Vienna: IAEA)
IAEA 2000 Absorbed dose determination in external beam radiotherapy. An international code of practice for dosimetry based on standards of absorbed dose to water. In: Tehcnical Report Series No 398, (Vienna: IAEA)
ISO/IEC/OIML/BIPM 1992 Guide to the Expression of Uncertainty in Measurement Izewska J and Andreo P 2000 The IAEA/WHO TLD postal programme for
radiotherapy hospitals Radiotherapy and Oncology 54 65-72 Izewska J, Andreo P, Vatnitsky S and Shortt K R 2003 The IAEA/WHO TLD postal
dose quality audits for radiotherapy: a perspective of dosimetry practices at hospitals in developing countries Radiotherapy and Oncology 69 91-7
Izewska J, Bera P and Vatnitsky S 2002 IAEA/WHO TLD postal dose audit service and high precision measurements for radiotherapy level dosimetry Radiation Protection Dosimetry 101 387-92
Izewska J, Novotny J, Dam J V, Dutreix A and Schueren E v d 1996 The influence of the IAEA standard holder on dose evaluated from TLD samples Physics in Medicine and Biology 41 465-73
Izewska J, Vatnitsky S and Shortt K R 2004 IAEA/WHO postal dose audits for radiotherapy hospitals in Eastern and South-Eastern Europe Cancer Radiothérapie 8 S36-S43
Izewska J, Vatnitsky S and Shortt K R 2006 Postal dose audits for radiotherapy centres in Latin America and the Caribbean: Trends in 1969-2003 Panamerican Journal of Public Health 20 161-72
Kirby T H, Hanson W F and Johnston D A 1992 Uncertainty analysis of absorbed dose calculation from thermoluminescence dosimeters Medical Physics 19 1427-33
Kroutilíková D, Novotný J and Judas L 2002 Thermoluminescent dosimeters (TLD) quality assurance network in the Czech Republic Radiotherapy and Oncology 66 235-44
Lichten W 1999 Data and error analysis (Upper Saddle River, New Jersey: Prentice-Hall, Inc.)
Massillon-JL G, Gamboa-deBuen I and Brandan M E 2006 Onset of supralinear response in TLD-100 exposed to 60Co gamma-rays J. Phys. D: Appl. Phys. 39 262-8
McKeever S W S and Chen R 1997 Luminescence models Radiation Measurements 27 625-61
40
McKeever S W S, Moscovitch M and Townsend P D 1994 Thermoluminescence dosimetry materials: Properties and use: Nuclear Technology Publishing)
Press W H, Flannery B P, Teukolsky S A and Vetterling W T 1993 Numerical recipes in Fortran: Cambridge University Press)
Schulman J H, Attix F H and West E J 1960 New thermoluminescent dosimeter Rev. Sci. Instrum. 31 1263-9
Svensson H, Zdansky K and Nette P 1993 Dissemination, transfer and intercomparison in radiotherapy dosimetry: The IAEA concept. In: Measurement Assurance in radiotherapy dosimetry. Proceedings of IAEA International Symposium. , (Vienna: IAEA)