tmc rp-1102 (sae j1321) type ii fuel consumption …pavetrack.com/pave/closed crankcase retrofit...
TRANSCRIPT

1
PAVE Research Institute
1600 Lee Road 151 Opelika, AL 36804
www.pavetrack.com 334-844-6857
at Auburn University
Report on
TMC RP-1102 (SAE J1321) Type II Fuel Consumption Test with
TMC RP-1115
Fuel Economy Benefit Product Qualification
Conducted for
World NCI 1701 County Road – Suite #S
Minden, NV 89423
March 5, 2007
Prepared by:
_____________________ R. Buzz Powell, PhD, PE
Research Engineer
This report shall not be reproduced, except in full, without the written approval of the PAVE Research Institute.

2
TABLE OF CONTENTS INTRODUCTION ................................................................................................ 3 PRODUCT INFORMATION ............................................................................... 3
Technological Overview ........................................................................... 3 RP 1115 Qualification ............................................................................... 5
TEST PROCEDURE ............................................................................................ 6
Vehicle Identification ................................................................................ 6 Test Route ................................................................................................. 7 RP 1102 Methodology .............................................................................. 8 Type II Test Data .................................................................................... 11 Type II Calculations ................................................................................ 12 Daily Fleet Records................................................................................. 13 Maintenance Observations ...................................................................... 14
DISCUSSION OF RESULTS ............................................................................. 14 APPENDICES .................................................................................................... 16
Appendix A - Fleet References................................................................ 16 Appendix B – Tractor Specifications....................................................... 17
3
INTRODUCTION Recent historical increases in the cost of diesel fuel have resulted in an
unprecedented interest in products that have the potential to improve fuel economy. At the request of World NCI, the PAVE Research Institute at Auburn University recently conducted a fuel economy test utilizing class 8 diesel trucks. The purpose of the testing was to quantify any benefits derived from the installation and utilization of a hardware retrofit known commercially as the Fuel and Air Saver™.
The procedure chosen for this evaluation was the TMC/SAE In-Service Fuel Consumption Test Procedure – Type II, also known as TMC’s RP 1102 and SAE’s J1321. This procedure was developed specifically to meet the needs of the trucking industry, and it is an integral part of TMC’s Guidelines for Qualifying Products Claiming a Fuel Economy Benefit (RP 1115). Both recommended practices are included in the scope of this study.
To facilitate the experiment, fuel consumption in a treatment vehicle was compared to fuel consumption in an identical control vehicle before and after the installation of the retrofit hardware. Because the vendor claimed that several thousand miles were needed to realize the full potential of the device, post-treatment testing was conducted with very low miles and again after approximately 24,000 miles had been run. This process resulted in three separate test segments: untreated baseline testing, early stage treatment testing, and advanced stage treatment testing. The completion of each stage of post-treatment testing allowed for the determination of percent savings in fuel consumed. PRODUCT INFORMATION Technological Overview
According to the World NCI website (www.worldnci.com), The Fuel and Air Saver™ (shown schematically in Figure 1 and installed on a PAVE test vehicle in Figure 2) is a retrofit system for pre-2007 engines that is installed between the open venting crankcase tube and the intake to the combustion chamber. As crankcase gases enter the Fuel and Air Saver™, a patented process separates harmful non-combustible vapors such as contaminated oil, water, and soot from unburned fuel vapors. The non-combustible vapors condense into a liquid and settle to the bottom of twin collection containers, but the lighter unburned fuel vapor (reported to make up approximately 10 percent of the total crankcase vapor volume) is routed into the intake of the combustion chamber. The liquid that settles in the container is disposed of with the crankcase oil during routine oil changes. The vendor asserts that returning the unburned fuel vapors to the air intake produces numerous performance benefits, including reduced emissions and increased fuel economy.

4
Figure 1 – Schematic Illustration of Technology from www.worldnci.com
Figure 2 - The Fuel and Air Saver™ Installed on a PAVE Test Vehicle

5
RP 1115 Qualification The purpose of RP 1115 is to provide equipment user s with guidelines on how to
qualify products that claim to improve fuel economy. TMC recommends that manufacturers of such products conduct a Type II, III or IV fuel economy test to verify product claims. It is also recommended that such products must be readily available on the market with firm equipment user validation before any fuel economy improvement claims are made.
The following verbiage is provided on the World NCI website:
“The technological principles of the Fuel and Air Saver™ were developed and patented by a pioneering inventor and to the inventor’s credit there are thousands of field results validating how well the technology performed in improving fuel economy and reducing emissions. However, while the science and technological design and its results were solid, the manufacturing design and process possessed physical defects which resulted in the product routinely experiencing physical failure. In 2003, World NCI acquired all rights, title, interest, and assets of the original inventor's company. World NCI's goal was to utilize our redeveloping technology and proven scientific principles, in conjunction with a solid manufacturing design and production procedures, to reduce consumers' fuel costs and improve air quality. World NCI successfully accomplished its goals of innovatively re-developing and improving the technology into a durable product that will withstand the test of time with a lifetime guarantee offered by World NCI.
In 2005, World NCI was issued United States and world patents for its scientific re-development as well as technological and manufacturing innovations to the existing technology. As a result the Fuel and Air Saver™ System was released for manufacturing. Du ring 2005 and 2006 World NCI invested substantial time and financial resources in having the newly patented Fuel and Air Saver™ System tested and validated by independent EPA and SAE laboratory testing. Concurrently, the company worked with various private and public companies as well as individual consumers to have product testing and evaluation completed. World NCI has received consistent testing results from companies and consumers validating the effectiveness of the Fuel and Air Saver™ with respect to increasing fuel economy and decreasing emissions. Additionally, in the third quarter of 2006, the company received the final evaluation report from the independent SAE laboratory, West Virginia University Center for Alternative Fuels Engines and Emissions, which validated the effectiveness of the Fuel and Air Saver™ with respect to fuel savings, decreasing emissions and producing the only known 100% closed crankcase system.
World NCI is currently launching its International marketing and sales program with the goal of assisting transportation fleets, municipalities, and consumers reduce their fuel costs while improving our environmental air quality.”

6
The manufacturer indicated to PAVE that the product is currently available for
purchase via the following contact information:
World NCI Peter Clark [email protected] 775-782-5252
The initial cost of all necessary components is reported to be between $560 and
$795 (depending on quantity), so on long haul vehicles the cost per mile would be relatively low and the return on investment would be relatively short (much less than one year making reasonable assumptions about annual miles, mpg and fuel cost). World NCI has indicated it offers a 100 percent money back guarantee for any installation that does not provide the anticipated results (with proper documentation of a prescribed testing plan). The product is reported to be currently in use by several fleets, whose names were provided to PAVE in the form of a reference letter shown as Appendix A.
The vendor indicates it guarantees the material and workmanship in the Fuel and Air Saver™ for the life of the vehicle, which they consider to be 15 years. This is limited to the original owner of the vehicle/hardware, with the hoses and clamps only warranted for one year. The product is not intended to require any special maintenance, other than disposing of condensed non-combustible vapors each time the oil is changed. In the case of PAVE’s operations, these materials were disposed of weekly by combustion in the onsite garage’s waste oil heater. The product should be considered by regulatory authorities as environmentally friendly because it reduces the overall emissions of the vehicle.
World NCI asserts on their web page that engine manufacturers recognize the need for and are working towards closed crank case systems. They claim that use of the Fuel and Air Saver™ will not void a manufacturer’s warranty because it would have to be proven that the device had caused a direct malfunction. They further cla im that EPA tests have shown the system does not cause any engine malfunctions. Although maintenance issues are beyond the scope of the Type II test, engine condition was closely monitored as miles accumulated on the PAVE test vehicle. TEST PROCEDURE Test Vehicles
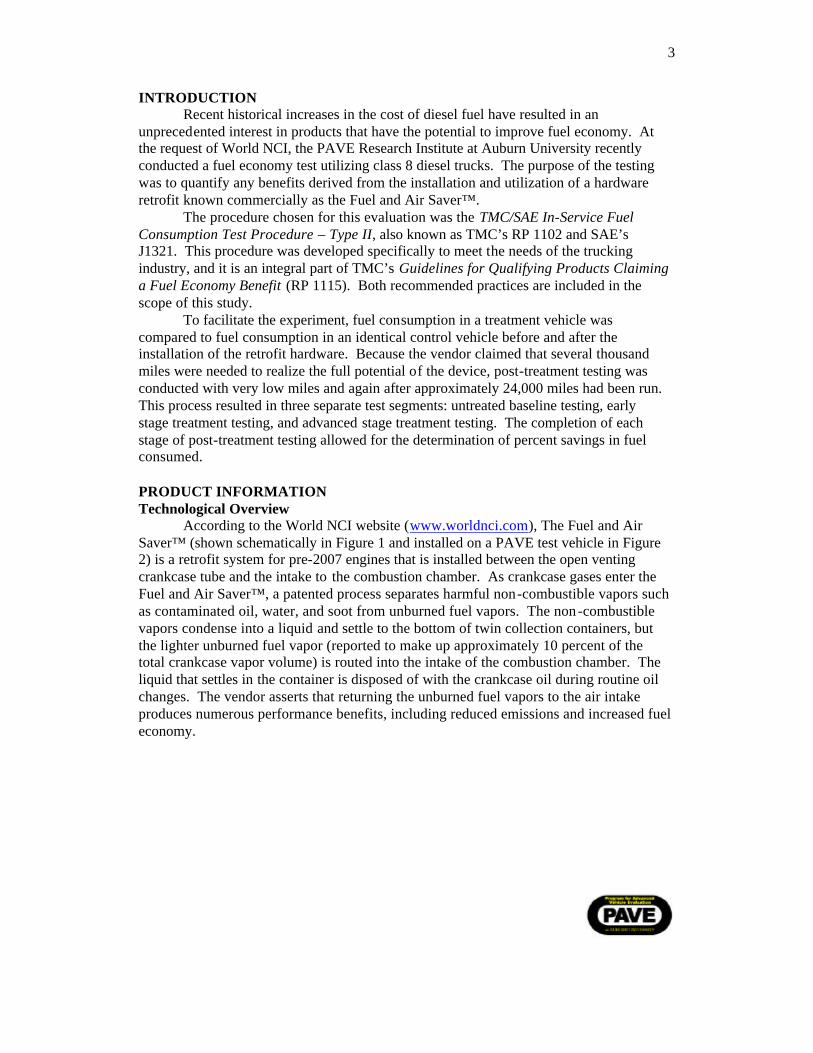
The control and treatment tractors used in the experiment were sequential serial number 2004 Freightliner Columbia series Model C120 day cabs with no aerodynamic modifications. Both units were equipped with Detroit Diesel 60 Series DDEC -IV (EGR) engines rated at 435 hp at 2,100 rpm, with odometer readings of approximately 365,000 miles. Both tractors were equipped with Eaton Fuller 9 speed manual transmissions and cruise control, which produced approximately 1450 rpm at cruise speeds. No air conditioning or other accessories that would have pulled inconsistent auxiliary power were used during Type II testing. Mirrors and windows were maintained in the same position for all stages of operation. Each tractor pulled flatbed triple trailer trains (shown during testing in Figure 3) with every axle loaded up to the legal limit. This produced
7
identical gross vehicle weights of approximately 160,000 pounds. The control truck was identified as unit #3, while the treatment truck was identified as unit #4.
Figure 3 – Control and Treatment Trucks During the Testing Process Test Route
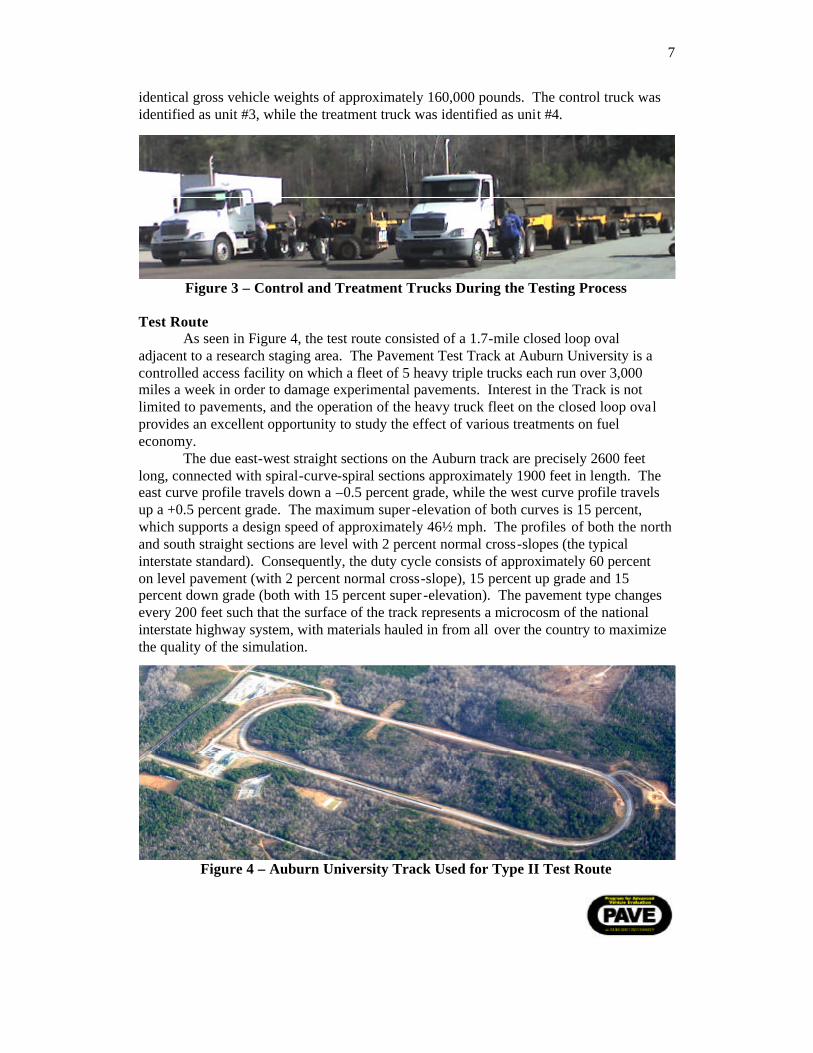
As seen in Figure 4, the test route consisted of a 1.7-mile closed loop oval adjacent to a research staging area. The Pavement Test Track at Auburn University is a controlled access facility on which a fleet of 5 heavy triple trucks each run over 3,000 miles a week in order to damage experimental pavements. Interest in the Track is not limited to pavements, and the operation of the heavy truck fleet on the closed loop oval provides an excellent opportunity to study the effect of various treatments on fuel economy.
The due east-west straight sections on the Auburn track are precisely 2600 feet long, connected with spiral-curve-spiral sections approximately 1900 feet in length. The east curve profile travels down a –0.5 percent grade, while the west curve profile travels up a +0.5 percent grade. The maximum super -elevation of both curves is 15 percent, which supports a design speed of approximately 46½ mph. The profiles of both the north and south straight sections are level with 2 percent normal cross-slopes (the typical interstate standard). Consequently, the duty cycle consists of approximately 60 percent on level pavement (with 2 percent normal cross-slope), 15 percent up grade and 15 percent down grade (both with 15 percent super -elevation). The pavement type changes every 200 feet such that the surface of the track represents a microcosm of the national interstate highway system, with materials hauled in from all over the country to maximize the quality of the simulation.
Figure 4 – Auburn University Track Used for Type II Test Route

8
Each Type II test run consisted of at least 28 miles of continuous operation on the
closed oval in this manner, with vehicles spaced out in order to prevent aerodynamic interaction. Vehicle spacing (1500 ft) during testing is shown in Figure 5. The travel speed of the test vehicles was maintained between 45 and 50 mph using cruise control, running in 8th gear to produce rpm levels comparable to interstate speeds.
Figure 5 – Proper Spacing During Testing To Avoid Aerodynamic Interaction RP 1102 Methodology A work plan was developed based upon the TMC/SAE Recommended Practice 1102 (In-Service Fuel Consumption Test Procedure – Type II). In this procedure, fuel consumption measurements in a test vehicle (T) are compared to measurements from a control vehicle (C) before and after treatment. The difference between the before and after T/C ratios are used to calculate a fuel savings percentage presumably resulting from the treatment. For the purpose of this study, a test run was defined as at least 28 miles of continuous driving on the Pavement Test Track. Vehicle operation was synchronized using handheld radios to ensure precisely identical duty cycles. Both trucks were outfitted with removable fuel tanks (shown in Figure 6) that were weighed between each test run in order to determine the amount of fuel consumed. The weighing process is shown in Figure 7, with fuel temperature documentation shown in Figure 8. The T/C ratios for all test runs were calculated, and the first 3 ratios that fell within TMC’s prescribed 2 percent filtering band were used to compute an average value representing each segment of testing.

9
Figure 6 – Removing Portable Tank for Fuel Weight Determination

10
Figure 7 – Weighing Portable Tank to Within a Tenth of a Pound

11
Figure 8 – Checking Temperature of Fuel in Portable Tank Between Test Runs Type II Test Data
All experimental data for the Type II procedure are provided in Table 1. Both baseline testing and low mileage testing were completed on December 18, 2006. After approximately 24,000 miles had been driven, the high mileage portion of the study was completed. The high mileage stage was originally planned for February 2, 2007 (after approximately 15,000 miles); however, a leak in one of the quick -disconnect fuel lines invalidated the data and it was necessary to reschedule for a later time that would facilitate a permanent repair. While this was an inconvenience at the time, it did allow for the accumulation of additional miles before the completion of the study (thus, more daily performance data and more maintenance history with the technology).

12
Table 1 – Type II Test Raw Data (T=Treatment Vehicle, C=Control Vehicle)
Type II Calculations It is seen in Table 2 that the installation of the Fuel and Air Saver™ produced
apparent short-term fuel savings of 0.5 percent. TMC cautions that if the technology being tested shows a degree of improvement less than or equal to the accuracy limit of the procedure (in this case 1 percent), additional testing should be conducted to determine the true value. If additional testing does not show consistent results, fleets should conclude that any change resulting from the technology is not measurable by the procedure.
Since the short-term test value for the closed crank retrofit did not exceed the minimum value of 1 percent, and because the vendor asserted that fuel economy would continue to improve (up to a point) with additional miles, post-installation fleet records were used to further scrutinize performance. As previously mentioned, a final Type II test segment was run after the accumulation of approximately 24,000 miles in order to capture any long-term effect on fuel consumption. This final step resulted in an apparent long-term fuel savings computation of 2.6 percent using the conservative data filtering methodology prescribed in RP 1102. When all data points were used, computed fuel savings increased to 4.1 percent.
Table 2 – Type II Fuel Economy Test Calculations
Run Test 28-Mile Mid Air Dew Hum Wind Wind Precip FuelT FuelC T/C T/C T/C T/C T/CDate Segment Test Runs Time (°F) (%) (%) (mph) Dir (in) (lbs) (lbs) (All) (Band) (Filt) (Avg) (% Saved)
12/18/2006 Baseline 1 1022 66 55 68 5 140 0.0 45.6 45.1 1.0112 1120 70 55 59 3 290 0.0 44.9 44.3 1.0143 1210 72 54 53 3 330 0.0 43.4 44.5 0.975 98% 0.9754 1309 73 54 51 0 0 0.0 43.8 44.3 0.989 100% 0.9895 1404 75 54 48 6 300 0.0 42.9 43.3 0.991 100% 0.991 0.985 Baseline
12/18/2006 Low Mile Test 1 1528 73 54 51 3 340 0.0 45.0 44.6 1.009(0 miles) 2 1624 73 52 48 0 0 0.0 42.8 43.7 0.979 99% 0.979
3 1714 66 50 56 3 350 0.0 44.0 45.2 0.973 99% 0.9734 1804 63 50 63 5 30 0.0 45.1 45.7 0.987 100% 0.987 0.980 0.5%
2/27/2007 High Mile Test 1 938 64 39 40 5 340 0.0 43.3 45.0 0.962 100% 0.962(24k miles) 2 1031 66 36 33 7 350 0.0 43.8 45.3 0.967 100% 0.967
3 1125 72 36 27 9 30 0.0 43.1 45.8 0.9414 1221 72 34 25 10 320 0.0 42.6 44.9 0.949 98% 0.949 0.959 2.6%
Run Test 28-Mile Mid FuelT FuelT FuelC FuelC
Date Segment Test Runs Time (lbs) (°F) (lbs) (°F)12/18/2006 Baseline 1 1022 45.6 118 45.1 111
2 1120 44.9 134 44.3 1293 1210 43.4 151 44.5 1464 1309 43.8 154 44.3 1495 1404 42.9 156 43.3 150
12/18/2006 Low Mile Test 1 1528 45.0 129 44.6 123(0 miles) 2 1624 42.8 141 43.7 135
3 1714 44.0 142 45.2 1374 1804 45.1 143 45.7 138
2/27/2007 High Mile Test 1 938 43.3 138 45.0 120(24k miles) 2 1031 43.8 151 45.3 143
3 1125 43.1 154 45.8 1454 1221 42.6 157 44.9 151

13
Daily Fleet Records Each vehicle in the 5-truck fleet is run approximately 680 miles per day in order
to damage experimental pavements on the Pavement Test Track. Detailed records of fleet operations are maintained to aid in minimizing cost as well as in supporting ongoing vehicle research projects. Single 100-gallon tanks on each truck are topped off using an onsite portable tank at the end of each 340 mile AM (5:00 AM until 2:00 PM) and PM (2:00 PM until 11:00 PM) shift. A driver shift change occurs at 2:00 PM; however, drivers are assigned to the same vehicle on a daily basis. A digital pumping system is used to dispense the fuel that is calibrated to the nearest one-thousandth of a gallon. Idling practices are identical for every truck in the fleet in order to produce duty cycles that do not confound test data. Overall average fuel economy ratios (treatment vehicle mpg divided by control vehicle mpg) from daily track operations are provided in Table 3. These data are in general agreement with the findings from the Type II experiment previously described, with the only difference being a greater improvement in the percentage of fuel saved.
Table 3 – Records from Daily Fleet Operations
Date of High Low Avg T/C Date of High Low Avg T/C % FuelOperation Temp (°F) Temp (°F) Ratio Operation Temp (°F) Temp (°F) Ratio Saved11/29/2006 66 63 1.00 12/22/2006 64 61 1.03 1.3%11/30/2006 75 64 0.97 1/4/2007 63 55 1.06 3.7%12/1/2006 63 37 1.02 1/5/2007 66 52 1.04 2.3%12/2/2006 63 32 0.99 1/6/2007 70 52 1.05 3.1%12/5/2006 57 28 1.00 1/9/2007 55 34 1.05 3.4%12/6/2006 61 37 1.00 1/10/2007 52 32 1.06 4.0%12/7/2006 55 27 0.99 1/11/2007 61 37 1.05 3.3%12/8/2006 43 19 1.00 1/12/2007 70 48 1.05 3.6%12/9/2006 54 25 1.02 1/13/2007 70 48 1.06 3.8%12/11/2006 68 45 1.01 1/17/2007 46 34 1.06 3.8%12/12/2006 68 50 1.02 1/18/2007 43 36 1.06 4.1%12/13/2006 66 48 1.02 1/19/2007 54 43 1.05 3.2%12/14/2006 66 48 1.02 1/20/2007 54 37 1.05 3.2%12/15/2006 70 43 1.02 1/23/2007 43 37 1.05 3.4%12/16/2006 72 43 1.02 1/24/2007 45 37 1.05 3.2%
1/25/2007 54 36 1.05 3.5%1/26/2007 57 28 1.05 3.3%1/27/2007 61 34 1.05 3.5%1/30/2007 52 32 1.05 2.9%1/31/2007 48 25 1.05 3.1%2/1/2007 45 36 1.05 3.5%2/2/2007 45 30 1.05 3.5%2/6/2007 55 27 1.05 3.4%2/7/2007 66 43 1.06 3.6%2/8/2007 57 43 1.06 3.7%2/9/2007 43 36 1.06 3.8%
2/10/2007 48 28 1.05 3.3%2/13/2007 57 52 1.05 3.4%2/14/2007 39 28 1.05 3.5%2/15/2007 43 25 1.06 3.6%2/16/2007 43 21 1.06 3.7%2/17/2007 54 25 1.06 3.7%2/20/2007 66 46 1.06 3.9%2/21/2007 61 52 1.06 3.9%
Before Treatment Retrofit After Treatment Retrofit

14
Maintenance Observations Drivers did not report any change in performance of the test vehicle during the time the Fuel and Air Saver™ was being evaluated. The turbo systems on both the control and test vehicles were inspected after approximately 16,000 miles. At that time, a very thin but clean slick residue was noted on the turbo blades of the treatment vehicle, presumably the result of the Fuel and Air Saver™ introducing combustible crankcase vapor to the intake.
A major point of concern by PAVE’s trucking coordinator was the presence of an oily residue throughout the inside of the engine compartment. This occurrence seemed to be related to an increase in crankcase pressure, for which bulging seals and occasional dipstick backpressure were cited as support evidence. After approximately 23,000 miles, it was determined by Freightliner during a service call that a malfunctioning waste gate had caused a loss of turbo boost regulation that led to sporadic increases in crankcase pressure. It was the opinion of the service technician that the installation of the Fuel and Air Saver™ could not possibly have been related to the failure of the waste gate. It was his further opinion that the waste gate malfunction had caused the oily residue on the inside of the engine compartment.
Oil was changed in the both the control and test vehicles every 15,000 miles. The results of sample analyses are pending. DISCUSSION OF RESULTS The closed crank retrofit was very easy to install and did not present any discernable mechanical problems. All environmental and experimental data for the Type II procedure have been provided in Tables 1 and 2. It was found that the installation o f the Fuel and Air Saver™ produced apparent short-term fuel savings of 0.5 percent and apparent long-term fuel savings of 2.6 percent using the data filtering method prescribed in the Type II procedure. A greater percentage would be computed for both stages of testing if the entire dataset were used for savings computations (i.e., if the data were not filtered to represent the most conservative scenario). The fuel economy performance of both the treatment and control vehicles were monitored on a daily basis for approximately 24,000 miles in order to validate these findings. This process resembled the Type IV revenue route procedure specified in RP 1109, except that the hardware was not swapped at the midpoint of each daylong “test run.” As seen in Figure 9, fleet data collected immediately after the installation of the closed crank retrofit generally agreed with the short-term Type II data. Further, running additional miles eventually produced apparent long-term fuel savings that averaged between 3 and 4 percent. After an initial gradual increase, the savings percentage appeared to level off after approximately 5,000 miles. These findings are in general agreement with the long-term stage of the Type II test, where the result from the daily fleet records fell between the unfiltered and filtered Type II results.

15
Figure 9 – Apparent Long-Term Fuel Savings
Please note that TMC cautions a single test is inconclusive regardless of the results; however, these positive findings should be interpreted by fleets as an indicator of the potential of the technology to produce real fuel savings in their own daily operations.
0%
1%
2%
3%
4%
5%
0 5,000 10,000 15,000 20,000 25,000
Miles Driven
Fu
el S
aved
(%)
Daily Fleet Records Type II Filtered Type II Unfiltered

16
APPENDIX A – FLEET REFERENCES

17
APPENDIX B – TRACTOR SPECIFICATIONS
• Model Year – 2004 • GVW – 52,000 • Engine – Minimum 14.0 Liter 435HP @ 2100 RPM 1650 LB/FT Torque • Batteries – (3) 12V with 2280 CCA • Positive Post for jump starting the truck • Compressor – Minimum of 15.9 CFM • Clutch – Eaton Fuller 15-1/2” Adjust Free • Exhaust – Right hand mounted vertical exhaust with 13’ 06” curved vertical
chrome tailpipe. • Coolant filter – Fleetguard or approved equivalent • Radiator – Minimum 1350 SQ-IN • Antifreeze – Minimum rating of –34F • Transmission – Eaton Fuller RTOC-16909A • Transmission – Convert transmission to 13-speed at 500,000 miles (Provide total
price for parts and labor as a separate line item) • Transmission oil cooler – Air to oil • Front Axle – Dana Spicer E-1200I 3.5” Drop Front Axle rated at 12,000 LB • Front Brakes – Dana Spicer 15 x 4L ES LMS Extended Lube front brakes • Front Suspension – 12,000 LB Taper-Leaf • Front Slack adjusters – Dana Spicer LMS Extended Lube automatic front slack
adjusters • Front shock absorbers • Rear Axle – Dana Spicer DSH40 rated at 40,000 LB • Rear Axle Ratio – 3.70 • Main Driveline – Dana Spicer SPL250HD • Interaxle Driveline – Dana Spicer SPL170 XL • Interaxle Lockout – To include indicator light • Synthetic Oil – 50W Transmission / 75W – 90W all axles • Rear Brakes – Dana Spicer 16.5x7L LMS extended lube • Rear Slack Adjusters – Dana Spicer LMS extended lube automatic rear slack
adjusters • Rear Suspension – Airliner 40,000 LB extra duty • Air Suspension Dump Valve – Manual with indicator light and warning buzzer • Rear Shock Absorbers – Both axles • Trailer Air Hose – 15’ coiled • Trailer Electrical Cable – 15’ Coiled • Wheelbase – 187” • Frame – 7/16” x 3-11/16” x 11-1/8” steel frame with a ¼” full C-Channel frame
reinforcement with a minimum RBM rating 3,432,000 lbf-in per rail • Frame Overhang – Minimum of 57 inches • Front Tow Hooks – Frame mounted

18
• Clear Frame Rails 30” back of cab for cab guard mounting • Air Slide 5th Wheel – 24” with a vertical load capacity of 70,000 lbs and a trailing
load capacity of 200,000 lbs • Fuel Tank – 100 - gallon aluminum right hand mounted fuel tank • Front Tires – 275/80R 22.5 14 PLY Michelin XZA2 • Front Wheels – Aluminum 10-Hub Pilot • Rear Tires – 275/80R 22.5 14 PLY Michelin XDA H/T • Rear Wheels – 10-Hub Pilot 5-hand steel wheels • Cab – Minimum of 120” conventional cab • Cab Mounts – Air ride • Air Horn • Utility Light – Flush mounted back of cab • Mirrors – Dual West Coast heated mirrors with right hand remote 102” wide • Convex Mirrors – 8” convex mirrors mounted under primary mirrors on driver
and passenger sides • Factory tinted windshield and glass • Vent Windows • Ash Tray and Lighter – Dash mounted • Fire Extinguisher – Mounted left hand of drivers seat • Heater and Defroster • Air Conditioning • Driver Seat – High back air ride driver seat with adjustable lumbar support and
dual armrest • Passenger Seat – High back non-suspension • Seat Covers – Heavy duty vinyl • Gauges – To include all standard gauges plus tachometer, trip meter, hour meter,
voltmeter, air restriction indicator, low air pressure light and buzzer, primary and secondary air pressure gauges, engine coolant temperature, and engine oil pressure
• Radio – AM/FM/WB Cassette • Trailer Brake – Hand Controlled • Park Brake System – Two valve system with warning indicator