tmdl study phase i: mercury loads to impaired waters in ... quality/planning/tmdl/final tmdls... ·...
TRANSCRIPT

TMDL Study Phase I:Mercury Loads to Impaired Waters in the Lumber River Basin,North Carolina
November 1999
Lumber River Basin
Prepared by:NC DEPARTMENT OF ENVIRONMENT AND NATURAL RESOURCESDIVISION OF WATER QUALITYWATER QUALITY SECTION1617 MAIL SERVICE CENTERRALEIGH, NC 27699-1617(919) 733-5083

page ii
TABLE OF CONTENTS
INTRODUCTION...................................................................................................................1 303(d)/Total Maximum Daily Loads......................................................................1Site Description.....................................................................................................3
MERCURY CYCLING IN THE ENVIRONMENT ............................................................................7
EXTENT OF MERCURY CONTAMINATION .............................................................................10
POTENTIAL SOURCES OF MERCURY...................................................................................14Natural Sources of Mercury ................................................................................14Anthropogenic Sources of Mercury.....................................................................14Quantification of Mercury Sources......................................................................27
ESTIMATES OF MAXIMUM MERCURY LOADS........................................................................31Seasonality .........................................................................................................32Uncertainties.......................................................................................................34Margin of Safety..................................................................................................36
WASTE LOAD AND LOAD ALLOCATIONS ..............................................................................37
SUMMARY .......................................................................................................................39
REFERENCES...................................................................................................................40
APPENDIX A. NPDES AND ATMOSPHERIC EMISSION SOURCES
APPENDIX B. DISCHARGE MONITORING REPORT DATA
APPENDIX C. PRELIMINARY DISPERSION MODELING ANALYSIS OF LOCAL MERCURY SOURCESIN THE LAKE WACCAMAW VICINITY
APPENDIX D. PUBLIC NOTICE AND COMMENTS
APPENDIX E. OUTLINE AND PROPOSED SCHEDULE FOR PHASE II
page 1
INTRODUCTION
Eleven waters from the Lumber River basin appear on the 1998 303(d) list for fish consumptionadvisories due to mercury contamination. Table 1 lists waters in the Lumber River Basin thathave fish consumption advisories and appear on the 303(d) list. This document describes thesources of mercury in the Lumber River basin and development of mercury total maximum dailyloads for those waters listed in Table 1. The ultimate objective of this study, and future studiesor management plans regarding mercury in the coastal plain, is to reduce fish tissue levels ofmercury and remove fish consumption advisories. Recommendations on how to reduce mercurypollution in surface waters are provided at the end of the document.
Table 1. Lumber River Basin 303(d) Listed Waters due toMercury ContaminationWatershed Name of stream or lake SubbasinLumber River Drowning Creek 030750
Lumber River 030751Big Swamp 030753Porter Swamp 030751Ashpole Swamp 030754Pages Lake 030750Pit Lake (Pit Links Lake) 030750Watson Lake 030750
Waccamaw River Waccamaw River 030756, 030757Big Creek 030756White Marsh 030758
303(d)/Total Maximum Daily Loads (TMDLs)
Section 303(d) of the Clean Water Act (CWA) requires states to develop a list of waters notmeeting water quality standards or which have impaired uses. This list is submitted biennially tothe U.S. Environmental Protection Agency (EPA) for review. The 303(d) process requires that aTotal Maximum Daily Load (TMDL) be developed for each of the listed waters, wheretechnically feasible. EPA characterizes the TMDL as the sum of the wasteload allocation(WLA), load allocation (LA), and a margin of safety (MOS), or
TMDL = S(WLA, LA, MOS).
The wasteload allocation portion of the TMDL accounts for the loads allotted to existing andfuture point sources. Similarly, the load allocation portion of the TMDL accounts for the loadsallotted to existing and future nonpoint sources and natural background. The margin of safetyaddresses uncertainties in the data collection and modeling techniques (FACA 1998). Theobjective of a TMDL is to allocate allowable pollutant loads to known sources so that actionsmay be taken to restore the water to its intended uses (EPA 1991). Generally, the four primarycomponents of a TMDL, as identified by EPA (1991) and the Federal Advisory Committee(FACA 1998) are as follows:

page 2
Target identification or selection of pollutant(s) and end-point(s) for consideration. Thepollutant and end-point are generally associated with measurable water quality relatedcharacteristics that indicate compliance with water quality standards. North Carolinaindicates known pollutants on the 303(d) list.
Assimilative capacity estimation or level of pollutant reduction needed to achieve water qualitygoal. The level of pollution should be characterized for the waterbody, highlighting howcurrent conditions deviate from the target end-point.
Source identification. All sources that contribute to the impairment should be identified andloads quantified, where sufficient data exist.
Allocation (with margin of safety) of pollutant loads. Allocating pollutant control responsibilityto the sources of impairment. When allocation is not possible, alternative methods ofattaining standards may be included in the TMDL.
Section 303(d) of the CWA and the Water Quality Planning and Management regulation requireEPA to review all TMDLs for approval or disapproval. Once EPA approves a TMDL, then thewater may be removed from the 303(d) list. Where conditions are not appropriate for thedevelopment of a TMDL, management strategies may still result in the restoration of waterquality. However, the water may not be removed from the 303(d) list until improvements inwater quality have been demonstrated and the water meets designated uses.
The Federal Advisory Committee (FACA 1998) suggested three additional components of aTMDL in their April 1998 draft document. They are 1) an implementation plan, 2) monitoringand evaluation, and 3) TMDL revision procedures. These three additional components are notaddressed herein. This document is the first of two parts, or phases, of the Lumber MercuryTMDL as described.
Phase I of the TMDL establishes maximum loads for all 303(d) listed waterbodies basedon simple criteria. This part of the TMDL uses existing and readily available informationfor evaluating maximum loads to waters and makes general recommendations formercury reduction in these waters (not the implementation plan).
Phase II of the TMDL will incorporate regional air quality modeling results from EPAOffice of Air Quality Planning and Standards, provide a more detailed mercury cyclingmodel for a portion of the Waccamaw River Basin, and establish requirements forevaluating mercury reductions. Phase II of the TMDL will also include implementationprograms for atmospheric and NPDES mercury reductions and guidelines for revising theTMDL.
The remaining sections of this report discuss the following issues related to mercury in theLumber and Waccamaw River Watersheds:
Mercury Cycling in the Environment.Extent of Mercury ContaminationPotential Sources of MercuryEstimates of Maximum Allowable Mercury LoadsWaste Load and Load AllocationsSummary

page 3
Site Description
The Lumber River basin, as shown in Figure 1, is located in the lower southeastern corner ofNorth Carolina. This basin is comprised of four distinct watersheds: the Lumber River,Waccamaw River, Little Pee Dee Headwaters, and the Coastal Area. Past fish consumptionadvisories for waters in the Lumber River Basin have been primarily in the Lumber andWaccamaw River watersheds. The Lumber River from NC Highway 71 to the North Carolina-South Carolina state border is on the state’s 1996 and 1998 303(d) lists. The impairment in theLumber River, as well as many of its tributaries and impoundments, is due to elevated levels ofmercury in fish tissues. The Lumber River watershed drains approximately 1,043,300 acres inColumbus, Robeson, Bladen, Cumberland, Moore, Montgomery, Hoke, Scotland, and Richmondcounties (NCDEHNR 1994). The municipalities of Aberdeen, Lumberton, Pinehurst, and RedSprings are in this watershed. Roughly 50 percent of the watershed is forested and 40 percent isin agriculture, mostly cropland. The remainder is of mixed use including rural transportation anddeveloped land (NCDEHNR 1994). Small streams in the Lumber River watershed tend to havelittle or no flow during dry summer months. A map of the Lumber River watershed is shown inFigure 2.
The Waccamaw River from the dam at Lake Waccamaw to the North Carolina-South Carolinastate border is on the state’s 1996 and 1998 303(d) lists. The Waccamaw River watershed drainsapproximately 804,400 acres in Columbus, western Bladen and northern Brunswick counties(NCDEHNR 1994). The municipalities of Whiteville, Tabor City, and Lake Waccamaw are inthis watershed. Roughly 64 percent of the watershed is forested and 27 percent is in agriculture,mostly cropland. The remainder is of mixed use including pastures, rural transportation, anddeveloped land (NCDEHNR 1994). The Waccamaw River originates at Lake Waccamaw andflows southwest into the Great Pee Dee River in South Carolina. Small streams in theWaccamaw River basin tend to have little or no flow during dry summer months. A map of theWaccamaw River in North Carolina is shown in Figure 3.

Fayetteville
Pinehurst
Laurinburg
Lumberton
Whiteville
Wilmington
Boiling Spring Lakes
Lumber River
Big Swamp
Lumbe
r Rive
r
Wac
cam
aw R
iver
Lake Waccamaw
CAPE FEAR BASIN
YADKIN BASIN
South Carolina
HOKE
BLADEN
ROBESON
SCOTLAND
COLUMBUS
RICHMOND
SAMPSON
DUPLIN
PENDER
MOORE
CUMBERLAND
BRUNSWICK
County bdryMunicipalityHydrographyBasin bdryMajor hydrography
30 0 30 Miles
S
N
EW
Figure 1. Lumber River Basin, North Carolina

Ñ
Ñ
Ñ
Ñ
Ñ
Ñ
Ñ
Ñ
Ñ
Ñ
Ñ
Drowning Creek
Aber
deen
Cre
ek
Lumber R
iver
Raft Swamp
Big Swam
p
Raf t S
wam
p
Pinehurst
Lumberton
Ashpole Swamp
Porter Swamp
CUMBERLAND
BLADEN
ROBESON
COLUMBUS
South Carolina
NTGOMERY
MOORE
HOKE
SCOTLAND
RICHMOND
Lumber River
Big Swamp MunicipalityHydrography
Ñ Ambient siteSubbasin bdryCounty bdry
20 0 20 40 Miles
N
EW
S
Figure 2. Lumber River Watershed, NC

Ñ Ñ
ÑÑ
Ñ
Ñ
Ñ
Ñ
Ñ
Ñ
Ñ
Ñ
Ñ ÑÑ
Ñ
ÑÑÑÑÑÑ
ÑÑÑBogue Swamp
Slap Swamp
Big
Cre
ek
Gri sset t S
wam
p
Gum Swamp
Cawca
w Swamp
Juniper Creek
COLUMBUS
BLADEN
BRUNSWICK
White Marsh
Whiteville
Lake Waccamaw
South Carolina
MunicipalitiesHydrographyMajor hydrography
Ñ Ambient siteSubbasin bndryCounty bndry
20 0 20 Miles
N
EW
S
Figure 3. Waccamaw River Watershed, NC

page 7
MERCURY CYCLING IN THE ENVIRONMENT
Mercury has a complex life in the environment, moving from the atmosphere to soil, surfacewater, and into biota. A more comprehensive discussion of mercury in North Carolina can befound in “An Assessment of Mercury in North Carolina” (NCDEM 1982). EPA’s MercuryReport to Congress (EPA 1997a) briefly describes the mercury cycle as well. Mercury cycles inthe environment as a result of natural and human (anthropogenic) activities. The amount ofmercury mobilized and released into the biosphere has increased since the beginning of theindustrial age. However, the total amount of mercury on the planet has neither increased nordecreased. Human activities have simply moved the mercury from crustal soils to the biosphere.A schematic of mercury cycling in the biosphere is shown in Figure 4.
Figure 4. Schematic of Global Mercury Cycle (EPA 1997a)
As shown in Figure 4, most of the mercury in the atmosphere is elemental mercury vapor(Hg(0)) or particulate mercury (Hg(p)). Lindqvist et al. (1991) estimate that about 95-100% ofatmospheric mercury is gaseous (elemental or inorganic), while the other 5% is particulate.Elemental mercury vapor may circulate in the atmosphere for up to a year. However, whenconverted to inorganic mercury (Hg(II)), it may only circulate for a period of hours. Thus,elemental mercury can be widely dispersed and transported thousands of miles from the source.The inorganic form of mercury, when either bound to airborne particles or in a gaseous form, isreadily removed from the atmosphere by precipitation and dry deposition. Wet deposition hasgenerally been believed to be the primary mechanism for transporting mercury from theatmosphere to surface waters and land, although new research indicates dry deposition may beequally important. Even after it deposits, mercury commonly is emitted back to the atmosphereeither as a gas or associated with particles, to be re-deposited elsewhere (EPA 1997a). After

page 8
particulate or inorganic mercury deposits into surface waters, additional chemicaltransformations can occur. Within the water column or sediment mercury can convert back toelemental mercury or can become organic mercury (CH3Hg). It is the organic form of mercurythat is the most toxic and most likely to accumulate in fish.
Most of the mercury in water, soil, sediments, or plants and animals is in the form of inorganicmercury salts and organic forms of mercury. Generally, mercury in the water column will bebound to organic matter, either dissolved organic carbon (DOC) or suspended particulate matter(EPA 1997a). Total mercury levels in water do not necessarily correlate to mercury levels inbiota or fish. This is because the organic form of mercury, methylmercury, is more likely toaccumulate in fish tissue. The conversion of inorganic mercury to methylmercury is not wellunderstood. Scientists continue to study this conversion in the Florida Everglades and the GreatLakes. However, several studies have found characteristics that are strongly correlated with theproduction of methylmercury, as shown in Table 2.
Table 2. Factors Associated with Increased Methylmercury ProductionFactor DescriptionTemperature In freshwater sediments of northeastern acidic lakes, methylation is inhibited
by low temperatures and has a temperature optimum of about 35 °C (Winfreyand Rudd 1990). Temperature seems to affect mercury methylation morestrongly than demethylation (Gilmour 1995).
Color/HumicContent/Organic carbon
Mercury methylation is enhanced by increased availability of organic carbon.Increased decomposition of organic matter is a major cause of increasedmethylation in newly formed reservoirs and impoundments (Winfrey andRudd 1990 ). Wetlands are also sites of increased decomposition of organicmatter and have been recognized as sites of high mercury methylation(Gilmour 1995). Lindqvist et al. (1991) found that mercury concentrations inSwedish lakes were positively correlated to water color associated withorganic content in the waters.
Hydrogen ion (pH) Methylmercury production appears to be greater at low pH (e.g., 5-7). Theformation of a more volatile form of methylmercury appears to be greater athigher pH values (e.g., >7). As pH decreases, a shift from the production ofthe more volatile to less volatile form of mercury occurs. A shift in pH fromneutral to acidic could affect the mercury content in fish since the less volatileform is retained more efficiently (Winfrey and Rudd 1990). Release ofmethylmercury from the sediment surface is enhanced by reduced pH andcould further increase the supply of methylmercury to fish (Winfrey and Rudd1990). Lindqvist (1991) found a strong negative correlation of mercury infish with lake water pH.
Oxygen “Mercury methylation is a predominantly microbial process that occursmainly in anoxic sediments and waters, with maximum intensity often at theinterface between anoxic and oxic conditions” (Gilmour 1995). In additionto mercury methylation in anoxic subsurface sediments, methylation alsooccurs in the aerobic water column at the aerobic sediment-water interface, inthe outer slime layer of fish, and in the intestinal contents of fish (Winfrey andRudd 1990). Bloom et al. (1991) found that the highest methylmercury levelsare reached in the anoxic, sulfide-rich bottom waters of acidic, northeasternlakes by late summer.
page 9
The Lumber and Waccamaw River Watersheds are blackwater systems that generally have allthe characteristics described above: high levels of organic carbon, low pH, and during thesummer months, lower dissolved oxygen levels and higher temperatures. Thus, the naturalcharacteristics of these waters would likely contribute to the increased production ofmethylmercury.
Mercury accumulates efficiently in the food web. Accumulation occurs when the rate of uptakeof a chemical or compound exceeds the rate of removal or elimination (EPA 1997a). Mercurypresent in low levels of the food chain (e.g., plankton, detritus) and water is taken up by foragefish through respiration and ingestion. Predatory organisms at the top of the food web generallyhave higher mercury concentrations. Within the aquatic food web, predatory fish such as bowfinand largemouth bass would have higher concentrations than forage fish (e.g., sunfish). Nearly allof the mercury that accumulates in fish tissue is methylmercury. Inorganic mercury does nottend to accumulate.
Mercury accumulation continues to move up the food chain outside of the aquatic environment.Humans, bald eagles, small mammals, and other fish eating species, as top predators, alsoaccumulate mercury in tissue. Fish eating birds in the Great Lakes and the Everglades havealready accumulated mercury at levels considered unsafe. Humans are most likely to be exposedto mercury through fish consumption, although mercury may be inhaled or ingested throughother routes.
Methylmercury is a neurotoxin that may affect fetal neurological development followingsufficient exposures. At higher exposure levels it can act as a neurotoxicant in adults, producingadverse effects such as tremor and parasthesia. The amount of mercury that can be safelyingested by humans is continually being reevaluated by the EPA, the Agency for ToxicSubstances and Disease Registry (ATSDR) and other national and international agencies as newepidemiological data become available. The North Carolina Department of Health and HumanServices (DHHS) Occupational and Environmental Epidemiology Branch has developedguidelines to instruct people on safe levels of fish consumption. When the average fish tissuemercury concentration for a particular species falls between 1 – 2 mg/kg (1-2 ppm), the generalpublic is advised to eat no more than 2 meals per month, while women of child-bearing age andchildren are advised to avoid consumption of this species entirely. Above 2 mg/kg, noconsumption is advised for all groups.

page 10
EXTENT OF MERCURY CONTAMINATION
Various agencies of the State of North Carolina have collected mercury data in the Lumber RiverBasin. DWQ maintains an ambient monitoring network in the basin where monthly waterquality samples are collected. The general locations monitored are presented in Figures 2 and 3.Mercury has generally not been detected in surface waters since this monitoring network wasbegun. DWQ and Department of Health and Human Services fish tissue analyses have detectedelevated mercury concentrations in several piscivorous fish of the Lumber and Waccamaw Riverwatersheds. Mercury concentrations exceeding the Food and Drug Administration and NorthCarolina (FDA/NC) action level of 1 mg/kg have been detected in largemouth bass, bowfin andchain pickerel. A fish consumption advisory for largemouth bass and bowfin was issued inOctober 1994 for the entire Lumber River Basin (i.e., all four watersheds) due to elevatedmercury levels in fish. In June 1997 a statewide advisory against the consumption of bowfin wasissued due to mercury contamination.
Fish tissue samples from the Lumber and Waccamaw River watersheds have been analyzed formercury since the mid-1980s. However, the most comprehensive collection and analysis of fishtissue occurred in 1993. Thus, a large portion of the data described herein is from 1993. Toillustrate the persistence of mercury in the Lumber and Waccamaw River watersheds, datacollected in 1996 will also be presented. In 1993, largemouth bass, bowfin, and other predatoryand forage fish species were collected and analyzed for mercury. Mean concentrations ofmercury in largemouth bass and bowfin from multiple locations in each watershed were greaterthan the FDA/NC action level for mercury of 1 mg/kg. In general, concentrations in otherpredatory and forage fish were lower than the FDA/NC action level. A summary of average1993 mercury concentrations in largemouth bass from the Lumber and Waccamaw Riverwatersheds is presented in Figure 5. The data shown in Figure 5 include only those waters withmultiple samples from which to calculate a mean (i.e., n>1 or more than one fish was caught).Several of the lakes shown in Figure 5 are not on the state’s 303(d) list due to listingmethodology. All lakes in the basin are included in the fish consumption advisory. TMDLdevelopment is focused on those lakes that are on the 303(d) list and appear in Table 1.
Several of the waters listed in Table 1 do not appear on Figure 5, primarily because of thepaucity of fish tissue data. DWQ does not have data for Big Swamp from the years 1992 or1993. Porter Swamp had one sample collected in 1992, bowfin with a mercury concentration of1.5 mg/kg. Similarly, Ashpole Swamp had one sample collected in 1992, chain pickerel with amercury concentration of 1.2 mg/kg. Big Creek was sampled in 1992 at two different locations.Mercury levels in largemouth bass from Big Creek near the mouth with Lake Waccamawaveraged 1.5 mg/kg (average of 22 samples), and in bass from Big Creek upstream of SR 1947 atbridge averaged 1.0 mg/kg (average of 5 samples). White Marsh was sampled once in 1993; asingle chain pickerel from White Marsh had a mercury concentration of 1.9 mg/kg.
Contaminated sediment at the bottom of surface waters can serve as an important mercuryreservoir. Sediment-bound mercury may recycle back into the aquatic ecosystem for decades, orlonger (EPA 1997a). Two grab samples of sediment were collected from Lake Waccamaw in1992 when fish were collected for sampling. Mercury concentrations in these samples were 0.04

Figure 5. 1993 Mean Mercury Levels in Largemouth Bass from the Lumber andWaccamaw River Watersheds
Lakes
Rivers/Streams
0
0.5
1
1.5
2
2.5
Inman Lake
Maxton Pond
Pages LakePit Lake
Richmond Millpond
Watson Lake
Meares Millpond
Lake Waccamaw @ Big Cr
Lake Waccamaw @ dam
Con
cent
ratio
n (m
g/kg
)
0
0.5
1
1.5
2
2.5
Drowning Cr at SR1225
Drowning Cr at SR1412
Lumber R at 401
Lumber R @ NC72
Lumber R @ US74
Lumber R @ Fair Bluff
Waccamaw R @ NC130
Waccamaw R @ NC904
Con
cent
ratio
n (m
g/kg
)
FDA/NC Action Level
FDA/NC Action Level
page 11

page 12
and 0.02 mg/kg. EPA has not developed sediment quality criteria for mercury; thus there are nobenchmark values to determine if these levels of mercury in sediment may be harmful to humanhealth or aquatic life. Since 1990, mercury has sporadically been detected at the detection limitof 0.2 µg/L in the water column of both watersheds. However, none of these samples werecollected or analyzed using clean techniques. This may have resulted in “false positives” ordetections of mercury where there was either no mercury present or levels were below detectionlimits.
Data collected in 1996 are somewhat sparse. Only seven waters have multiple samples fromwhich to calculate a mean mercury concentration in largemouth bass. As shown in Figure 6,mercury concentrations in some areas were still quite high (e.g., Big Creek at SR1947 Bridge).While it may appear that mercury concentrations in Watson Lake and the Lumber River at FairBluff decreased, direct comparisons between the fish tissue data must consider the size andpotential age of the fish captured and analyzed. Larger, older fish would be more likely to havehigher concentrations of mercury in fish tissue because of a longer exposure to mercury in thefood chain. Smaller, younger fish would likely have lower concentrations. In 1993, the averageweight of largemouth bass captured in Watson Lake was 1,465 grams (3.3 pounds), while in1996 the average weight was 893 grams (~2.0 pounds). The average weight of largemouth bassfrom the Lumber River at Fair Bluff in 1993 was 1,270 grams (~2.9 pounds) compared to 555grams (~1.2 pounds) in 1996. The lower concentrations shown in Figure 6 may reflect thesmaller size, and reduced exposure, of fish captured in 1996 compared to 1993. Thus, althoughthe concentrations shown in Figure 6 are at and below the action level, heavier, older fish thathave been exposed to mercury for a longer time period may continue to contain mercury at levelsgreater than 1 mg/kg.

Figure 6. 1996 Mean Mercury Levels in Largemouth Bass from the Lumber andWaccamaw River Watersheds
0
0.5
1
1.5
2
2.5
Maxton Pond
Watson Lake
Lake Waccamaw
Big Swmp @ SR 1002
Lumber R @ Fair Bluff
Big Cr @ 1947 Bridge
Con
cent
ratio
n (m
g/kg
)
FDA/NC Action Level
page 13

page 14
POTENTIAL SOURCES OF MERCURY
Natural Sources of Mercury
The same amount of mercury has existed on the planet since the earth was formed (EPA 1997a).As a naturally occurring element, mercury is present throughout the environment, including theatmosphere, terrestrial environment, groundwater, and biota. Historically, mercury cycling in theatmosphere is believed to have been due to weathering and volcanic activities (NCDEM 1982).Mercury can naturally enter streams when scouring occurs over mercury deposits; mercuryretained in the water column can be in dissolved or particulate form (NCDEM 1982).Substantial uncertainties remain concerning the level of natural movement of mercury in theenvironment. Studies continue to be conducted which estimate the natural fluxes of mercury toand from the atmosphere, and terrestrial and aquatic environments (EPA 1997b).
Anthropogenic Sources of Mercury
Mercury is a unique pollutant in that significant sources to surface waters can be either directdischarges to the aquatic environment or indirect discharges that move through another media(e.g., soil or air) before reaching the water column. Mercury can be emitted to air from industrialactivities; once in the ambient air, mercury can be deposited back to the ground or to surfacewaters. This process, referred to as atmospheric deposition, has been found to be a significantsource of aquatic mercury (Lindqvist et al. 1992, EPA 1994, 1997a,b). Thus, potential aquaticand atmospheric sources of mercury to the Lumber and Waccamaw River watersheds will bediscussed.
Aquatic Sources. There are 39 permitted point source discharges in the Lumber and WaccamawRiver Watersheds. Of these, 15 discharge 100% domestic wastewater, and 8 discharge industrialwastewater. Fourteen of these facilities are permitted to discharge at least 0.5 million gallons perday (MGD). A list of the National Pollutant Discharge Elimination System (NPDES) pointsource discharges is shown in Table 3, by watershed. The locations of point sources are shownin Figures 7 and 8. Permit numbers associated with each point source are shown in Appendix A.
Four NPDES point source dischargers in the Lumber River Watershed, and one in theWaccamaw River Watershed, analyze effluent for mercury, as noted in Table 3. These facilitiesare Moore County WWTP (MOWASA), Laurinburg-Maxton Airport Commission (LMAC),Lumberton WWTP, Red Springs WWTP, and Whiteville WWTP. Of these five facilities, MooreCounty and Lumberton WWTPs did not detect mercury in effluent samples collected in 1996 and1997. LMAC, Red Springs WWTP, and Whiteville WWTP did detect mercury in the effluentduring this time period. Only Whiteville WWTP has a limit for mercury in effluent stated in theNPDES permit1. Whiteville WWTP has a mercury limit of 0.03 µg/L prior to expansion above2.5 MGD, and 0.02 µg/L after expansion. A summary of mercury concentrations in effluentfrom these facilities is presented in Table 4.
1 The Whiteville WWTP has conducted extensive studies to reduce the mercury levels ineffluent. Since beginning these studies, the frequency of mercury detection in effleunt sampleshas fallen from 60 percent in 1996 (n=57) to 22 percent in 1998 (n=64).

page 15
Table 3. NPDES Point Source Dischargers in the Lumber/Waccamaw River
Watershed Subbasin Facility LocationPermitted discharge
(MGD)Lumber 030750 Samarkand Manor Drowning Creek 0.04
Southern Pines WTP Aberdeen Creek 0Moore County WWTP (a2) Aberdeen Creek 6.70Camp Mackall (Army) Drowning Creek 0.02
030751 DOC-McCain Hospital UT Mountain Creek 0.2Westpoint Stevens Lumber River 4.5Robeson County WTP Lumber River 0.2Pembroke WWTP Lumber River 1.330Robeson Co Sch-Deep Br Lumber River 0.004Robeson County WWTP UT Lumber River 0Alamac Knit Fabrics Lumber River 2.560Lumberton WWTP (a1) Lumber River 10.000Buckeye Lumberton, Inc. Lumber River 1.800CP&L Weatherspoon SE Lumber River VariableRobeson Co Sch – Orrum High Sch Flowers Swamp 0.006Fair Bluff WWTP UT Lumber River 0.180
030752 Red Springs WWTP (a2) Little Raft Swamp 2.500Laurinburg City-Maxton Airport(a1)
Lumber River 1.0
030753 Bladenboro WWTP Bryant Swamp 0.500St. Pauls WWTP Big Marsh Swamp 0.500Parkton WWTP Dunns Marsh 0.200Robeson Co. Lumber Br Big March Swamp 0Croft Metals, Inc. Big Marsh Swamp 0.095Hoke Co. RWS/Antioch Raft Swamp No limitHoke Co RWS/Arabia Little Marsh Swamp No limit
030754 Fairmont WWTP Pittman Mill Branch 0.500Waccamaw 030756 Council Tool Company UT to Lake Waccamaw 0.020
Lake Waccamaw WWTP UT to Bogue Swamp 0.400Tabor City WWTP Town Canal 1.100
030757 Columbus Co Schools-Old DockElem
UT to Gum Swamp Run 0.005
Brunswick Co BOE-WaccamawElem
UT Bear Branch 0.0057
Carolina Blythe Utility Co UT to Persimmon Swamp 0.53030758 Whiteville WWTP (a2) White Marsh 3.0
Chadbourn WWTP Soules Swamp 0.820Georgia Pacific Juniper Creek 0Clarkton WWTP Brown Marsh Swamp 0.240Georgia Pacific Whiteville Soules Swamp No limit
(a) Facility is in the pretreatment program and regularly monitors for mercury in the effluent. Monitoring may beeither quarterly (denoted by a1) or at least monthly (denoted by a2).

ÑÑ
Ñ Ñ
Ñ
Ñ Ñ
Ñ
ÑÑ
Ñ
Ñ
Ñ
Ñ
Ñ
Ñ
Ñ
Ñ
Ñ
Ñ
Ñ
Ñ
ÑÑ
ÑÑ
Ñ
Ñ Ñ
ÑÑÑ
ÑÑ
ð
ðð
ð
ð
ð
ð
ð
ðð
##### ### #
##
#
#
### ##### ##
# # #########
##
#
#
####
###### #
# ### ###
# ###### ##
## ##
#### # ##
#
## ## ##
# # #
### ##
# ####### #
##
###### #
104101
103
102
NC0027651
NC0079707
NC0035904
NC0049778
NC0052477
NC0037508
NC0035777NC0005479
NC0005754
NC0029769
NC0005762
NC0048577NC0044725
NC0036773
NC0086045
NC0025577
NC0086037
NC0026921
NC0020095
NC0035530NC0085685
NC0085413
NC0027120
NC0069612
NC0027103NC0034070
NC0084204
NC0021059
NC0034100
NC0026352
NC0020729
NC0021661NC0020656
NC0004618
NC0058301NC0005363
NC0024571
02133500
02133616
0213396055
02134128
02134488
0213423350
02134500
0213460809
02132336
0213226902133624
02133691
South Carolina
Laurinburg
Lumberton
Pinehurst
Cape Fear R
ive r
HOKE
ROBESON
SCOTLAND
MOORE
BLADEN
COLUMBUS
RICHMONDCUMBERLAND
MunicipalityHydrography
Ñ Ambient siteð USGS gage# NPDES discharge
Subbasin bdryCounty bdryMajor hydrography
30 0 30 Miles
N
EW
S
Figure 7. NPDES Discharges in the Lumber River Basin

Ñ Ñ
Ñ
Ñ
Ñ
Ñ
Ñ
Ñ
Ñ
Ñ
Ñ
Ñ ÑÑ
Ñ
ÑÑÑÑÑÑ
Ñ
#
## #
####
#
##
##
##
####
#####
# ##### # #
#
#
# ###
#
##
# #
### ####
ð
ð
ð
ðð
White M
arsh
Big
Cre
ek
Bogue Swamp
Juniper Creek
Wac
cam
aw R
iver
Lake Waccamaw
NC0021610
NC0006858
NC0021881
NC0021920
NC0006785
NC0072168NC0005801
NC0021865
NC0026000NC0043745
NC0045276
Whiteville
Clarkton
Tabor City
Bolton
02109500
02110050
02110500
ROBESON
BLADEN
COLUMBUS
BRUNSWICKGrissett Swamp
105
NC0044873
MunicipalityHydrographyMajor hydrography
Ñ Ambient site# NPDES dischargeð USGS gage
Subbasin bdryCounty bdry
10 0 10 20 Miles
N
EW
S
Figure 8. NPDES Discharges in the Waccamaw River Basin

page 18
Table 4. Summary of 1996-1997 mercury concentrations in effluent, Lumber and WaccamawRiver Dischargers (concentrations in µg/L)FigureID Facility [Permit No.]
Frequency ofdetection (a)
Detectionlimit
Averageconcentration (b)
Range of detectedconcentrations
101 Laurinburg-MaxtonAirport [NC0044725]
1 /7 0.2 0.2 0.6
102 Lumberton WWTP[NC0024571]
0 /8 0.2 - -
103 Moore County WWTP[NC0037508]
0 /14 0.2 - -
104 Red Springs[NC0025577]
10 /41 0.2 0.1 0.2 – 0.8
105 Whiteville WWTP[NC0021920]
56/107 0.2 0.3 0.2 – 1.4
(a) The number of samples in which mercury was detected over the number of samples analyzed.(b) Mean mercury concentration calculated using all detected concentrations and one-half of the detectionlimit for samples below detection limits.
Other facilities do not regularly analyze effluent for mercury. Intermittent releases of mercurycan occur from large wastewater treatment plants in response to the discharges received frommedical or industrial connections. Several other smaller discharges in the Lumber RiverWatershed may potentially contain mercury, including hospitals and metal finishing industries.
Even if these facilities do release mercury to surface waters, NPDES point sources are notbelieved to be the most significant source of mercury to surface waters in the Lumber orWaccamaw River Watersheds. For example, elevated mercury levels have been found in fishwhere there are no upstream NPDES point sources of mercury. Therefore, NPDES point sourcescannot be the only source of mercury.
Atmospheric Sources. Recent scientific studies have indicated that significant aquatic loads ofhydrophobic organic chemicals (e.g., dioxins, PCBs), mercury, and nitrogen come from theatmosphere (Lindqvist et al. 1991, EPA 1994, 1997a,b). Atmospheric deposition occurs whenpollutants are carried from the air to either the land or water. This deposition may be enhancedby precipitation in the form of falling rain or snow. Worldwide mercury emissions to theatmosphere have increased since the beginning of the industrial age. After the initial localdeposition of mercury that occurs near a point source, the remaining mercury enters the globalair current and may be transported great distances across countries and over oceans (EPA1997a).
In EPA’s Mercury Study Report to Congress (EPA 1997a,b), both regional and localatmospheric modeling was performed to estimate the average annual atmospheric deposition ofmercury. Regional models consider pollutants that may be transported over long distances.Local models consider only the area around specific stack emissions. For the North Carolinacoastal area, the regional model estimated that average annual total mercury deposition rangedfrom 10 to 30 ug/m2. Local modeling did not focus on a specific facility, but rather wasperformed on hypothetical mercury emissions sources in the eastern and western US. For theeastern US, this local scale modeling predicted that 7 to 45% of locally emitted total mercury

page 19
would deposit within 50 km of a hypothetical facility (EPA 1997a). Thus, while up to half of theemitted mercury would deposit locally, the remaining mercury may be transported over greatdistances and could deposit in areas without local point emissions sources.
The North Carolina Division of Air Quality (DAQ) maintains an atmospheric mercury samplingsite at Waccamaw State Park, adjacent to Lake Waccamaw. This site has been operating since1995.2 There are no other atmospheric mercury monitors in the vicinity of the Lumber andWaccamaw River Watersheds. Data collected at the Waccamaw State Park monitoring siteinclude meteorological data (i.e., wind speed and direction, relative humidity, temperature,precipitation), and ambient air mercury vapor. Meteorological and mercury vapor data arecollected at 15-minute intervals. Meteorological data is collected from atop a 65-foot pole andthe mercury vapor analyzer inlet port is at a height of approximately 8-10 feet. Rainwater is alsocollected on a weekly basis for the National Mercury Deposition Network (MDN); samples aresent to a contract lab for analysis.
DAQ also maintains permits and other database information for industries emitting pollutants tothe atmosphere in the State of North Carolina. The State of South Carolina maintains a similardatabase. In the vicinity of Waccamaw State Park, and within the Lumber and lower Cape FearRiver Basins in general, there are fifteen facilities with reported emissions of more than tenpounds of mercury per year. The largest reported emissions are from Holtrachem ManufacturingCompany, L.L.C., a chloralkali facility. Based on the information provided by the facility,approximately 1,400 pounds of mercury were emitted from the facility in 19963. It is unclearwhether this estimate includes fugitive emissions or potential emissions from lagoons on the site.A map showing the locations of permitted atmospheric point source emissions in the vicinity ofthe Lumber River basin is shown in Figure 9. Numbers corresponding to the facility name andemission rate are also included in this figure. Facility data is presented in Table 5.
DAQ conducts analysis of the meteorological and mercury vapor data from the Waccamaw siteon a regular basis. Figures 10 and 11 show typical graphical representations of atmosphericelemental mercury vapor concentrations at Waccamaw State Park in May of 1998.4 Theserepresentations of mercury concentrations in the atmosphere illustrate the influence of bothglobally transported mercury as well as apparent local inputs, arising from sources located to theeast-northeast of the sampling site. Figure 10 displays the mercury concentration versus the dateand time of day without regard to wind direction. From this figure, it can be seen that thebaseline concentration of ambient air elemental mercury vapor is between 0.7 and 3 ng/m3 atWaccamaw State Park. The peaks observed are events observed during this period and aretypical event levels and durations observed for this site. Figure 11 represents the same data asFigure 10 but has only the discrete events plotted.5 This figure shows the typical correlation ofevents and wind direction associated with this site; the majority of the events are associated withwinds from 2 DAQ began monitoring mercury levels in rainwater in June 1995 and ambient concentrations of mercury in May1996.3 Holtrachem is upgrading machinery and processes. Mercury emissions from the stack are expected to be reducedto nondetectable levels by the end of 1999.4 Each point represents one 15-minute data point for atmospheric mercury concentration.5 Higher levels have been observed with at least one per month higher than 20-30 ng/m3. Highest level eventobserved was ~90-100 ng/m3. Data is lacking to determine the frequency of these higher level events.

$$$$$$$$ $$ $$ $$ $$$$ $
$$$$ $$$ $$ $ $$
$$ $$$ $$$$
$ $ $$$$$$$$$ $ $$$$$ $ $$$ $$$
$$ $$$ $$
$ $ $$ $$ $$$$$ $$ $$$ $$$$$ $$$ $ $$ $ $ $$ $$$ $$$ $ $$
$ $ $$$$
$$
$$ $$
$$$$
$
$
CAPE FEAR BASIN
LUMBER BASIN
YADKIN BASIN
Ë
715
34
2
Fayetteville
Lumberton
Whiteville
Boiling Spring Lakes
Wilmington
Pinehurst
Laurinburg
8
12
15
COLUMBUS
ROBESON
BLADEN
SAMPSON
DUPLIN
PENDER
CUMBERLANDHOKE
SCOTLAND
MOORE
RICHMOND
HARNETT
BRUNSWICK
NEW HANOVER
14
Lumber River
Cape Fear River
Lake Waccamaw
South Carolina
13
9
ONSLOW
JONES
6
11
10
40 0 40 Miles
N
EW
S
Figure 9. Locations of Local Stack Emissions, 1996 Inventory(Numbered sources emit greater than 10 lbs/yr of mercury)
Ë MDN site
County bdry
Municipality
Hydrography
River basin bdry
$ Atm. point sources

0:00
2:00
4:00
6:008:00
10:0012:00
14:0016:00
18:0020:00
22:00
5/2/985/6/98
5/10/98
5/14/98
5/18/98
5/22/98
5/26/98
0
5
10
15
20
25
0
5
10
15
20
25
Time o
f Day
Hg conc.ng/m 3
Figure 10. Atmospheric Mercury Concentrations at Waccamaw State Park, May 1998
page 21

0
45
90
135
180
225
270
315
0
5
5
10
10
15
15
20
20
25
25
North
Hg
conc
. (ng
/m3 )
Figure 11. Wind Direction during Mercury Events at Waccamaw State Park, May 1998
page 22

page 23
the east and northeast (70 to 90-degree vectors). Atypical events have been observed from otherdirections but not with the frequency of ones from the east and northeast, though the prevailingwinds are primarily from the southwest. Wilmington and Holtrachem Manufacturing Companyare situated at approximately 90 and 75 degrees, respectively, from Waccamaw State Park.These representations of mercury concentrations in the atmosphere illustrate the influence ofboth globally transported mercury as well as an apparent local effect, likely from sources locatedeast and northeast of the park. However, it is premature to directly relate atmosphericfluctuations of elemental mercury to wet and dry deposition. More information and measureddata regarding the forms of mercury at Waccamaw State Park are needed prior to making thisdistinction.
Table 5. Local Facilities with Estimated 1996 Mercury Stack Emissions Greater than 10 lbs/yearFigureID
FacilityID Facility Name Emissions (lbs/year) County, State
1 2400002 Holtrachem Manuf., CO., L.L.C. 1446.0 Columbus, NC2 6500263 New Hanover Waste-to-Energy
Facility325.20 New Hanover, NC
3 6500036 CP&L Sutton Plant 97.00 New Hanover, NC4 2400036 International Paper-Reigelwood 68.00 Columbus, NC5 1000013 E.I. Dupont Company 62.00 Brunswick, NC6 - Stone Container, Florence 40.00 Florence, SC7 6500055 Occidental Chemical Corp 30.52 New Hanover, NC8 2600102 Fort Bragg Military 22.50 Cumberland, NC9 2600014 Cape Fear Valley Med Center 20.00 Cumberland, NC10 - CP&L:Robinson 20.00 Darlington, SC11 - Santee Cooper:Grainger 20.00 Horry, SC12 8300048 Westpoint Stevens-Wagram 18.40 Scotland, NC13 7800087 Dyeing & Printing of Lumberton 15.00 Robeson, NC14 2600050 Kelly-Springfield Tire Co. 14.50 Cumberland, NC15 4300010 Swift Textiles Inc. Main Plant 12.79 Harnett, NC(a) Industry type based on primary reported SIC code.(b) Data pooled from 1995 and 1997 inventories (SCDHEC 1999). The SCDHEC database
contains emissions to 0.01 tons/year.
Wet deposition data from Waccamaw State Park have been collected since 1995 as part of theMercury Deposition Network. As per the QA plans for the MDN, a total rainwater sample for aone-week period is collected on a weekly basis. This sample and additional rainfall monitoringhardcopy data are sent to a contract lab for analysis. The results are then relayed to a centralMDN database for dissemination via quarterly reports back to the participating site coordinatorsand eventually to the MDN website (http://nadp.sws.uiuc.edu/mdn). A summary of mercuryconcentrations in rainwater and wet deposition data from January through December 1996 isshown in Figure 12. The mercury concentration in rainwater averaged approximately 12 ng/L6.The total wet deposition for 1996 was 12,700 ng/m2 (12.7 µg/m2). Figure 12 showsconsiderable evidence that a major source of mercury input to the Lumber and Waccamaw River 6 This average mercury concentration in rainwater is equal to the water quality standard forambient surface waters of North Carolina.

Figure 12. 1996 Waccamaw State Park Wet Deposition Data
0
500
1000
1500
2000
2500
3000
1/1/96 2/20/96 4/10/96 5/30/96 7/19/96 9/7/96 10/27/96 12/16/96
Date
Mer
cury
Dep
ositi
on, n
g/m
2
0
10
20
30
40
50
60
1/1/96 2/20/96 4/10/96 5/30/96 7/19/96 9/7/96 10/27/96 12/16/96
Date
Mer
cury
con
cent
ratio
n, n
g/L
page 24

page 25
Basins is atmospheric deposition. Additionally, Figures 10 and 11 provide suggestive evidenceof a local source influence on atmospheric mercury vapor levels. Measured wet deposition ratesand precipitation concentrations of mercury are consistently higher in this area than at a similarsampling site in northeastern North Carolina located at Pettigrew State Park (DAQ, personalcommunication). Whether the fluctuations in atmospheric elemental mercury vapor are in someway contributing to this pattern of elevated deposition still needs to be determined.
Dry deposition is not measured at either MDN site. Mercury that is deposited during dryweather is generally in the particulate phase, although recent literature indicates that reactivegaseous mercury (RGM) may also be deposited during dry weather. According to Lindberg etal. (1999), recent data from forests in Tennessee, Vermont, and Sweden suggest that drydeposition of mercury may exceed wet deposition by as much as a factor of two. In studiesLindberg et al. (1999) are conducting in the Florida Everglades, initial estimates of drydeposition during a typical March suggest that dry inputs of Hg will exceed wet. Thus, all of theabove estimates of deposition may account for less than one-half of the total mercury depositionoccurring at Lake Waccamaw.
USEPA- Office of Air Quality Planning and Standards (OAQPS) performed screening leveldispersion and deposition modeling of mercury in the upper Waccamaw River Basin (EPA1998). The refined gaussian plume model, ISCST3, was used to perform the analysis. DAQprovided USEPA with a database of atmospheric mercury emissions that was used to develop thedispersion and deposition model. Emissions within 50 km of Lake Waccamaw were used in themodel7; non-permitted sources and emissions outside the 50 km radius were not included. Themodeling suggests that approximately 85% of the deposition predicted at the center of LakeWaccamaw is due to emissions from the Holtrachem facility. The highest deposition rates werepredicted to be in the northeast corner of the grid, closest to the Holtrachem facility, and within aportion the lake. The spatial variability of wet deposition is evident when the isopleths areplotted over a map of the area. For example, within Lake Waccamaw the model predicteddeposition rates from 60 to 140 µg/m2-year of divalent mercury deposition depending upon thelocation within the lake (Figure 13). A copy of the report is available in Appendix B. Thedivergent results of the model with the 1996 field data may be due to a number of reasons.These include the time frame considered (i.e., data is from 1996 and model is for 1991), thechemical speciation used in the model, and uncertain emissions estimates.
Waste sites. The North Carolina Division of Waste Management (DWM) maintains a databaseof inactive hazardous waste sites for the entire state and is currently working on electronic mapsof these sites. Potential waste site sources of mercury were screened from the DWM databasefor Hoke, Moore, Scotland, Robeson, Bladen, Columbus, and Brunswick counties. Of the sitesevaluated, only one site, the West Point Pepperell site (NCD045924032), identified mercury as acontaminant. Mercury was found above state and federal MCLs in groundwater at the WestPoint Pepperell site in Lumberton (Robeson County). However, these samples were collected ata time when clean techniques were not always observed, thus mercury samples may have beencontaminated. This site is not believed to be a significant contributor of mercury to surfacewaters via groundwater.
7 Fifty kilometers is the maximum recommended range for the ISCST3 model.

page 27
Other sources. Mercury from the atmosphere may deposit on land or surface water. Thus, allsurface waters will receive mercury directly from the atmosphere. A secondary source ofmercury to surface waters comes from soil within the watershed. Mercury is naturally present insoils. Adriano (1987 as cited in Rule and Iwashchenko 1998) reported an arithmetic meanmercury concentration in soil of 0.112 mg/kg (912 samples), with geometric mean of 0.071mg/kg. However, mercury concentrations in soil increase in response to mercury depositingfrom the atmosphere. For example, Rule and Iwashchenko (1998) reported significantly elevatedlevels of mercury, up to an order of magnitude higher than background, in surface soils withintwo kilometers of a former chloralkali plant in Virginia. Mercury deposited on surface soil, aswell as mercury naturally present in soil, may be resuspended in runoff and transported to lakesand rivers. This indirect source of mercury may persist after atmospheric deposition of mercuryis reduced.
Quantification of Mercury Sources
NPDES and atmospheric releases of mercury have been identified for the Lumber andWaccamaw River Watersheds. Ultimately, the total mercury load from each of these types ofsources will be required to determine the best course of action to reduce mercury in the aquaticenvironment. For this analysis, the total load includes mercury from NPDES point sources,direct atmospheric deposition, and indirect mercury in overland runoff. Mercury from naturalsources and urban stormwater was not estimated. This analysis is intended to demonstrate therelative magnitude of mercury that may reach the surface water. The results of this analysis willnot be used to determine the load allocation portion of the TMDL.
The Waccamaw River Watershed was selected for the examination of total mercury loadsbecause the atmospheric monitor is located within this basin at Waccamaw State Park. Twolocations in the watershed were used to sum loads across media. The Lumber River was notincluded in this analysis because of the distance to the atmospheric monitor and the lack ofNPDES effluent mercury data. These are White Marsh at US74/76 and Waccamaw River atFreeland. In Figure 8, the Waccamaw River at Freeland is the most upstream ambient site in theWaccamaw River. White Marsh enters the Waccamaw River from the northwest, upstream ofthe station at Freeland. Air quality is highly variable, even within a few kilometers, soapplication of the air concentrations and wet deposition loads from Waccamaw State Park toareas even 5 kilometers from the park introduces a great deal of uncertainty. In fact, the airquality can vary greatly even within a small river watershed, such as the Waccamaw River Basinwithin North Carolina. However, in the absence of additional data, mercury deposition data atWaccamaw State Park were applied to the entire Waccamaw River Basin. The followingsections describe the calculation of loads for each source type.
NPDES Sources. The total annual load from point sources was determined for the only facilitywith an NPDES permit and mercury data in the Waccamaw River Basin, the Whiteville WWTP.Using 1996 and 1997 data from the discharge monitoring report (DMR), an average annual loadof mercury was calculated for the facility. The average load of 500 g/year was calculated usingone-half of the detection limit for non-detected concentrations. A summary of the DMR data arepresented in Appendix B.

page 28
Direct Atmospheric Deposition. Rainwater falling directly onto surface waters is anotherpathway for mercury to enter the aquatic system. By multiplying the 1996 annual deposition rateof 12.7 µg/m2 measured at the air monitoring site at Waccamaw State Park by the total surfacearea of the surface water body, an estimate of direct atmospheric deposition to White Marsh andWaccamaw River was made. For the White Marsh system, direct deposition was assumed tooccur only on White Marsh. The segment of White Marsh upstream of US 74/76 has an averagelength of 28,800 meters and an average width of 9.7 meters as described in EPA’s Reach File 1.Multiplying these two dimensions, the surface area evaluated is equal to 2.8x10⁵ square meters.The product of the surface area and the average annual deposition rate is 4 g/year. This is theaverage annual direct deposition load to White Marsh at US 74/75.
A similar calculation was made for the Waccamaw River at Freeland. The surface area wasdetermined based on field measurements of the River. The Waccamaw River from the dam atLake Waccamaw to the NC-SC State line is approximately 46 miles long. Below the dam theriver is 12 to 14 meters wide; further downstream at NC 94 the river is approximately 30 meterswide. If the entire river receives atmospheric mercury from wet deposition at a rate of 12.7µg/m2-year, the total annual mercury load from direct deposition could be on the order of 20g/year. However, the Waccamaw River at Freeland receives significant amounts of water fromtributaries other than the Waccamaw River, including White Marsh, Lake Waccamaw (which isabove the Waccamaw River), and Juniper Creek. The total surface area of these two majortributaries and the lake was used to calculate additional mercury loads due to direct atmosphericdeposition. The surface areas of the tributaries and the estimated direct deposition loads arepresented in Table 6.
Table 6. Estimate of Direct Deposition Loads to the Waccamaw River at FreelandStream/Lake Surface Area (m2) Deposition Load (g/year)White Marsh (a) 5.4x10⁵ 7Lake Waccamaw 3.6x10⁷ 460Juniper Creek 1.7x10⁵ 2Waccamaw River 1.6x10⁶ 20Total 489( ~500)(a) The surface area presented for White Marsh extends beyond US 74/76 to the mouth of thestream. When the entire stream surface area to the mouth is considered, the deposition is seveng/year.
Indirect Mercury in Runoff. The last pathway quantified is the mercury load in overland stormflow or runoff. The method used to calculate mercury loads in runoff is simplistic and assumesthat all of the mercury in precipitation remains dissolved in water and does not partition to soil,plants, or sediment, or volatilize, prior to reaching the marsh. This method will overestimate thetotal amount of mercury reaching the marsh and is intended only as a screening method to helpunderstand the relative magnitudes of mercury sources in the Waccamaw River Watershed.
For dissolved chemicals, Mills et al. (1985) presented two separate equations to determine thedissolved load, as follows:
QCLD d **1.0=

page 29
andDALDWld *=
where,Wld = annual watershed dissolved pollutant load (kg/yr),LD = dissolved loading function (kg/ha),0.1 = conversion factor,Cd = concentration of dissolved pollutant in runoff (mg/L),Q = annual average runoff from source area (cm), andDA = drainage area (ha).
Combining these equations and calculating new conversion factors, the following equationdetermines dissolved mercury loads in runoff:
XDAQCWld d ***=
where,Wld = annual dissolved mercury load to water body (g/year),Cd = concentration of dissolved mercury in runoff (ng/L),Q = annual average runoff from source area (cm),DA = drainage area (m2), andX = conversion factor = 0.0259 (L-g/ng-cm-m2)
For this estimate of the dissolved loading factor, the concentration of dissolved mercury in runoffwas assumed to equal the concentration of mercury in rainwater; in 1996 the average mercuryconcentration in rainwater was 12 ng/L. Runoff estimates and drainage areas are available frommany of the USGS gauging stations in the area. For the Waccamaw River near Freeland, theaverage annual runoff as reported in 1996 was 14.18 inches (36 cm) with a drainage area of 680square miles (USGS 1996). There is no USGS gage at White Marsh, however the averageannual runoff in the area ranged from 12.58 inches (32 cm) at Big Swamp near Tarheel to 18.78inches (48 cm) at Drowning Creek near Hoffman. A mean runoff rate of 15.2 inches (38.6 cm)was used for White Marsh. Although there is no gage at White Marsh, USGS estimates thedrainage area for White Marsh at US 74/76 to be 201 square miles. The indirect runoff mercuryloads were determined to be 2,500 g/year at White Marsh and 7,700 g/year at Waccamaw Rivernear Freeland.
Total Loads. In summary, the estimated total mercury loads to White Marsh at US 74/76 andWaccamaw River near Freeland were determined as the sum of the point source loads, the directdeposition loads, and the indirect runoff loads. The total loads are presented in Table 7.

page 30
Table 7. Summary of Estimated Mercury Loads to White Marsh and Waccamaw River (a)End locations
Source White Marsh at US 74/76Waccamaw River near
FreelandNPDES point sources 500 500Direct atmospheric deposition 4 500Indirect runoff 2,500 7,700Total ~3,000 ~9,000(a) Loads reported in g/year.
These estimates of mercury loads to the river are simplistic. The methods to calculateatmospheric related loads assume that rainfall in 1996 is typical, on a weekly basis, and that drydeposition does not occur8. Additionally, measurements of wet deposition at the WaccamawState Park are not representative of what may occur further downstream on the Waccamaw Riveror in the Lumber River Watershed.
8 In fact, 1996 is not a “typical” year since two hurricanes, Bertha and Fran, made landfall on the North Carolinacoast, bringing a significant amount of rain.

page 31
ESTIMATES OF MAXIMUM ALLOWABLE MERCURY LOADS
Currently, the most sophisticated and comprehensive model of mercury cycling in the aquaticenvironment is the Mercury Cycling Model (MCM) developed by the Electric Power ResearchInstitute (EPRI) and Tetra Tech. “The MCM mechanistically simulates the transport andtransformations of mercury in natural waters based on the concept that aqueous chemicalspeciation governs the rates of these processes.” (Hudson et al. 1994) This model requires largeamounts of site-specific data to run and calibrate and has been successfully applied in a study ofWisconsin lakes. MCM was originally developed for lakes and impoundments, thus modelingriverine systems is not an option with this model9. MCM was not used to evaluate Pages, Pit andWatson lakes for several reasons, including the large amount of multimedia data required to runand calibrate the model, the limited usefulness of the model results, and the lack of measuredmercury levels in the lakes. There is currently strong evidence identifying atmosphericdeposition as a significant source of mercury in the surface water systems. Ambient monitoringdata have demonstrated mercury concentrations in fish tissue in all levels of the aquatic food weband mercury has been detected in surface water only sporadically. While the MCM model wouldclarify mercury cycling in the lake systems, it would offer little towards load allocation since theprimary source is atmospheric.
A simple mass balance equation was used to calculate the maximum daily load associated withan instream flow and target concentration. This equation is as follows:
QWC =
whereC = instream concentration of pollutant,W = total allowable load of pollutant to the waterbody, andQ = flow rate in waterbody.
There are many assumptions inherent in this simplistic equation. A major assumption is that thestream is at steady state; this implies that conditions in the stream are not changing with time.Additionally, this approach assumes that pollutants entering the waterbody remain suspended inthe water column and do not deposit to sediment. While many metals dissolve readily in water,some forms of metals adhere to small particles floating in the water or larger particles depositingto the bottom of the waterbody. Losses of metals due to sedimentation are not considered usingthe above equation. Lastly, a select number of metals, including mercury, may exist in formsthat could volatilize to the atmosphere. This loss of mercury also was not considered. Theallowable load determined from the above equation is, therefore, a conservative estimate of themercury load that may be assimilated by the water body.
To determine the maximum daily mercury load, a target instream concentration (C) equal toNorth Carolina’s current mercury standard of 0.012 µg/L was used. This standard was derived
9 EPA is currently modifying MCM for the Florida Everglades. When this model is calibratedand made publicly available it may provide additional pertinent information about mercurycycling in the Lumber and Waccamaw Watersheds.

page 32
from the lowest of three toxicological values, the Final Chronic Value (aquatic life based), FinalPlant Value, and the Final Residue Value (fish tissue based). For mercury, the Final ResidueValue (0.012 µg/L) is the lowest of the three values (EPA 1985). To determine the FinalResidue Value, the FDA fish tissue action level of 1 mg/kg is divided by the bioconcentrationfactor (BCF) for the chemical. The BCF is one measure of the accumulation of a chemical inbiota. In this case, a BCF is calculated by dividing the chemical concentration in fish by thechemical concentration in water. EPA (1985) cites bioconcentration factors ranging from 1,800to 81,700 L/kg as a weighted average depending on the method of calculation and reference. Abioconcentration factor of 81,700 L/kg, based on the uptake of organic mercury by fatheadminnows (Pimephales promelas), was used to determine the Final Residue Value.
Typically, maximum daily loads for non-carcinogenic substances are developed using acharacteristic low flow such as the 7-day, 10-year low flow (7Q10) (15A NCAC 23 .0206).Average, 30Q2 and 7Q10 flows have historically been obtained from USGS for numerous streamlocations throughout North Carolina. A summary of the allowable daily maximum mercuryloads under average, 30Q2 and 7Q10 flows is shown in Table 8. Annual loads were determinedby multiplying the mercury load based on an average flow by 365 days. In general, theallowable maximum annual mercury load for any of these waters ranged from 0 to 2 kg/year.
Data for the three lakes, Pit Lake, Pages Lake, and Watson Lake, are less readily available. PitLinks and Watson Lakes are private lakes that were sampled to support the Lumber basinwidefish consumption advisory. DWQ has no further physical, biological, or chemical informationon either lake. Pages Lake has a surface area of 40 acres with a maximum depth of four meters.The lake is currently drained while repairs are made to the dam. USGS estimated an averageflow from the Aberdeen Creek dam on Pages Lake as 17 cfs and a summer 7Q10 of 4.3 cfs.Using the same relationship shown above, an allowable mercury load of 200 g/year wasdetermined.
Seasonality
Maximum allowable loads vary based on the season. During the late summer flows in theLumber and Waccamaw River watersheds are typically much lower than average flows. This isshown in Table 8 by the 7Q10 summer and winter flows, which vary by season. Thus, themaximum allowable mercury load would also vary based on the flow rates. Table 8 also showscalculations of the daily loads based on average flows, and then based on summer and winter lowflows. The summer critical conditions are when controls are most important, particularly in themore swampy areas where materials are not continually flushed from the system.
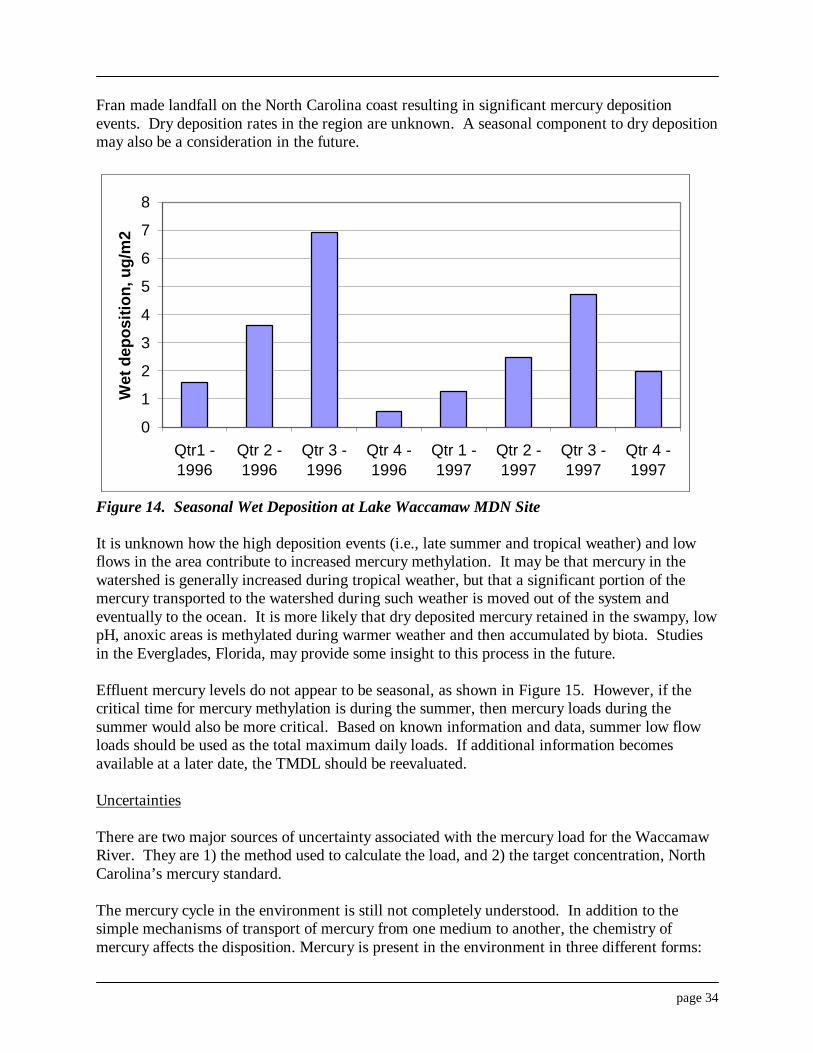
Seasonal considerations are also important with respect to the mercury cycle and the apparentseasonality of atmospheric loads. Mercury methylation generally occurs at warmer temperaturesthat would likely occur in the summer and early fall. This coincides with low flows. Whenmercury is deposited in swampy areas, mercury can be methylated and bioconcentrated in fish.When it rains, methylated mercury can move out of the swamps and into the rivers where it isavailable to other biota. As shown in Figure 14, the wet deposition of mercury appears to behighest in the summer (July-September). Tropical weather systems, bringing significantrainfall, typically occur during this period. In fact, in the summer of 1996 Hurricanes Bertha and

Table 8. Estimated Maximum Allowable Mercury Loads to Lumber and Waccamaw Watershed Impaired StreamsFlows, cfs Estimated Mercury Loads, g/day Average
Water Body & location Station Average 30Q2Summer
7Q10Winter 7Q10
Average Flow 30Q2
Summer 7Q10
Winter 7Q10
Load, g (a)
Drowning Cr nr Hoffman 02133500 253 98 43.2 98.2 7 2.9 1.3 2.9 3000Big Swp nr TarHeel 02134480 212 0.5 6 NA 0.0 NA 3000Porter Swp at Mth at Fair Bluff, NC 0213451860 100 10 1.1 8.3 3 0.3 0.0 0.2 2000Pages Lake (Aberdeen Creek at dam) 0213350700 17 9.6 4.3 9.7 0.5 0.3 0.1 0.3 200Lumber R nr Maxton 02133624 430 92 12.6 NA 2.7 NA 5000Lumber R at Boardman 02134500 1310 340 123 255 38.5 10.0 3.6 7.5 15000Ashpole Swamp (b) NA 96 14 2.8 NA 0.4 NA 2000Big Creek upstream of mouth NA 0 NA NA 0.0 NA NAWhite Marsh Swp at US 74/76 nr Whiteville0210910400 201 10 4.7 9.1 5.9 0.3 0.1 0.3 3000Waccamaw R @ Freeland 02109500 710 0.7 20.8 NA 0.0 NA 8000Waccamaw R bl NC 905 nr Pireway, NC 0211005650 980 48 2 6 28.8 1.4 0.1 0.2 11000
(a) Average load determined by multiplying the estimated mercury load under average flow conditions by 365 days.(b) Flow obtained from Reach File 1 (RF1), not USGS.
river & lake mass loads, V2, 10/28/99
page 34
Fran made landfall on the North Carolina coast resulting in significant mercury depositionevents. Dry deposition rates in the region are unknown. A seasonal component to dry depositionmay also be a consideration in the future.
Figure 14. Seasonal Wet Deposition at Lake Waccamaw MDN Site
It is unknown how the high deposition events (i.e., late summer and tropical weather) and lowflows in the area contribute to increased mercury methylation. It may be that mercury in thewatershed is generally increased during tropical weather, but that a significant portion of themercury transported to the watershed during such weather is moved out of the system andeventually to the ocean. It is more likely that dry deposited mercury retained in the swampy, lowpH, anoxic areas is methylated during warmer weather and then accumulated by biota. Studiesin the Everglades, Florida, may provide some insight to this process in the future.
Effluent mercury levels do not appear to be seasonal, as shown in Figure 15. However, if thecritical time for mercury methylation is during the summer, then mercury loads during thesummer would also be more critical. Based on known information and data, summer low flowloads should be used as the total maximum daily loads. If additional information becomesavailable at a later date, the TMDL should be reevaluated.
Uncertainties
There are two major sources of uncertainty associated with the mercury load for the WaccamawRiver. They are 1) the method used to calculate the load, and 2) the target concentration, NorthCarolina’s mercury standard.
The mercury cycle in the environment is still not completely understood. In addition to thesimple mechanisms of transport of mercury from one medium to another, the chemistry ofmercury affects the disposition. Mercury is present in the environment in three different forms:
0
1
2
3
4
5
6
7
8
Qtr1 -1996
Qtr 2 -1996
Qtr 3 -1996
Qtr 4 -1996
Qtr 1 -1997
Qtr 2 -1997
Qtr 3 -1997
Qtr 4 -1997
Wet
dep
ositi
on, u
g/m
2

page 35
Figure 15. Seasonal NPDES Loads
metallic, organic, and inorganic. Organic mercury includes methylmercury, which is the form ofgreatest concern.
Generally, mercury is not in an organic form when it enters the aquatic environment, butundergoes a transformation from inorganic mercury to organic or methylmercury in either thewater column or sediment. Mercury present in inorganic or metallic forms is not accumulated toa significant degree by biota (EPA 1997b), and may remain in the water column. Alternatively,under the correct environmental conditions, mercury may transform to methylmercury andaccumulate in the bodies of invertebrates and fish. Nearly 100% of the mercury that accumulatesin fish is methylated (EPA 1997b). The properties of methylmercury allow the accumulatedchemical to be transferred up the food chain. Therefore, each level of the food web accumulatesmercury from its diet and passes the burden along to animals in higher levels of the food chain(EPA 1994). Top consumers in the food web may accumulate methylmercury at levels millionsof times greater than the concentrations present in surface waters (EPA 1994).
Mathematical models of mercury in the environment are still in the testing phases. Due to thecomplexities of the mercury cycle and the state of science regarding measurement of mercury inenvironmental media, models that have been developed are not easily calibrated or verified (e.g.,EPRI’s Mercury Cycling Model). However, if the TMDL requires reevaluation in the future,such models will be considered for use if chemical techniques have improved and more data isavailable. Thus, a simple mass balance model was used to estimate the maximum potential load
0.00
0.50
1.00
1.50
2.00
2.50
3.00
3.50
4.00
Qtr 11996
Qtr 21996
Qtr 31996
Qtr 41996
Qtr 11997
Qtr 21997
Qtr 31997
Qtr 41997
Avg
load
(g/d
ay)
Red Springs WWTP Whiteville WWTP Laur-Maxton Apt WWTP

page 36
to the Waccamaw River. This model does not account for the various forms of mercury, nordoes it account for the uptake into fish. That portion of the calculation is assumed within thetarget concentration, the mercury standard (discussed below). The mass balance technique usedabove is conservative in that a 7-day 10-year low flow (7Q10) was used to derive the target load.The theoretical margin-of-safety associated with the TMDL is primarily due to the use of thesummer 7Q10 to derive loads.
The target concentration used to develop the mercury load is based upon the USEPA AmbientWater Quality Criteria (AWQC) for mercury. It has been assumed that the attainment of theinstream water quality criteria, North Carolina’s mercury standard, will result in acceptable fishtissue levels. However, there is some question regarding the ability of this standard to accountfor mercury levels in fish and, thus, adequately protect aquatic life and human health. Forexample, Eisler (1987) notes that EPA’s recommended mercury criteria for the protection offreshwater aquatic life of 0.012 µg/L offers only limited protection to freshwater ecosystems.Zillioux et al. (1993) offers a more detailed explanation of the BCF used to derive the waterquality standard. According to Zillioux et al. (1993), recent improvements have been made insample collection, handling, and processing that have resulted in better and more accuratemeasurements of mercury in water. These new improvements have resulted in new BCFestimates for methylmercury generally exceeding 1 million, in comparison to the 81,700 BCFdiscussed above and used to develop the AWQC. However, Lindqvist et al. (1991) highlightsthe importance of the food web as the main mercury intake vehicle, not water. Thus, abioaccumulation factor (BAF) may be more suitable than a BCF since a BAF accounts foruptake from food and filtering, as well as water. The use of a BAF would lower the instreamstandard significantly below the current standard of 0.012 µg/L.
Margin of Safety
An additional margin of safety may be applied to the TMDL. The method used to calculate theallowable load is inherently conservative and normally includes a margin of safety due to theconservative nature of the calculation. Additionally, the use of the 7Q10 flow also increases themargin of safety. However, the complexity of the fate and transport of mercury as well as thegeneration of methylmercury contribute significantly to the uncertainty of the TMDL. Althoughthe water quality standard and TMDL are written in terms of total mercury, the ultimate goal isthe reduction of mercury in fish. Methylmercury levels are more significant to mercuryconcentrations in fish. Ideally, a ratio of total mercury to methylmercury could be used as abasis for the margin of safety. However, in the absence of such a ratio, an uncertainty factor of10 was applied to the summer 7Q10 concentrations to develop the TMDL. The use of thisuncertainty factor results in a margin of safety of 90 percent.
There are many data gaps associated with mercury in the Lumber River Basin, thus a simplifiedmethod of determining the TMDLs was used. The DWQ will update the TMDL when betterinformation is available. There is an inherent margin of safety in using a phased approach. Aschedule outlining tasks for the second phase of the TMDL is included in Appendix E.
page 37
WASTE LOAD AND LOAD ALLOCATIONS
Maximum allowable mercury loads equal to the load during summer 7Q10 conditions werecalculated for a variety of waters in the Lumber and Waccamaw River Watersheds; these loadsranged from 0.02 to 6 g/day, as shown in Table 9. These maximum allowable mercury loads aresignificantly less than the estimated mercury loads in the Waccamaw River watershed of 3,000to 9,000 g/year of mercury.
Monitoring by the Division of Air Quality suggests that atmospheric mercury concentrations atWaccamaw State Park can be interpreted from both a global pool and local sources of mercury.However, it is impossible to estimate the mercury load due to local atmospheric sources withoutthe use of a regional air dispersion and deposition model that considers the input from within andoutside the local airshed. EPA is currently developing a regional air quality model for mercurythat encompasses the entire United States. Multiple scenarios are being evaluated using theregional air quality model, including the effects of various emissions reductions. The MercuryReport to Congress (EPA 1997b) lists initiatives under the Clean Air Act that may reduceatmospheric mercury emissions from industrial sources. Currently the most significant of theseinitiatives is the promulgation of emission limits for municipal waste combustors and medicalwaste incinerators. Other initiatives involve further study of controls on various industries. Theresults of this model and the emissions reduction scenarios are anticipated to be available withinthe next year. The results of base case and reduction scenarios will be incorporated into thePhase II TMDL. Modeling results may indicate that a significant portion of the mercury load tothe Lumber and Waccamaw River watersheds is not due to local sources. In this case, EPAwould be needed to assist in mercury emissions reductions across state boundaries.
The State of North Carolina alone cannot eliminate the atmospheric deposition of mercury oversurface waters. Actions for reducing the global pool of atmospheric mercury need to bedeveloped at the national and international levels in order to be effective. However, some localsources of atmospheric mercury are in and surrounding the Lumber and Waccamaw RiverWatersheds. As previously stated, the Holtrachem facility, which was the largest emitter in theregion, is changing to a process that will reduce mercury emissions to negligible levels. Otherfacilities should also be encouraged to reduce mercury emissions, particularly those facilitieslisted in Appendix A that have the highest level of emissions.
Current and future NPDES point sources in the Lumber and Waccamaw River Watershedsshould not be allowed to increase the total mercury already present in the system. Therefore, lessthan detectable (based on North Carolina’s currently accepted measurement standards) mercurylevels in point source discharges to the systems should be allowed until the TMDL is revised.During this permit cycle, limits will be issued to facilities that have detected mercury in effluentin recent years. Other facilities may be asked to monitor effluent for mercury. Table 9 indicatesthat forty percent of the calculated loads have been allocated to point sources. The remainingallowable load (i.e., 60%) would be allocated to nonpoint sources, including atmosphericdeposition and runoff. The allocation ratio may change depending upon implementation issuesin Phase II. Proposals for Phase II can be found in Appendix E.

Table 9. Initial Mercury Allocations to Lumber and Waccamaw Watershed Impaired Streams
Water Body & location StationTMDL (a)
(g/day)
Waste Load Allocation
(%)Waste Load
(g/day)
Load Allocation
(%)Load
(g/day)Drowning Cr nr Hoffman 02133500 0.1 40% 0.04 60% 0.06Big Swp nr TarHeel 02134480 0.001 40% 0.0004 60% 0.001Porter Swp at Mth at Fair Bluff, NC 0213451860 0.003 40% 0.001 60% 0.002Pages Lake (Aberdeen Creek at dam) 0213350700 0.01 40% 0.004 60% 0.01Lumber R nr Maxton 02133624 0.3 40% 0.1 60% 0.2Lumber R at Boardman (b) 02134500 0.4 40% 0.2 60% 0.2Ashpole Swamp NA 0.04 40% 0.02 60% 0.02Big Creek upstream of mouth NA 0.00 40% 0.0 60% 0.000White Marsh Swp at US 74/76 nr Whiteville ( c) 0210910400 0.01 40% 0.004 60% 0.01Waccamaw R @ Freeland 02109500 0.002 40% 0.001 60% 0.001Waccamaw R bl NC 905 nr Pireway, NC 0211005650 0.01 40% 0.004 60% 0.006
(a) TMDL is equal to one-tenth of the maximum daily allowable load for summer 7Q10 conditions.(b) The Red Springs WWTP discharge to Raft Swamp enters the Lumber River above this station.(c) The Whiteville WWTP discharge enters above this station.

page 39
SUMMARY
A basinwide fish consumption advisory was issued in 1994 after mean concentrations of mercuryin largemouth bass and bowfin from multiple locations were generally greater than the Food andDrug Administration (FDA)/North Carolina action level for mercury of 1 mg/kg. The fishconsumption advisories are the problem that necessitated placing waters on North Carolina’s303(d) list.
In Phase I of the TMDL document, a dilution equation (i.e., mass balance) was used to determinethe maximum allowable loads for each water body. Based on these TMDLs, allocations weremade to NPDES and atmospheric deposition/nonpoint sources. Generally, NPDES dischargerswill not be allowed to increase the mercury pool to the system. The majority of the allocationwas given to atmospheric deposition/nonpoint sources. Even with the restrictions on NPDESpoint sources and atmospheric emission sources, mercury levels in Lumber and WaccamawRiver fish are not likely to change appreciably over the next several years. A significant amountof mercury is likely present in sediment and soils in the Lumber and Waccamaw River Basins,providing a continued source of mercury to the water column and fish. Thus, after national andinternational reductions in mercury emissions have been realized, mean mercury levels in fishtissue may take many subsequent years to fall below the FDA/NC criteria. Monitoring of thewater column and fish tissue will continue to be performed to quantify reductions of mercury inthe aquatic environment. Efforts should be made to educate the public in and around the Lumberand Waccamaw River watersheds with regards to mercury pollution.
The Phase I TMDL was publicly noticed with the Lumber River Basin Plan in Early 1999.Comments were accepted until March of 1999. Copies of the notice and comments received areprovided in Appendix D. Phase II of the TMDL will incorporate regional air quality modelingresults from EPA Office of Air Quality Planning and Standards and provide a more detailedmercury cycling model for a portion of the Waccamaw River Watershed. Phase II of the TMDLwill also include implementation programs for atmospheric and NPDES mercury reductions, asdescribed in Appendix E.
page 40
REFERENCES
Adriano, D. 1987. Trace elements in the terrestrial environment. Springer-Verlag, New York
Björnberg, A., L. Håkanson, and K. Lundbergh. 1988. A Theory on the Mechanisms Regulatingthe Bioavailability of Mercury in Natural Waters. Environmental Pollution 49:53-61
Bloom, N., Watrax, C., and J. Hurley. 1991. Impact of Acidification of the MethylmercuryCycle of Remote Seepage Lakes. Water, Air, and Soil Pollution. 56:477-491
Eisler, R. 1987. Mercury Hazards to Fish, Wildlife, and Invertebrates: A Synoptic Review.U.S. Department of the Interior, Fish and Wildlife Service, Biological Report 85(1.10). 90 pp.
Gilmour, C. 1995. Mercury Methylation in Fresh Waters. National Forum on Mercury in Fish:Proceedings. USEPA Office of Water. EPA823-R-002. June
Hudson, R. J., S. Gherini, C. Watras, and D. Porcella. 1994. Modeling the BiogeochemicalCycle of Mercury in Lakes: The Mercury Cycling Model (MCM) and its Application to the MTLStudy Lakes. In Mercury Pollution: Integration and Synthesis. Watras, C. and Huckabee, J.,Eds., Lewis Publishers, Chelsea, MI
Lindberg, S.E., W. Stratton, H. Zhang, and K. Roy. 1999. Preliminary Data Summary Report.FEDDS 99 Winter Campaign (Florida Everglades Dry Deposition Study). Summary of ORNLField Studies in Collaboration with UMAQL, Florida DEP, and USEPA. Oak Ridge NationalLaboratory.
Lindqvist, O., K. Johansson, M. Aastrup, A. Andersson, L. Bringmark, G. Hovsenius, L.Håkanson, Å. Iverfeldt, M. Meili, and B. Timm. 1991. Mercury in the Swedish Environment —recent research on causes, consequences and corrective methods. Water, Air, & Soil Pollution.55:i-261
Mills, W., D. Porcella, M.J. Ungs, S. Gherini, K. Summers, L. Mok, G. Rupp, and G. Bowie.1985. Water Quality Assessment: A Screening Procedure for Toxic and Conventional Pollutantsin Surface and Ground Water. Part 1. EPA 600/6-85/002a. September. U.S. EnvironmentalProtection Agency, Environmental Research Laboratory. Athens, GA
North Carolina Division of Environmental Management (NCDEM). 1982. As Assessment ofMercury in North Carolina. Prepared by the Water Quality Section.
North Carolina Department of Environment, Health, and Natural Resources (NCDEHNR).1994. Lumber River Basinwide Water Quality Management Plan. Prepared by the Division ofEnvironmental Management, Water Quality Section.
Rule, J.H. and M.S. Iwashchenko. 1998. Mercury Concentrations in Soils Adjacent to a FormerChlor-Alkali Plant. J. Environ. Qual 27:31-37

page 41
South Carolina Department of Health and Environmental Control (SCDHEC). 1999. Personalcommunication with Scott Reynolds, Bureau of Air. September 29, 1999
U.S. Environmental Protection Agency (EPA). 1985. Ambient Water Quality Criteria forMercury – 1984. EPA 440/5-84-026
U.S. Environmental Protection Agency (EPA). 1991. Guidance for Water Quality-BasedDecisions: The TMDL Process. Assessment and Watershed Protection Division, Washington,DC
U.S. Environmental Protection Agency (EPA). 1994. Deposition of Air Pollutants to the GreatWaters. First Report to Congress. EPA-453/R-93-055. May. Office of Air Quality Planningand Standards, Research Triangle Park, NC
U.S. Environmental Protection Agency (EPA). 1995a. Great Lakes Water Quality InitiativeCriteria Documents for the Protection of Wildlife. DDT, Mercury, 2,3,7,8-TCDD, PCBs. EPA820-B-95-008. March. Office of Water, Washington, D.C.
U.S. Environmental Protection Agency (EPA). 1995b. Great Lakes Water Quality InitiativeTechnical Support Document for the Procedure to Determine Bioaccumulation Factors. EPA-820-B-95-005. March. Office of Water, Washington, D.C.
U.S. Environmental Protection Agency (EPA). 1997a. Mercury Study Report to Congress.Volume I: Executive Summary. EPA-452/R-97-003. December. Office of Air QualityPlanning and Standards and Office of Research and Development, Research Triangle Park, NC
U.S. Environmental Protection Agency (EPA). 1997b. Mercury Study Report to Congress.Volume III: Fate and Transport of Mercury in the Environment. EPA-452/R-97-005. December.Office of Air Quality Planning and Standards and Office of Research and Development,Research Triangle Park, NC
U.S. Environmental Protection Agency (EPA). 1998. Preliminary Dispersion ModelingAnalysis of Local Mercury sources in the Lake Waccamaw Vicinity. Office of Air QualityPlanning and Standards. Research Triangle Park, NC.
U.S. Environmental Protection Agency, Federal Advisory Committee (FACA). 1998. Draft finalTMDL Federal Advisory Committee Report. 4/24/98
U.S. Geological Survey (USGS). 1996. Water Resources Data for North Carolina. Water Year1996. Volume 1. Surface Water Records. Report NC-96-1
U.S. Geological Survey (USGS). 1998. Personal communication with Curtis Weaver, USGS,February 18, 1998.

page 42
Winfrey, M and J. Rudd. 1990. Review. Environmental Factors Affecting the Formation ofMethylmercury in Low pH Lakes. Environ Toxic. and Chem. 9:853-869
Zillioux, E.J., D.B. Porcella, and J.M. Benoit. 1993. Mercury Cycling and Effects in FreshwaterWetland Ecosystems. Environmental Toxicology and Chemistry. 12(12):2245-2264