tmw september 2010 issue
TRANSCRIPT

T H E M A G A Z I N E F O R Q U A L I T Y I N E L E C T R O N I C S
A CANON COMMUNICATIONS LLC PUBLICATION
www.tmworld.com
September 2010
TEST IDEAS
Synchronize sensors and cameras
27SEMICONDUCTOR TEST
LED test
37TECH TRENDS
ATE workshop weighs functional test
17TECH TRENDS
Near infrared techniques find MEMS defects
19
Reliability manager ScotSolimine (left) and staff engineer Mike Brown of Luminus Devices,Billerica, MA.
Page 30
Engineers at Luminus Devices test high-brightness LEDs that illuminate stages, screens, stores, and streets.
Projecting the
LIGHT
TMW1009_001 1 9/9/10 4:53:19 PM

Get 10% off the dual-channel 33522Awww.agilent.com/find/Agilent33522A
Generate a most exacting output. You’re developing new technologies every day that are faster, more efficient and imaginative. Agilent 33500A Series function/arbitrary waveform generators provide your waveforms with the highest signal fidelity. With
10x better jitter than anything in its class you have unparalleled control of signal frequency. And new breakthrough technology provides an unprecedented ability to generate arbitrary waveforms. That’s confidence. That’s Agilent.
Go ahead: define your most exacting waveform.
© 2010 Agilent Technologies, Inc.
33521A and 33522A30 MHz sine, square, pulse bandwidth
250 MSa/s, 16-bit sampling
Point-by-point arbitrary waveforms
Dual-channel coupling and tracking
Agilent and our Distributor NetworkRight Instrument. Right Expertise. Delivered Right Now.
800-463-9275 www.newark.com/agilent
TMW1009_002 2 9/9/10 4:53:36 PM

Where Do I Go for Temperature Products?
© COPYRIGHT 2010 OMEGA ENGINEERING, INC. ALL RIGHTS RESERVED
Shop Online at For Sales and Service, Call TOLL FREE
Your single source for process measurement and control products!
Cover Art: Based on an Original Norman Rockwell Illustration ©1961 The Curtis Publishing Company.
omega.com, of Course!
HOT OFFTHE PRESS
HardboundHandbook andEncyclopedia
FREE!
Find thousands of temperature measurement and control productsin one place.Visit omega.com to reserve yourNew FREE copy of The Temperature HandbookTM and Encyclopedia7 th Edition
Thermal Imager with Ethernet Connection
OSXL-101$1990
Visit omega.com/osxl-101For Complete ProductDetails
Mounting stand features a ball-socket fitting for fullrange of motion.
Thermal image PC screen of 1 sensorconnected.
Alarm Screening
Thermal image PC screen of 4 sensors (maximum) connected.
Digital RTD Thermometer for Use with Remote Sensor
DTG-RTD100-M12-F $425
Visit omega.com/dtg-rtd100
**PATENT PENDINGCovered by U.S. and Internationalpatents and pending applications
**UWTC SeriesStarts at
$125
*PATENTED
Thermocoupleto Wireless Connector/Converter SystemThe Smart Connector TM
Visit omega.com/uwtc
HHB1800$1899
Wireless BorescopeVisitomega.com/hhb1800
Universal VerbalizerMultimeterOMEGASAYS®
*UV1000$239
Visit omega.com/uv1000
IndustrialFiber OpticInfraredTransmitter
Visit omega.com/os4000_series
OS4000 SeriesStarts at
$1495
OMEGAFILM®
Platinum RTD SensorsStarts at$1 Each
In Multiples of 100 Pieces
Visit omega.com/f1500_f2000_f4000
Visit omega.com/video
Visit omega.com/video
Visit omega.com/video
TMW1009_003 3 9/9/10 5:33:18 PM

TMW1009_004 4 9/9/10 4:53:41 PM

FEATURES
R E N E W Y O U R T & M W S U B S C R I P T I O N O N L I N E : W W W. G E T F R E E M A G . C O M / T M W
C O N T E N T S
SEPTEMBER 2010 5TEST & MEASUREMENT WORLD www.tmworld.com
37
30
27TEST IDEAS
Synchronize sensors and camerasTrigger circuits provide measurements and images at the right time.By Shih-Jie Chou, Rui-Cian Weng, and Tai-Shan Liao, National Applied Research Laboratories, Instrument Technology Research Center, HsinChu, Taiwan
INSTRUMENTS
Projecting the lightEngineers at Luminus Devices test high-brightness LEDs that illuminate stages, screens, stores, and streets.By Martin RoweSenior Technical Editor
SEMICONDUCTOR TEST
LED testAs markets for display backlighting and solid-state lighting grow, equipment vendors adapt to meet the needs of a rapidly changing industry.By Bryan Bolt, Cascade Microtech
TECH TRENDS 17 ATE workshop weighs
functional test
19 Near infrared techniques find MEMS defects
MECHATRONICS IN DESIGN 21 Isn’t there enough real inertia
around?
TEST DIGEST 23 Clever device logs
temperature
23 DFT remains EDA bright spot
24 EM simulation helps meet EMC specs
DEPARTMENTS 9 Editor’s note
11 Test voices
12 News briefs
15 Show highlights • IEEE International
Symposium on EMC
50 Product update
54 Viewpoint
8 Editorial staff
53 Business staff
TEST REPORT SUPPLEMENT45 PXI Test Report • PXI snags savings with HIL test • Care required when PXI serves medicine • AXIe stakes claim as PXI’s “big brother”
Test voices / Page 11
C O V E R B Y: A D R I E N B I S S O N
S E P T E M B E R 2 0 1 0V O L . 3 0 N O . 8
TMW1009_005 5 9/9/10 4:54:05 PM

6 SEPTEMBER 2010 www.tmworld.com TEST & MEASUREMENT WORLD
ONLINEwww.tmworld.comOnline now at
TMWorld.comCheck out these exclusive features on the Test & Measurement World Web site:
Taking MIMO RF test to the Nth degreeIn the first installment of a four-part series on technol-ogies that drive test innovation, Richard McDonell of National Instruments says that testing MIMO-based devices introduces several challenges for engineers, including the need to generate and analyze multiple RF streams in parallel and the need to understand spatial multiplexing, beamforming, and diversity cod-ing techniques.
www.tmworld.com/guest_ni_mimo
Blog commentaries and links
Taking the MeasureRick Nelson, Editor in Chief
• Getting exercised over technology• I propose that every smart phone come with
paid subscriptions to EDN.com and TMWorld.com
• Is technology more dangerous than darkness and wild animals?
• Does the Internet rot your brain?
Rowe’s and ColumnsMartin Rowe, Senior Technical Editor
• Volta, Ampere, and Smoot• The only clock that mattered• The keeper of temperature measurement• Unintentional and intentional EMI
Engineering Education and CareersBreanna Locke, Contributing Editor
• Powered by movement• HELP-ing Africa• Professors experimenting with hurricane force• Students use sign language...over the phone
www.tmworld.com/blogs
Take a challenge, win a prizeAnswer one of our four Test & Measurement Chal-lenges correctly, and you could win a $100 American Express gift check, courtesy of Test & Measurement World. The topics for this month’s challenges are Eye Diagrams, X-Y Mode, Triggering, and RF Signal Analyzers.
www.tmworld.com/challenge
THE ORIGINAL PUSH-PULL
CONNECTOR
Contact your local partner on www.lemo.com
LEMO SA - Switzerland
Phone: (+41 21) 695 16 00Fax: (+41 21) 695 16 02 [email protected]
More than 50'000 connectorcombinations
The modular design ofLEMO products providesmore than 50'000 different combinations of connectors with a large choice of contact configurations:
• High and low voltage• Coaxial and triaxial• Quadrax• Thermocouple• Fibre optic• Fluidic and pneumatic• Hybrid• Custom solutions• Cable assembly
TMW1009_006 6 9/27/10 10:29:37 AM

Who makes the fastest real-time oscilloscopes?
?The fastest-growing oscilloscope company.*
20 MHz - 40 MHz
60 MHz - 200 MHz
DC - 90 GHz Sampling
2.5 GHz - 13 GHz 600 MHz - 4 GHz
100 MHz - 1 GHz
100 MHz - 1 GHz
100 MHz - 1 GHz
100 MHz - 500 MHz
100 MHz - 200 MHz
Introducing 16-32 GHz Agilent Infi niium 90000 X-Series
u.s. 1-800-829-4444 canada 1-877-894-4414© Agilent Technologies, Inc. 2010
*Prime Data 2009 Market Growth Analysis.
Our portfolio offers families engineered to deliver the best:
Are you using the best scope?Take the 5-minute scope challenge and fi nd out.www.agilent.com/fi nd/scopecheck
TMW1009_007 7 9/9/10 4:54:54 PM

8 SEPTEMBER 2010
A CANON COMMUNICATIONS LLC PUBLICATION
EDITORIAL STAFF
Editor in Chief: Rick [email protected] & EDA, Inspection, Failure Analysis, Wireless Test, Software, Environmental Test
Managing Editor: Deborah M. [email protected]
Senior Technical Editor: Martin [email protected], Telecom Test, Fiber-Optics, EMC Test, Data-Analysis Software
Assistant Managing Editor: Naomi Eigner [email protected]
Contributing Technical Editors:Bradley J. Thompson, [email protected] A. Quinnell, [email protected] R. Thryft, [email protected]
Editorial Intern: Breanna Locke
Publisher: Russell E. Pratt
Art Director: Marco AguileraAssociate Art Directors: Tim Burns, Jennifer Field,
Laura Pappada, Hector TorresIllustrator: Dan Guidera
Director of Premedia Technologies: Michael CiardielloProduction Director: Jeff TadeSenior Production Artists: Jeff Polman, Derric TreeceProduction Artists: William Baughman, Ricardo Esparza
Canon Communications, LLCEXECUTIVE OFFICERS
Chief Executive Officer: Charles G. McCurdyChief Financial Officer: Fred GysiChief Operating Officer: Michael BehringerChief Technology Officer: Mike DeeringSenior Vice President, Publications: Ron WallSenior Vice President, Events Division: Kevin O’KeefeVice President, Operations: Roger BurgVice President, E-media: Jason Brown
HOW TO CONTACT T&MW
EDITORIAL:33 Hayden Ave.Lexington, MA 02421
Fax: 781-862-4853E-mail: [email protected] Web: www.tmworld.com
SUBSCRIPTIONS: For address changes, cancellations, or questions about your subscription, please contact:
Customer ServiceTest & Measurement WorldP.O. Box 47461Plymouth, MN 55447
Phone: 800-869-6882Fax: 866-658-6156 E-mail: [email protected]: www.getfreemag.com/tmw
CIRCULATION:Rick Ellis 303-322-3538 [email protected]
LIST RENTAL:Statlistics203-778-8700
REPRINTS:Foster Printing Service800-879-9144 [email protected]
Subscribe to T&MW online: www.getfreemag.com/tmw
HBM, Inc. · 19 Bartlett Street, Marlborough, MA 01752, USA
Tel. (800) 578 4260 · Email [email protected]
www.hbm.com/GEN2i
_ Phenomenal power… up to 100 MS/s (megasamples/s) per channel
_ Supreme portability… direct-to-disk streaming with 20 MB/s
_ Unrivalled ease of use… with large 17-inch touchscreen
_ Intuitive data handling… with lightning-fast display: 100 GB in 4 s!
… with unique features and
leading-edge usability:
GEN2i The ultimate portable data recorder
Vision becomes reality
TMW1009_008 8 9/9/10 5:34:05 PM

RICK NELSONEDITOR IN CHIEF
> > > POST YOUR COMMENTS AT WWW.TMWORLD.COM/BLOG.
SEPTEMBER 2010 9TEST & MEASUREMENT WORLD www.tmworld.com
EDITOR’S NOTE
ew HB (high-brightness) LED de-vices are poised to revolutionize lighting. Although they may not be fully competitive with compact fluorescent bulbs for green home lighting, that could change, and
they are already finding use in medical-device, automotive, architectural, and signage applica-tions, for which they save power and space while offering the ability to shape light into un-limited colors. This last ability lifts them from the realm of the practical into the world of fine art,
as evidenced by the work of Leo Villareal, an art-ist who works with LEDs to create com-puter-driven imagery, light sculptures, and site-specific architectural work. You can
see his work at the San Jose Museum of Art through January 9, 2011.
From an engineering perspective, to effec-tively apply LEDs you must understand packag-ing, control-electronics, and thermal-manage-ment issues. You can learn more about these is-sues at a full-day workshop titled “Designing with LEDs,” scheduled for September 29, 2010, in Chicago and sponsored by sibling publica-tions Design News and EDN. In four technical paper tracks, you can learn about power man-agement, thermal management, LEDs and solar power, and optics and light measurement. Panel presentations by major LED manufacturers will discuss LED life, reliability, and future products. You can also see exhibits of the latest in HB
LEDs, connectors, packaging technologies, and power-management and thermal-management components. The workshop is co-located with Assembly & Automation Technology Expo (AATExpo.com) and five other events at the Donald E. Stephens Center in Rosemont, IL; see the T&MW events calendar for more infor-mation: www.tmworld.com/events.
When it comes to testing and measuring LEDs, you needn’t wait for the workshop. This issue brings you two feature articles on the topic. In our cover story, senior technical editor Martin Rowe recounts his visit to Luminus De-vices, a company that manufactures LEDs that appear in stage lighting, portable projectors, re-tail stores, homes, street lights, and projection TVs. As Rowe writes, lighting designer Kevin Adams chose stage lights that contain Luminus Devices’ LEDs when he designed the lighting for Green Day’s “American Idiot” musical on Broadway. Rowe explains how Luminus employs wafer probers, source-measure units, and spec-trometers to measure parameters such as for-ward operating voltage, reverse leakage cur-rent, dominant wavelength, and brightness.
In our second feature this month, Bryan C. Bolt, technology development manager for test systems at Cascade Microtech, describes the is-sues facing test equipment makers as the HB LED market experiences a compound annual growth rate projected to exceed 30% over the next several years. He notes that despite a lack of industry standards and a technology road-map, vendors of test equipment must accom-modate the range of test configurations found across the spectrum of manufacturers while con-trolling the cost of test.
It’s certain that both design and test engi-neers have work to do as the applications and markets for HB LEDs expand. T&MW
To effectively apply LEDs, you must understand packaging, control-electronics, thermal-management, and test-and-measurement issues.
NEnhance your LED skills
TMW1009_009 9 9/9/10 4:55:20 PM

We see enclosures differently.
© 2010 Delaware Capital Formation, Inc. All Rights Reserved. DOVER®, the DOVER® Logo, Crenlo®, the Crenlo® Logo, and Emcor® are registered trademarks in the United States [and various other countries] of Delaware Capital Formation, Inc., a wholly-owned subsidiary of Dover Corporation.
Emcor products are designed to be functional and stylish. As an industry leader in the design, manufactureand integration of high-quality enclosures, Emcor offers a range of standard, modi ed and custom products for any application. The only thing stronger than our enclosures is our commitment to customer satisfaction. At Emcor, we see enclosures differently.
Emcor leads the market in premium enclosures by providing: • Custom-engineered designs • High-quality craftsmanship for durability and strength • Products that can be modi ed for your application • Stylish design options including colors and accessories
Emcor enclosures are designed and manufactured by Crenlo.507-287-3535 | www.emcorenclosures.com/fresh
FreshDesigns.
TMW1009_010 10 9/9/10 4:55:36 PM

[An exclusive interview with a test engineer]TESTVOICES
SEPTEMBER 2010 11TEST & MEASUREMENT WORLD www.tmworld.com
Every other month, we interview an electronics engineer who has test, measurement, or inspection responsibilities. To participate in a future column, contact Martin Rowe at [email protected]. To read past “Test voices” columns, go to www.tmworld.com/testvoices.
Sambit Panigrahi is system integration and tools lead in the battery-manage-
ment solutions group at Texas Instruments (Dallas, TX). He’s responsible for integrating systems used to test ICs such as battery fuel gauges that manage power for re-chargeable batteries. The gauges can support batteries that are available in more than 600 different packages and chemis-tries and may have up to four cells. Senior technical editor Martin Rowe spoke with Panigrahi by telephone.
Q: How do you test battery fuel gauges?A: The power-management devices are really microcon-trollers with analog front ends, so a test system tests the firm-ware for how the device responds to known physical condi-tions. Our battery fuel gauge ICs are SBS (Smart Battery System) compliant and thus must meet SBS specs so end users can easily swap devices from multiple manufacturers.
We create test conditions by applying voltages and cur-rents with source-measure units from Keithley Instru-ments. We simulate temperature with a digital potentiom-eter that acts like an external sensor. We have practically no test components inside the firmware in our devices to aid our testing, so we don’t “trick” the devices to think that they are experiencing anything. We do, though, send commands to change the device modes, threshold values, and so forth. Our devices have RISC processors and lim-ited memory. By changing the flash-memory contents in the devices, we can place a device in different modes. We then change physical conditions to test that mode.
Q: What responses do you look for?A: We typically run as many as 200 tests on each device. We test conditions such as overvoltage or battery tempera-ture. By setting the battery voltage too high, we check that the controller responds correctly. That is, it must trig-ger an error flag that the tester can then interrogate and verify that the correct trigger occurred.
Q: How have you structured the test software?A: The software is based on National Instruments’ Lab-View and TestStand. TestStand lets operators set test pa-
rameters and conditions. We’ve developed automated scripts that execute the tests. LabView executes the scripts by communications through drivers encapsulated in DLLs (dynamic link libraries) and OCX (object linking and em-bedding control extension) files.
The DLLs are sometimes packaged in executable files that we distribute to customers so they can test their bat-tery assemblies. LabView calls the drivers and runs the tests, reporting the results to TestStand.
Q: Which other departments do you work with when developing the testers?A: We work with firmware engineers within the com-pany, but we also work with field-applications engineers who have direct contact with the customers. We do most of the data gathering in Dallas as well as some of the soft-ware development. Some of the software development also takes place in India.
Q: What were the major challenges you faced when developing the testers?A: People were used to performing these tests manually, without automated scripts. Thus, they had to get used to an automated system. With the old system, sending a com-mand to a controller that set a voltage and waiting for a re-sponse could take between 8 s and 10 s, and the test opera-tor could see when the controller under test responded to the stimulus command. The operator could then check the appropriate alarms. With automated systems, we had to pro-gram the systems with greater accuracy to wait, say about 10.25 s, before checking the device under test. T&MW
Automated power
DA
NIE
L G
UID
ER
A
TMW1009_011 11 9/9/10 4:56:27 PM

12 SEPTEMBER 2010 www.tmworld.com TEST & MEASUREMENT WORLD
NEWSBRIEFS
Semiconductor market continues to grow
The SIA (Semiconductor Industry Association) has reported that global sales of semiconductors grew to $25.2 billion in July, an increase of 1.2% from June when sales were $24.9 billion and an increase of 37.0% from July 2009 when sales were $18.4 billion. Year-to-date sales totaled $169.2 billion, accord-ing to the association, an increase of 46.7% from the $115.3 billion reported for the first seven months of 2009.
“Worldwide sales of semiconductors were strong in July despite growing indi-cations of slower growth in the overall economy,” said Brian Toohey, president of the SIA, in a prepared statement. “The continued proliferation of semi-conductors into a broad range of prod-ucts provides opportunities for industry expansion even in a period of slower overall economic growth. Although recent public statements from a number of major manufacturers have emphasized limited visibility for the near term, we continue to expect that industry growth for 2010 will be in line with our midyear forecast of 28.4%.” www.sia-online.org.
SAS software supports 6-Gbps and 12-Gbps scope measurementsAgilent Technologies recently introduced two automated test software programs for SAS (Serial Attached SCSI) physical-layer transmitter compliance testing. One program (N5412B SAS-2) supports SAS 6-Gbps, while the other (SAS12G) sup-ports 12-Gbps interfaces.
The N5412B SAS-2 software runs on the Agilent Infiniium 90000 Series or 90000 X-Series oscilloscopes and helps engi-neers verify physical-layer transmitter compliance for SAS 1.5-Gbps, 3-Gbps, and 6-Gbps silicon, expanders, port multi-pliers, and high-density and solid-state disk drives. The test methods are based on the UNH-IOL (University of New Hampshire InterOperability Lab) Consortium’s SAS-2 physical-layer test suite.
The N5412B software performs tests for spread-spectrum clocking specifications, transmitted signal require-ments, and out-of-band specifications. It also provides automated compliance test support for intra-enclosure and internal-enclosure interface points, displays the results in a flexible report format, and provides a margin analysis that shows how closely a device passes or fails each test.
The SAS12G UDA (user-defined application) software for Infiniium 90000 X-Series scopes provides 12-Gbps physical-layer transmitter measurements for engineers designing to the requirements of the upcoming SAS-3 specification. The software determines if designs meet the specification and predicts system interoperability. The UDA test methodologies are leveraged from the N5412B software. www.agilent.com.
At NIWeek 2010, National Instruments complemented its release of LabView 2010 (see Test & Measurement World, August 2010, p. 12) with the introduction of the NI PXIe-5630 6-GHz two-port VNA (vector network analyzer) that targets automated design validation and production test. The instru-ment’s two-slot PXI footprint enables test engineers to incorpo-rate vector network analysis into their test systems without the
added cost and large footprint of tradi-tional bench VNAs.
Optimized for automated test, the NI PXIe-5630 VNA offers automatic preci-sion calibration, full vector analysis on both ports, reference-plane extensions, and a flexible LabView API (application programming interface) that supports parallel test. The instrument features a frequency range of 10 MHz to 6 GHz, a
dynamic range of greater than 110 dB, and sweep speeds of less than 400 μs/point over 3201 points.
Engineers can combine up to eight NI PXIe-5630 modules in a single PXI chassis and perform multisite RF test. They can control the NI PXIe-5630 interactively by using its soft front panel, or they can control it programmatically by using APIs for NI LabView software and the NI LabWindows/CVI ANSI C development environment.
Base price: $25,999. National Instruments, www.ni.com.
NI debuts 6-GHz PXI VNA
Ed
ito
rs’ C
HO
ICE
TMW1009_012 12 9/9/10 4:57:47 PM

SEPTEMBER 2010 13TEST & MEASUREMENT WORLD www.tmworld.com
Ed
ito
rs’ C
HO
ICE
The DEWE-50-USB2-8 data-acquisition system from Dewetron supports up to eight signal-conditioning modules for measuring temperature, strain, vibration, sound, voltage, and current. The chassis-based system has a dedicated 24-bit, 200-ksamples/s ADC for each channel. The system features 1800 V of isolation, which can eliminate ground loops and provide safety.
Besides accepting eight analog inputs, the system has two counter-timer chan-nels in the chassis and two CAN bus ports for communications with vehicles. High-voltage modules are available for ±10 V to ±1400 V, and low-voltage mod-
ules range from ±10 mV to ±50 V. Current-input modules cover ±0.1 A to ±5 A. Temperature modules are available for thermocouples and RTDs. Analog-output modules can gener-ate signals up to ±10 V. In addition, the chassis has one 5-V analog output per input channel.
The instrument chassis connects to a PC through a USB port. At the chassis end, the USB connector can lock in place to pre-vent accidental removal. The DEWE-50 includes Windows driv-ers and application software for logging and plotting data.
Base price: chassis—$7500. Dewetron, www.dewamerica.com.
USB DAQ system works in isolationC A L E N DA REOS/ESD Symposium, Octo-ber 3–8, Reno, NV. Electrostatic Discharge Association, www.esda.org.
International Test Conference, November 2–4, Austin, TX. IEEE, www.itctestweek.org.
Vision 2010, November 9–11, Stuttgart, Germany. Messe Stutt-gart, www.messe-stuttgart.de/vision.
Electronica, November 9–12, Munich, Germany. Messe München, www.electronica.de.
To learn about other conferences, courses, and calls for papers, visit www.tmworld.com/events.
As more consumer devices areladen with multimedia capabili-ties, products which used tohave divergent testing needs increasingly share many of thesame multimedia requirements.MMTS (Multimedia Test System)from VI Technology (an AeroflexCompany), an integrated testingsystem, includes hardware, software, algorithms, and extensions for testing all thecomponents in consumer devices. EchoStar senior test engineer,Lisa Moder, explained whyMMTS proved so valuable to herteam, describing it as “ probablythe best commercially availabledevice for measuring motionvideo.”
Welcome to the Age of Testing Convergence
www.aeroflex.com
TMW1009_013 13 9/9/10 5:35:31 PM

©2010 Measurement Computing Corporation, 10 Commerce Way, Norton, MA 02766 • [email protected]
USB-2416 Series High-Channel Count, Multifunction Modules
The Value Leader in Data Acquisition
For complete specs visitwww.mccdaq.com/2416
(800) 234-4232
24-Bit Data AcquisitionVOLTAGE | TEMPERATURE | ANALOG OUTPUT | DIGITAL I/O
FROM $1099
TMW1009_014 14 9/9/10 5:35:38 PM

SEPTEMBER 2010 15TEST & MEASUREMENT WORLD www.tmworld.com
SHOWHIGHLIGHTS
ETS-Lindgren introduced its 3119 double-ridged waveguide horn antenna used for wire-less testing and EMI immunity testing. The antenna can handle up to 1500 W with a band-width of 400 MHz to 6 GHz.
ETS-Lindgren also announced that it will be conducting a series of three-day courses in EMC testing at its facility in Cedar Park, TX. The course will include lab time in the com-pany’s 3-m semianechoic chamber. Topics will include EMC standards, test preparation, radiated emissions and immunity testing, re-porting of results, measurement uncertainty, and lab accreditation.
Aeroflex demonstrated its new Model 3250 spectrum analyzer series for EMI emissions testing. The series consists of four models with a maximum bandwidth of 3 GHz to 26.5 GHz (all bandwidths start at 1 GHz). The Model 3250 uses a 30-MHz ADC to digitize signals, after which the instrument converts signals to the frequency domain. From there, the Model 3250 lets you measure spurious emissions chan-nel power, total power, and average power. It also uses spectral masks for comparing signals against emissions standards.
Teseq upgraded its ITS 6006 immunity test system by increasing the instrument’s internal RF power meter’s bandwidth to 6 GHz. Its linear measurement range has expanded to cover –45 dBm to +20 dBm. Besides the power meter, the system includes RF switches and connectors that let you route signals from an RF generator to equipment under test. The company also upgraded the NSG 3060 EMC test system by adding the TSM 3751 telecom surge module.
AR introduced the Model FL7060 electric field probe used to characterize EMC chambers. The probe has a sensitivity range of 2 V/m to 1000 V/m, and it can make 2-V/m measure-ments without the need for a zero adjustment. Because it’s laser powered, the probe can oper-ate continuously, without batteries. AR also demonstrated a PC-based digital emissions re-ceiver that measures emissions from 20 Hz to 18 GHz in 140-MHz bands. It can capture a range of frequencies from 30 MHz to 1000 MHz in 7 s and can make peak, quasi-peak, average, and RMS-average measurements.
Tektronix exhib-ited its 20-GHz RSA 6120 spectrum ana-lyzer. The instrument makes a series of fre-quency scans that are 110 MHz wide, and it converts digitized signals into the frequency domain. The RSA 6120 has 80-db dynamic range.
Agilent Technologies introduced EMI measurement software for its X-series signal analyzers that lets you make real-time precom-pliance measurements based on commercial standards such as CISPR 16-1-1 or military EMI standards. The application lets you view signal lists that include peak, quasi-peak, and RMS values of signal emissions. You can also create lists of failed frequencies. The software lets you find and remove ambient signals from a frequency scan.
Rohde & Schwarz demonstrated its RTO and RTM line of oscilloscopes. The company also showed its modular BBA100 broadband amplifier, which includes RF switch modules and amplifier modules for several frequency ranges. In addition, the company exhibited its ESPI precompliance test receiver. The R&S ESPI3 covers 9 kHz to 3 GHz, and the ESPI7 covers 9 kHz to 7 GHz. Measurement uncer-tainty is less than 1.5 dB.
TECHNICAL PROGRAMDuring the technical program, Professor Frank Leferink of the University of Twente in the Netherlands used several PCBs (printed circuit boards) to demonstrate EMI at the board level. Leferink showed how vias in boards may form current loops that can radi-ate energy, and he explained how placing bypass capacitors on the underside of a board can defeat the purpose of the bypass capacitor. The loop inductance from an IC to its bypass capacitor can radiate emissions that the ca-pacitor should squelch.
Leferink also showed how the layout of PCB traces can result in crosstalk. A coupling path can cause signals in a trace to appear on an ad-jacent trace. Differences in line terminations can create coupling paths. T&MW
EMC products clear the noise level> > > IEEE International Symposium on Electromagnetic Compatibility, July 25–30, Ft. Lauderdale, FL; IEEE EMC Society, www.emc2010.org.
Teseq’s ITS 6006 immu-
nity test system includes
RF switches and con-
nectors so you can route
signals from an RF gen-
erator to the equipment
under test. Courtesy of Teseq.
TMW1009_015 15 9/9/10 4:58:36 PM

rf/microwave instrumentationOther ar divisions: modular rf • receiver systems • ar europeUSA 215-723-8181. For an applications engineer, call 800-933-8181.In Europe, call ar United Kingdom 441-908-282766 • ar France 33-1-47-91-75-30 • emv GmbH 89-614-1710 • ar Benelux 31-172-423-000
ISO 9001:2008Certified
Copyright © 2010 AR. The orange stripe on AR products is Reg. U.S. Pat. & TM. Off.
Our products have always outlastedand outperformed the competition,
now we’re giving them another problem.
We’ve shrunk our “S”amplifiers giving you more power with an even greater price-performance ratio. Our new 0.8 to 4.2 GHz “S” Series solid-state amplifiers are giving the competition a lot to worry about. These new,smaller amplifiers simply give you more for your money than any amp on the market. They’re lighter, more portable, and up to 50% smaller. Yet they’re available with all the power you need – up to 800 watts. Our new design is more efficient. These amplifiers use less energy, which is good for you, good for the environment, and bad for our competition.
Our “S” Series amps are smarter, too. When you need more power, you can add additional amplifiers, instead of tossingout your amp and starting all over. And you can use the amps independently, even in different locations, for those tests that don’t require as much power. This is a unique, flexible, money-saving feature that we call Subampability™. Our competitors have some other choice words for it. But that’s their problem.
To learn more, visit www.ar-worldwide.com or call us at 215-723-8181.
TMW1009_016 16 9/9/10 4:58:40 PM
TECHTRENDS
SEPTEMBER 2010 17TEST & MEASUREMENT WORLD www.tmworld.com
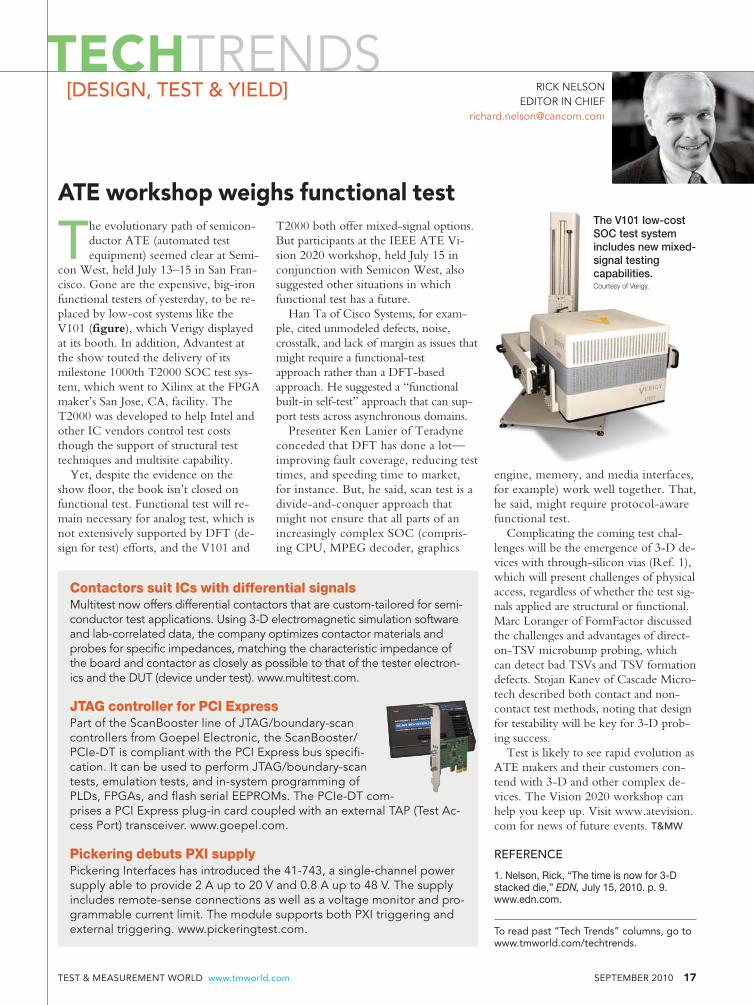
The evolutionary path of semicon-ductor ATE (automated test equipment) seemed clear at Semi-
con West, held July 13–15 in San Fran-cisco. Gone are the expensive, big-iron functional testers of yesterday, to be re-placed by low-cost systems like the V101 (figure), which Verigy displayed at its booth. In addition, Advantest at the show touted the delivery of its milestone 1000th T2000 SOC test sys-tem, which went to Xilinx at the FPGA maker’s San Jose, CA, facility. The T2000 was developed to help Intel and other IC vendors control test costs though the support of structural test techniques and multisite capability.
Yet, despite the evidence on the show floor, the book isn’t closed on functional test. Functional test will re-main necessary for analog test, which is not extensively supported by DFT (de-sign for test) efforts, and the V101 and
T2000 both offer mixed-signal options. But participants at the IEEE ATE Vi-sion 2020 workshop, held July 15 in conjunction with Semicon West, also suggested other situations in which functional test has a future.
Han Ta of Cisco Systems, for exam-ple, cited unmodeled defects, noise, crosstalk, and lack of margin as issues that might require a functional-test approach rather than a DFT-based approach. He suggested a “functional built-in self-test” approach that can sup-port tests across asynchronous domains.
Presenter Ken Lanier of Teradyne conceded that DFT has done a lot—improving fault coverage, reducing test times, and speeding time to market, for instance. But, he said, scan test is a divide-and-conquer approach that might not ensure that all parts of an increasingly complex SOC (compris-ing CPU, MPEG decoder, graphics
engine, memory, and media interfaces, for example) work well together. That, he said, might require protocol-aware functional test.
Complicating the coming test chal-lenges will be the emergence of 3-D de-vices with through-silicon vias (Ref. 1), which will present challenges of physical access, regardless of whether the test sig-nals applied are structural or functional. Marc Loranger of FormFactor discussed the challenges and advantages of direct-on-TSV microbump probing, which can detect bad TSVs and TSV formation defects. Stojan Kanev of Cascade Micro-tech described both contact and non-contact test methods, noting that design for testability will be key for 3-D prob-ing success.
Test is likely to see rapid evolution as ATE makers and their customers con-tend with 3-D and other complex de-vices. The Vision 2020 workshop can help you keep up. Visit www.atevision.com for news of future events. T&MW
REFERENCE
1. Nelson, Rick, “The time is now for 3-D stacked die,” EDN, July 15, 2010. p. 9. www.edn.com.
To read past “Tech Trends” columns, go to www.tmworld.com/techtrends.
ATE workshop weighs functional test
[DESIGN, TEST & YIELD] RICK NELSON EDITOR IN CHIEF
The V101 low-cost SOC test system includes new mixed-signal testing capabilities. Courtesy of Verigy.
Contactors suit ICs with differential signalsMultitest now offers differential contactors that are custom-tailored for semi-conductor test applications. Using 3-D electromagnetic simulation software and lab-correlated data, the company optimizes contactor materials and probes for specific impedances, matching the characteristic impedance of the board and contactor as closely as possible to that of the tester electron-ics and the DUT (device under test). www.multitest.com.
JTAG controller for PCI ExpressPart of the ScanBooster line of JTAG/boundary-scan controllers from Goepel Electronic, the ScanBooster/PCIe-DT is compliant with the PCI Express bus specifi-cation. It can be used to perform JTAG/boundary-scan tests, emulation tests, and in-system programming of PLDs, FPGAs, and flash serial EEPROMs. The PCIe-DT com-prises a PCI Express plug-in card coupled with an external TAP (Test Ac-cess Port) transceiver. www.goepel.com.
Pickering debuts PXI supplyPickering Interfaces has introduced the 41-743, a single-channel power supply able to provide 2 A up to 20 V and 0.8 A up to 48 V. The supply includes remote-sense connections as well as a voltage monitor and pro-grammable current limit. The module supports both PXI triggering and external triggering. www.pickeringtest.com.
TMW1009_017 17 9/9/10 4:59:33 PM

Toughest
800-525-8528 WWW.DATATRANSLATION.COM
Data Translation temperature measurement system is the
While maintaining the highest accuracy
Highest accuracy means a guarantee of ±0.07°C for RTD inputs, and ±0.15°C for thermocouple inputs from all errors. You can’t do better than that.
*
*
Performance Without Compromise.
TEMPpoint provides highly accurate, 24-bit resolution temperature measurements on up to 48
channels. It also provides the ultimate in galvanic isolation, 1,000V channel-to-channel, to protect
signal integrity in harsh environments.
TMW1009_018 18 9/9/10 4:59:39 PM

TECHTRENDS
SEPTEMBER 2010 19TEST & MEASUREMENT WORLD www.tmworld.com
Detecting defects within MEMS (microelectromechanical systems) is not an easy task. The compo-
nents inside these structures are a varied mix of electrical circuits, mechanical de-vices, and sensors. The most common de-fects in MEMS—subsurface cracks, parti-cle contamination, and voids—often occur in the substrate or in the bond be-tween the wafer and the device, so it is difficult to detect them with inspection methods that use transmit-ted light. Nondestructive methods for inspecting MEMS include ultrasound-based acoustic inspection, x-ray, SWIR (short-wave infrared), and NIR (near infrared), said Tom Persico, director of technology for McBain Systems.
Acoustic-based inspec-tion using ultrasonic fluid immersion is good at find-ing macro defects but only down to around 100 mi-crons, said Persico. “Al-though x-ray easily pene-trates many materials, the wavelengths are very long, and the longer the wave-length, the worse the reso-lution,” he said. NIR in-spection systems, according to Persico, are best for detecting defects down to a mi-cron in size. NIR systems not only find subsurface defects, but also measure criti-cal alignment marks between two die lay-ers, between two wafer layers, or between a die layer and a wafer layer, he said. “An-other use we’re seeing is detecting process damage, such as from 3-D wafer-stacking processes that are still being fine-tuned.”
NIR wavelengths are usually defined as starting above the visible spectrum, around 650 nm, and continuing up to wavelengths of about 1000 nm, said Per-sico. “Just because you can create a NIR image, however, that doesn’t mean it shows you what you need to see,” he
said. “With highly doped parts, extra-thick materials, or rough or unpolished surfaces, you’ll need to reach higher wavelengths to see through the material well enough.”
Different materials may also require different wavelengths. NIR may be high enough for penetrating most silicon sub-strates but not for some proprietary semi-conductor materials. In these cases, you need wavelengths above 1000 nm in the
SWIR spectrum. “Our DDR300 NIR system ac-tually uses both, operating between 900 nm and 1700 nm,” Persico said.
NIR inspection and metrology systems range from manual benchtop systems used mostly in the lab to fully automated tools used on the fab pro-duction floor, said Persico. Automated NIR tools are somewhat new. “Some fabs add an IR camera to production equipment, but don’t really optimize the tool for NIR,” he said. “There are also benchtop microscopes with IR, but they still need to work in conjunction with the soft-
ware, camera, motion control, and a light source for the particular application.”
In the future, McBain expects to im-prove its NIR inspection and metrology systems with new optics for better reso-lution, typically on the macro side, said Persico. That means smaller pixels, higher pixel density, higher sensitivity, and lower noise. “Customers want to see the same small features in the same field of view but in a larger area, so they don’t need to buy two different tools. That’s because throughput is everything for semiconductor manufacturers.” T&MW
To read past “Tech Trends” columns, go to www.tmworld.com/techtrends.
Near infrared techniques find MEMS defects
[MACHINE VISION]
Automated production-floor tools that use NIR technology can detect de-fects and measure small features inside multilayer MEMS and other chips. Courtesy of McBain Systems.
AOI system targets modules, sensorsThe Reveal Imager Series is designed for inspection and metrology of camera modules and image sen-sors in back-end-of-line environments. The Reveal accurately detects parti-cles that are 1 micron or larger, checks for process defects, and can measure and forward-feed exact sensor and pixel-array positioning. www.vitechnology.com.
GigE camera adds software featuresBasler Vision Technologies has enhanced the software for its Runner family of GigE linescan cameras. Shading correction compensates for nonhomoge-neous lighting conditions so vision application software can detect defects more easily. To create the camera’s correct line-acquisition rate, the multiplier increases the frequency of an in-coming trigger signal, while the divider reduces that frequency. www.baslerweb.com.
HD frame grabber streams videoThe new HDV62 PCI Express frame grabber offers video streaming and uncompressed image acquisition in 1080p high-definition. It also provides up to 1920x1080p resolution at 60 fps, progressive scan, noise reduc-tion, and a wide aspect ratio. An onboard FPGA and 512-Mbyte buffer are included for streaming uncompressed video and per-forming real-time color-space conversion. www.adlinktech.com.
ANN R. THRYFTCONTRIBUTING TECHNICAL EDITOR
TMW1009_019 19 9/9/10 5:00:22 PM

Agilent and our Distributor NetworkRight Instrument. Right Expertise. Delivered Right Now.
888-852-7234www.rselectronics.com
Download the latest hints and tipswww.agilent.com/fi nd/smartarb
“I need a function generator that generates efficiency, too.”
Signal quality is just the beginning.You’re facing faster design cycles and more complicated testing
protocols. PC connectivity is more critical than ever, too. Agilent
function/arbitrary waveform generators help shorten your test times
with legendary signal quality and purity — along with state-of-the-art
I/O connectivity. Plus they’re bench-friendly, rack-able, reliable and easy
to use. That’s Agilent. That’s smart.
Function/Arbitrary Waveform Generator Series
33210A – 10MHz $1,197*
33220A – 20MHz $1,863*
33250A – 80MHz $4,579*
© 2010 Agilent Technologies, Inc.*Pricing in USD and subject to change
Untitled-1 1 2/9/2010 4:38:48 PM
TMW1009_020 20 9/9/10 5:36:09 PM

SEPTEMBER 2010 21TEST & MEASUREMENT WORLD www.tmworld.com
MECHATRONICS IN DESIGN D
EF
EN
SE
SY
S
TE M
S C O N S U M E R P R O D U C T S MA
N
UF
AC
TU
RI N
G
ControlSystems
Software ElectronicSystems
MechanicalSystems
Digital ControlSystems
ControlElectronics
MechanicalCAD
Electro-mechanics
MA
TE
RI
AL
S P
RO
CE
SS
I NG
A U T O M O T I V E A E R O S P A C E ME
DI C
AL
XE
RO
GR
AP
HY
mechatronics
FRESH IDEAS ON INTEGRATING MECHANICAL SYSTEMS, ELECTRONICS, CONTROL SYSTEMS, AND SOFTWARE IN DESIGN
In a motion-system context, the idea of adding inertia to a system, (that is, adding mechanical mass) is not usually desirable as it slows down system response. One familiar
exception is adding a flywheel to an engine or machine to smooth out speed fluctuations. Two of the most important benefits of feedback control are “command following” and “disturbance rejection.” Usually, the focus of attention in a control system is on command following, but in many situa-tions, the ability of a system to reject disturbances (that is, have a high dynamic stiffness) is paramount.
For a motor-velocity feedback-control system, increasing inertia J reduces the high-frequency disturbance response, meaning it makes the system dynamically stiffer at high fre-quencies. But the closed-loop command-following is degraded. How can you add inertia without degrading com-mand-following performance?
A common industry motion-control system has three cas-caded feedback loops: motor current, velocity, and position. Newton’s Second Law says that torque is proportional to angular acceleration, so if you can measure or estimate accel-
eration, you can scale the acceler-ation by inertia J to give units of torque, and then by 1/KT, the inverse of the motor torque con-stant, to give current. This is then multiplied by a gain KAFB, and subtracted from the current com-mand to the current-control loop. KAFB has a similar effect to increasing inertia J; hence the alternate name “electronic iner-tia.” To ensure that the com-mand-following performance remains the same, the PI velocity control gains must be scaled by the same factor (1 + KAFB), as shown in Figure 1:
The velocity command response is unaffected by the value of KAFB because the loop gain increases in proportion to the inertia, producing no net effect. So, why should you add electronic inertia? The real benefit of acceleration feedback is that the disturbance response is improved by acceleration feedback through the entire frequency range in proportion to the term (1 + KAFB), as shown by the transfer function and frequency-response plot (Figure 2).
This improvement cannot be realized significantly above the bandwidth of the current loop, as the acceleration feed-back signal cannot improve the system at frequencies where the current loop cannot inject current. Of course, a robust acceleration feedback signal is required. This can be accom-plished through differentiation of a position sensor signal and filtering or through the use of an observer.
For mechatronics engineers, here is one situation where adding inertia is highly desirable. T&MW
Isn’t there enough real inertia around?Electronic inertia through acceleration feedback improves performance.
c+
+
+−
TD
KI
sKP+ 1 + KAFBCurrent
loopKT
1(1 + KAFB)Js
90
45
0
–90
–80
–60
–40
–20
0
20
–100
–45
Same phase both cases
100 101 102 103 104
Mag
nitu
de
(dB
)Ph
ase
(deg
)
KAFB = 9KAFB = 0
(1 + KAFB)Js2 + KT(KPs + KI)
s
=TD
Bode diagram
Frequency (rad/s)
Figure 1.
Figure 2.
Kevin C. Craig, PhD,
is the Robert C.
Greenheck chair in engi-
neering design and a
professor of mechanical
engineering, College of
Engineering, Marquette
University.
For more mechatronics
news, visit:
mechatronicszone.com.
TMW1009_021 21 9/9/10 5:37:12 PM

While many desktop systems are termed “Enterprise” by their vendors, SMART|CMS Calibration Management
Software is the only system powerful enough to manage all of your instrument calibration, repair, maintenance, asset
tracking and lab management needs in a single integrated data base. The sophisticated global architecture enables
one system to support unlimited laboratories and calibration facilities across the world. With SMART|CMS you
can maximize the use of common procedures, optimize calibration intervals and standardize your performance
metrics analysis across the entire enterprise. Provides your internal and external customers with world-wide web
based asset location and status tracking, as well as direct inquiry into work-in-process status. As an added bonus,
you can couple the power of the SMART|ENCATS Enterprise Catalog Module to standardize all of your lab
equipment manufacturer, model, and descriptive information. In addition, you can take advantage of the performance
specifications search feature to make better use of your existing investment in instruments and laboratory equipment.
Call us at 1.800.755.3968. We’ll help you connect the dots.
SMART|CMS Calibration
Management
Software
� Calibration Management
� Repair Tracking
� Maintenance Tracking
� Customer Asset Tracking
� Laboratory Information Management
� Mobile Field Inspection and Calibration
� Enterprise Cataloging
by PMSC
2800 28th Street, Santa Monica, California 90405 USA 310.450.2566 [email protected] www.assetsmart.com
Only OneQ:
A:How many systems are needed to run all of your labs?
TMW1009_022 22 9/9/10 5:37:18 PM

TESTDIGEST
SEPTEMBER 2010 23TEST & MEASUREMENT WORLD www.tmworld.com
National Instruments has released a thermocouple measurement de-vice that almost runs by itself. Yes, you can develop your own application for the NI USB-TC01 if you wish, but you don’t even need to install a driver or applica-tion software in order to use it.
The USB-TC01 will run on any PC with Windows XP or later. You don’t need administrator rights, because there is nothing to install, but you do need Microsoft .NET 2.0 SP1 or later. I found that out when I tried to use the logger on an old laptop. See my blog post “Cable box raises the temperature” for an expla-nation of how I used the logger (Ref. 1).
The NI USB-TC01 lets you log tem-perature with most any thermocouple; a type J thermocouple comes in the box. To use the device, you connect a ther-mocouple to the logger and then con-nect the logger to a USB port on the PC. The PC will think the device is a CD-ROM drive, because the measure-ment software runs directly from within the logger. The USB-TC01 also comes
with the LabView source code, so Lab-View programmers can modify the soft-ware to suit their needs.
When you connect the device, you get an immediate temperature reading on the PC screen. The display also pro-vides three options: Temperature logger, LabView code, and Download addi-tional applications. Selecting the logger option opens another window where you can plot, log, and save data.
The USB-TC01 is a useful device, but its 1-sample/s fixed sample rate can
result in more data than an ap-plication requires. I found myself wishing I could change the in-terval between samples; a menu with interval options of 0.1 s, 0.2 s, 0.5 s, 1 s, 2 s, 5 s, 10 s, and 60 s would be very helpful.
I contacted National Instru-ments about this and learned that the company is currently developing firmware that will add variable sample rates; the firmware will be available for download.
National Instruments also has several free applications that you can use with the USB-TC01. They run on your PC, not from the USB module. Click-ing on “Do more with your NI USB-TC01” in the logger application lets you download applications such as an alarm generator or limit logger.
Martin Rowe, Senior Technical Editor
REFERENCE1. Rowe, Martin, “Cable box raises the tem-perature,” Rowe’s and Columns blog, www.tmworld.com/blog/Rowe_s_and_Columns.
P R O D U C T T R Y O U T
Clever device logs temperatureNI USB-TC01 Thermocouple Measurement Device, National Instruments, www.ni.com/daq. Price $129.
The NI USB-TC01 lets you measure temperature with a
thermocouple and log data through a USB port. Courtesy of National Instruments.
D E S I G N F O R T E S T
DFT remains EDA bright spotDFT (design for test) is one area of the EDA (electronic design automation) in-dustry that remained strong and kept growing right through the recession, ac-cording to Walden C. Rhines, chairman and CEO of Mentor Graphics. In an in-terview conducted July 14 at Semicon West in San Francisco, he said, “I think the thing that’s been most exciting for us is the success of our LogicVision acquisi-tion,” which has enabled Mentor to in-tegrate scan-based test with built-in self-test. Rhines said the future holds considerable promise for increased scan compression, adding, “With the capabil-
ity to integrate built-in self-test with compressed scan, I see a very fruitful roadmap ahead for growth of products and for continuing to help our custom-ers in keeping their test costs at manage-able levels while increasing their quality and their ability to quickly analyze and correct problems in their designs.”
As for testing forthcoming 3-D chips with through-silicon vias, Rhines said, “There will be large growth in known-good-die testing. In fact, the tester people I talked to today said that’s al-ready happening,” with die testing oc-curring preliminary to the die-stacking
Walden C.
Rhines, chair-
man and CEO
of Mentor
Graphics,
says the
future holds
promise for
scan com-
pression.Courtesy of Mentor
Graphics.
TMW1009_023 23 9/9/10 5:01:24 PM

24 SEPTEMBER 2010 www.tmworld.com TEST & MEASUREMENT WORLD
TESTDIGEST
process. “That’s generating revenue for tester companies,” he said, con-cluding, “The tests involve test pro-grams, test vectors, test analysis—and that’s all very good for the electronic design-automation industry, and particularly Mentor because we have such a very large share of the design-for-test EDA market today.”
In the wide-ranging interview, Rhines also addressed the challenges the EDA and semiconductor industries face as geometries shrink and EUV (extreme ultraviolet) lithography ar-rives. He also commented on the chal-lenges that embedded-system designers face and on tools available to solve sys-tem-level power-optimization and other problems. You can read the complete interview on the Web at www.tmworld.com/rhines_0710.
Rick Nelson, Editor in Chief
E M C
EM simulation helps meet EMC specsSimulating your prod-uct’s EM (electromag-netic) radiation will help ensure that you pass FCC and CE Mark tests and will help keep your project on schedule. The FCC requires man-ufacturers to perform EMC (electromagnetic compatibility) tests on electrical and electronic products to ensure that EM radiation will not cause interference with radios, phones, and TVs. In addition to passing tests for EM radiation, a prod-uct must also exhibit electromagnetic immunity, meaning that a strike from a defined EM pulse will not significantly
DFT remains EDA bright spot
(continued)
disturb the product’s performance.Because a design might have hun-
dreds of circuit-board traces that inter-act, you need sophisticated software tools to perform EM simulations. These simulations must take into account both small and large features over a broad frequency range. You must also se lec t an appropr i a te s imula t ion method, which can be either a time-domain technique, such as FEM (fi-nite-element method), or a frequency-based one, such as MOM (method of moments). For the largest problems, you need to break the simulations into subdomains or use asymptotic-solu-tions techniques.
It’s unlikely that a single piece of software can provide all the EMC anal-ysis you need, so you should assemble a suite of software tools—from compa-nies such as Agilent Technologies, Al-tium, Ansys, AWR, Cadence, CST, and Mentor Graphics—to help battle your EMC, signal-integrity, and power-integrity demons. Sibling publication EDN’s July 15 cover story (Ref. 1) dis-cusses the various capabilities of these tools and describes the computing power you’ll need to run them.
Paul Rako, Technical Editor, EDN
REFERENCE1. Rako, Paul, “EM simulation for EMC: keeping a lid on interference,” July 15, 2010, p. 26. www.edn.com/article/509651-EM_simulation_for_EMC_keeping_a_lid_on_in-terference.php
Crosstalk from the signals on the bottom traces of a PCB
create surface currents on the upper left. Courtesy of CST.
TMW1009_024 24 9/10/10 9:25:08 AM

See for yourself www.scope-of-the-art.com
We built a scope with the industry’s firstdigital trigger systemso you can find any critical event.
TMW1009_025 25 9/9/10 5:01:31 PM

LOWEST COST 12-BIT MULTIFUNCTION USB-1208 Series
• 8 analog inputs
• Up to 50 kS/s sampling
• 2 analog outputs
• 16 digital I/O, counter
• From $129
Low Cost Data Acqu i s i t ion
TEMPERATUREUSB-TEMP Series
• Measure thermocouples, RTDs, thermistors, or voltage
• 24-bit resolution
• 8 channels
• From $329
16-BIT MULTIFUNCTION USB-1608FS
• 8 analog inputs
• 200 kS/s simultaneous sampling
• 8 digital I/O, counter
• $399
14-BIT MULTIFUNCTION USB-1408FS
• 8 analog inputs
• 48 kS/s sampling
• 2 analog outputs
• 16 digital I/O, 1 counter
• $249
OEM HIGH SPEED USB-2500 Series
• 1 MS/s sampling
• Up to 64 analog inputs
• Up to 4 analog outputs
• 24 digital I/O, 4 counters
• From $899
DIGITAL I/O USB-1024LS
• 24 digital I/O lines
• Based on industry standard 82C55
• 32-bit event counter
• High-drive models available
• $99
©2010 Measurement Computing Corporation, 10 Commerce Way, Norton, MA 02766 • [email protected]
The Value Leader in Data Acquisition
Download our new2010 Product Selection Guide
www.mccdaq.com/selguide
All modules include easy to use TracerDAQ® software plus support for Visual Studio®, Visual Studio®.NET, NI LabVIEW™, and DASYLab®. Support for MATLAB® and Linux® is also available.
(800) 234-4232
TMW1009_026 26 9/9/10 5:01:36 PM

SEPTEMBER 2010 27TEST & MEASUREMENT WORLD www.tmworld.com
Measurement tips from readers Measurement tips from readers
Measurement systems often use cameras and other sen-sors that must be synchronized. We developed an
aerial-photography system that uses a camera built from CCD image sensors, an IMU (inertial measurement unit), and a GPS unit. We then built circuits to provide trigger signals to synchronize the measurements at the optimal rate. The GPS provides information on spatial location, while the IMU provides information on spatial azimuth; the IMU combines a gyroscope, a magnetometer, and an accelerom-eter to produce angular and acceleration measurements of a three-axis vector.
Figure 1 shows the system we developed for making aerial photographs. It consists of four Atmel area-scan CCD image modules, one linear image-sensor module, two Dalsa PCI frame-grabber cards, the IMU, a clock-adjustment circuit, and a microcontroller. We used a Tektronix digital oscillo-scope to view the trigger signals during development.
The trigger signals that synchronize the sensors are the key to this measurement system. The clock-adjustment cir-cuit sends an external trigger pulse to the frame-grabber cards, which generate trigger signals for the system. Video modules consisting of the image sensors receive trigger sig-nals from the frame grabbers. Each frame grabber captures an image and stores it in onboard memory before capturing the next image.
The external trigger pulses also control the sensors, GPS, and IMU. Figure 2 shows a photo taken at 7000 ft in Mail-
iao Township, Yunlin County, Taiwan, using the external trigger circuit to drive and combine with the linear sensor and the IMU
We needed to design a circuit to change the external trigger clock’s frequency to obtain the best frame rate. The CCD sensors that go into the linear-image-sensor module have 12,288 pixels, where each pixel is 5 μm x 5 μm in size. That produces images of about 500 lines per frame. The CCD image sensors have a maximum output rate of 320 Mpixels/s. They use a Camera Link interface to send image data to the frame grabbers, which transfer the images to a PC over the PCI bus.
The clock-adjustment circuit generates the external trigger clock pulses. We implemented it on an Altera CPLD using Altera’s development software to simulate the trigger signals and design the circuit. The clock-adjustment circuit provides up to 15 trigger-signal frequencies to the system.
The system’s Atmel microcontroller contains 256 bytes of RAM plus 8 kbyte of programmable flash memory for pro-gram storage. The microcontroller communicates to a PC over RS-232 so it can also receive commands and report its current state. This handshake process includes the decoding and encoding parameters for generating the trigger signal. The mi-
Synchronize sensors and camerasTrigger circuits provide measurements and images at the right time.
By Shih-Jie Chou, Rui-Cian Weng, and Tai-Shan Liao, National Applied Research Laboratories, Instrument Technology Research Center, HsinChu, Taiwan
Figure 1 The clock-adjustment circuit generates a series of
pulses that trigger the frame grabbers and the IMU.
PC
RS-232
Micro-controller
Clock-adjustment circuit based
on a CPLD
Clock-adjustment module
Oscilloscope
Externaltrigger
PCI framegrabbers
(2)
Video signal (Camera Link)
Linear CCD image sensors
PCI bus
IMU
Figure 2 This aerial photograph was taken from a height of
7000 ft during a flight over Mailiao Township, Yunlin County,
Taiwan.
Do you have a test idea you’d like to share? Publish it here, and receive $150.
Send your ideas to: [email protected]
Read other Test Ideas at: www.tmworld.com/testideas
TMW1009_027 27 9/9/10 5:39:07 PM

28 SEPTEMBER 2010 www.tmworld.com TEST & MEASUREMENT WORLD
crocontroller also sends commands to the digital-timing-adjustment circuit that change the pulse frequency of the exter-nal trigger.
We optimized the frame rate of the CCD image module using the 15 trig-ger frequencies. The external trigger signal also triggers the IMU to record and store spatial parameters. Figure 3shows the algorithm for finding the optimal trigger frequency. The frame rate and the trigger frequency are lin-early proportional.
The IMU is a key sensor in the sys-tem, and there must be a direct corre-lation between the IMU and the frame grabbers. If the external trigger fre-quency is 1 kHz, then each of the two frame grabbers wil l capture 1000 frames/s and the IMU will sample at 1 ksamples/s.
Through experimental results using aerial photography, we found that the system successfully synchronized all of the sensors. T&MW
Figure 3 Microcontroller software ad-
justs the trigger pulse frequency that
drives the measurements.
End
N
N
N
N
Y
Y
Y
Y
Y
Microcontrollerhandshake check
Record data
Change clock frequency
Frame rate adjustment?
Change frame rate
IMU recorder?
Start
Clock frequency adjustment?
More Performance... Aries ultra high frequency sockets have a mere 1 dB signal loss at up to 40 GHz!!! Center probe and Microstrip sockets deliver more thana half million insertions with no loss ofelectrical performance.
More Choices... Aries offer a full range of sockets for handler-use, manual test and burn-in...for virtually every device type, including the highest density BGA and CSPpackages. Choice of molded or machined sockets for center probe and Kapton interposer models, too!
Less Cost... in addition to extremely competitive initial cost, Aries replacement parts and repair costs beat the competition, assuring you of lowest total cost of ownership.
Less Wait... Aries can deliver the exact sockets you need in four weeks or less!
So why settle? Aries makes it easyto get the world's best test sockets. Call or visit our web site to find out how!
Bristol, PA 19007-6810(215) 781-9956 fax: (215) 781-9845e-mail: [email protected]
www.arieselec.comSensible Solutions... Fast!
ISO 9001Certified
NOW AVAILABLEfor ICs Down to 0.3mm Pitch!
Untitled-1 1 9/24/2009 9:44:28 AM
TMW1009_028 28 9/9/10 5:02:03 PM

TMW1009_029 29 9/9/10 5:02:49 PM

30 SEPTEMBER 2010 www.tmworld.com TEST & MEASUREMENT WORLD
Projecting the
LIGHT
BILLERICA, MA—When lighting designer Kevin Adams designed the lighting for Green Day’s “American Idiot” musical on Broadway, he wanted to illuminate the stage with white light. He found the light he wanted in stage lights that contain LEDs manufactured by Lu-
minus Devices (Ref. 1). Luminus Devices manufactures LEDs that appear not only in
stage lighting, but also in portable projectors, retail stores, homes, and even street lights. They’ve also appeared in projection TVs.
Started in 2002, the Billerica-based Luminus produces LEDs as large as 12 mm2 that produce blue, red, green, and, of course, white light at its foundry in nearby Woburn, MA. Such a large size presents test issues not present in typical 1-mm2 LEDs. Assembly, packaging, test, and engineering take place in Billerica, where engineers design and test the LEDs under conditions that exceed specifications. Those tests assure users of consistent brightness, color, and reliability.
Luminus delivers LEDs packaged on either ceramic sub-strates or on metal-core PCBs (printed-circuit boards). When
an LED is assembled onto metal-core PCBs (Figure 1), Lumi-nus places either a glass window (shown) or a dome-shaped lens (not shown) over the device. The assembly includes a power connector that looks similar to those used in automo-tive fuses. The devices need heat sinks and large pins because they can operate at up to 30 A of forward current. The devices dissipate as much as 150 W, which produces temperatures as high as 150°C at the device junctions.
All that power produces light that’s too bright for a person to look at directly. In fact, the LEDs are so bright that you can easily see them in sunlight. Indeed, engineers were running a life test with LEDs shining through a window on the day of my visit. The online version of this article contains a short video of pulsing light that I took while standing outside the building (www.tmworld.com/2010_09).
Injecting high currentTesting begins when wafers arrive from the fab. A wafer-prob-ing system injects up to 10 A of current for 0.2 ms to 2 ms from a Keithley Instruments SMU (source-measure unit) into
INSTRUMENTSO
N T
HE
ROA
D
ENGINEERS AT LUMINUS DEVICES TEST HIGH-BRIGHTNESS LEDS THAT ILLUMINATE STAGES, SCREENS, STORES, AND STREETS.
BY MARTIN ROWE, SENIOR TECHNICAL EDITOR
TMW1009_030 30 9/9/10 5:03:54 PM

SEPTEMBER 2010 31TEST & MEASUREMENT WORLD www.tmworld.com
RUNNING HEAD
each device. The SMU also measures forward-operating volt-age and reverse-leakage current. “We would like to synchro-nize two SMUs to produce 20-A current pulses,” said test-engineering manager Michael Joffe. “Pumping 20 A through an LED will provide better prediction of a wafer’s quality.”
During a test, a spectrometer detects an LED’s shade of color, including the dominant wavelength—the one that most influences how the human eye perceives color. “We do full spectral analysis on the LED,” said Joffe. VP of engineering Arvind Baliga added, “We screen RGB [red-green-blue] LEDs at the wafer level based on forward voltage, reverse current, dominant wavelength, and brightness. White LED die are binned by color point after screen-ing for forward voltage, reverse current, and brightness.”
Baliga explained that the screened LEDs are then tested for uniformity, which lets engineers detect possible defects; a big LED can have occasional processing variations across its sur-face. When engineers detect defects, they look back through the fabrication process and locate the root cause.
After dice are sorted, they are assembled onto substrates or boards. Products for sale go to production test, but new designs
first go through engineering evaluation. A team of six test engi-neers and technicians develop and maintain test stations for both engineering and for production. They also evaluate new designs.
The test engineers measure LED packages for forward volt-age, reverse current, brightness, and color. They also measure a device’s temperature. They can’t, however, measure an LED’s junction temperature directly. They measure temperature at the most accessible point and calculate junction temperature based on the thermal properties of PCBs, heat sinks, and the devices
FIGURE 1. These red, green, and
blue LEDs can operate at up to
30 A of forward current.Courtesy of Luminus Devices.
In the reliability lab at Luminus
Devices, reliability manager
Scot Solimine (left) runs
accelerated life tests on the
company’s LEDs. Staff engineer
Mike Brown analyzes any
failure modes and suggests
corrective actions.
AD
RIE
N B
ISS
ON
TMW1009_031 31 9/9/10 5:04:05 PM

32 SEPTEMBER 2010 www.tmworld.com TEST & MEASUREMENT WORLD
INSTRUMENTS
themselves. Temperature and forward current affect an LED’s light intensity and color.
The engineers test LEDs using both pulsed and direct current. Testing LEDs at 30 A is more difficult than testing at, say, 1 A, particularly with pulsed cur-rent, because the shape of the current waveform affects LED performance. For example, overshoot will change the av-erage intensity of the LED in the period when the LED is on.
Testing large LEDsDedicated test equipment isn’t always available to engineers developing new technologies such as the 12-mm2 LEDs. “You can’t buy COTS [commercial off-the-shelf] test equipment for our high-current devices,” said Baliga. Thus, the test engineers at Luminus have to design, assemble, program, debug, and calibrate testers in house. Figure 2 diagrams a test system used in production and in engineering.
An integrating sphere is the heart of the tester. Its detector converts light from the LED into a voltage that a National Instruments data-acquisition card can digitize. That lets the tester measure light intensity. An optical fiber attached to the sphere transfers light to a spectrometer that measures
the LED’s optical spectrum and dominant wavelength.
The size of the sphere affects the reso-lution and accuracy of the light measure-ments. Test stations for production and engineering use 12-in. diameter inte-grating spheres. An R&D test station uses a 20-in. sphere, while stations that sort devices use 4-in. spheres.
Test stations also need fixtures, and Luminus engineers must design fixtures that cool the LEDs’ 150 W of heat. “That’s as much heat as in a profes-sional-grade soldering iron,” said Joffe. Furthermore, the LEDs must be tested under consistent current and tempera-ture conditions. The test fixtures are water cooled, and the engineers have designed mechanical fixtures that pro-vide consistent contact with heat sinks.
Engineering test stations must be flex-ible enough to test an LED regardless of its mechanical configuration. Engineers
need to test devices mounted on boards with heat sinks or on de-vices in die form. The Luminus engineers designed an engineer-ing test station that lets an expe-rienced test operator run auto-mated tests of 100 LEDs. A two-axis stage moves the LED under test into position under the integrating sphere. The test operator controls the stage to correctly position each LED under the sphere.
Test engineer Aaron Plaisted is one of three test engineers who build test stations. In the engi-neering lab, test stations need flexibility to accommodate new device packages. A custom PCB holds the LEDs and routes cur-rent to LEDs under test. A TDK-Lambda DC power supply pro-vides current to an LED under
test. The test engineers designed drive circuits controlled by pulses from a Na-tional Instruments multifunction data-ac-quisition card that route the current to an LED. “We test LEDs at current up to 36 A,” said Plaisted. Precision 0.3-Ω, 10-W power resistors (Figure 3) in series with the driver circuits let engineers measure the current flowing into the LED under test with a data-acquisition card.
Because HB (high-brightness) LEDs are relatively new, their fabrication pro-cesses are not as mature as those of most semiconductors. Process engineers are still learning how to optimize produc-tion processes, and they rely on data from test engineers, reliability engineers, and failure-analysis engineers.
Finding where it failsYou probably expect incandescent bulbs to fail, but not LEDs. While LEDs can last for years, they still need reliability
testing. LEDs can lose bright-ness over time, so even if an LED is still producing light, a user may perceive it as having failed if the light output di-minishes. That’s where reli-ability manager Scot Solimine and s ta f f engineer Mike Brown come in.
Solimine spends much of his time in the reliability lab, which houses banks of LEDs
FIGURE 3. Power resistors in series with LEDs produce a volt-
age used to measure LED current.
Spectrometer Optical fiber
Motion control to stage
Power supplies
Driver circuits
LED under test
Light from LEDenters sphere
PWM
RS-232
DetectorPXI data-acquisition card (analog inputs)
PXI data-acquisition card(digital outputs)
Integrating sphere
LabView test software
Two-axis stage
Test fixture
PC
FIGURE 2. A test system consists of an integrating sphere that captures light from an LED
under test. A custom driver circuit provides pulsed current up to 30 A.
TMW1009_032 32 9/9/10 5:04:16 PM

SEPTEMBER 2010 33TEST & MEASUREMENT WORLD www.tmworld.com
under test (Figure 4). (Cov-ers over the LED banks dif-fuse the bright light so it won’t hurt anyone’s eyes.) Solimine runs reliability tests on lots of about 100 devices assembled from at least three wafers. He typically tests about 20 devices for a particu-lar condition such as acceler-ated aging, temperature, vi-bration, shock, or humidity.
“Customers think LEDs should last for 25,000 hr and retain 30% of their bright-ness,” he said. But 25,000 hr would make for a long test, so Solimine tests LEDs for 6000 hr, after which time an LED should retain at least 92% of its brightness. Figure 5 shows a typical plot of brightness over time.
The Department of Energy and the Environmental Protection Agency have developed a new test standard called LM-80, which specifies the methodology to be used in determining LED lifetime and
reliability. Lighting manufacturers must show evidence of conformance to the LM-80 standard in order to receive En-ergy Star approval (Ref. 2).
Solimine assesses reliability using ac-celerated life testing. That lets him achieve 10 years’ worth of life-testing data in a few months. He may have to sign off on a design after just 2000 hr of
testing, but the customer may expect 60,000 to 70,000 hr of life from a device.
Accelerated testing on HB LEDs involves driving them harder than most customers do. For example, a customer may drive a 30-A LED with a 25% or 50% duty cycle at 360 Hz, so Solimine will test parts with continuous DC current. He also raises the ambient temperature to see how it af-fects brightness and LED life.
Combinations of junction temperature and current let him develop reliability mod-
els. In some tests, Solimine will raise de-vice junction temperatures to 220°C just to see how an LED responds. Most tests use junction temperatures between 150°C and 180°C.
“If you run at temperatures that are too high, you could uncover failure modes that customers will never see,” said Solimine. “We usually try to test at
FIGURE 4. Banks of LEDs in the relaibility lab may run for 6000
hr or longer.
www.vtiinstruments.com
Never Compromise Signal Integrity
Expect signal transparency from your next switching system.
VTI’s proven switching capabilities are demonstrated in every major ATE system worldwide.
Learn more about how the scalable EX1200 Switch, Measure and I/O Platform can improve your test system performance today.
www.vtiinstruments.com/EX1200.aspx
© 2
010
VTI
Inst
rum
en
ts C
orp
ora
tion
. A
ll rig
hts
rese
rve
d.
EX71HD
SSSCSCSCSCSSSCS AAALALLAAABBLE
FLF EXXIIBI LE
HHIGH DENSITTYY
MOODULARR
Source Instrument Unit Under TestSwitch
NOISE
CROSSTALK
INSERTION LOSS
IMPEDANCE MISMATCH
EX12EX126262
EX12EX126666
EX12EX126868
TMW1009_033 33 9/9/10 5:39:54 PM

34 SEPTEMBER 2010 www.tmworld.com TEST & MEASUREMENT WORLD
INSTRUMENTS
junction temperatures about 20% over published specifica-tions.” The same applies to current, which is why he tests LEDs rated for 30 A at 36 A. He may test smaller LEDs (3 A to 9 A) at twice their rated forward current.
Although Luminus engi-neers test their LEDs under conditions that exceed pub-lished specifications, some customers exceed even those conditions. One customer pumped 40 A through the LEDs. They failed.
When Solimine tests LEDs under continuous current, he can use a single TDK-Lambda power supply to test as many as 40 de-vices connected in series because it has enough voltage to keep the LEDs for-ward biased (each LED drops about 4 V). In total, the lab has about 100 kW of electrical power for driving devices.
Solimine runs reliability tests under conditions that stress an LED more than most customers. But customers keep finding new LED applications. Solimine has added tests as new applications arise. For example, he runs one test using 30 A pulsed current for 0.2 s on and 1.2 s off, which is more like a thermal cycle com-pared to running them at 360 Hz, because at that frequency, the LED is on for much shorter periods. Other tests run at low current with high ambient temperatures, while others run at high current.
Not all of the current pumped through an LED produces light. An LED’s cir-cuit model is a resistor in parallel with a diode. Thus, a shunt current passes through the resistance, not through the diode. When running at low current, say 2 A, a shunt current of 500 mA can make a difference in reliability because 25% of the current doesn’t illuminate the LED. Another customer, however, may run the same device at 30 A. There, a loss of 500 mA is less significant. An LED’s shunt resistance increases over time, which fixes the leakage problem.
Failure modes for large devices are dif-ferent from those for small devices. For example, a defective area that causes fail-ure of a 1-mm2 LED may have little im-pact on the performance or reliability of a large Luminus LED, but larger defect areas
increase the likelihood of failures. Figure 6 shows the difference between an ac-ceptable device and a failed one.
Learning from failuresWhen failures occur, Solimine relies on staff engineer Mike Brown to analyze them. Brown analyzes failure modes both from internal tests and from field returns. He looks for repeat failure modes and makes suggestions on corrective actions.
Brown, who has worked at Luminus since 2003, explained, “When we started, we didn’t understand the failure modes of the devices. Our wafers may have 70 dif-ferent layers of doping in the layers, any one of which can go out of control. We’ve discovered and fixed numerous failure modes over the years and spent much time analyzing failures to learn about them.”
As Brown learned more about failure modes, he could recommend better ways to test production parts. At one time, Luminus would burn-in 100% of its
production products until engineers learned to better control the manufacturing process. That improved wafer yield, but still left failure modes caused by packaging. Thus, Brown and other Luminus engi-neers had to learn how packaging caused failures and how to fix them.
“As we’ve increased pro-duction, we’ve learned how to minimize failures in less time. We used to burn-in for 4 hr. Today, we can get reliable products with a 5-min stress test.” Brown has uncovered packaging-
related failure modes such as those caused by epoxy.
Baliga, the VP of engineering, em-phasized that with each new product, Luminus engineers encounter fewer fail-ures because they’ve learned how to minimize them. Still, new failure modes occur as customers try new applications. Brown noted that Luminus engineers learn a great deal from customers and how to fix new failure modes. “Each new application is an opportunity to learn about failure modes,” he said. Some customers use the LEDs with low current for best efficiency while others want the highest power.
What is a failure? Customers have dif-ferent expectations. To some customers, a loss in brightness constitutes a failure. The amount of acceptable brightness loss also differs among customers. One user has an end-of-life specification of a 50% drop in brightness. Another might con-sider an LED to have failed if it loses
FIGURE 6. Uniformity tests reveal the light intensity across a device’s surface. These
images show (left) acceptable uniformity and (right) a failed device.
FIGURE 5. An LED’s brightness degrades slightly over time. A
device is deemed acceptable if it retains 92% of its brightness
after 6000 hr of use. Courtesy of Luminus Devices.
0%
10%
–10%
–20%
–30%
0 2000 4000 6000 8000 10,000
Time (hours)
Cha
nge
in p
hoto
met
ric p
ower
TMW1009_034 34 9/9/10 5:04:23 PM

SEPTEMBER 2010 35TEST & MEASUREMENT WORLD www.tmworld.com
10% of its brightness in the first year, which is why Luminus engineers specify an 8% dropoff in one year to be a failure mode. To others, only a complete loss of light is a failure.
Over time, Brown has developed a li-brary of failure modes by intentionally overstressing the company’s LEDs. Be-cause of that experience, he can often tell the failure mode just by looking at the de-
vice, such as when that customer pumped 40 A through an LED. He also found one customer who was pumping too much current through a device without realiz-ing it. The customer eliminated the prob-lem by changing driver circuits.
Luminus engineers also try to emulate customer applications. The video of the pulsing light in the online version of this article shows one example. The pulsing pattern is unique to a particular cus-tomer, so engineers ran that pattern on an LED 24 hr a day to find where it might fail. Given the brightness of the LED, its light illuminates the parking lot at night during such tests. Fortunately, there are no homes across the street, so it doesn’t bother anyone. T&MW
REFERENCES1. “LD Kevin Adams Uses VLX Wash for ‘American Idiot,’” Projection, Lights and Staging News, July 2010. www.plsn.com.
2. IESNA LM-80-08, “IES Approved Method: Measuring Lumen Maintenance of LED Light Sources,” Illuminating Engineering Society, New York, NY. www.ies.org.
LEDs can generate as much heat as a professional-grade soldering iron, according
to test-engineering manager Michael Joffe (right). Test engineer Aaron Plaisted com-
mented that Luminus tests LEDs at current up to 36 A.
AD
RIE
N B
ISS
ON
Smart Measurement SolutionsSmart Measurement Solutions
Wideband Injection Transformer B-WIT 100
More at www.omicron-lab.com
Optimized for signal insertion into • control loops of any kind
Extremely wide frequency range • (1 Hz – 10 MHz)
Fully 600V CAT II compliant output •
Teams up perfectly with • OMICRON Lab’s Vector Network Analyzer Bode 100
The B-WIT 100 One injection transformer for all applications.
How stable is your switched mode power supply?
Vector Network Analyzer Bode 100 (1 Hz – 40 MHz) with Future.Pad Tablet PC from www.ibd-aut.com
TMW1009_035 35 9/9/10 5:04:28 PM

Connect to your test equipmentdirectly from MATLAB ® using standardcommunication protocols and hundredsof available instrument drivers.
Analyze and visualize your test resultsusing the full numerical and graphicalpower of MATLAB.
For more information on supported hard-ware, visit www.mathworks.com/connect
© 2010 The MathWorks, Inc.MATLAB is a registered trademark of The MathWorks, Inc. Other product or brandnames may be trademarks or registered trademarks of their respective holders.
MATLABCONNECTS
TO YOUR TESTHARDWARE
Agilent
Tektronix
LeCroy
Rohde & Schwarz
National Instruments
Anritsu
Keithley
Yokogawa
Tabor
Pickering
GPIB
LXI
IVI
TCP/IP
VISA
USB
UDP
RS-232
Untitled-1 1 3/26/2010 11:30:22 AM
TMW1009_036 36 9/9/10 5:04:38 PM

SEPTEMBER 2010 37TEST & MEASUREMENT WORLD www.tmworld.com
SEMICONDUCTOR TEST
As markets for display backlighting and solid-state lighting grow, equipment vendors adapt to meet the needs of a rapidly changing industry.
Rapid market growth for HB (high-brightness) LEDs is driving what was once a niche in-dustry into full-fledged high-volume pro-
duction. With the emergence of applications such as display backlighting, and with the brass ring of SSL (solid-state lighting) almost within reach, some analysts are projecting a CAGR (compound annual growth rate) of greater than 30% over the next sev-eral years (Ref. 1).
New players are scrambling to enter the market, and established manufacturers are retooling to compete for their share of the new business. The rapid growth is adding complexity to an already complicated IP (intellectual-property) landscape. New device architectures, materials, and processes are being introduced—in some cases to get around existing IP and in others to attain a cost or perfor-mance advantage over the competition (see “A
growth industry” in the online version of this ar-ticle at www.tmworld.com/2010_09).
These factors combined with a shortage of indus-try standards and the lack of a common technology roadmap present major challenges for manufacturers of equipment used in LED production. This is cer-tainly true for the providers of wafer-level test sys-tems, which are used for in-process testing of optical and electrical properties for each die on every HB LED wafer produced. New equipment must accom-modate the range of test configurations found across the spectrum of manufacturers. At the same time, the equipment must keep the cost of test low to help reduce the overall cost of LEDs and contribute to the successful adoption of LED technology in consumer applications.
LED manufacturers need equipment that is de-signed especially for LED test, because general-pur-pose test equipment that requires significant customi-zation results in unacceptable levels of R&D spending. Likewise, repurposing semiconductor test equipment for LEDs imposes a similar overhead—the effort needed to modify the equipment would distract LED manufacturers from their actual objective.
LED test equipment should have a modular and flexible design so it can support the broad and chang-ing needs of LED manufacturing. Purpose-built tools, integrated with all necessary instrumentation and automation, will provide improved cost of own-ership and will allow LED manufacturers to focus on the production of LEDs (see “Manufacturing in tran-sition,” in the online version of this article).
In-process testTesting of in-process LED devices to determine their characteristics is an essential element of the manufac-turing process. In-process testing is conducted for a number of purposes at both the wafer level and the die level. The full test suite varies from manufacturer to manufacturer, but all manufacturers include tests
LED testBY BRYAN BOLT, CASCADE MICROTECH
Integrating sphere
Integrating chuck and stage
Probes
LED wafer
SMU
Spectrometer
FIGURE 1. Typical wafer-level LED test components include a wafer
prober, an SMU (source measure unit), and probes to apply an electri-
cal current to the DUT (device under test) and to measure its electrical
parameters. An LED test system also includes light-collection optics,
such as an integrating sphere or optical fiber, and a spectrometer to
measure the spectral output and optical power of the DUT.
TMW1009_037 37 9/9/10 5:05:41 PM

38 SEPTEMBER 2010 www.tmworld.com TEST & MEASUREMENT WORLD
SEMICONDUCTOR TEST
to identify defective dice and to deter-mine electrical properties, optical power output, and spectral output for each die (see “White-light LEDs,” p. 40).
The typical setup used for LED mea-surements (Figure 1) consists of a wafer prober, an SMU (source-measure unit), and probes that apply an electrical cur-rent to the DUT (device under test) and measure its electrical parameters. An LED test system also includes light-col-lection optics, such as an integrating sphere or optical fiber, and a spectrom-eter to measure the spectral output and optical power of the DUT.
Testing takes place throughout the value chain, including at the epi-houses that produce and sell undiced LED wa-fers (epi-wafers), packaging houses that dice and package chips from procured epi-wafers, and vertically integrated LED manufacturers that carry out all process steps from bare wafer through packaged device. Each die may be tested up to four
times before the packaged device is qual-ified and ready for sale.
After epitaxial film growth, lithogra-phy, and metallization, the wafer is pop-ulated with thousands or tens of thou-sands of operat iona l LED chips , depending on device and wafer dimen-sions. At this point, each die is tested for functionality, and results are recorded to a wafer map to ensure that no avoidable downstream process costs, such as pack-aging, are wasted on bad dice. Initial functionality may be determined by a simple light/no-light test, or it may be determined on the basis of electrical and optical performance criteria.
Because subsequent wafer-processing steps could affect a device’s characteris-tics, a manufacturer may choose to test device performance at several additional points. For example, after wafer dicing, stress relief of the device and changes in geometry can alter flux output, spectral output, and the light-extraction effi-
ciency of individual dice. Therefore, testing is sometimes performed on the diced wafer mounted to a film-frame carrier to ensure the best possible mea-surement accuracy. Similarly, processes such as laser lift-off, which involves transferring of the LED’s active film layers from one substrate to another, can alter device performance and may necessitate another round of test. Test-ing of white-light LEDs may be per-formed before and after application of the phosphor that is used to produce a broad (white) spectral output from blue or ultraviolet LEDs. Finally, packaged devices must undergo a last round of testing to account for performance changes encountered during the pack-aging process.
The requirement for this substantial test burden is driven by the demanding applications that will ultimately make use of the LEDs. The human eye is remark-ably sensitive to variations in color and
...
...
...
...
...
End of test
Busy
Move tonext die
Opticalmeasurement
Electrical test
Drive current
Start of testDepends on handler
One cycle
<15 ms
Flow time
Depends onNPLC setting
Optional delay
>18 msIntegration
readout time
End of test
Busy
Move tonext culster
Opticalmeasurement
Electrical test
Drive current
Start of test
Total test time
1 2 3 4 16
FIGURE 2. These timing diagrams for (left) single-die test and (right) multidie test show that a time-consuming move to the next
test region is performed after every die for single-die testing, but only once for every 16 dice tested using multidie test.
TMW1009_038 38 9/9/10 5:05:49 PM

LOWEST COST 12-BIT MULTIFUNCTION USB-1208 Series
• 8 analog inputs
• Up to 50 kS/s sampling
• 2 analog outputs
• 16 digital I/O, counter
• From $129
Low Cost Data Acqu i s i t ion
TEMPERATUREUSB-TEMP Series
• Measure thermocouples, RTDs, thermistors, or voltage
• 24-bit resolution
• 8 channels
• From $329
16-BIT MULTIFUNCTION USB-1608FS
• 8 analog inputs
• 200 kS/s simultaneous sampling
• 8 digital I/O, counter
• $399
14-BIT MULTIFUNCTION USB-1408FS
• 8 analog inputs
• 48 kS/s sampling
• 2 analog outputs
• 16 digital I/O, 1 counter
• $249
OEM HIGH SPEED USB-2500 Series
• 1 MS/s sampling
• Up to 64 analog inputs
• Up to 4 analog outputs
• 24 digital I/O, 4 counters
• From $899
DIGITAL I/O USB-1024LS
• 24 digital I/O lines
• Based on industry standard 82C55
• 32-bit event counter
• High-drive models available
• $99
©2010 Measurement Computing Corporation, 10 Commerce Way, Norton, MA 02766 • [email protected]
The Value Leader in Data Acquisition
Download our new2010 Product Selection Guide
www.mccdaq.com/selguide
All modules include easy to use TracerDAQ® software plus support for Visual Studio®, Visual Studio®.NET, NI LabVIEW™, and DASYLab®. Support for MATLAB® and Linux® is also available.
(800) 234-4232
TMW1009_039 39 9/9/10 5:41:55 PM

40 SEPTEMBER 2010 www.tmworld.com TEST & MEASUREMENT WORLD
SEMICONDUCTOR TEST
Two principal methods exist for producing white light using LEDs (Ref. A). In the first method, red, blue, and green chips are combined to achieve a broad color gamut. LEDs made using this method can achieve excellent results for color rendering, but it may be difficult to maintain proper color mix-ing over the life of the lamp due to differing degra-dation rates between the three components.
The second method, which is more commonly used for solid-state lighting applications, is based on a single LED and a phosphor (Figure A). Most often, a blue GaN or InGaN LED is coated with a phosphor such as Ce:YAG (cerium doped yttrium-aluminum-garnet).
Blue light emitted by the LED undergoes Stokes scattering in the phosphor to create a broad output spectrum like that shown in Figure B. Note the large blue peak from the light which makes it through the phosphor without being Stokes shifted.—Bryan Bolt
REFERENCEA. Schubert, E.F., Light-Emitting Diodes, 2nd ed., Cambridge University Press, Cambridge, UK, 2006.
White-light LEDs BlueGaN LED
Phosphorcoating
Wavelength (nm)
GaN or InGaN LED
Ce: YAG
0
25
50
75
100
Inte
nsit
y (A
U)
300 350 400 450 500 550 600 650 700 750 800
FIGURE A. (right) This
white LED includes a single
blue GaN chip with a phos-
phor coating instead of
red, blue, and green chips.
FIGURE B. (above) Stokes scattering of blue light results in this
output spectrum, with intensity shown in AUs (arbitrary units).
www.chronologic.com.au +61 8 8410 5955
TMW1009_040 40 9/9/10 5:42:01 PM

SEPTEMBER 2010 41TEST & MEASUREMENT WORLD www.tmworld.com
competing companies in this space have led to wide variability even in areas where some level of standardization might be expected.
One example is the wide range of substrates used across LED manufactur-ing, which places considerable demands
on the wafer-handling subsystems of manufacturing equipment. Most of the current LED production is carried out on 2-, 3-, and 4-in. wafers. Some manu-facturers will introduce 6-in. processes this year, while others are discussing 8-in. and beyond for the near future.
intensity. For colors near the peak of the visual wavelength-discrimination func-tion, variations of 1 or 2 nm can be de-tected by the eye. The eye can also see intensity variations as small as 1% or 2% under ideal viewing conditions (Ref. 2).
According to Sudhakar Raman, VP of business development for Veeco’s LED/Solar MOCVD business, “The epitaxial process defines wavelength and initial brightness.” Raman added, “Variations in the epitaxial growth conditions during processing can show differences within each wafer, wafer to wafer, run to run, and tool to tool. These contributors can result in signifi-cant variations in color and intensity for older processes, while state-of-the-art processes and equipment can achieve yield variation of <10 nm for color and <10% for intensity.”
When LEDs are used in arrays such as those used to illuminate a room or the taillight of an automobile, die-to-die variations in color and intensity can be visible to the observer and lend a non-uniform appearance to the illumi-nation. Although process improvements have been significant in recent years, die-to-die variations in color and in-tensity are still at levels that are easily detected by the human eye. Testing and sorting is therefore required to make use of the maximum number of dice produced. This sorting process, called binning, ensures that all LEDs in a given lot will meet customer require-ments for color, output power (flux), and electrical properties. Tightly binned LEDs command higher prices due to the added value they offer consumers. The need for tight binning, among other factors, is pushing demand for higher and higher test accuracy.
Challenges for equipment suppliersA range of new device technologies, along with increasing demands for per-formance, contributes to the challenges faced by manufacturers of LED produc-tion and test equipment. In addition, the lack of a clear LED technology roadmap that is consistent from manufacturer to manufacturer translates into uncertainty regarding the features that will be needed to serve the majority of the customer base. Innovations spurred by the many
TMW1009_041 41 9/9/10 5:42:11 PM

42 SEPTEMBER 2010 www.tmworld.com TEST & MEASUREMENT WORLD
SEMICONDUCTOR TEST
Sapphire is the leading substrate mate-rial, SiC is in production with some manufacturers, and processes based on bulk GaN, silicon, and other materials are also in the works. Devices may need to be tested on noncircular submounts, thinned wafers, or diced wafers as well.
Unlike with most silicon-semicon-ductor equipment, new offerings for LED must often serve legacy technolo-gies (for example, 2-in. wafers) yet also meet the latest requirements for perfor-mance, such as higher throughput or in-creased accuracy. Wafer-level test sys-tems must accommodate a number of other configuration variations. For ex-ample, some devices require electrical contact on the top surface, while others require top and bottom side contact. Optical test for devices built on transpar-ent substrates may require light collec-tion to be made from beneath the wafer, while opaque substrates force light col-lection to be performed above the wafer surface. Device dimensions ranging from around 250 μm up to 10 mm wide re-
quire significantly different collection optics to effectively sample light from across the spatial and angular ranges of their outputs. HB LED drive currents range from hundreds of milliamps to sev-eral amps with accompanying output fluxes varying similarly (Ref. 3).
Many areas of uncertainty and incon-sistency can be found throughout LED manufacturing (see “A lack of standards,” in the online version of this article). For LED test, the top priorities are to con-tinue to improve test accuracy while sig-nificantly driving down the cost of test.
Reduction in equipment COO (cost of ownership) will be a critical step in
bringing down the cost of LED technol-ogy. According to the US DOE SSL Manufacturing Roadmap, a 2X im-provement in COO every five years is the recommended target (Ref. 4).
Improving throughput is a key factor in improving COO for wafer-level test sys-tems. One way to do this is by performing multidie test rather than traditional single-die test. In multidie test, a probe card con-tacts a number of dice simultaneously. Electrical test may be performed sequen-tially or in parallel by the use of multiple SMUs. Optical test is performed sequen-tially to avoid optical crosstalk between adjacent dice under test.
ON THE WEBThe online version of this article includes sidebars that discuss the rea-sons the market for LEDs is burgeoning (“A growth industry”), the
need for new tools for LED production (“Manufacturing in transition”), and a proposed new standard for evaluating LED quality (“A lack of standards”). www.tmworld.com/2010_09
Details at in-phasetech.com
Imagine testing 72 ports of a DUT faster and more accurately than manually testing a 4-port device. Now you can: Our new multiport, multimode, multi-smart ATS combines sophisticated hardware with advanced software to offer these special advantages:
• Unique high performance switch matrix routes multiple ports of a DUT to measure all S-parameters and isolation between any DUT ports
• Full 12-term error correction at the measurement plane; each path can be calibrated in less than 1 minute (60 minutes’ maximum calibration time for all 72 paths)
• Wide operating fl exibility—DC to 18 GHz; 1.28:1 VSWR typical with discrete microwave frequencies on request
• “Smart” software permits fast, easy confi guration changes to test new devices and for instrument control, data acquisition, and signal processing with multiple format test reports
EXTREME
Untitled-1 1 3/3/2010 10:32:50 AM
TMW1009_042 42 9/9/10 5:42:15 PM

SEPTEMBER 2010 43TEST & MEASUREMENT WORLD www.tmworld.com
Because only a single wafer-stage move is required for each group of LEDs contacted by the probe card, multidie test reduces test time while still provid-ing sufficient integration time for optical measurements (Figure 2). Depending on cluster size and test parameters, throughputs as high as 70,000 dice per hour may be achieved on multidie test systems such as the Cascade Microtech BlueRay.
Additional reductions in COO can be realized by increasing the level of test-system automation. Even in low-cost regions, the labor cost associated with manual loading and alignment of each wafer is too high for high-volume pro-duction. Test systems must take over some of the repetitive tasks that are com-monly performed manually today.
Equipment makers will play an im-portant role in contributing to the overall cost reductions that are needed to enable mass adoption of LED light-ing. As processes, technologies, and standards continue to mature, test man-ufacturers must remain agile and con-tinue to cooperate with customers and other industry suppliers in order to pro-vide lasting solutions. T&MW
REFERENCES1. Steele, B., “High Brightness LED Market Review and Forecast,” Strategies in Light 2010 conference, Santa Clara, CA, February 2010.
2. Hecht, Selig, “A Theory of Visual Intensity Discrimination,” The Journal of General Physiology, pp. 767–789, May 1935. www.jgp.rupress.org.
3. Steward, B., “High Power LEDs for Solid State Lighting: Status, Trends, & Chal-lenges,” Known Good Die Packaging and Test Workshop, 2008. www.napakgd.com/2008.
4. US Department of Energy, “Solid-State Lighting Research and Development: Manu-facturing Roadmap,” July 2010.
Bryan C. Bolt is technology development manager for test systems at Cascade Micro tech, Beaverton, OR. He has worked in the fields of optics and semiconductor capital equipment since 1988 in various engineering and technical management roles with companies including Etec Sys-tems, Applied Materials, ESI, and Novel-lus Systems. He holds a PhD in electrical engineering from the University of North Carolina at Charlotte and is a licensed professional mechanical engineer in the state of Oregon.
DESIGNING WITH LEDS WORKSHOPRosemont, Il • September 29
Spend a day with EDN and Design News to learn how HB LEDs save power, reduce space, and shape light into unlimited colors.
www.leds.edn.com/events
.
The MIROeX is the high-speed camera that’sastonishingly easy to use. Simply point and shoot.
Miro’s bright touchscreen LCD lets you immediatelysee what no ordinary camera can show you.
Measure. Analyze. Characterize.
The rugged lightweight Phantom Miro comes withLCD control, compact fl ash, powerful software, &
network capability. High-g certifi ed models are also available.
The Miro Accessories Kit offers a complete set gear including 4 c-mount lenses, cables, battery charging system and lights in a rugged Pelican Carry case.
Visit our web site today www.visionresearch.com/go/quality
100 Dey Road, Wayne, NJ 07470, USA P: 1.973.696.4500 TF: 1.866.450.PHANTOM
D I G I T A L H I G H - S P E E D C A M E R A S
Product Development?Characterizing materials?
Trouble shooting high-speed equipment?The Phantom MIROeX belongs in your T&M toolkit
digital high-speed cameras
Phantom
Untitled-1 1 4/5/2010 3:37:03 PM
TMW1009_043 43 9/9/10 5:42:24 PM

pickering
Want to know more about either LXI or PXI? Pickering has two publications to help you get started. Get your free copies by registering at either
or
40-870 SeriesRF Multiplexers and Matrices
40-922-0017 Slot PXI Chassis
40-923-00118 Slot PXI Chassis
40-569 Resource Distributor Matrix
40-592 HD FIBO Matrix
40-736Data Communications
MUX40-194
20A Fault Switch
60-310LXI High Voltage Matrix 2-Pole
60-550LXI High Density EMR Matrix
TMW1009_044 44 9/9/10 5:05:58 PM

PXIT E S T R E P O R T
PXI TEST REPORT • SEPTEMBER 2010 45w w w . t m w o r l d . c o m
September 2010
Arrestor systems on aircraft carri-ers can help planes that are dam-
aged or have mechanical issues come to a safe landing. Testing such systems without endangering plane and pilot, however, requires a specialized facility. The design team at Process Automa-tion used PXI to create an HIL (hard-ware-in-the-loop) tester to minimize the time needed to test an arrestor con-trol system. I spoke with automation systems consultant Greg Sussman to learn more about the application.
Q: What is an aircraft arrestor?A: The arrestor is used on military land-based runways to provide braking assistance for a safe and controlled stop during landings. A hook on the aircraft catches a cable that crosses the runway. On both ends of the cable are about 1200 ft of heavy nylon mesh tape wound onto reels that have disc brakes under the control of an embedded con-trol system. The system measures the aircraft’s speed and determines its re-sponse to the applied braking so it can compensate for the differences in mass of various aircraft and apply an appro-priate braking algorithm for a con-trolled deceleration.
Q: What was Process Automation’s role in the development of this system?A: The system’s vendor, Zodiac Aero-space, called us to design a replacement for the system’s electronic controls, which were based on components that had gone out of production. The new system design used the National Instru-ments Compact RIO hardware platform.
Q: What was the role of PXI?A: We used PXI as the platform for an HIL test system during debug of the control system and software. The tester provided a real-time simulation that emulated the physical plant’s response to the controller. The tester looked like the real hardware to the controller and contained a model of both the system and the aircraft physics during a land-ing. If, for instance, the controller sent a command to change the disc brake control valve setting, the tester would read the signal from the controller and then return signals from the virtual physical plant showing how it and the aircraft responded. We could simulate normal operation for various aircraft and landing scenarios and also simulate a defined set of failure conditions to make sure the controller design was right before committing to field test.
Q: What was the advantage of using this approach?A: Obviously, it is too risky to debug a system on real aircraft landings, but there is a test facility that uses jet sleds to accelerate a dead load sized to simu-late various aircraft and landing speeds. Scheduling time at the facility, however, requires long lead times, and test time is
expensive—$50,000 a day—so it made sense to minimize the facility test time by wringing out the design as much as possible ahead of time. With the tester, we reduced our facility use to five days for the new design from the 20 days that were needed for the prior design.
Q: Why use PXI?A: Other platforms would have needed custom hardware, external PCs for the user interface, and external racks of equipment. With PXI, we were able to put everything into a sin-gle, four-slot chassis for less than half the cost and with less risk than VME or VXI. A multicore controller with NI’s Hypervisor let us run Windows on one core for the user interface and VxWorks on the other three cores for the real-time simulation. An FPGA board provided custom signals as well as analog I/O for the control interface.
Q: Any recommendations for other HIL test developers using PXI?A: A good system model is the corner-stone of HIL testing. If the model is not accurate, then your testing is flawed from the outset. Tools like NI’s System Identification Toolkit can help you de-velop that model for a PXI system.
PXI snags savings with HIL testBy Richard A. Quinnell, Contributing Technical Editor
Greg SussmanAutomation Systems ConsultantProcess Automation
46 Guest commentary
46 Editor’s note
47 Care required when PXI serves medicine
48 AXIe stakes claim as PXI’s “big brother”
INSIDE THIS REPORT
TMW1009_045 45 9/9/10 5:06:42 PM

PXI T E S T R E P O R T
46 SEPTEMBER 2010 • PX I TEST REPORT w w w . t m w o r l d . c o m
G U E S T C O M M E N T A R Y
E D I T O R ’ S N O T E
The US and other military services across the globe are
large users of ATE (automatic test equipment). With
the electronics content for communications, avionics,
weapons, and many other military systems constantly ex-
panding and becoming more complex, military depots and
other maintenance and repair organizations
are expanding their test needs. In the past,
mil/aero test systems have relied upon a va-
riety of platforms and standards including
GPIB and VXI, but new technologies and
platforms are emerging as preferred replace-
ments for GPIB and VXI. In particular, the continued
growth of PXI for commercial and mil/aero test applica-
tions has been impressive. In a December 2008 report,
Frost & Sullivan forecast an annual growth rate in excess
of 17% per year for PXI and estimated that 100,000 PXI
systems would be deployed by the end of 2009.
The continued growth and acceptance of PXI bodes
well for the mil/aero ATE market. With this growth comes
the increased selection and diversity of vendors and
products, further benefi ting the market and offering users
a range of options and technologies. Today, PXI instru-
ment vendors offer a broad range of capabilities, ranging
from high-precision 7.5-digit DMMs (digital multimeters)
to microwave instrumentation that is capable of address-
ing both legacy and future electronic warfare applica-
tions. And in the performance digital space, there are
now products that support the full range of capabilities
needed for LRU (line-replaceable unit) and SRU (shop-
replacement unit) test applications.
PXI has also found its way into the world of opera-
tional-level and fl ight-line test applications. Today, you
will fi nd PXI-based test systems on the front lines in Af-
ghanistan and Iraq, supporting the war fi ghter with fi eld
testing of weapons systems and aircraft as well as sup-
porting next-generation aircraft such as the F-35.
PXI’s compact footprint, coupled with its performance
and instrumentation offerings, makes it the platform of
choice for next-generation mil/aero test systems. And
with the continued growth of the PXI market, the adop-
tion of the PXI architecture for future mil/aero ATE offers
users the opportunity to deliver cost-effective and robust
next-generation test solutions.
Mike Dewey is senior marketing product manager for Geotest—Marvin Test Systems and has been active in the test and measurement industry for more than 25 years, holding positions in design engineering, engineering manage-ment, marketing, and product management with Geotest, GenRad/Teradyne, ADR Ultrasound, and Motorola Government Electronics Group. He is a senior member of the IEEE and has served as a board member for the PXI System Alliance, the VXI Consortium, and the LXI consortium. [email protected].
PXI moves to the forefront for mil/aero applications
By Mike Dewey, Geotest—Marvin Test Systems
In praise of backward thinking
By Richard A. Quinnell, Contributing Editor
Brain tickles can be fun. They
happen when your thinking was
going along one path and you sud-
denly recognize that your thinking
could go along an entirely new path
that you didn’t see be-
fore. It’s the “aha” mo-
ment when new possi-
bilities suddenly pres-
ent themselves that
can make engineering
very satisfying.
The conventional view of PXI
technology is as an information-
gathering platform. PXI systems
may generate stimulus signals, but
their main purpose is the acquisition
of data. But thinking backward about
PXI can be a brain tickle that opens
up new possibilities in test.
You could use a PXI-based sys-
tem to receive stimulus signals and
to generate, not acquire, data. In-
stead of an information-gathering
unit, the PXI chassis becomes a
simulator.
Such use of PXI appears twice in
this issue of the PXI Test Report. In
“PXI snags savings with HIL test”
(p. 45), Greg Sussman of Process
Automation explains that a PXI sys-
tem serves as the key simulator in
hardware-in-the-loop testing of an
aircraft arrestor system.
The discussion of medical appli-
cations on p. 47 reports that Active
Diagnostics used PXI hardware and
software in a neurosimulator the
company developed for physician
training.
These two examples represent an
entirely new application area for PXI
that arose from thinking backward
about PXI in test. PXI in simulation
and for HIL testing may just be the
beginning. There may be other ways
of looking at PXI that are not obvious
until you fi rst see them, perhaps by
starting to look at PXI sideways.
Contact Richard A. Quinnell at [email protected].
TMW1009_046 46 9/9/10 5:06:49 PM

PXI TEST REPORT • SEPTEMBER 2010 47w w w . t m w o r l d . c o m
Care required when PXI serves medicineBy Richard A. Quinnell, Contributing Technical Editor
Instrumentation development and manufacturing test for medical equipment are growing application areas for PXI technology. Engineers working in these fields face unique challenges, though, because of regulations that require the design and manufacture of medical devices to follow tightly controlled processes. Design techniques that use off-the-shelf modules, such as PXI, require extra care from the design team and extra support from their vendors.
There are many reasons why PXI is appealing to the medical industry, according to John Hottenroth, market development manager for scientific and biotechnology instrumentation at National Instruments. One key appeal is the ability that PXI gives medical developers to quickly create prototypes. “Many of these customers are experts in their medical field looking for design help,” says Hotten-roth. “With PXI, they are able to take their ideas and form prototypes to prove the ideas out, then quickly bring the product to market.”
One recent example is a neurosimulator that Active Diagnostics developed for sur-gical training of neurophysiol-ogists. In an application note on the NI Website (Ref. 1), David Miller and Michael Russell of Active Diagnostics explained that PXI “hardware and software tools provided an easy-to-use solution that allowed us to quickly prototype and reuse much of the code in our final deployment.”
This ability to quickly develop prototypes can also be valuable in obtaining funding, especially when a com-pany is just starting out. “There’s no shortage of venture capital for medical companies,” Hottenroth explained, “but having a working demo helps them win backing.”
Once the prototype is ready, the role of PXI in produc-tion can vary based on anticipated volume, noted Hot-tenroth. Low-volume production, such as for high-cost systems that sell in the tens per year, may well employ off-the-shelf PXI as an embedded system. For higher vol-umes, customers are more likely to want the custom form factors and reduced pricing available by using OEM components such as backplanes rather than assem-bled systems.
However PXI enters production in the medical indus-try, though, developers face the same regulatory challenge:
required controls on the design and manufacture of their products. In the US, the FDA’s (Food and Drug Adminis-tration’s) regulations on this control appear in the Code of Federal Regulations, Title 21 (21 CFR), part 820. Fur-ther, once the design is complete, it must receive certifica-tion from the FDA and cannot change without notifica-tion to—and in some cases recertification by—the FDA.
This requirement for control and certification creates challenges for medical-device designers using off-the-shelf modules and software such as PXI products. The solu-tion involves help from the PXI vendor. Certification is the medical device developer’s responsibility, but the ven-dor can help by supplying complete information on the design and manufacture of its products to streamline the certification process. By designing, building, and testing
its products in conformance to industry standards, a vendor also helps ease the subsequent certification efforts of its med-ical customers.
Because the manufacture of medical products requires tight controls, PXI vendors should provide medical instru-mentation customers with ad-vance notice of changes to their hardware. This notifica-tion allows those customers to inform the FDA and to antici-pate that a product might re-quire recertification. Another option is for the vendor to set aside parts to continue build-
ing the original version for the medical customer when a design changes, such as for an upgrade in processor. Ven-dors could also offer customers lifetime buys of products that will undergo substantial change or will be removed from the market.
Developers interested in applying PXI to the medical field can gain insight into the impact of this choice by reading the FDA’s guidance on the use of off-the-shelf software (Ref. 2). The developer’s best help, however, will come from working with a vendor experienced in apply-ing PXI to medical care.
REFERENCES
1. “Prototyping and Deploying a Neurosurgery Training Device Using NI LabVIEW, R Series, and Embedded Hardware,” application note, National Instruments. sine.ni.com/cs/app/doc/p/id/cs-12572.
2. “Off-The-Shelf Software Use in Medical Devices,” US Food and Drug Adminis-tration, September 9, 1999. www.fda.gov.
PXI helped speed the prototyping and software de-velopment of this Active Diagnostics neurosimulator for training physicians on the human nervous sys-tem’s response to surgery. Courtesy of National Instruments.
TMW1009_047 47 9/9/10 5:06:55 PM

PXI T E S T R E P O R T
48 SEPTEMBER 2010 • PX I TEST REPORT w w w . t m w o r l d . c o m
Early July marked the release of specifications for a new modular
test instrument standard—AXIe (Ad-vancedTCA Extensions for Instrumen-tation and Test). The specifications add clock, triggering, and other signals to a high-performance architecture that ini-tially targeted telecom computing. Rather than seeing the new standard as a competitor to PXI, however, AXIe’s developers see it as an extension of the PXI test-development model.
In November 2009, the newly formed AXIe Consortium—founded by Aeroflex, Agilent Technologies, and Test Evolution—announced it was develop-ing a modular test-instrument standard based on the ATCA (Advanced Tele-communications Computing Architec-ture). Now, with the debut of the actual specifications, the AXIe developers ex-pect the first AXIe modules to arrive before year’s end. According to Larry DesJardin, GM for modular products at Agilent and chairman of the AXIe Consortium board, “Test engineers should have enough AXIe boards and system components to develop com-plete applications during 2011.”
The ATCA specifications that AXIe leverages were developed to meet the high data rates and processing perfor-mance of the telecom industry. ATCA backplanes provide protocol-agnostic, multilane, switched-serial links among boards, and the backplanes support transfer speeds as great as 10 Gbps per lane. Blades that plug into the back-plane are large (8U) and can draw as much as 200 W from system power—attributes that support the creation of complex, high-performance modules.
To make ATCA useful for test-sys-tem design, the AXIe specifications call for some subtle changes to the ATCA signal-line assignments. Elimi-nating two of ATCA’s 16 blade slots, for instance, allows the AXIe 1.0 base specification to free backplane signal lines for use as timing, triggering, and local bus implementations. Twelve matched-length, MLVDS (multipoint
low-voltage differential signaling) pairs provide a trigger bus that runs across all slots of the backplane. In addition, a signal set consisting of CLK100 (star clock), STRIG (star trig-ger), SYNC (star synchronization), and FCLK (fabric clock) signals runs from the system controller to each instru-ment slot to provide precision system timing (the online version of this arti-cle includes an illustration of the pro-tocols, www.tmworld.com/2010_09).
Another change AXIe makes to ATCA backplane signaling is the elimi-nation of RTMs (rear transition mod-ules) that would normally occupy what the ATCA specification calls “Zone 3” backplane connections and would be used for module-specific I/O. According to David Poole, the CTO at Aeroflex and director of the AXIe Consortium, AXIe modules use front-panel connec-tions for their unique I/O, and they use Zone 3 for supplemental AXIe stan-dard signals. One supplemental specifi-cation, AXIe 3.1, defines such signals as additional triggers, a calibration bus,
an analog bus, and DUT (device under test) I/O lines for use in semiconductor test applications. Poole noted that the AXIe Consortium plans to release sev-eral such 3.N supplemental specifica-tions for specific applications.
Complementary capabilitiesBased on a modular industrial com-puting architecture supplemented with timing and triggering buses, the AXIe naturally invites comparisons with PXI. But the two are not competitive, according to AXIe Consortium mem-bers, and Aeroflex, in fact, also makes PXI modules. “AXIe doesn’t displace PXI,” said Poole, “it simply gives ac-cess to the higher-end performance that will be required in the future.”
“They are extremely complemen-tary,” added DesJardin, “with the main differences [being] the size of the boards, the amount of cooling and power available, and the bus capacity. AXIe is, in effect, a ‘big brother’ to PXI that extends the PXI programming met-aphor.” He pointed to compatibilities
AXIe stakes claim as PXI’s “big brother”By Richard A. Quinnell, Contributing Technical Editor
LXIbox
instruments
PXI
LAN
CablePCIe
AXIe(LAN and PCIeon backplane)
GPIB
Common control via
or
GPIBinstruments
The protocol-agnostic ATCA backplane allows AXIe systems to use PCI Express and Ethernet as backplane protocols, giving the systems native sup-port for simple integration with both PXI and LXI systems. Cour tesy o f the AX Ie Consor t ium.
TMW1009_048 48 9/9/10 5:06:59 PM

© Geotest - Marvin Test Systems, Inc. 2010 All rights reserved. Product and trade names are property of their respective companies.
Toll Free: 888.837.8297
www.geotestinc.comWorld-Class Digital Test
Market-Leading PXI Digital Instrumentation GX5960 Series: Highest performance PXI digital instrument with high voltage pin electronics & PMU, 256 time sets, and 1ns programmable drive / sense strobes for LRU and SRU test applications
GX5295: The only 3U PXI single card semiconductor test solution featuring 32, 100 MHz channels with per-pin PMU
GX5055: High performance digital test with high voltage pin electronics and PMU functionality for card and semiconductor test applications
TMW1009_049 49 9/9/10 5:07:11 PM

PXI T E S T R E P O R T
50 SEPTEMBER 2010 • PX I TEST REPORT w w w . t m w o r l d . c o m
between PXI and AXIe as evidence of this noncompetitive nature. “PCI Ex-press is one of the signaling protocols used on the AXIe backplane and forms a fabric that is software-compatible with a PXIe system,” he said. “An exter-nal system controller cannot tell the dif-
ference between an AXIe and a PXIe system, and the same drivers and devel-opment tools work for both systems.”
Poole said that Ethernet is another of AXIe’s supported backplane proto-cols, giving the system native compati-bility with both PXI and LXI (figure).
An additional indication of compat-ibility is the definition of an AXIe car-rier that can hold two PXI or PXIe modules for insertion and use in an AXIe system. “The carrier is like a mini, two-slot PXI card cage,” said DesJardin. “Using PXI cards is not an efficient way of building an entire AXIe system, but [it is] a good way of adding niche functionality if you are missing only one or two modules to complete your design.”
Instead of replacing PXI, then, AXIe aims to take up where PXI approaches its limits. “AXIe is for instruments that are tough to do in PXI,” said DesJar-din, “where the power and space re-strictions of PXI are a barrier.”
Poole added that AXIe also extends the computing performance available for test. “If you look around the in-dustry, you see bus bottlenecks becom-ing a problem. With AXIe, however, you can use up to 32 10-Gbit lanes to handle data. Another great attraction of AXIe is that it allows a full fabric for multiprocessing. In PXI, the only high-speed bus available for multipro-cessing is PCIe, and even then there is only one root complex.”
And multiprocessing is only one performance-multiplying attribute that AXIe brings to test. ATCA has built-in power and system management that makes it easy to expand a system to multiple cages. “So essentially, we have unlimited expansion potential,” noted Poole. “Now there is nothing that can-not be done in a modular instrument,” added DesJardin.
The vision that the AXIe Consor-tium holds for modular test, then, calls for AXIe and PXI to form a contin-uum that stretches from small, porta-ble test instruments to large, powerful systems. While many of the physical structures are different, the two share some types of data links as well as the control and programming model.
For many test-system developers, the deciding factors of which to use may ultimately depend on the size and speed requirements of the final system. “If you can do it in PXI, go ahead,” said DesJardin. “If not, you now have a pretty compatible architecture that can get the job done.”
TMW1009_050 50 9/9/10 5:07:22 PM

16
39
2_T
MW
10
SAVE THE DATE!Tuesday, September 28, 201012 NOON EST.
Non-intrusive Board Test:
Non-intrusive board test (NBT) is a software-driven
methodology for functional validation and structural/
functional test within design and manufacturing. It
does not rely on placing a metal probe on test pads or
device pins.
Running on a PC, an NBT strategy capitalizes on
embedded instrumentation in chips, on boards and
in systems. This addresses the limitations of probe-
based tools and results in functionally validated boards
in design, and greater test coverage, faster test times
and higher yields in manufacturing.
REGISTER for this one-hour webcast and fi nd out how NBT can return the results you need:
www.TMWorld.com/webcasts
PRESENTER:
Larry OsbornTechnical Product Manager
ASSET InterTech
Larry Osborn, Product Manager
for ASSET® InterTech, has over
25 years of experience in product
management, hardware/software
product design and development,
and product marketing. Prior
to ASSET, he has held positions
with Lockheed Martin, Wind
River, Hewlett-Packard, and
Intel® Corporation. He holds a
Bachelor’s Degree in Computer
Science from the University of
Kansas.
FREE WEBCAST
New technologies for validation and test within design and manufacturing
TMW1009_051 51 9/9/10 5:43:11 PM

PRODUCTUPDATE
52 SEPTEMBER 2010 www.tmworld.com TEST & MEASUREMENT WORLD
NI debuts Ethernet, USB DAQ systems
During NIWeek 2010, National Instruments announced new Ethernet and USB data-acquisition systems. The Eth-ernet-based NI CompactDAQ modular system (pictured) includes the NI cDAQ-9188 chassis, which is designed to hold eight I/O modules for measuring up to 256 channels of electrical, physical, mechanical, or acoustic signals. With more than 50 I/O modules to choose from, engineers can build remote or distributed, high-speed measurement sys-tems using standard Gigabit Ethernet infrastructure.
The NI CompactDAQ uses NI Signal Streaming technol-ogy, which provides the ability to maintain bidirectional
analog and digital waveforms contin-uously over a TCP/IP connection. Each chassis also can manage up to seven separate hardware-timed I/O tasks at differ-
ent sample rates, including analog I/O, digital I/O, and counter/timer operations. Each chassis operates in a tem-perature range of –20°C to 55°C and can withstand up to 30 g of shock and 3 g of vibration.
The company’s NI X Series USB data-acquisition devices integrate analog measurement and control channels, digital I/O, and counter/timers onto a single device that engineers can use for portable applications. The USB X Series devices include up to 32 analog inputs, four analog outputs, 48 digital I/O lines, and four counters. The eight new devices range from 500-ksamples/s multiplexed analog inputs to 2-Msamples/s/channel simultaneous-sampling analog inputs.
Base prices: CompactDAQ—$1399; X Series—$1149. National Instruments, www.ni.com.
Anritsu introduces Bluetooth/WLAN module testing softwareAnritsu’s CombiTest software is a PC-based application that provides remote control of the company’s MT8860x WLAN and MT8852B Bluetooth test sets. Developed to meet the needs of Bluetooth and 802.11 WLAN silicon developers and volume manufacturers, CombiTest controls the MT8860x and MT8852B via a Windows user interface. En-gineers can use CombiTest to create test plans by simply dragging-and-dropping Bluetooth and WLAN test cases from a preloaded list based on the most recent standards.
When using CombiTest software, development engi-neers can create comprehensive DVT (design verification and test) plans to fully characterize new designs. Results can be printed directly as well as automatically saved. In high-volume production lines, a subset of the DVT plan can be run to ensure quality of output. Anritsu said it de-veloped CombiTest in response to feedback from volume
manufacturers who are finding that reduced product life-cycles require continual update of test-system software.
Price: free to users of Anritsu Bluetooth and WLAN test sets. Anritsu, www.us.anritsu.com.
Field generator holds its own shield
Instrumentation in an anechoic chamber requires shielding to prevent the fields it generates from interfering with its operation. Shielding also prevents test equipment from adding unwanted interference in the chamber. The AS18013 field-generation test system from AR RF/Micro-wave Instrumentation consists of two shielded racks of equipment connected to antennas on a mast. The shielded, air-conditioned cabinets prevent unwanted signals from entering or exiting the rack.
The system includes traveling-tube and solid-state amplifiers, field probes, an RF power meter, field couplers, horn antennas, a signal genera-tor, and an antenna mast. It forms a complete system for generating E-fields of known power and frequency. The AS18013 can generate fields at frequencies from 800 MHz to 18 GHz at 200 V/m. With up-graded amplifiers, antennas, and cables, the system can generate fields up to 40 GHz. The racks have extra space available for user-installed equipment.
Prices vary depending on system configuration. AR RF/Microwave Instrumentation, www.ar-worldwide.com.
DAQ module achieves 800-kHz sampling
Joining the DT9836 series of USB-based data-acquisition modules from Data Translation, the DT9836S is a com-pletely isolated module with six 16-bit analog inputs that can be simultaneously sampled at up to 800 kHz/channel or 4.8 MHz total. Each analog input has its own ADC, eliminating phase shift between channels. As a result, the DT9836S can correlate measurements instantly, according to the company.
The DT9836S provides three quadrature decoders for measuring absolute and relative position and for detect-ing rotational speed. In addition, the module furnishes 32 digital I/O lines for time stamping, pattern recognition, and synchronizing external events. Two 32-bit counter/timers are available for testing applications, while 16-bit de-glitched DACs run at 500 kHz/channel for waveform generation. What’s more, independent clocks and triggers offer maximum timing flexibility.
The DT9836S comes in two packaging configurations: a BNC connection box and an OEM version.
Base price: $2025. Data Translation, www.datatransla-tion.com.
TMW1009_052 52 9/9/10 5:44:08 PM

SEPTEMBER 2010 53TEST & MEASUREMENT WORLD www.tmworld.com
© EPIX, Inc.
Buffalo Grove, IL USAtel - 847 465 1818
22 CCaammeerraa FFrraammee GGrraabbbbeerr
Features and Specifications at:
epixinc.com
PIXCI® SV7
2 Camera Frame Grabber
Capture from one or two camerasVideo formats: NTSC/RS-170/PAL/CCIRPlugs into any PCI Express slot
60MHz HandHeld60MHz HandHeldScopemeter/OscilloscopeScopemeter/Oscilloscope
• 60MHz Bandwidth w/ 2Chs• 150MSa/s Real-Time Sampling
Rate• 50Gsa/s Equivalent-Time
Sampling Rate• Integrated Digital Multimeter w/
6,000-Count resolution AC/DCat 600V/800V, 10A
• Large 5.7 inch TFT Color LCD..Display• USB Host/Device 2.0 full-speed ..interface• Includes Probes, test leads, AC Adapter/Charger.. and nylon carry case
•Up to 10 settings stored in memory •Optional RS-232, USB, RS-485 adaptors•May be used in series or parallel modes.with additionalsupplies.
•Low outputripple & noise
•LCD displaywith backlight
•High resolution at 1mV
USB Digital Storage OscilloscopesUSB Digital Storage Oscilloscopes* High performance: * USB connected: Uses..USB and supports ..plug'n.play, with 12Mbp..communication speed.* Best performance for..your dollar: Thease units..have many features that..are comparable to the high speed stand-alone..DSOs. But costs a fraction of the price.* No external power required: Bus-powered from..the host computers USB port.* Probes & USB cable included.* Easy to use: Intuitive and easy to understand.* Various data formats: Can save wavrfrom in the
following formats:.txt .jpg .bmp & MS excel/word
40MHz DSO-2090DSO-2090 $169.00$169.0060MHz DSO-2150DSO-2150 $194.00$194.00
200MHz DSO-5200DSO-5200 $289.00$289.00
Great Deals @CircuitSCircuitSpecialistpecialists.coms.com
Programmable DCProgrammable DCPower SuppliesPower Supplies
wwwwww.CircuitS.CircuitSpecialistpecialists.coms.com
Circuit SCircuit Specialistpecialists,Inc.s,Inc.wwwwww.CircuitS.CircuitSpecialistpecialists.coms.com800-528-1417 / / Fax:480-464-5824
Model CSI3644A CSI3645A CSI3646A
DC Voltage 0-18V 0-36V 0-72VDC Current 5A 3A 1.5A
Power (max) 90W 108W 108WPrice $199.00$199.00 $199.00$199.00 $199.00$199.00
Item #Item # DSO1060:DSO1060: $569.00$569.00
Programmable DC LoadsProgrammable DC LoadsThe 3710A is aprogrammableelectronic DCload, capable ofsupporting up to150W of power& the Model3711A, 300W of power.These devices canbe used with supplies up to 360VDC and30A. They feature a rotary selection switchand a numeric keypad used to input themaximum voltage, current and power set-tings. Optional RS-232, USB & RS-485adaptors are available.Item #Item # CSI3710A:CSI3710A: $349.00$349.00Item #Item # CSI371CSI3711A:1A: $499.00$499.00
ProbesProbes
Included
Included
ADVERTISER INDEXADVERTISER PAGEAgilent Technologies 2, 7, 20Ametek Programmable Power 24Amplifier Research 16Anritsu Company CoverAries Electronics Inc 28Assetsmart 22Chronologic Pty Ltd 40Data Translation 18Dow Key Microwave 41Emcor 10Geotest Inc 49HBM 8In-Phase Technologies 42Le Croy Corporation 29LEMO S.A. 6MathWorks Inc. 36Measurement Computing Corp 14, 26National Instruments 56Newark Electronics 55Omega Engineering 3Omicron 35Phase Matrix 50Pickering Interfaces 44Rhode & Schwarz Gmbh 25Tektronix 4VI Technology 13Virginia Panel 28Vision Research 43VTI Instruments 33
33 Hayden Ave., Lexington, MA 02421Web: www.tmworld.com
BUSINESS STAFFPublisher: Russell E. Pratt, [email protected]
Associate Publisher: Judy Hayes, [email protected]
Director, Custom Programs and Solutions:Karen Norris-Roberts, [email protected]
Online Account and Marketing Manager: Melanie Turpin, [email protected]
Publications Production Manager:Martin Schneggenburger
Production Coordinator: Adrienne Davis
ADVERTISING SALESNew England, NJ, New York City, Long Island, South Central:Mike Moore, Chatham, NJ. [email protected]
NY (except NYC & LI), PA, DE, MD, Southeast, Midwest, and Canada: James Leahey, Kenosha, WI. [email protected]
CA, CO, TX, and Northwest: Mary Lu Buse, Calabassas, CA. [email protected]
Internet Sales Director:Laura Lang-Dacus, 408-984-4871 [email protected]
France, Spain, UK, Ireland, Benelux, Scandinavia: John Waddell, London, England. 44-20-8312-4696
Germany, Austria, Switzerland: Adela Ploner, Dachau, Germany. 49-8131-366992-0
Italy: Roberto Laureri, Milan, Italy. 39-02-236-2500
Israel: Asa Talbar, Tel Aviv, Israel. Fax: 972-3-562-9565
Japan: Shintaro Koyama, Tokyo, Japan. 81-3-3402-0028
Taiwan: Laura Chen, Taiwan, ROC. 886-2-2314-7206
Singapore, Malaysia, Hong Kong: Wai Chun Chen, Singapore. 65-6544-1151
VOL. 30, NO. 8
Subscription PolicyTest & Measurement World® (ISSN 0744-1657) is published monthly except January by Canon Communications LLC, 11444 W. Olympic Blvd., Los Angeles, CA 90064-1549; 310-445-4200. Periodicals postage paid at Los Angeles, CA, and additional mailing offices. SUBSCRIPTIONS: Free to qualified subscribers as defined on the subscription card. Rates for nonqualified subscriptions, including all issues: 1 yr. $150, 2 yrs. $250, 3 yrs. $300. Except for special issues where price changes are indicated, single copies are available for $10 (US orders) and $15 (foreign orders). Buyer’s Guide Issue is available for $35 (US orders) and $40 (foreign orders). For telephone inquiries regarding subscriptions, call 763-746-2792. E-mail: [email protected]. CHANGE OF ADDRESS: Notices should be sent promptly to P.O. Box 47461, Plymouth, MN 55447. Please provide old mailing labels as well as new ad-dress. Allow two months for change. NOTICE: Every precaution is taken to ensure accuracy of content; however, the publishers cannot accept responsibility for the correctness of the infor-mation supplied or advertised or for any opinion expressed herein. POSTMASTER: Send address changes to Test & Measurement World, P.O. Box 47461, Plymouth, MN 55447. Canada Post: Publications Mail Agreement No. 40612608. Return undeliverable Canadian addresses to: BleuChip International, P.O. Box 25542, London, ON, N6C 6B2. Printed in U.S.A. Copyright 2010 by Canon Communications LLC. All rights reserved. Reproduction in whole or part without permission is prohibited.
PO
WE
RE
D B
YP
OW
ER
ED
BY
NEW WEB SITE FOR DESIGN ENGINEERS• New Part Number Search• New Parametric Search• New Navigational Tools• Clean & User Friendly Interface• Easy to Use Product Support Tools• Quick Access to Contact Info.• New Industry Solutions Content• Distributor Product Inventory
www.panasonic.com/indus
TMW1009_053 53 9/9/10 5:44:40 PM

54 SEPTEMBER 2010 www.tmworld.com TEST & MEASUREMENT WORLD
VIEWPOINT[An exclusive interview with a technical leader]
Q: How would you describe the busi-ness recovery in semiconductors?A: Unlike in some sectors of the economy where recovery is somewhat muted, the re-bound in electronics and semiconductors has been breathtaking. From the first quarter of 2009 to the first quarter 2010, Teradyne’s product orders have grown by over tenfold. Our semiconductor customers need a lot of capacity, and their unit volumes are breaking records. It’s a real sprint now for test equip-ment suppliers and our customers to get shipments to the point where they can meet this strong demand.
Q: What sectors of the semiconductor market show greatest demand?A: Anything related to wireless communica-tions is very robust. Another very healthy sector is automotive, where electronics con-tent continues to grow with every model year. Anything related to analog, such as ana-log semiconductors for power management, also is surging. Sectors that are improving more slowly include solid-state image sensors for cameras, as well as semiconductors for PCs, which really did not fall off much dur-ing the recession. Business purchases of PCs, however, are starting to ramp up.
Q: What kinds of features do custom-ers want in semiconductor testers?A: Back in the ’90s, equipment builders were chasing frequency. That’s what our custom-ers needed to test their new digital devices. That plateaued toward the end of the last de-cade, when customers began focusing more on the economics of test. We responded with equipment that enabled parallel test for SOCs [systems on a chip]. Today, parallel test for 8, 16, or 32 SOC devices has become the norm. We even see systems that can pro-vide parallel test for 128 devices, in the case of microcontrollers. Customers also want enhanced software capability in test equip-ment to reduce the time and talent required to create and debug test programs. Today, software engineers make up a bigger portion of Teradyne’s product development team than do hardware engineers.
Q: How are these features evident in Teradyne’s new UltraFLEX-M tester for high-speed DRAM?A: Its technology leverages our UltraFLEX platform for testing SOCs. Teradyne had been a high-speed DRAM test supplier in the ’80s and ’90s but got out of the business. When we decided to reenter the market, we had to bring something different to the party. DRAM test was one sector that was still chasing megahertz because of bandwidth concerns. The frequency needs for graphics and PC-based DRAM keep marching up. You go from DDR2 to DDR3 to DDR4, as well as similar classes of GDDR devices.
Our goal for the UltraFLEX-M was to de-liver all the parallelism needed to economi-cally test DRAM. But that was just for start-ers. We also needed the tester to perform at a frequency level that would allow it to be used not just for the current generation of DRAM—DDR3—but for DDR4 and for advanced graphics devices as well. These ca-pabilities effectively doubled the asset life of the UltraFLEX-M introduced last fall, versus traditional DRAM testers.
Q: How have the acquisitions of Nex-test and Eagle Test expanded the Tera-dyne product line?A: If you drew a map of all the types of semi-conductor devices, we have test equipment that covers the entire range—memories, SOC, digital, analog, and more. With Eagle Test’s analog test capabilities and the high-volume, low-cost memory-test expertise we added from Nextest, we don’t see a need for any major additions to our portfolio. Our goal now is to apply technology leverage within our own company to do a better job of serving customers. T&MW
Strong rebound for semiconductor test
MARK JAGIELAPresidentSemiconductor Test DivisionTeradyneNorth Reading, MA
Mark Jagiela joined Tera-dyne in 1982 as a design engineer, developing im-age-sensor test systems. In 1989, he moved to Tokyo and served as GM of Teradyne’s Japan Divi-sion. He returned to the US in 1999 as engineering manager for the VLSI Test Division in Agoura Hills, CA. In 2001, he became worldwide marketing man-ager of Teradyne’s semi-conductor test products, and in July 2003, he was promoted to president of the Semiconductor Test Division. Jagiela gradu-ated from the University of Michigan with a BSEE.
Contributing editor Larry Maloney interviewed Mark Jagiela on new semicon-ductor test technologies at the Teradyne headquarters in North Reading, MA.
Mark Jagiela answers more ques-
tions about new test systems and
the recovery in semiconductors in the on-
line version of this interview:
www.tmworld.com/2010_09.
To read past Viewpoint columns, go to
www.tmworld.com/viewpoint.
TMW1009_054 54 9/9/10 5:07:57 PM

Test. Fest.
Newark plays host to the best in test. Amprobe, Fluke, Tektronix and so many more top brands are in stock and ready to ship to you today. You’ll even find test equipment in stock that’s already been calibrated with data. Plus expert
calibration services are available in our ISO 9001:2000 certified metrology labs to the ISO/IEC 17025:2005 standard.
Learn more at www.newark.com or contact us at 800.463.9275
DESIGN WITH THE BESTA Premier Farnell Company
© 2010 Newark, a trademark of Premier Farnell Corp. All other trademarks, registered or unregistered, are the property of their respective holders.
TM-World_TestFest.indd 1 4/8/10 5:04:07 PM
TMW1009_055 55 9/9/10 5:45:12 PM

©2010 National Instruments. All rights reserved. LabVIEW, National Instruments, ni.com, and NI TestStand are trademarks of National Instruments. Other product and company names listed are trademarks or trade names of their respective companies. 1849
Move Your Automated Test Beyond the Box
Engineers around the world are making the software-defined PXI platform the cornerstone of their test system architectures. With more than 1,500 modular instruments available from more than 70 vendors, PXI delivers the functionality and flexibility you need to build a better test system while reducing cost and size.
PRODUCT PLATFORM
PXI modular instrumentation
NI LabVIEW graphical software
NI TestStand software
>> Learn how PXI can help you at ni.com/beyond 800 891 8841
TMW1009_056 56 9/9/10 5:08:03 PM