tnb handbook · “tnb is committed to support the national green agenda and minimise the...
TRANSCRIPT

TNB HANDBOOK
Prepared by:
Investor Relations & Management Reporting Department

CONTENTS
2
1. INTRODUCTION TO TENAGA
2. INCENTIVE BASED REGULATION (IBR)
3. BUSINESS STRATEGY & DIRECTION
4. DIVIDEND POLICY
5. FINANCIAL HIGHLIGHTS

49%40%
11%42.1%
54.4%
3.0% 0.5%
Gas & LNG Coal Hydro & Others Oil & Distillate
3
PENINSULAR
MALAYSIA
SARAWAK
SABAH
Sabah Electricity Sdn Bhd
(A 83% TNB Subsidiary)Tenaga Nasional Bhd
SINGAPORE
BRUNEI
22,911MW
4,343MW
1,279MW*
806MW
13,405MW
* Based on dependable capacity
Peninsula Installed Capacity vs. Generation mix
INSTALLED CAPACITY
TNB : 56.2%
IPP : 43.8%
GENERATION MIX
TNB : 52.3%
IPP: 47.7%
FY’13 FY’14 FY’15 FY’16 1QFY’17
TNB - Peninsula
Installed Capacity (MW)11,462 10,814 11,708 12,904 12,880
Total units sold (Gwh) 105,479 108,102 110,837 115,505 29,548
Total customers (mn) 8.35 8.64 8.94 9.21 9.11
Total employees (‘000) 35.0 36.1 36.0 35.6 35.6
Total assets (RM bn) 99.0 110.7 117.1 132.9 138.1
INTRODUCTION TO TENAGA
4
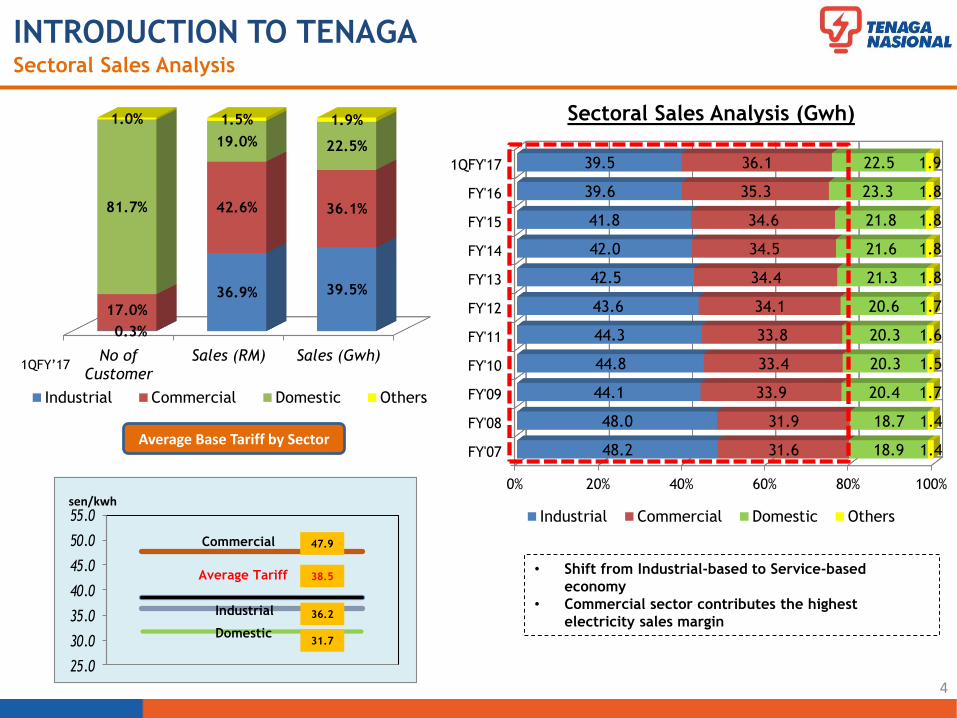
INTRODUCTION TO TENAGASectoral Sales Analysis
No ofCustomer
Sales (RM) Sales (Gwh)
0.3%
36.9% 39.5%
17.0%
42.6% 36.1%81.7%
19.0% 22.5%
1.0% 1.5% 1.9%
Industrial Commercial Domestic Others
0% 20% 40% 60% 80% 100%
FY'07
FY'08
FY'09
FY'10
FY'11
FY'12
FY'13
FY'14
FY'15
FY'16
1QFY'17
48.2
48.0
44.1
44.8
44.3
43.6
42.5
42.0
41.8
39.6
39.5
31.6
31.9
33.9
33.4
33.8
34.1
34.4
34.5
34.6
35.3
36.1
18.9
18.7
20.4
20.3
20.3
20.6
21.3
21.6
21.8
23.3
22.5
1.4
1.4
1.7
1.5
1.6
1.7
1.8
1.8
1.8
1.8
1.9
Industrial Commercial Domestic Others
Sectoral Sales Analysis (Gwh)
• Shift from Industrial-based to Service-based
economy
• Commercial sector contributes the highest
electricity sales margin
1QFY’17
25.0
30.0
35.0
40.0
45.0
50.0
55.0
36.2
47.9
31.7
Industrial
Average Tariff
Commercial
Domestic
sen/kwh
38.5
Average Base Tariff by Sector

5
INTRODUCTION TO TENAGAIndustry Regulatory Framework
PRIME MINISTER/CABINET
MINISTRY of ENERGY,
GREEN TECHNOLOGY
AND WATER (KeTTHA)
ENERGY COMMISSION
(Regulator)
- Promote competition
- Protect interests of
consumers
- Issue licenses
- Tariff regulation
Tenaga Nasional Berhad
ECONOMIC PLANNING UNIT (EPU)
- Develops and complements
Privatisation Policy
- Evaluates and selects IPPs
- Recommends ESI policies
Ministry of Finance/
Khazanah Nasional Berhad
Shareholders Policy Maker
Other Corporations &
Govt. Agencies :
EPF 14.9%
PNB 11.1%
Others 11.3%
Public
Holds
‘Golden’
Share
IPPs
Consumers
28.2%
37.3%
Foreign
6.8% 27.7%
SEDA
Malaysia
Market Cap (3rd)
RM75.6bn (USD17.1bn)- As at 2nd Feb 2017 -
% Based on Top 100 Shareholders
As at Nov’16

CONTENTS
6
1. INTRODUCTION TO TENAGA
2. INCENTIVE BASED REGULATION (IBR)
3. BUSINESS STRATEGY & DIRECTION
4. DIVIDEND POLICY
5. FINANCIAL HIGHLIGHTS

INCENTIVE BASED REGULATION (IBR) The Move Towards Better Regulation
11 Regulatory Implementation Guidelines (RIGS) were Developed for IBR Implementation
*Source: EC
The Economic Regulatory Framework for Regulating TNB
The Tariff Setting Mechanism and Principles for Tariff Design
Incentive Mechanisms to Promote Efficiency and Service Standards
The Process of Tariff Reviews
Creation of Regulatory Accounts and Its Annual Review Process
IBR mechanism to strengthen the following:
Business entities under IBR
(Accounting Separation)
7

INCENTIVE BASED REGULATION (IBR)Electricity Tariff Review = Base Tariff + Imbalance Cost Pass-Through (ICPT)
8*Source: EC

9
INCENTIVE BASED REGULATION (IBR)Imbalance Cost Pass-Through (ICPT) Comprises Two Components
Imbalance Cost Pass-Through (ICPT)
Fuel Cost Pass Through
(FCPT)
Generation Specific
Cost Adjustment
(GSCPT)
Adjustment in the
following 6 month
period, subject to
government approval
FCPT
(gas/LNG and coal
only)
Actual cost of
generation
Adjustment in the
following 6 month
period, subject to
government approval
Changes in:
• Other fuel costs such as distillate and fuel oil
• All costs incurred by SB under the power
procurement agreements (PPAs, SLAs and etc.)
and fuel procurement agreements (CSTA, CPC,
GFA/GSA and etc.)
• Renewable energy FiT displaced cost
Changes in gas/LNG and coal costs
PPAs
SLAs
CSTA
CPC
GFA
GSA
Power Purchase Agreements
Service Level Agreements
Coal Supply and Transportation Agreement
Coal Purchase Contract
Gas Framework Agreement
Gas Supply Agreement

0.9
3.41
0.170.51
INCENTIVE BASED REGULATION (IBR)
10
Tariff Components sen/kWh % increase
Average Tariff (Jun 2011) 33.54
Fuel Components:
• Piped-gas regulated price
(from RM13.70/mmBTU to RM15.20/mmBTU
@1,000 mmscfd)
0.51 1.52
• Coal (market price)
(from USD85/tonne to USD87.5/tonne CIF@CV
5,500kcal/kg)
0.17 0.51
• LNG RGT market price at RM41.68/mmBTU
(for gas volume > 1,000 mmscfd) 3.41 10.17
Non-fuel component (TNB Base Tariff) 0.90 2.69
AVERAGE BASE TARIFF EFFECTIVE
1st JANUARY 201438.53 14.89
82%
on fuels
18%
on base
4.99 sen/kwh
Piped-gas
Coal
LNG
Non-fuel
Average Base Tariff of 38.53 sen/kwh is Effective from 1st January 2014

11*Source: EC
INCENTIVE BASED REGULATION (IBR) Regulatory WACC for TNB under IBR (FY2014 – 2017) is 7.5%

12
Jan
2014 2015 2016 2017
Interim
Regulatory
Period
First
Regulatory
Period (RP1)
Dec Jan JanJul Jul Dec Jun Dec Jan Jul DecMar
2.25
rebate
2.25
rebate
1.52
rebate
JulJun Jun
Base Tariff
38.53
sen/kWh(726.99) (1,085.67) (762.03)
1.52
rebate
(758.03)
Jan
2018
P1 P2 P3 P4 P5 P6 P7 P8
RP2
Second
Regulatory
Period (RP2)
RM mn
sen/kWh
RM3.33 billion Total ICPT Rebate Passed Through to
Customers up to Dec 2016
Source: Regulatory Economics & Planning, TNB
1.52
rebate
(766.33)
INCENTIVE BASED REGULATION (IBR)IBR Regulatory Period Timeline & ICPT Review

CONTENTS
13
1. INTRODUCTION TO TENAGA
2. INCENTIVE BASED REGULATION (IBR)
3. BUSINESS STRATEGY & DIRECTION
4. DIVIDEND POLICY
5. FINANCIAL HIGHLIGHTS

BUSINESS STRATEGY & DIRECTION
Enabling a
Stable
Regulatory
Environment
Exceeding
Customer
Expectations
Driving
Operational
Excellence &
Cost Efficiencies
Growing
Profitable
Business
Transforming Our People and Leadership
DOMESTIC & REGIONAL CHAMPION
14
OUR STRATEGY
TNB’s strategy to achieve our aspiration of becoming amongst the leading corporations in the
energy & related business globally is centred on five focus areas: Enabling a stable regulatory
environment, exceeding customer expectations, driving operational excellence and cost
efficiencies, growing profitable business, and transforming our people and leadership.
TNB Aspires to Become a Domestic and Regional Champion

BUSINESS STRATEGY & DIRECTION
15
TNB Journey
2012-2015
2005 to 2012
1990 to 2005
2015-2025
Driving Performance as
Malaysia Government-
Linked Companies (GLC)
Champion
Establishing an Era of
Growth and Sustainability
through Key Result Areas
(KRA) to emerge as a
Domestic & Regional
Champion (DRC)
Electrifying Malaysia
and Powering its
Industrial growth
▪ 99% electrification
▪ No major black
out since 1996
▪ SAIDI reduced from
128 minutes in 2002
to 62 minutes in 2012
▪ 5th largest GLC
employer in Malaysia
▪ 6 KRAs ranging from
regulation to new
business growth and
organizational
transformation
Reimagining TNB to
deliver on the aspiration to
become a top 10 power
company globally
Transforming TNB
businesses to address
the challenges and
opportunities over the
next decade

BUSINESS STRATEGY & DIRECTION
16
Future
Generation
Sources
Grid of the
Future
Winning the
Customer
Anticipating
Future
Regulations
Changes
Aspirations in the Disrupted World
anchored on value creation
Value creation and capital allocation implications
Corporate structure and capabilities
Build conviction with TNB leadership
Reshaping TNB Future: Key Pillars of Value

BUSINESS STRATEGY & DIRECTION
RM bn
17
TNB 2025 Growth Aspiration

BUSINESS STRATEGY & DIRECTION
REMACO O&M Services for Shuaibah IWPP
IWPP: Shuaibah (USD2.7bn) 900MW Power
880,000 m3 / day water
150,000 m3 / day water
TNEC JV Al Reef District Cooling, UAE 8,000 RT
IPP: Liberty Power Ltd (USD272m)
235MW
IPP, IWPP & Development Projects
Supply & Services
REMACO O&M for Shuaiba North Co-Gen (USD320mn)
780MW Power; 204,000 m3 / day water (KUWAIT)
TNEC JV with Abu Dhabi Al Samah for District Cooling
Development of the Sumatera – Peninsular Malaysia HVDC Interconnection, Coal-fired
power plant & coal mine mouth projects
REMACO O&M services for Bong Hydro Plant in Pakistan
REMACO O&M for 225MW Sabiya Power Generation &
Water Distillation Plant (KUWAIT)
30% equity ownership
in GAMA Enerji A.S.
Equity ownership
REMACO O&M for 210MW Doha West Power Generation
& Water Distillation Plant(KUWAIT)
REMACO O&M services for Liberty Power Ltd
18
30% equity ownership
in GMR Energy Limited
TNB International Footprint: Currently One of the Largest Electricity Company in Asia
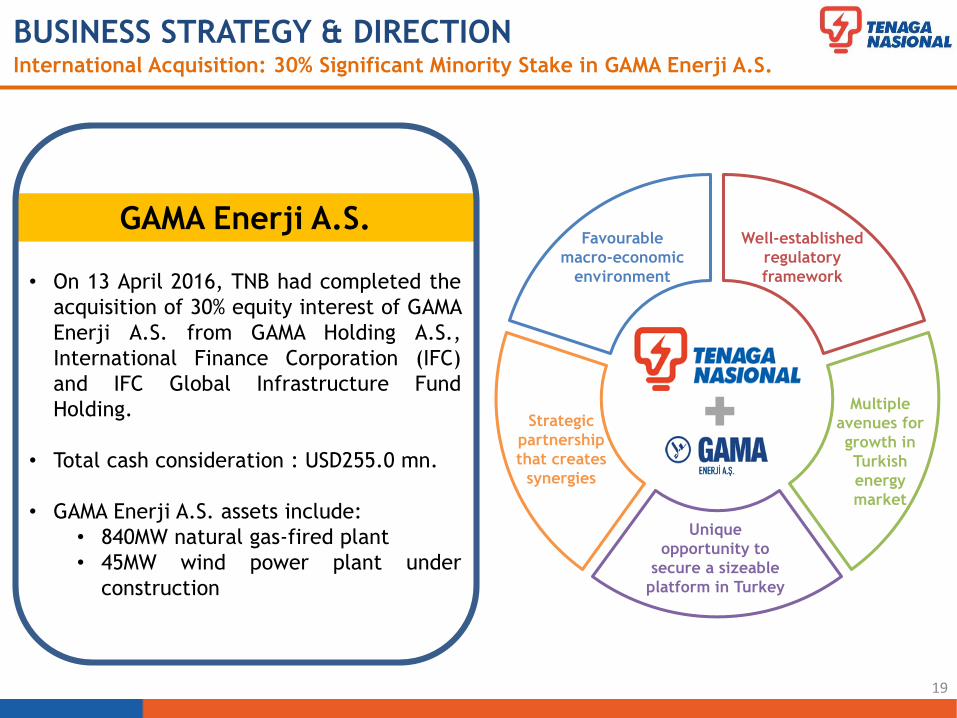
GAMA Enerji A.S.Favourable
macro-economic
environment
Well-established
regulatory
framework
Multiple
avenues for
growth in
Turkish
energy
market
Unique
opportunity to
secure a sizeable
platform in Turkey
Strategic
partnership
that creates
synergies
• On 13 April 2016, TNB had completed the
acquisition of 30% equity interest of GAMA
Enerji A.S. from GAMA Holding A.S.,
International Finance Corporation (IFC)
and IFC Global Infrastructure Fund
Holding.
• Total cash consideration : USD255.0 mn.
• GAMA Enerji A.S. assets include:
• 840MW natural gas-fired plant
• 45MW wind power plant under
construction
19
BUSINESS STRATEGY & DIRECTIONInternational Acquisition: 30% Significant Minority Stake in GAMA Enerji A.S.

GMR Energy LimitedLarge & growing
market
Strong
government with
favorable policy
framework
100% FDI
allowed in
generation,
transmission
&
distribution
Regulatory reforms
Strategic
partnership
that creates
synergies
• On 4 November 2016, TNB had completed
the acquisition of 30% equity interest of
GMR Energy Limited via a bilateral
transaction.
• Total cash consideration : USD300.0 mn.
• GMR Energy Limited assets include
2,298MW coal, gas and solar plants.
20
BUSINESS STRATEGY & DIRECTIONInternational Acquisition: 30% Significant Minority Stake in GMR Energy Limited
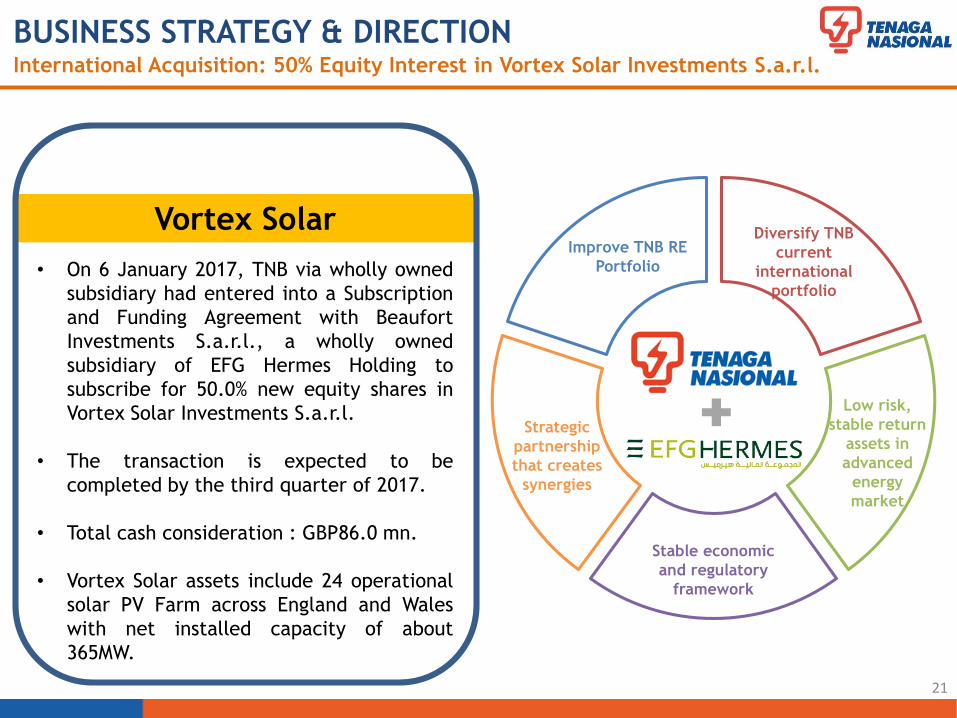
Vortex Solar Improve TNB RE
Portfolio
Diversify TNB
current
international
portfolio
Low risk,
stable return
assets in
advanced
energy
market
Stable economic
and regulatory
framework
Strategic
partnership
that creates
synergies
• On 6 January 2017, TNB via wholly owned
subsidiary had entered into a Subscription
and Funding Agreement with Beaufort
Investments S.a.r.l., a wholly owned
subsidiary of EFG Hermes Holding to
subscribe for 50.0% new equity shares in
Vortex Solar Investments S.a.r.l.
• The transaction is expected to be
completed by the third quarter of 2017.
• Total cash consideration : GBP86.0 mn.
• Vortex Solar assets include 24 operational
solar PV Farm across England and Wales
with net installed capacity of about
365MW.
BUSINESS STRATEGY & DIRECTIONInternational Acquisition: 50% Equity Interest in Vortex Solar Investments S.a.r.l.
21

Evolution on National Energy Policies
2013 : 33%8th Malaysia Plan
(2001-2005)
•RE as the fifth fuel
•Target: 5% RE in
energy mix
9th Malaysia Plan
(2006-2010)
•RE Grid-connectivity
•Target:
Peninsula 300 MW
Sabah 50 MW
10th Malaysia Plan
(2011-2015)
•RE installed capacity
•Target: 985 MW of
RE by 2015
11th Malaysia Plan (2016-2020)
Reduction in GHGs emission intensity of GDP compared to 2005 level
Formulation of a comprehensive demand side management master plan
In renewable energy installed capacity by 2020 (7.5% energy mix)
As at Aug 2016 : 326MW
• Minimise negative
impacts on the
environment
• Promote efficient
utilisation of energy
• Green Technology as the
driver to accelerate the
national economy
• Promote Sustainable
Development
Government Green Development Plan
22
BUSINESS STRATEGY & DIRECTIONRenewable Generation: Government Green Policy & Initiatives

TNB Green Policy
“TNB is committed to support the national green agenda and minimise the
environmental impact of our business by applying sustainable, efficient operations and
delivering green energy through the application of
appropriate technologies and investments”
TNB RE Targets
by 2020
Domestic
• 60-80 percent of
national targets by 2020
(1,248 -1,664 MW)
International
• In accordance to TNB
Investment policy and
guidelines on ventures,
M&A and bidding for
Green Energy Projects
23
BUSINESS STRATEGY & DIRECTIONRenewable Generation: TNB Green Policy & Initiatives

50MW Large Scale Solar Photovoltaic Plant
• On 21 December 2016, TNB had received Letter of Acceptance of Offer from the
Energy Commission (EC) dated 15 December 2016 for TNB to develop a 50MW Large
Scale Solar Photovoltaic Plant in Mukim Tanjung Duabelas, Daerah Kuala Langat,
Selangor subsequent to a competitive bid process conducted by the EC.
• The Letter of Acceptance of Offer requires TNB to satisfy certain obligations,
including completion of negotiations and execution of Project Documents prior to EC
issuing the formal Letter of Award for the Project.
BUSINESS STRATEGY & DIRECTION50MW Large Scale Solar Photovoltaic Plant
24

CONTENTS
25
1. INTRODUCTION TO TENAGA
2. INCENTIVE BASED REGULATION (IBR)
3. BUSINESS STRATEGY & DIRECTION
4. DIVIDEND POLICY
5. FINANCIAL HIGHLIGHTS
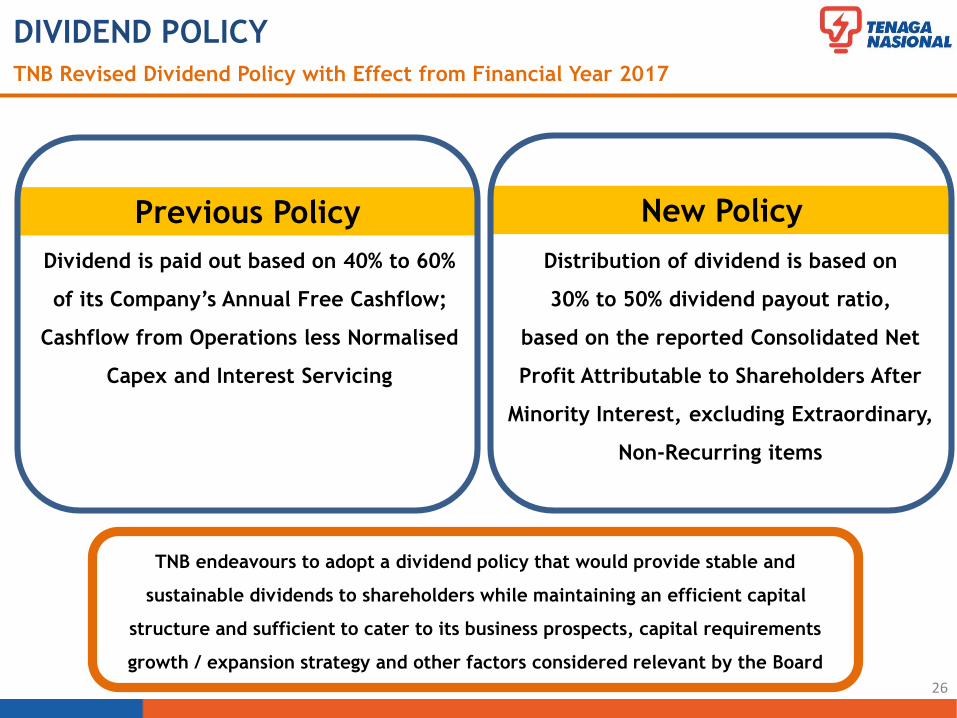
DIVIDEND POLICY
26
TNB endeavours to adopt a dividend policy that would provide stable and
sustainable dividends to shareholders while maintaining an efficient capital
structure and sufficient to cater to its business prospects, capital requirements
growth / expansion strategy and other factors considered relevant by the Board
TNB Revised Dividend Policy with Effect from Financial Year 2017
New PolicyPrevious Policy
Dividend is paid out based on 40% to 60%
of its Company’s Annual Free Cashflow;
Cashflow from Operations less Normalised
Capex and Interest Servicing
Distribution of dividend is based on
30% to 50% dividend payout ratio,
based on the reported Consolidated Net
Profit Attributable to Shareholders After
Minority Interest, excluding Extraordinary,
Non-Recurring items

DIVIDEND5-Year Dividend Payout
27
20.1
25.0
29.0 29.0
32.0
25.0% 26.1% 25.5% 27.0%24.7%
2.9% 2.9% 2.3% 2.6% 2.2%
FY2012 FY2013 FY2014 FY2015 FY2016
Dividend Paid per Share (sen) % PATAMI Dividend Yield (%)
IBR (RP1)
30% - 50% PATAMI
FY2017 Onwards

CONTENTS
28
1. INTRODUCTION TO TENAGA
2. INCENTIVE BASED REGULATION (IBR)
3. BUSINESS STRATEGY & DIRECTION
4. DIVIDEND POLICY
5. FINANCIAL HIGHLIGHTS
29
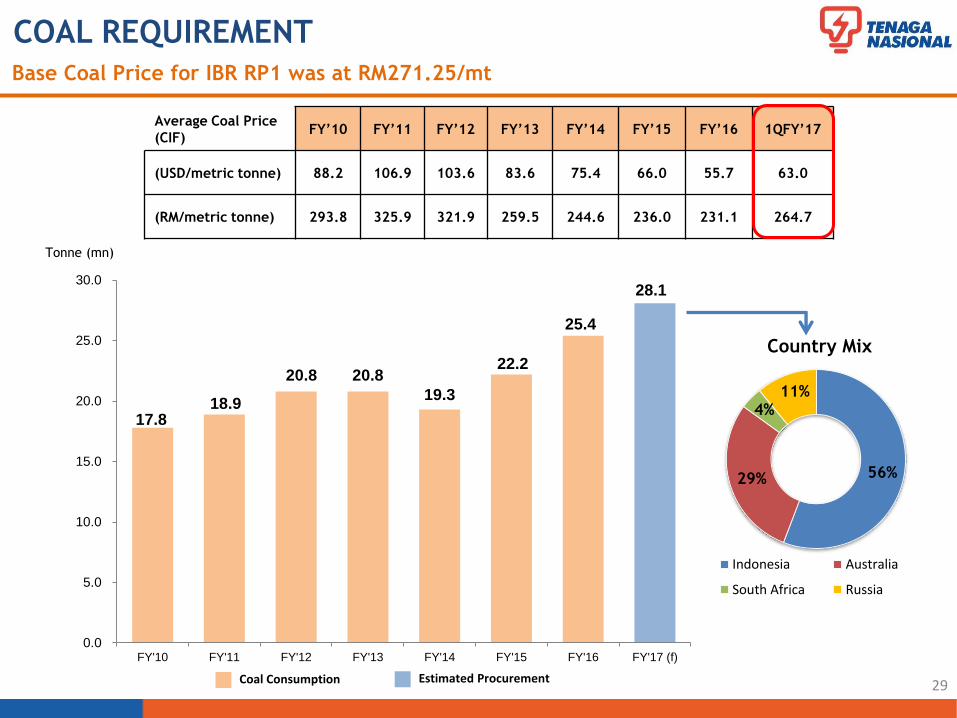
COAL REQUIREMENT
Average Coal Price
(CIF) FY’10 FY’11 FY’12 FY’13 FY’14 FY’15 FY’16 1QFY’17
(USD/metric tonne) 88.2 106.9 103.6 83.6 75.4 66.0 55.7 63.0
(RM/metric tonne) 293.8 325.9 321.9 259.5 244.6 236.0 231.1 264.7
17.818.9
20.8 20.8
19.3
22.2
25.4
28.1
0.0
5.0
10.0
15.0
20.0
25.0
30.0
FY'10 FY'11 FY'12 FY'13 FY'14 FY'15 FY'16 FY'17 (f)
Base Coal Price for IBR RP1 was at RM271.25/mt
Tonne (mn)
Estimated Procurement
56%29%
4%11%
Country Mix
Indonesia Australia
South Africa Russia
Coal Consumption

46.4 29.9 16.4 14.0
170.9
278.2 289.4 281.7 246.7
308.3
578.3 479.3 516.9
501.1
546.8
136.8
92.8 101.7 158.2
101.2
539.0
559.9
1,596.6
1,348.6 938.9
-
200.0
400.0
600.0
800.0
1,000.0
1,200.0
1,400.0
1,600.0
1,800.0
2,000.0
2,200.0
2,400.0
2,600.0
1QFY'13 1QFY'14 1QFY'15 1QFY'16 1QFY'17
CAPITAL EXPENDITUREMajor Projects Represent 45.4% of Total CAPEX
1,578.7 1,451.3 2,513.3 2,268.6 2,066.1
Recurring Generation, Transmission, Distribution, Others Generation Capacity
RM mn
30
RM1,127.2mn
54.6%
45.4%
G
T
D
O
G
T
D
O
G
T
D
O
G
T
D
O
G
T
D
O

STATUS OF MAJOR PROJECTS3 Generation Projects With Capacity Over 3,000MW Currently in the Pipeline
15MW
Hulu Terengganu Hydro
Tembat
99%COD:
U3: end Feb 2017
U4 Completed: 23rd Dec 2016
1,000MW
COD:
1st Oct 2017
Janamanjung Unit 5
98%2,000MW
COD:
U1: 15th Jun 2019
U2: 15th Dec 2019
Jimah East Power
33%
31

Gearing (%) 40.7 39.5
Net Gearing (%) 19.5 19.7
Fixed : Floating (%) 96.4 : 3.6 96.4 : 3.6
Final Exposure (%) 96.4 : 3.6 96.4 : 3.6
Weighted Average Cost of Debt (%) 4.63 5.06
Final Exposure (%) 4.63 5.06
30th Nov'16 31st Aug'16Statistics
30th Nov’16(RM bn)
DEBT EXPOSURE & GEARING
27.91
2.93
6.54
74.6%
Total Debt:
37.4Net Debt:
17.9
7.8%
17.5%
0.1%0.04
RM YEN USD Others
Closing 30th Nov’16 31st Aug’16
USD/RM 4.47 4.06
100YEN/RM 3.96 3.96
USD/YEN 112.88 102.53
* Net Debt excludes deposits, bank and cash balances &
investment in UTF
Improved Gearing due to Multicurrency Sukuk Issuance of USD750mn in October 2016
32
“The Group is required to hedge a minimum of
50.0% of TNB’s known foreign currency exposure up
to 12 months period. The Group uses forward
exchange contracts and currency options contract
to hedge its foreign currency risk. Most of the
forward exchange contracts have maturities of less
than three months
HEDGING POLICY

DISCLAIMER
All information contained herein is meant strictly for the use of this presentation only
and should not be used or relied on by any party for any other purpose and without the
prior written approval of TNB. The information contained herein is the property of
TNB and it is privileged and confidential in nature. TNB has the sole copyright to such
information and you are prohibited from disseminating, distributing, copying,
re-producing, using and/or disclosing this information.

CONTACT DETAILS
INVESTOR RELATIONS & MANAGEMENT
REPORTING DEPARTMENT
Tenaga Nasional Berhad
4th Floor, TNB Headquarters
No.129, Jalan Bangsar,
59200 Kuala Lumpur, MALAYSIA
Tel : +603 2296 5566
Fax : +603 2284 0095
Email : [email protected]
Website : www.tnb.com.my
IR OFFICERS:
Sherleen +603 2296 6183 [email protected]
Nadia +603 2296 6787 [email protected]
For further enquiries, kindly contact us at:

THANK YOU
Prepared by:
Investor Relations & Management Reporting Department