tno-report r 2002/400 documentation of the activities ... activities... · format (crf). this...
TRANSCRIPT

Nederlandse Organisatie voor toegepast-natuurwetenschappelijk onderzoek / Netherlands Organisation for Applied Scientific Research
Laan van Westenenk 501 Postbus 342 7300 AH Apeldoorn The Netherlands www.mep.tno.nl T +31 55 549 34 93 F +31 55 541 98 37 [email protected]
TNO-report R 2002/400
Documentation of the activities within the framework of the completion of the CRF for the 2002 submission to the UNFCCC
Date August 2002 Authors Ir. P.W.H.G. Coenen
Drs. J.G.J. Olivier (RIVM) Order no. 31933 Keywords UNFCCC
IPCC CRF
Intended for Ministry VROM All rights reserved. No part of this publication may be reproduced and/or published by print, photoprint, microfilm or any other means without the previous written consent of TNO. In case this report was drafted on instructions, the rights and obligations of contracting parties are subject to either the Standard Conditions for Research Instructions given to TNO, or the relevant agreement concluded between the contracting parties. Submitting the report for inspection to parties who have a direct interest is permitted. © 2001 TNO

TNO-report
TNO-MEP − R 2002/400 2 of 13
Table of contents
1. Introduction................................................................................................3
2. Available data ............................................................................................4 2.1 ER database ................................................................................4 2.2 Additional data sources ..............................................................5
2.2.1 Energy related data......................................................5 2.2.2 Industrial processes .....................................................6 2.2.3 Other sectors................................................................6
2.3 Data changes for earlier inventory years (1991-1994 and 1996-1997) .................................................................................7
3. Import of data in CRF and control procedures...........................................8 3.1 Initial import of data in CRF ......................................................8 3.2 Control procedures .....................................................................8
4. Revisions after initial submission to the UNFCCC .................................10
5. Experiences and possible future improvements .......................................11
6. Authentication..........................................................................................13
Appendix 1 Detailed documentation of input procedures Appendix 2 Control procedures Appendix 3 Comments of the secretariat
TNO-report
TNO-MEP − R 2002/400 3 of 13
1. Introduction
The ministry of VROM is obliged to report the Dutch emission data for greenhouse gases to the EU (European Union’s Greenhouse Gas Monitoring Mechanism and the UNFCCC (United Nation’s Framework Convention on Climate Change). The main part of the reporting of emission data is done in the Common Reporting Format (CRF). This format consists of a uniformed spreadsheet. In addition to the CRF a National Inventory Report is published (NIR) by the RIVM in which the data from the CRF are elucidated and trends in emissions are explained.
This report describes the activities in the last quarter of 2001 and the first two quar-ters of 2002 to complete the CRF files for the year 1990 to 2000 and the revision made in response to comments from the Climate Secretariat after the initial checks by the Secretariat. The report is also a description of the procedure, which The Netherlands use to translate the emission data from the National Inventory system to the CRF files. This work was performed by TNO-MEP in close co-operation with the RIVM.

TNO-report
TNO-MEP − R 2002/400 4 of 13
2. Available data
All Dutch emission data (for air pollutants and pollutants to water and soil) are stored on a yearly basis in a central database of the emission registration at TNO-MEP. These data are the official and formal basis for all the national emission re-porting by, or on behalf of, the Ministry of VROM. The emission registration sys-tem (ER database) has evolved over the past twenty years and is not yet fully equipped to fulfill all the data demands of the CRF. This chapter will point out: 1) which data could be retrieved directly from the ER database; 2) which data from other sources were used to fill the CRF files, and; 3) which data from the ER database (former year(s)) were improved/changed to be
included in the CRF.
2.1 ER database
In the CRF not only the emission data for the direct greenhouse gases (CO2, CH4, N2O, HFCs, PFCs and SF6 ) are required but also the emissions of the so-called precursor gases (NOx, CO, NMVOC and SO2 ). The national emission data for all these gases are stored in the ER database. The ER database is filled on a yearly basis with data for the years t-1 and t-2. Fur-thermore (revised) data for the years t-3, 1995 and 1990 are stored in the database. All t-1 data are preliminary estimates and the t-2 figures are the final figures for that year. The data for the former years can change due to back casting of improved methodologies or improved data for these years (recalculations). Recalculated data are only stored for the years 1990, 1995 and t-3 in the ER database. The remaining recalculated years are stored in the CRF files. Summarising: the ER database for the 2001 inventory and thus the 2002 submis-sion of the CRF contains the years 1990, 1995, 1998 (t-3), 1999 (t-2, final figures) and 2000 (t-1, preliminary data).
In the ER database the emission data are stored linked to a so-called RAPCODE. This code represents a typical emission source (for instance emissions from refiner-ies). Furthermore each emission figure is linked to an AARD code, representing the environmental compartment to which the emission should be grouped (air, water, soil). For some of the emission sources the AARD code is used to indicate whether or not the emission (and where) from that source should be included in the IPCC reporting. For each of the greenhouse and precursor gases this link between RAPCODE and AARD is defined resulting in a correspondence table which links each combination of RAPCODE, AARD and compound to the appropriate CRF (sub)sector table (IPCC subcode). On the following page the layout of the corre-spondence table is given. In total the table consists of over 2200 records.

TNO-report
TNO-MEP − R 2002/400 5 of 13
RAP-CODE Aard Compound IPCC Proces discription0012107 01 KOOLSTOFMONOXI1A4b Vuurhaarden consumenten (verbrandingsemissies), Hoofdverwarming wonin0012107 01 KOOLSTOFDIOXIDE1A4b Vuurhaarden consumenten (verbrandingsemissies), Hoofdverwarming wonin0012107 01 DISTIKSTOFOXIDE 1A4b Vuurhaarden consumenten (verbrandingsemissies), Hoofdverwarming wonin0012107 01 STIKSTOFOXYDEN 1A4b Vuurhaarden consumenten (verbrandingsemissies), Hoofdverwarming wonin0012107 01 ZWAVELOXIDEN (AL1A4b Vuurhaarden consumenten (verbrandingsemissies), Hoofdverwarming wonin0012107 01 NIET-METHAAN VOS1A4b Vuurhaarden consumenten (verbrandingsemissies), Hoofdverwarming wonin0012107 01 METHAAN 1A4b Vuurhaarden consumenten (verbrandingsemissies), Hoofdverwarming wonin0012207 01 KOOLSTOFMONOXI1A4b Vuurhaarden consumenten (verbrandingsemissie), Sfeerverwarming woning0012207 01 DISTIKSTOFOXIDE 1A4b Vuurhaarden consumenten (verbrandingsemissie), Sfeerverwarming woning0012207 01 STIKSTOFOXYDEN 1A4b Vuurhaarden consumenten (verbrandingsemissie), Sfeerverwarming woning0012207 01 ZWAVELOXIDEN (AL1A4b Vuurhaarden consumenten (verbrandingsemissie), Sfeerverwarming woning0012207 01 NIET-METHAAN VOS1A4b Vuurhaarden consumenten (verbrandingsemissie), Sfeerverwarming woning0012207 01 METHAAN 1A4b Vuurhaarden consumenten (verbrandingsemissie), Sfeerverwarming woning0020402 01 KOOLSTOFMONOXI1A1c SBI 11:OLIE- EN GASWINNING, VERBRANDINGSEMISSIES, winning ener0020402 01 KOOLSTOFDIOXIDE1A1c SBI 11:OLIE- EN GASWINNING, VERBRANDINGSEMISSIES, winning ener0020402 01 DISTIKSTOFOXIDE 1A1c SBI 11:OLIE- EN GASWINNING, VERBRANDINGSEMISSIES, winning ener0020402 01 STIKSTOFOXYDEN 1A1c SBI 11:OLIE- EN GASWINNING, VERBRANDINGSEMISSIES, winning ener
As stated earlier, the ER system and thus the RAPCODES evolved from the past. In former years it became clear that for transparency and uniformity a rearrange-ment and or renaming of the RAPCODES became unavoidable. All emission fig-ures for the years 1990,1995, 1998, 1999 and 2000 were included in the ER data-base for the year 2001 using the new set of RAPCODES. For these years a consis-tent allocation of the emission and available activity data was established in the CRF.
TNO in co-operation with the RIVM defined and refined the correspondence table between RAPCODE, AARD and Compound and IPCC (sub) sector.
2.2 Additional data sources
The current ER database does not include all data necessary to fill in the CRF. For this reason additional data sources were used to complete the CRF files. This para-graph describes what data were not available in the ER database and thus had to be retrieved from other sources.
2.2.1 Energy related data
As mentioned before in the 2001 inventory data for the years 1990, 1995, 1998, 1999 and 2000 were included to the ER database using the new RAPCODES. In principle all emission data should have been delivered to the database accompanied with the fuel quantities. We observed that this was not the case for the year 1998 and 1999, caused by the poor quality of the environmental reports of individual companies. These reports included CO2 data but not the related fuel type specific quantities on which the CO2 emissions were based.
Activity data for the production of gas and oil and oil refining were derived from sector information (NOGEPA) and energy statistics (CBS) provided by the RIVM.

TNO-report
TNO-MEP − R 2002/400 6 of 13
Data for the reference approach and feedstock tables were provided by the CBS from the energy statistics (excluding statistical differences) and were copied in the CRF files (for the years 1990, 1995 and 1998-2000).
2.2.2 Industrial processes
The emission data for industrial processes were extracted from the ER database. In former years the ER database did not include detailed data on the level of indi-vidual species of the F-gases but were provided by the RIVM for the CRF. In 2001 for the ER 2001 inventory years these data were included in the ER database and thus in the CRF. The detailed (recalculated) data related to the F-gases (emission and activity data) for the intervening years were retrieved directly from the task-force (RIVM) and included in the CRF.
As concluded in the previous submission only few activity data for industrial proc-esses are available in the appropriate format in the ER database. The reason for this is confidentiality of the production data from the CBS (especially for those indus-trial sectors that include only few individual firms). Furthermore, at the CBS the physical activity data are in most cases not available (no physical production data but only economical data such as market value of production). Therefore this year additional activity data were retrieved from public publications related to industrial activities (other than CBS sources, including environmental re-ports from individual companies). For the cement, steel and aluminium production the activity data were retrieved from specific sector data (environmental reports from individual companies) by the RIVM (Peek) and were included in the CRF.
2.2.3 Other sectors
Agriculture For the years 1990, 1995, 1996, 1997, 1998, 1999 and 2000 all activity data and emissions were improved based on more detailed statistics by the RIVM (Van der Hoek).
Land use change and forestry (LUCF) In 2001 a study was performed into the CO2 removals from forestry (LUCF cate-gory 5.A.). The results of this study were provided by ALTERRA (Daamen) and included in the CRF (sectoral tables 5A) for the years 1990-2000.
Waste Additional information and data (for clarification of emission data) were included in the CRF for the years 1990-2000. These data were supplied by the RIVM (Beker) from their decomposition model for landfilled wastes.

TNO-report
TNO-MEP − R 2002/400 7 of 13
Other sectors Activity data for N2O use were retrieved from the database for all years and in-cluded in the CRF.
2.3 Data changes for earlier inventory years (1991-1994 and 1996-1997)
The 2001 ER database does not include data for the years 1991-1994 and 1996 and 1997. Recalculations of the emissions in these years were provided by the task-forces and were included directly in the CRF without altering the ER database for those years.
Although not part of the 2001 inventory the energy related (combustion) emissions for the years 1996 and 1997 were included in the CRF. This was done because they were lacking in the previous submission and including the 1996 and 1997 data in the CRF made the time series for energy related emissions consistent from 1995 to 2000. To do this, two adjustments to the 1996 and 1997 data were made: – The energy related data were converted to the new RAPCODE set. – In 2001 the statistical difference was eliminate from the Dutch energy balance
for the years 1990, 1995, 1996, 1997 and 1998. So the fuel consumption and emissions for these years in the CRF had to be revised accordingly (for all greenhouse gases).
Recalculated emissions and activity data for the transport sector for the years 1991 to 1998 were delivered by the taskforce Traffic and Transport based on the emis-sion calculation model which also generated the 1990, 1995,and 1998 to 2000 data for the ER database (RIVM).
Detailed (recalculated) data related to the F-gases (emission and activity data) for the years 1991-1994 and 1996 and 1997 years were retrieved directly from the taskforce (RIVM) and included in the CRF.
Activity data for the production of gas and oil and oil refining were derived from sector information (NOGEPA) and energy statistics (CBS) provided by the RIVM.
Data for the reference approach and feedstock tables were provided by the CBS from the energy statistics (excluding statistical differences) and were copied in the CRF files (for the years 1996 and 1997).
Additional activity data as mentioned in paragraphs 2.2.2.and 2.2.3 were also pro-vided and included in the CRF for the years 1991-1994 and 1996-1997. For 1990 to1992 the emissions from cement clinker and related activity data were revised (based on environmental reports by the RIVM), thereby filling the data gap from last years submission.

TNO-report
TNO-MEP − R 2002/400 8 of 13
3. Import of data in CRF and control procedures
3.1 Initial import of data in CRF
TNO retrieved all available data from the ER database using the correspondence table between RAPCODES and IPCC category. This action yielded a table with emissions per CRF category without the fuel split as requested in Table 1.A(a and b). Based on the fuel data in the ER database the category totals were allocated to solid, liquid, gaseous, biomass or other fuels. These data and the additional data as mentioned in paragraphs 2.2 and 2.3 were copied manually into the CRF files for all years. The data in the CRF files from the previous submission were in fact updated (overwritten). Where necessary the input of data was documented in the documentation boxes at the end of the tables (especially when the definition or allocation was different from the IPCC guidelines). The explanation of the IE codes (and the source categories where the data were in-cluded) was also included in the documentation boxes throughout the CRF files for all years. In addition emission cells containing a zero (0) were checked for replacement by one of the appropriate notation key (IE, NE, NO, C, NA).
3.2 Control procedures
We note that the source list in the ER database does not correspond one to one with the source categories in the CRF. Furthermore the quality of the energy data from individual firms from 1997 onwards is poor due to the introduction of a new sys-tem for reporting these data to the database. Therefore after allocation of the ER data to the CRF (using the correspondence table between RAPCODE-AARD to IPCC sector) extensive checks were performed, in particular in the fuel combustion tables. These control activities consisted of: – Completeness of data; – Comparison of national totals with earlier published data (Environmental
Balance, Emission Monitor); – Check of the emission trends in the sectoral background tables; – Check of implied emission factors (value and trend); – Check of activity data (value and trend); – Comparison of sectoral data with reference approach.
To facilitate these checks the control spreadsheets used for the previous submission were improved and extended (see Appendix 1 and 2).
This year it became apparent that a lot of work and time is needed to perform all the checks. Questions or problems arising from the checks were answered and or

TNO-report
TNO-MEP − R 2002/400 9 of 13
solved on the basis of detailed analysis of the background data including communi-cation with the persons (from the Taskforces) responsible for the data. Based on the findings the original allocation of the data in the CRF was altered (e.g. by moving inconsistent CO2 – fuel data to “other fuel”) and or additional data were included. The input procedures are documented in detail in Appendix 1.
The findings of the control procedures (which were noted in cells of the control spreadsheets) were also used for the textual explanations of the data in the NIR.
The control findings and the explanations of the changes in the data compared to the previous submission were input for the revision of the “Recalculation tables” (CRF Table 8(a) and 8(b)). They were updated for all years. The changes in data had also implications for the completeness of the CRF, which are reported in Table 9 of the CRF files. The emission trends over the period 1990-2000 were docu-mented only in the CRF file for the year 2000 in Table 10 “Emission Trends” (in other files it is redundant).
After completion of the input and control procedures the CRF files were send to the RIVM, including all control spreadsheets and tables and figures, derived from the CRF files, which were included in the NIR.

TNO-report
TNO-MEP − R 2002/400 10 of 13
4. Revisions after initial submission to the UNFCCC
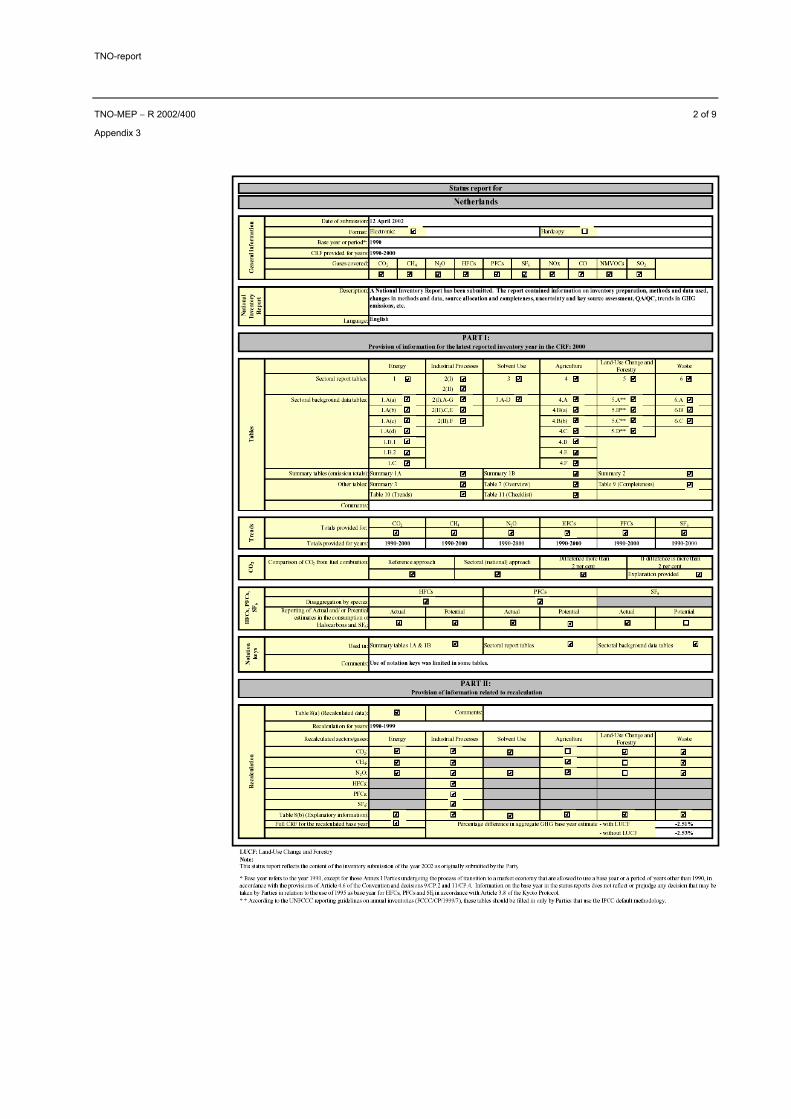
In may 2002 the UNFCCC send a Draft Status Report of the 2002 greenhouse gas inventory submission of the Netherlands and a Data Consistency Report. The Dutch reactions to these reports are elaborated in appendix 3. The reports of the se-cretariat resulted in a resubmission of improved CRF files for the Netherlands.
All files related to the completion and revisions of the CRF are stored at TNO ac-cording to the quality system accredited under ISO 9001. Relevant files will be made available on the internet: www.greenhousegases.nl.
From the secretariats response to the initial submission we concluded that the fol-lowing points need to be addressed in the 2003 submission: Include notation keys in sectoral and summarising tables of the CRF Give an explanation of all the notation keys (not standard) and abbreviations used in the CRF files. Include annual growth increment and total biomass consumption of stocks in the LUCF table (5A). Try not to used changed formulas in the CRF, whenever necessary document these changes in the CRF files.
In the 2003 submission the Netherlands will use the new CRF format that will help to implement above-mentioned points.

TNO-report
TNO-MEP − R 2002/400 11 of 13
5. Experiences and possible future improvements
This chapter deals with the most important experiences/problems encountered dur-ing the completion of the CRF files. The emphasis lies on the aspects related to the Dutch emission inventory and the associated data handling and storage. The ex-perience related to allocation problems and emission trends is included in the NIR (sections 5 and 6).
The Dutch emission inventory is not yet fully equipped to fulfill all data demands of the CRF. One of the major problems is the poor quality of the fuel type data from individual firms. The link between fuel data and emission is often not known or fuel data are not available. One of the consequences is that the use of biomass in combustion is not always identifiable. In addition, the use of fuels for energy or chemical feed stocks is also quite often unclear. It is therefore that sometimes com-bustion emissions are registered as process emissions. Work is in progress to im-prove the quality of these data but it will take some years to bring them up to stan-dard.
Furthermore a point of concern is the absence of a structural inventory of the re-quired activity data for non-combustion sources. It would be advisable to incorpo-rate these activities in the work plan for the Emission Registration. Problem in this is the fact that in the Netherlands the inventory is at this moment more aimed at emissions per industrial sector rather than focused on specific industrial processes as required in the CRF. A further problem is the confidential nature of some activ-ity data. It is advisable to investigate the willingness of the relevant sector to make the required activity data available in a structural manner on a yearly basis.
The ER database does not yet cover the total period from 1990-2000. Recalculated data are thus not available in the ER database for the total period; only for the 2001 inventory years. At present, he CRF files are the only dataset were recalculated na-tional data are stored in a structural manner. However, although some taskforces recalculate the full time period back to 1990, only data for the ER selection of years are stored in the database.
For 1996 and 1997 the allocation of emissions is still according to the old RAPCODES (except the emissions from fuel combustion). In the next submission the allocation for process emissions in industry will be made according the new RAPCODES and the updated correspondence table for RAPCODES and IPCC category.
Table 5A was filled for 1990 to 2000. The calculation of the future data is not yet arranged, neither the incorporation in the Dutch Emission Inventory.

TNO-report
TNO-MEP − R 2002/400 12 of 13
In the process of preparing the final ER database trend checks are at this moment only performed on the national total and the Netherlands Target group total emis-sions (not explicit on the IPCC totals, or the IPCC breakdown in combustion and non-combustion sources). Checks for trends can thus only be done after completion of the CRF files. Work is in progress to include IPCC in the ER trend check in July 2002. One of the first actions in the improvement process is to finalise the corre-spondence table RAPCODES and IPCC category before July 2002.
If this trend check can be established this would contribute to a more efficient fill-ing of the CRF files in the year 2002 and error correction prior to the finalisation of the ER dataset.
In the 2003 submission The Netherlands will use the new CRF format, which will improve the data consistency.
TNO-report
TNO-MEP − R 2002/400 13 of 13
6. Authentication
Name and address of the principal:
Ministry VROM
Names and functions of the cooperators:
Ir. P.W.H.G. Coenen Drs. J.G.J. Olivier (RIVM)
Names and establishments to which part of the research was put out to contract:
-
Date upon which, or period in which, the research took place:
Signature: Approved by:
Ir. P.W.H.G. Coenen Ir. H.S. Buijtenhek Project Leader Head of Department

TNO-report
TNO-MEP − R 2002/400 1 of 6
Appendix 1
Appendix 1 Detailed documentation of input procedures
1) General In the 2002 submission further actions were undertaken to complete the CRF data for the total time series 1990-2000. The data for the year 2000 are preliminary data and the 1999 data are now finalised (the reason why the 1999 data from this submission differ from the previous sub-mission).
After submission of the CRF files to the Secretariat in Bonn, the Netherlands re-ceived some comments/questions on their submission. The relevant files and the Dutch responses to the subjects addressed are included in Appendix 3.
2) Remarks per CRF table
Table 1.A(a): Fuel data were extracted from the ER database. In the 2001 inventory the fuel data for the years 1990, 1995-2000 were revised in conformity with the new definition (excluding statistical difference). This also affected the Reference Approach (Ta-ble 1 A(b)).
Using the new correspondence table between RAPCODE and IPCC the emission and activity data from the ER database were allocated in the CRF. Based on the fu-els used, the allocation was further specified using the following rules: – Emissions from specific industrial processes which were not as such identifi-
able in the ER database (e.g. non ferrous metals) were allocated under OTHER (f . category);
– Emissions without fuel data were allocated under Other Fuels; – Emissions from the combustion of organic matter, wood and biogas were allo-
cated under Biomass; – Emissions from blast furnace and coke oven gas were allocated under Solid
Fuels; – Emissions from refinery gas and LPG were allocated under Liquid Fuels; – The implied emission factors for CO2 were checked. In those cases where the
IEF differed significantly from the expected level the emissions for all compo-nents and the corresponding fuel data were moved to Other Fuels.
TNO-report
TNO-MEP − R 2002/400 2 of 6
Appendix 1
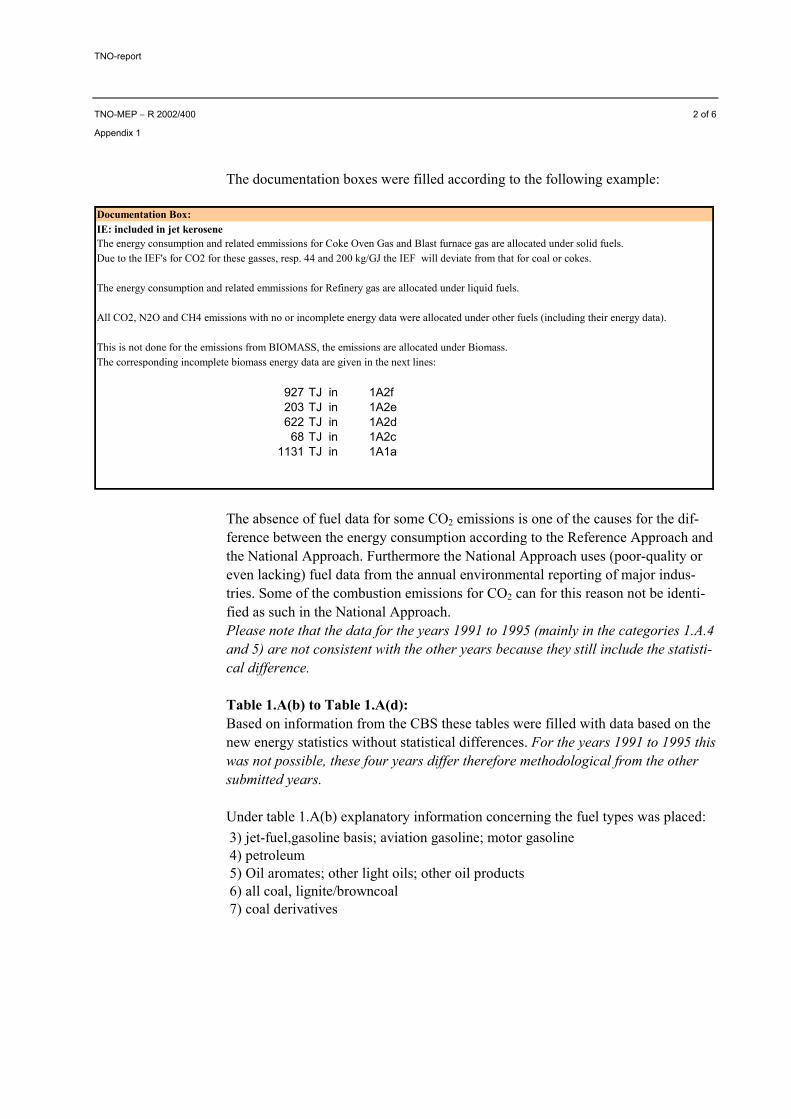
The documentation boxes were filled according to the following example:
Documentation Box:IE: included in jet keroseneThe energy consumption and related emmissions for Coke Oven Gas and Blast furnace gas are allocated under solid fuels.Due to the IEF's for CO2 for these gasses, resp. 44 and 200 kg/GJ the IEF will deviate from that for coal or cokes.
The energy consumption and related emmissions for Refinery gas are allocated under liquid fuels.
All CO2, N2O and CH4 emissions with no or incomplete energy data were allocated under other fuels (including their energy data).
This is not done for the emissions from BIOMASS, the emissions are allocated under Biomass. The corresponding incomplete biomass energy data are given in the next lines:
927 TJ in 1A2f203 TJ in 1A2e622 TJ in 1A2d68 TJ in 1A2c
1131 TJ in 1A1a
The absence of fuel data for some CO2 emissions is one of the causes for the dif-ference between the energy consumption according to the Reference Approach and the National Approach. Furthermore the National Approach uses (poor-quality or even lacking) fuel data from the annual environmental reporting of major indus-tries. Some of the combustion emissions for CO2 can for this reason not be identi-fied as such in the National Approach. Please note that the data for the years 1991 to 1995 (mainly in the categories 1.A.4 and 5) are not consistent with the other years because they still include the statisti-cal difference.
Table 1.A(b) to Table 1.A(d): Based on information from the CBS these tables were filled with data based on the new energy statistics without statistical differences. For the years 1991 to 1995 this was not possible, these four years differ therefore methodological from the other submitted years.
Under table 1.A(b) explanatory information concerning the fuel types was placed: 3) jet-fuel,gasoline basis; aviation gasoline; motor gasoline4) petroleum5) Oil aromates; other light oils; other oil products6) all coal, lignite/browncoal7) coal derivatives

TNO-report
TNO-MEP − R 2002/400 3 of 6
Appendix 1
Under 1.A(c) the following documentation box was placed: Documentation Box:
The energy consumption in the national approach (NA) is based on the data from the national inventory.These fuel data are not complete due to:1) Not all CO2 emissions (from combustion) submitted by industry are accompanied by fuel data in the inventory;
2) In industry reports some of the CO2 emissions from combustion are allocated as process emissions and thus the corresponding fuel data are not incorporated in the totals for the fuel data.
3) Industries may calculate and report actual CO2 emissions from energy used as chemical feedstock using different overall CO2 emission factors for the amount of energy carriers converted into products than used in the RA for estimating non-reported feedstock emissions.
4) Industry firms report more heavy fuels used as chemical feedstock than the energy statistics used in the RA.
The extent of these causes may differ from year to year, which then also causes the fluctuationsin the difference between RA and NA.
In addition, the RA figures are calculated using preliminary values for the carbon content of crude oil and NGL.For more information see the National Inventory Report.
In Table 1.A.(d) in the cells for Coal/lignite and Coke in 1999 and 2000 a reference to the documentation box (see below) was placed related to changes if the defini-tion of energetic and non- energetic use of these fuels.
Documentation box: A fraction of energy carriers is stored in such products as plastics or asphalt. The non-stored fractionof the carbon in the energy carrier or product is oxidized, resulting in carbon dioxide emissions, either during the use of the energy carriers in the industrial production (e.g. fertilizer production), or during the use of the products (e.g. solvents, lubricants), or in both (e.g. monomers). To report associated emissions use the above table, filling an extra "Additional information" table, as shown below.Definition of non energy use for coal and cokes is changed since 1999, fuel quantities according to old definition are not available. According to new definition figures are coal/lignite 3) 18.998,00 TJ
coke 3) 35.627,00 TJ
Associated CO2 emissions (a) e.g. Industrial Processes, Waste(Gg) Incineration, etc.
20.045,00 Non-energy use of energy carriers in industrial processes and waste incineration3.217,00 chemical feedstock [1A2.c ]
Allocated under(Specify source category) (a)
Please note that the automatic link between tables 1.A(b) and 1.A(d) was disabled for Coal oils and Tars.
Table 1.B.1 Input and explanation of notation keys (NO and IE). Documentation box: IE: IE included in 1.A.2

TNO-report
TNO-MEP − R 2002/400 4 of 6
Appendix 1
Table 1.B.2 Available activity data for all years from RIVM (Montfoort) were included. Please note that for the period 1991-1995 the allocation of the emissions differs from the other years. The requested Additional information is not available in the ER database. No notation keys were used in the additional information.
Table 1.C Input based on ER database.
Table 2(I).A-G In 2000 it was concluded that most activity data (physical production) for industrial processes is nor available neither in the national statistics nor in the ER database. The reason for this lies in the confidentiality obligations of the CBS. Whenever only one or a few companies are operating in the Netherlands the production data are nor to be publicised by the CBS. Because this is often the case in the Nether-lands it is not possible to link emission figures to the appropriate activity data. Therefore only in the emission columns the notation keys (IE , NE) were used and the emissions were aggregated to the categories “other”. An exception is made for the cement industry where the unique link between the emissions in the ER database and external (from RIVM) activity data could be es-tablished. Also for the steel and aluminium production activity data were delivered by the RIVM.
Table 2(II), Table 2(II).C,E, Table2(II).F These tables were filled with the recalculated emission data for the years 1990 and 1995-2000. Emission figures are available, activity data are not always available partly due to confidentiality reasons. Please note that the Netherlands introduced a column “Unspecified” for HFCs and PFCs in Table 2(II).
HFC
-152
a
HFC
-143
HFC
-143
a
Uns
peci
fied
HFC
-236
fa
HFC
-245
ca
Tot
al H
FCs(1
)
C 3F
8
C4F
10
Uns
peci
fied
C5F
12
C6F
14
Tot
al P
FCs(1
)
SF6

TNO-report
TNO-MEP − R 2002/400 5 of 6
Appendix 1
Table 3, Table 3.A-D Data, including available activity data were extracted from the ER database. No activity data can be generated for the emissions of CO2 and NMVOC, allocated in this category.
C 3F
8
C4F
10
Uns
peci
fied
C5F
12
C6F
14
Tot
al P
FCs(1
)
SF6
Table 4 to Table 4.D All emission data for the years 1990 and 1995 to 2000 were recalculated by the RIVM. In the tables 4.A and 4.B(a) only the population size column was filled in, because the other data are not available. Only the total Dutch nitrogen excretion from live-stock is reported in Table 4.B(b). No further notation keys were used in these ta-bles. In Table 4.D emissions and activity data were filled in. The additional information box and the cells, which are not applicable to the Netherlands, were kept empty (no notation keys).
Table 4.E and Table 4.F Not applicable for the Netherlands thus notation keys were introduced.
Table 5 and 5.A to 5.D New CO2 data from the recalculation for “Changes in forest and other woody bio-mass stocks” were introduced in Table 5.A for the years 1990-2000. The cells, which are not applicable for the Netherlands, were kept empty. In table 5.C and 5.D notation keys were used on the aggregated level.
Table 6, Table 6.A,C and Table 6.B Emissions were extracted from the ER database. The RIVM and CBS Statline sup-plied activity data. Some of the information asked for in the CRF was not available en those cells were kept blank. Activity and Additional data for Table 6.B are not available and were kept blank.
Summary1 to Summary 2 These tables are (for the major part) generated automatically. The hand-filled cells were copied from the sectoral background tables. Cells relating to sources with no emissions were kept blank
Summary 3 Based on the changes in methods for this submission the summary was adapted in conformity with the explanations in the NIR.

TNO-report
TNO-MEP − R 2002/400 6 of 6
Appendix 1
Table 7 Where applicable notation keys were updated based on information of the RIVM.
Table 8(As1) and Table 8(As2) The columns “previous submission” were copied from the submission 2001. In the columns “latest submission” automatic links to the appropriated tables were intro-duced.
Table 8(b) This table was revised for all years. The major changes were elaborated; small changes due to reallocations were explained in general terms.
Table 9 This table was revised for all years. Please note that all IE notations are also ex-plained in the documentation boxes in the sectoral background tables.
Table 10 The Netherlands filled this table only in the CRF file for the year 2000, giving the complete time series of GHG gas emissions.

TNO-report
TNO-MEP − R 2002/400 1 of 4
Appendix 2
Appendix 2 Control procedures
During the preparation of the CRF files several checks were performed to guaran-tee the best possible allocation and time consistency of the data. For this purpose special build spreadsheets were used. Whenever alterations in the CRF draft files were made by TNO these spreadsheets were used for checks. The external reviews (by the RIVM) proved to be very helpful and necessary to detect deficiencies and flaws in the draft CRF files. In the following paragraphs the content of the spread-sheets will be elaborated.
INPUT_CRF_DATA.xls This spreadsheet chronological documents the data flow and implementation of changes in allocation from the data from the ER database to the final CRF files for the years 1990, 1995, 1998, 1999 and 2000. It also includes the original IEF’s and the allocation changes, which were made to realize orderly trends in IEF’s over the years For the years 1996 and 1997 the fuel split for the emissions from fuel combustion was additional registered in the ER database, these data were also included in the file. As mentioned earlier for the year 1996 and 1997 only the emissions from fuel combustion were registered in the new RAPCODE set. This file also documents the allocation alterations (some process emissions needed to be allocated under combustion), which were necessary to make the time series consistent. Please note that the allocation of the emissions for 1996 and 1997 can change in the future when all emissions come available in the new RAPCODE set.
Diff_prev_submis.xls This spreadsheet documents the change in absolute figures and in terms of per-centages between the emissions as reported in the current (2002) and previous sub-mission (2001). There where significant changes occurred these were documented in a remark re-lated to the cell concerned. The detected major changes are also explained in the NIR.
Trend checks Four spreadsheets were made in which the time series from 1990 to 2000 are given for emissions, activity data and where appropriate IEF’s. On the next pages exam-ples of parts of the four trend spreadsheets are given.

TNO-report
TNO-MEP − R 2002/400 2 of 4
Appendix 2
Trend_GHG.xls Giving emissions and IEF for the greenhouse gases. EMISSIONS CO2
1990 1991 1992 1993 1994 1995 1996 19971.A. Fuel Combustion1.A. Fuel Combustion 157.143 165.429 163.962 166.374 167.134 170.300 177.003 166.084
Liquid Fuels 36.728 26.476 27.772 28.474 28.840 38.551 41.496 40.332Solid Fuels 31.431 33.073 29.161 25.997Gaseous Fuels 70.766 71.181 85.147 66.352Biomass 3.547 2.700 2.600 3.300 3.500 3.532 4.500 5.314Other Fuels 18.218 138.953 136.190 137.900 138.294 27.495 21.199 33.402
1.A.1. Energy Industries 51.513 52.190 54.130 53.800 55.980 56.589 59.306 58.200Liquid Fuels 5.635 5.508 6.635 6.451Solid Fuels 25.616 27.817 26.414 23.963Gaseous Fuels 17.284 18.352 21.138 18.906Biomass 2.249 2.342 66 135Other Fuels 2.979 52.190 54.130 53.800 55.980 4.913 5.119 8.880
a. Public Electricity and Heat Production 41.020 41.550 43.250 43.160 44.790 45.230 46.752 46.118Liquid Fuels 219 20 187 247Solid Fuels 25.507 26.996 26.414 23.963Gaseous Fuels 13.833 16.321 18.402 16.627
IEF CO2
1990 1991 1992 1993 1994 1995 1996 19971.A. Fuel Combustion1.A. Fuel Combustion
Liquid Fuels 71 73 73 73 73 71 70 70Solid Fuels 101 103 104 100Gaseous Fuels 56 56 56 55Biomass 306 358 448 516Other Fuels 161 3.491 3.492 3.707 3.918 121 245 121
1.A.1. Energy IndustriesLiquid Fuels 63 62 62 59Solid Fuels 101 100 102 98Gaseous Fuels 57 57 56 57BiomassOther Fuels 194 152 123 94
a. Public Electricity and Heat ProductionLiquid Fuels 76 70 75 76Solid Fuels 102 100 102 98Gaseous Fuels 56 57 56 57
Trend_precursors.xls Giving the emission trend for the precursor gases.
EMISSION TRENDS (SO2) Based on CRF-00.xls
GREENHOUSE GAS SOURCE AND SINK 1990 1995 1996 1997 1998 1999 2000 CATEGORIESTotal National Emissions and Removals 202,35 141,42 133,51 116,45 108,01 102,91 91,201. Energy 194,14 137,37 115,39 99,38 104,63 99,82 87,98
A. Fuel Combustion Reference Approach (2)
Sectoral Approach (2) 187,47 128,51 104,89 89,30 96,78 92,12 81,031. Energy Industries 105,80 66,34 63,99 55,52 52,80 51,98 41,42
44,18 26,84 12,48 9,46 19,20 15,24 14,743. Transport 29,35 29,52 26,58 22,79 23,45 23,48 23,624. Other Sectors 7,17 4,43 1,85 1,53 1,26 1,40 1,225. Other 0,97 1,38 0,00 0,00 0,06 0,02 0,02
B. Fugitive Emissions from Fuels 6,67 8,86 10,50 10,08 7,84 7,70 6,951. Solid Fuels 0,00 IE IE IE IE IE IE2. Oil and Natural Gas 6,67 8,86 10,50 10,08 7,84 7,70 6,95
2. Industrial Processes 7,41 3,34 17,90 16,02 2,71 2,43 2,58A. Mineral Products 6,32 2,77 2,80 0,00 2,24 2,42 2,57B. Chemical Industry IE 0,00 4,50 0,00 0,00 0,00 0,00
2. Manufacturing Industries and Construction

TNO-report
TNO-MEP − R 2002/400 3 of 4
Appendix 2
Trend_F_Gases.xls Giving the emission trend for the F- gases. EMISSION TRENDS ( HFCs, PFCs and SF6) Based on CRF-00.xls
Emissions of individual compounds in ton
Base year(1) 1990 1991 1992 1993 1994(Gg)
Emissions of HFCs(5) - CO2
equivalent (Gg)5.978,00 4.431,84 4.820,40 4.539,60 5.066,10 6.338,51
HFC-23 492,21 378,79 412,00 388,00 433,00 536,00HFC-32 2,40 0,00 0,00 0,00 0,00 0,00HFC-41 0,00 0,00 0,00 0,00 0,00 0,00HFC-43-10mee 0,00 0,00 0,00 0,00 0,00 0,00HFC-125 3,83 0,00 0,00 0,00 0,00 0,00HFC-134 0,00 0,00 0,00 0,00 0,00 0,00HFC-134a 152,42 0,00 0,00 0,00 0,00 49,85HFC-152a 0,00 0,00 0,00 0,00 0,00 17,86HFC-143 0,00 0,00 0,00 0,00 0,00 0,00HFC-143a 1,70 0,00 0,00 0,00 0,00 0,00HFC-227ea 0,00 0,00 0,00 0,00 0,00 0,00HFC-236fa 0,00 0,00 0,00 0,00 0,00 0,00HFC-245ca 0,00 0,00 0,00 0,00 0,00 0,00HFC Unspecified 0,75 0,00 0,00 0,00 0,00 0,00
Emissions of PFCs(5) - CO2 equivalent (Gg)
1.866,76 2.431,74 2.436,78 2.098,69 2.118,36 1.890,43
CF4 223,00 301,00 301,00 258,00 260,00 228,00C2F6 38,00 48,00 48,00 41,00 41,00 38,00C 3F8 0,00 0,00 0,00 0,00 0,00 0,00C4F10 0,00 0,00 0,00 0,00 0,00 0,00c-C4F8 0,00 0,00 0,00 0,00 0,00 0,00C5F12 0,00 0,00 0,00 0,00 0,00 0,00C6F14 0,00 0,00 0,00 0,00 0,00 0,00PFC unspecified 8,06 4,01 4,61 5,30 6,09 7,00
Emissions of SF6(5) - CO2
equivalent (Gg)360,89 186,90 100,38 106,36 109,94 147,94
SF6 15,10 7,82 4,20 4,45 4,60 6,19
GREENHOUSE GAS SOURCE AND SINK CATEGORIES

TNO-report
TNO-MEP − R 2002/400 4 of 4
Appendix 2
Trends_Feedstock.xls Giving the trends in fuel quantity, Carbon stored and carbon ef for feedstocks and non energy use of fuels. TRENDS IN TABLE 1.A(d) SECTORAL BACKGROUND DATA FOR ENERGYFeedstocks and Non-Energy Use of Fuels(Sheet 1 of 1)
Fuel quantity (TJ)FUEL TYPE (1) 1990 1991 1992 1993
Naphtha (2) 44.590 35.700 26.960 17.440Lubricants 5.440 7.320 6.060 3.090Bitumen 19.860 16.940 17.340 17.240Coal Oils and Tars (from Coking Coal) 6.490 5.790 5.850 7.470Natural Gas(2) 95.310 102.090 101.240 96.560Gas/Diesel Oil (2) 6.880 5.480 2.340 80LPG (2) 74.040 80.360 71.360 58.450Butane (2) 0 0 0 0Ethane (2) 0 0 0 0Other (please specify) 0 0 0 0
coal/lignite 3) 190 160 210 110coke 3) 5.350 3.890 3.850 3.510aromates/light oils/other oil products 75.180 165.050 163.700 145.280other kerosine 30 120 280 210residual fuel oil 500 570 450 330
Because of efficiency the draft versions of the CRF files were named crf-yy.xls (yy representing the last two digits of the year notation). Before sending the files to the EU and Bonn, the draft versions were renamed to their official submission names (crf-nld-2002-XX.xls, XX representing the year).

TNO-report
TNO-MEP − R 2002/400 1 of 9
Appendix 3
Appendix 3 Comments of the secretariat
1) Draft status report for the 2002 greenhouse gas inventory submission of the Netherlands
TNO-report
TNO-MEP − R 2002/400 2 of 9
Appendix 3

TNO-report
TNO-MEP − R 2002/400 3 of 9
Appendix 3

TNO-report
TNO-MEP − R 2002/400 4 of 9
Appendix 3
Comments of the Netherlands on “Draft status report for the 2002 greenhouse gas inventory submission of the Netherlands”
General remarks The status report only reflects the presence or absence of figures or notation keys in the cells of the CRF spreadsheets. Because the Netherlands for most years filled in the sectoral background tables in detail we did not copy all notation keys or zero values from the sectoral background tables to the sectoral report tables (as valid for the empty cells in the tables 1.A). We confined ourselves to include all required notation keys at least on the sectoral table level. It would be preferable to establish automatic links between the sectoral background tables and the sectoral reports to guarantee the linkage of the detailed information into the sectoral reports. We would like to mention that the CRF can only be evaluated in full extent in combination with all explanatory information given in the National Inventory Re-port.
Specific remarks The Netherlands did not submit a hard copy of the CRF for obvious reasons (it would be an awful lot of paper). However the Netherlands included hard copies of the most relevant CRF tables in the National Inventory Report: Table 1.A Summary: for the base years 1990 and 1995 and the years 1999 and 2000 (= IPCC table 7A) Table 8(a and b): Recalculation and explanatory information for the years 1990 and 1995 to 1999 Table 9: Completeness for the base year 1990 Table 10: Emission Trends for the greenhouse gases
The Netherlands are (as explained in the NIR) not able to report potential emis-sions of SF6 because of confidentiality reasons.
No recalculation data for CO2 from agriculture were reported because the Nether-lands chooses to report these under LUCF. Recalculation data for CH4 and N2O from Land-Use Change and Forestry were not reported because The Netherlands marks these items as Not Occurring (NO) or Not Estimated (NE).
Comments on the observed information gaps and or comments: Table 1B2: gap relates only to the “Additional Information” Table 1C: gap only in multilateral operations, which The Netherlands do
not register as a specific item Tables 2: The Dutch emission inventory cannot identify the different spe-
cific processes. There for the IE key is used often in the emis-sion columns. When used we left the other columns empty be-cause either data were not available and or it would not give any additional information when filling these other columns.

TNO-report
TNO-MEP − R 2002/400 5 of 9
Appendix 3
Tables 3: Cells were left empty because emissions and or activities are zero.
Tables 4: The Netherlands do not use the IPCC method to calculate these emissions. Therefore the additional data required in the CRF do not relate to the Dutch method and or are not available en thus were left empty.
Table 4.B(b): For the years 1991 to 1994 no data on the same detailed level as the other years is available.
Table 5(A): Only the cells were data were available and or applicable were filled. Empty cells therefore do not represent an information gap but should be considered as NE or NO, which can be derived from table 5.
Table 6(A and B): We did omit the use of NO or IE in some cells Summary 1A: All sectoral data are complete and correct. Due to the limited
availability in detailed specific figures in especially the indus-trial processes some IE and NO keys were not filled in cor-rectly.
Table 8(b) The comment made is not valid, because the year 2000 is re-ported for the first time thus there was no previous submission as asked for in this table.
2) Data Consistency Report: Netherlands (23 may 2002)
Date: May 24 2002
RESUBMISSION OF THE DUTCH CRF FILES Changes1 were made in the CRF files on the basis of the:
Data Consistency Report: Netherlands from 23 may 2002
In the process of common reporting format (CRF) data importation the secretariat performs a number of data consistency checks of the CRF submissions provided by Parties. The possible data problems identified have been listed below. Although some of the corrections required may be minor, the secretariat is not in a position to make substantial changes to the data in Parties’ submissions and Parties are en-couraged to re-submit the CRF file in its entirety to ensure that the data’s relational integrity is maintained across CRF tables. We hope the resubmission of the entire CRF will not imply an excessive burden, as only the replacement/correction of in-formation leading to inconsistencies is necessary.
1 The responses of the Netherlands on the Data Consistency Report (in
black) are marked in italic. At the end of this document we conclude with a general remark, which may help to improve the consistency of the data in the future.

TNO-report
TNO-MEP − R 2002/400 6 of 9
Appendix 3
The re-submitted data will be available to experts at later stages of the review proc-ess in order to avoid any unnecessary questioning of data consistency. To the ex-tent possible, the corrected submission should be provided within two weeks. When resubmitting the CRF, the secretariat would appreciate to receive a list of the sheets in which corrections have been made to facilitate data reprocessing and checking.
By performing these data corrections at this early stage, the secretariat will be able to better serve the GHG inventory review process in the subsequent stages (synthe-sis & assessment and individual reviews).
Type of problem: Reporting mistake
Table /year: General Comment: For the categories under “Other” a specification “miscs” is used. If
available, the specific indication of the sources would facilitate the further review of data during the subsequent stages of the review process.
Response: The Netherlands used the specification “misc” for miscellaneous sources, which belong to that specific category. A specific allocati-on to the specified sources from the CRF is not possible because this detailed level is not available in the Dutch Emission Inventory. In general it can be stated that we used “misc” to indicate all other sources in that IPCC (sub) category additional to those, which were specified in detail in that category.
Type of problem: Reporting mistake
Table /year: Table 1s2: cell C7 and Table 1A(a)s4: cell I8 (1990) Comment: The formula is removed and a number was entered (rounding) thus
creating a difference to the value reported in Table 1A(a). Response: Table 1s2: cell C7 we introduced the proper formula leading to an
increase in reported emission (20,00-> 20,28 Gg CH4)
Type of problem: Inconsistent reporting
Table /year: Table 5 and Table 5A (all years) Comment: Only the net emissions are reported in Table 5. This approach does
not comply with the requirements of table 5 and the presentation of emissions and removals in table 5A.
Response: Although this fault does not effect the reported emission we now improved Table 5
Type of problem: Inconsistent reporting
Table /year: Table 6: rows 16-17 and Table 6B: row 12 (1990-1995, 1999, 2000) Comment: There is a source specified in Table 6B, while it is not entered in
Table 6. Response: The term ”misc” in 6B stands for all registered emissions from was-
tewater and sludge. We failed to copy this explanation to Table 6. The emissions will not change by this reporting flaw and will be properly reported in the next submission
TNO-report
TNO-MEP − R 2002/400 7 of 9
Appendix 3
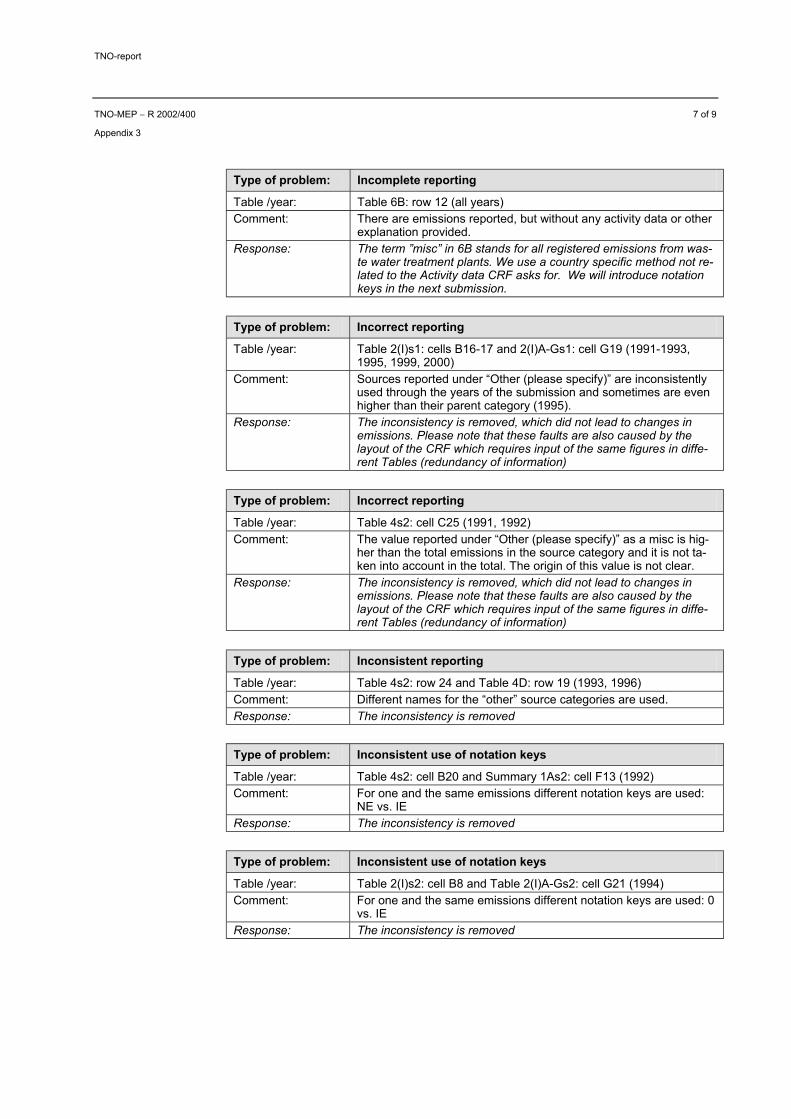
Type of problem: Incomplete reporting
Table /year: Table 6B: row 12 (all years) Comment: There are emissions reported, but without any activity data or other
explanation provided. Response: The term ”misc” in 6B stands for all registered emissions from was-
te water treatment plants. We use a country specific method not re-lated to the Activity data CRF asks for. We will introduce notation keys in the next submission.
Type of problem: Incorrect reporting
Table /year: Table 2(I)s1: cells B16-17 and 2(I)A-Gs1: cell G19 (1991-1993, 1995, 1999, 2000)
Comment: Sources reported under “Other (please specify)” are inconsistently used through the years of the submission and sometimes are even higher than their parent category (1995).
Response: The inconsistency is removed, which did not lead to changes in emissions. Please note that these faults are also caused by the layout of the CRF which requires input of the same figures in diffe-rent Tables (redundancy of information)
Type of problem: Incorrect reporting
Table /year: Table 4s2: cell C25 (1991, 1992) Comment: The value reported under “Other (please specify)” as a misc is hig-
her than the total emissions in the source category and it is not ta-ken into account in the total. The origin of this value is not clear.
Response: The inconsistency is removed, which did not lead to changes in emissions. Please note that these faults are also caused by the layout of the CRF which requires input of the same figures in diffe-rent Tables (redundancy of information)
Type of problem: Inconsistent reporting
Table /year: Table 4s2: row 24 and Table 4D: row 19 (1993, 1996) Comment: Different names for the “other” source categories are used. Response: The inconsistency is removed
Type of problem: Inconsistent use of notation keys
Table /year: Table 4s2: cell B20 and Summary 1As2: cell F13 (1992) Comment: For one and the same emissions different notation keys are used:
NE vs. IE Response: The inconsistency is removed
Type of problem: Inconsistent use of notation keys
Table /year: Table 2(I)s2: cell B8 and Table 2(I)A-Gs2: cell G21 (1994) Comment: For one and the same emissions different notation keys are used: 0
vs. IE Response: The inconsistency is removed

TNO-report
TNO-MEP − R 2002/400 8 of 9
Appendix 3
Type of problem: Inconsistent use of notation keys
Table /year: Table 4s2: cell B20 and Summary 1As2: cell F13 (1992) Comment: For one and the same emissions different notation keys are used:
NE vs. IE Response: The inconsistency is removed
Type of problem: Inconsistent use of notation keys
Table /year: Table 5: row 16 and Summary 1As2: cell F19 (1995-1998) Comment: For one and the same emissions different notation keys are used: 0
vs. NE Response: The inconsistency is removed
Type of problem: Inconsistent reporting
Table /year: Table 2(II)s2: cell W25 and Table 2(I)s2: cell H18 (1999, 2000) Comment: Different values are reported for the same source category, since
the GWP in Table 2(II) is modified for the unspecified PFCs, while Table 2(I) uses the default GWP values.
Response: We corrected the formula in cell H26 of Table 2(I)s2, which caused the fault. Emissions for 1999 decreased by 4.22 Gg CO2 eq. Emissions for 2000 decreased by 4.86 Gg CO2 eq.
Type of problem: Incorrect reporting
Table /year: Table 2(I)s1: row 8 (1996) Comment: Incorrect formula in row 8 – cells from row 19 used in the sums,
instead of cells in row 18. Response: Formulas corrected, which lead to changes in emissions for 1996.
For the GHG only N2O emissions increased with 5.20 Gg.
CO2 CH4 N2O NOx CO NMVOC SO2
P A P A P AOldTotal Industrial Processes 1.700,00 0,24 31,70 1.955,90 7.209,41 0,00 2.042,11 #WAARDE! 0,02 1,60 6,50 52,40 3,30
NewTotal Industrial Processes 1.700,00 5,44 31,70 1.955,90 7.209,41 0,00 2.042,11 CBI 0,02 17,80 171,70 73,40 17,90
(Gg) CO2 equivalent (Gg) (Gg)
HFCs(1) PFCs(1) SF6
Type of problem: Incorrect reporting
Table /year: Table 2(II) C, E (all years) Comment: The column for activity data “description” is not filled in for all the
activity data reported. Response: No activity data can be submitted either for confidentiality reasons
or due to country specific methods. In the next submission we will use notation keys for explanation.
Type of problem: Incorrect reporting
Table /year: Table 2(I)A-Gs1: cells G19-20 (1999) Comment: Two “other” source categories are reported that have identical na-
mes. This creates problems in processing the data. Response: Data are now summarized in one category
TNO-report
TNO-MEP − R 2002/400 9 of 9
Appendix 3
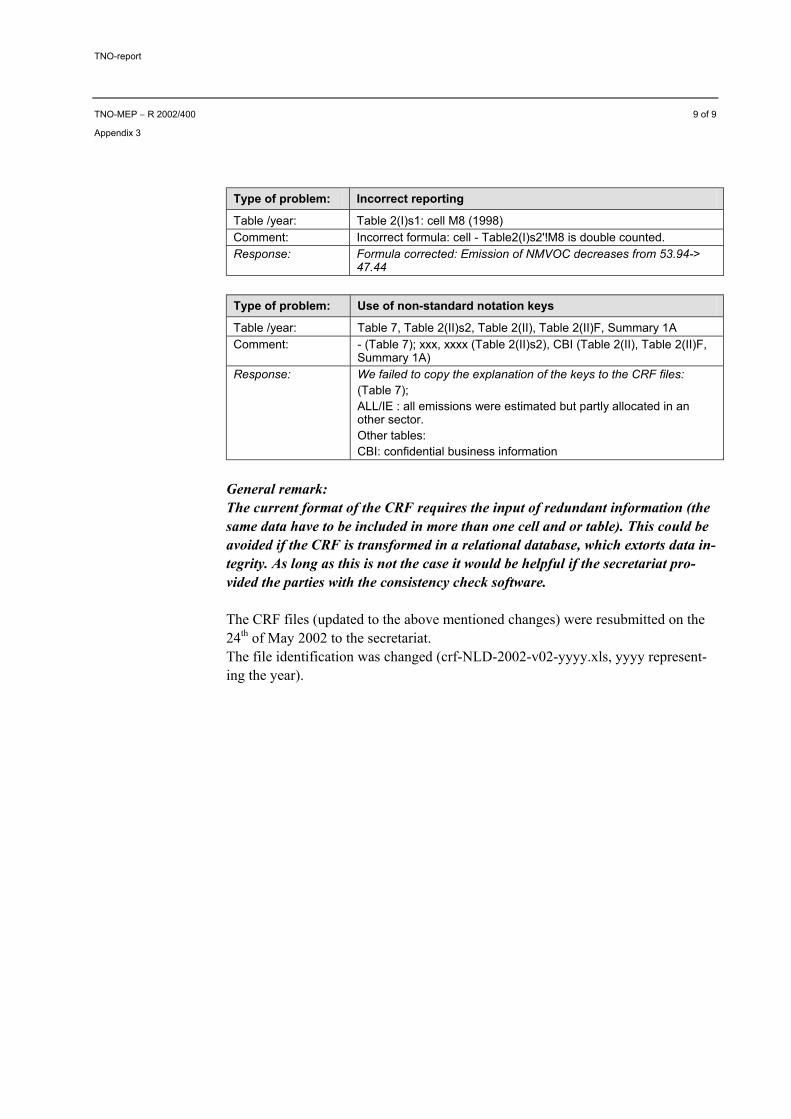
Type of problem: Incorrect reporting
Table /year: Table 2(I)s1: cell M8 (1998) Comment: Incorrect formula: cell - Table2(I)s2'!M8 is double counted. Response: Formula corrected: Emission of NMVOC decreases from 53.94->
47.44
Type of problem: Use of non-standard notation keys
Table /year: Table 7, Table 2(II)s2, Table 2(II), Table 2(II)F, Summary 1A Comment: - (Table 7); xxx, xxxx (Table 2(II)s2), CBI (Table 2(II), Table 2(II)F,
Summary 1A) Response: We failed to copy the explanation of the keys to the CRF files:
(Table 7); ALL/IE : all emissions were estimated but partly allocated in an other sector. Other tables: CBI: confidential business information
General remark: The current format of the CRF requires the input of redundant information (the same data have to be included in more than one cell and or table). This could be avoided if the CRF is transformed in a relational database, which extorts data in-tegrity. As long as this is not the case it would be helpful if the secretariat pro-vided the parties with the consistency check software.
The CRF files (updated to the above mentioned changes) were resubmitted on the 24th of May 2002 to the secretariat. The file identification was changed (crf-NLD-2002-v02-yyyy.xls, yyyy represent-ing the year).