to · 2012-06-12 · since the anodic wave of azide ion at the platinum electrode occurs at a...
TRANSCRIPT
UNCLASSIFIED
AD NUMBER
CLASSIFICATION CHANGESTO:FROM:
LIMITATION CHANGESTO:
FROM:
AUTHORITY
THIS PAGE IS UNCLASSIFIED
ADA801459
UNCLASSIFIED
CONFIDENTIAL
Approved for public release; distribution isunlimited.
Distribution authorized to U.S. Gov't. agenciesand their contractors;Administrative/Operational Use; 30 MAR 1945.Other requests shall be referred to Office ofScientific Research and Development,Washington, DC 20301.
OTS index dtd Jun 1947; OTS index dtd Jun 1947

■J-Ä'^'.- -v-^ÜÄftA.--:,;_"!: '*. M'1!.?" •MMMk
Reproduced by
AIR DOCUMENTS DIVISION

*'H" i Umt >itfab'-"' •*&.
immmmm
i ■■ US. GOVERNMENT
l* M
IS ABSOLVED
\
FROM ANY UTIGATIOhf WHICH MAY
ENSUE FROM THE CONTRACTORS IN -
FRINGING ON THE FOREIGN PATENT
RIGHTS WHICH MAY BE INVOLVED.
^
■" ■%
\- '
mzmtm^ssmmmmmmmmm


X
Copy Nos, 1-8 9-28 29 30 31 32 33 34 35 36 37 38 39 40
■ u 42
CONFIDENTIAL
■ . DIVISION 8
NATIONAL DEFENSE RESEARCH COMMITTEE
of the ' -
OFFICE OF SCIENTIFIC RESEARCH AND DEVELOPMENT
POLAROORAFHIC ANALYSIS OF PRIMERS
by ■ .V.\ James J. Lingane
Report C tt> No. 4881 ' = • ■ ;
Copy No. jTSifv Date: March 30, 1945
Dr. Irvin Stewart OSRD Liaison Office Office of the Chief of Ordnance, Attj NDRC Liaison Officer Office of the Chief of Ordnance, Att: SPOT:.! Col. C.H.M. Roberts Office of the Chief of Ordnance, Att: üPOTä Dr. L. R. Littleton Picatinny Arsenal, Att: Technical Division Chief of Bureau of Ordnance, Att: Research and Development Division Chief of Bureau of Ordnance, Att: Ke2 Comdr. J. A. E. Hindman Chief of Bureau of Ordnance, Att: Re2c Lt. W. E. Land Naval Powder Factory, Att: Dr. W. 17. Farnura . Explosives Research Laboratory Files Division 8 Files Dr. Ralph Connor Dr. J. R. Johnson ' ' , ' ./" ,■ Dr. W. E. Lawaon s : -\v; ■■''■' ." Dr. V. W. Meloche ' ,,':/■''., ;^? ■ v
Total Number of Copies - 60
This document contains information affecting the national defense of the United States within the meaning of the Espionage Act, U.S.C. 50; 31 and 32. Its transmission or the -evelation of it;-: contents in any manner to an unauthorized person is prohibited by law.
«■TOCWM

CONFIDENTIAL OSRD 4881
DIVISION 3
NATIONKL DEFENSE RK,EüRCH COMMITTEE
of the
OFFICE OF SCIENTIFIC RESEARCH aND DEVELOPMENT
POLAROGRAPHT' riNALYSiS OF PRLlETw.
Service Project: OD-118
Endorsement from Dr. Ralph Connor, Chief, Division 8 to Dr. Irvin Stewart, Executive Secretary of the National Defense Research Committee.
Forwarding report and noting: \
"This report describes a technique whereby very small amounts of mixtures of inorganic compounds commonly found in primers and detonators can be analysed quantitatively by means of the polarograph. It has been shown in OSRD 45^4 that the polarograph* is not generally adaptable for use with raixturos of organic nitro compounds; nevertheless, it is believed that the use of the polarograph, especially in conjunction with a qualitative microscopic examination as described in 03RI3 3757, constitutes a feasible laboratory method for the analysis of certain ammunition components. The procedure is capable of further refinement and probably is capable of extension to include other ingredients, but it is believed that adaptation of this technique to specific Ordnance problems can best be made by the Arsenals using the fundamental work herein de- scribed as a background. Consequently, polarographic work on this type of material has been terminated by NDRC.W
This is the final report Under Contract OE.dsr-1028 with Harvard University.
CONFIDENTIAL
OttttlDENTIAI.
POtARCXHUPHIC ANAIXSXS QP FRÜHES
This project was undertaken to develop polarographio methods
**
(1) I* M. Kolthoff and J. J. Lingans, "Polarography", Interactence Publishers, lt. Y. (1941)
of analysis for primers, primej detonators, and the materials used in their manufacture. Since theae mixtures vary widely in their composition and nature, we confined our investigations to a typical mixture composed of potassium chlorate, cuprous thiocyanate, antimonous sulflde (stibnite), lead aside, and mercury fulminate.
All materials used In this investigation were either of reagent grade-or of Ordnance quality; most of the samples were obtained from Picatinny Arsenal through the courtosy of the Commanding Officer. Analyses were performed wherever it was thought desirable; the results of these analyses and other pertinent data «re listed in Table I;
Table I. Analysis of Materials Used
Substance
Antimonous sulfide Mercury fulminate Lead azide Cuprous thiocyanate
Sodium azide
Specification Analysis
50-11-14B 97.5j$ theoretical Sb 50-11-6E 101.2g theoretical Hg 50-13-12A 99.6$ theoretical Pb, 100)i N» prepared in this laboratory by reduction of reagent CuS04, precipitation with KCNS, washing with dilute HgS03( acetone and ether. Air dried, see text. E. Z, Co. Recrystallized, see text, technical
The mercuric fulminate v." 3 analysed by dissolving a weighed •ample in S H ammonium acetate 1 the steam bath, diluting to a known volume, and recording the polar-jgraph.
The stibnite was analyzed by dissolving In concentrated hydrochloric acid, boiling to remove hydrogen sulfide, dilution to a '
CONFIDSNTIAL

OOHnHOTIAL -*-
rf*
volume of 100 oo., which was 111 In free hydrochloric acid, and recording the polarograph. The sulfide was determined using the method outlined in this report.
Analysis of the lead azide for lead content was mads in the lame manner as that for mercury in merourio fulminates.
The azide ion was determined cerimetrically. A sample of lead azide was allowed to stand in a known volume of standard ammonium hex* nltrato cerate overnight, an excess of potassium iodide was added, and the liberated iodine titrated with standard thiosulfate solution.
Azlde Ion
A sample of technical grade sodium azide was purified by preparing a saturated aqueous solution, precipitation with a large volume of pure ethanol, washing and drying in a vacuum desiccator.
i Solutions of sodium azide were investigated in various supporting
electrolytes. No indication of reduction at the dropping mercury ■leotrode was observed in 0.1 U potassium nitrate, 0.001 M hydrochloric aoid, nor in 0.1 H hydrochloric acid plus 0.2 U potassium chloride. According to Latlraers the reversible potential for the reduction of
H
(£) 15. M. Latimer, "Oxidation Potentials", Prentice-Hall, Inc., New York {1938).
hydrazoic acid to ammonium ion is +0.41 v., and for its reduction to ammonium ion and nitrogen is +1.57 v. vs. the saturated calomel electrode. Since in spite of those strongly oxidizing reversible potentials no reduction wave was found at the dropping electrode It seems that the reduction requires a larser activation energy than can be obtained in this manner.
It was found that the azide .'.on produced an anodic (oxidation) wove in potassium nitrate supporting electrolyte at the dropping electrode. In these experiments a saturated merourous sulfate •leotrode was employed, and care was taken to avoid traces of chloride Ion which produces a similar anodic wave, which vrould interfere. The anodic wave of azide ion starts at n potential of +0.15 v. vs. the saturated calomel electrode. At small concentrations the wave con- sists of two parts, but with larger concentrations a third wave appears. Measurements of the anodic diffusion current Just prior to the dissolu- tion of mercury show that it is proportional to the concentration up to about 2.5 millimolar, but above this point the limiting current remains constant and almost independent of aside concentration. From the similar behavior of the halides1 we believe the anodic reaction to be
£Bg + 2N3
A
Hge(N3)fi + 2e
OONFmBNTIAL
(1)

CONFIDENTIAL
s/3 i/e The diffusion current constant, id/(Cm t ), determined with con- centrations of azlde ion from 0.65 to 2.36 milllmolar is 2.45 ±. 0.07 at 25° in 0.5 H potassium nitrate. According to Equation 1 one equivalent of electricity is involved per mole of azide ion. This fact, coupled with the above value of the diffusion current constant gives a diffusion coefficient for azlde ion of 1.55 x 10~6 cnr^sec'1, which corresponds to a value of 56 ohms-1 for the equivalent conductance.
The anodic nave was investigated also in 0.5 M sodium acetate, ammonium acetate, aoetlc acid, sodium acetate plus acetic acid, and sodium tartrate plus tartaric &cid. In all these oases either no wave was observed or elee it was inferior to that observed with potassium nitrate as supporting electrolyte.
To obtain more information on whether the wave was due to the de- polarization of the dropping electrode with the formation of insoluble msrourous azide (Equation. 1} or to the actual oxidation of the azide ion, the behavior of azide ion we.' investigated with a stationary, platinum micro-electrode.1 This electrode consisted of a bright platinum wire 0.7 am. in diameter sealed in the end of a soft glass tube with 3.5 mm. exposed. The electrode was cleaned in chromic acid and handled with the utmost cure. The readings were» made manually 20 minutes after each change in the applied voltage, to allow time for a steady state of diffusion to be reached. The wave thus obtained starts at about +0.85 v. and is fairly well developed. There is no doubt that this wave is due to oxidation of azide ion to nitrogen (bubbles of gas were noted on the electrode) according to
2N3 3*2 + 2e (£)
Since the anodic wave of azide ion at the platinum electrode occurs at a potential that is about 0.8 v. more positive than that at the dropping mercury electrode, and since there is no reason to believe that the overvoltage at the platinum anode is any greater than at the mercury surface (if anything It should be smaller), it is clear thut the re- action at the mercury eleotrode cannot be the oxidation of the azlde ion, but must be due to the oxidation of the mercury itself according to equation 1. Alternatively, the reaction might bo assumed to be the formation of mercurio azide or an azido-mercuric complex, but we believe that either of these possibilities is less probable than equation 1.
Anodic waves wore also obtained at the platinum micro*electrode from ammonium acetate as supporting electrolyte. In either ammonium acetate or potassium nitrate the wave occurs at u potential suffi- ciently positive so that oxygen (civ) need not be removed. Although potassium nitrate is a better supf.■ rting electrolyte than ammonium acetate, it is not so suitable for use in the practical analysis of primers. Since ammonium acetate would be a good extraotont for lead azlde in primers we have used it to determine the relation between the
CONFIDENTIAL
OOHHTWriAL
limiting currant and the concentre*-on. of aside Ion. Table II oontain* representative data obtained with tue platinum anode.
Table II Limiting Current and Concentration of Azide Ion at 25°
. in 0.5 II Ammonium Acetate
Natf3, millimolar i,j, microamp.
0.769 1.48 2.14 £.76 3.08 4.33
3.£ 6.5 9.2
IS. 4 13.5 19.1
4.2 4.4 4.3 4.3 4.4 4.4
These values were measured at +1.1 v. vs. the saturated calomel electrode, and are corrected for the residual current. The ratio lg/C decreases significantly with concentrations much larger than 3 or 4 raillimolar. With very large concentrations of azide ion the current fluctuates erratically. The accuracy with which azide ion cm be determined by this technique is ebout *. 5/J. Each, electrode must be calibrated with known concentrations of azide ion.
Dilute perchloric acid was also tried a3 a supporting electrolyte and gave results better than ammonium acetate und ubout the same as potassium nitrate. Some typical data are shovai in Table III. .
Tab ,. Ill Limiting Anodic Current ai... Concentration of Azide Ion
at 25° in 0.05 H Perchloric Acid with a Platinum Microelectrode
Nazr3l raillimolar ig, microamp. id/c
0.769 2.30 2.99 1.48 4.30 2.91 £.91 8.35 £.86 5.62 - 15.6 8.78 6.15 20.7 2.54
Tram the above it can be seen that the platinum microelectrode serves fairly well for the determination of aside ion in either potassium nitrate, perchloric acid, or ammonium acetate media, but only the latter two have much significance in practical analysis of primers. They should both serve as extractants of lead azide, but ammonium acetate would probably be a better choice than perchloric acid because the latter might dissolve appreciable amounts of antimony sulflde which Is also present in some primer mixtures. It will be necessary to calibrate the electrode with lenown amounts of azide ion at the same time that the analysis is
CONFIDENTIAL
■ ■"*'*'*
COfinWMTIAL
-5-
performed, sine« we have noted that the values of WC obtained with the sane"electrode are subject to change with use of that electrode. The accuracy obtainable should be well within ±. 10£, which perhaps will serve for practical analysis. There is BIBO a possibility that the method con be Improved with experience.
Sulfide Ion
>*
Sulfide ion produces a well-defined anodic wave with the dropping mercury electrode in alkaline medium. lfle have found that in the absence of antimony the diffusion current of sulfide ion Is directly propor- tional to the concentration up to about 1.25 millimolar. With larger concentrations the value of the diffusion current ie relatively too .small* A somewhat similar effect is observed in the C&GQ of the halide ions, and in this particular case is probably due to the deposition of a film of the insoluble mercuric sulfide on the dropping; electrode.
It W£G observed that the presence of antimony decreases the diffusion current of the sulfide weve, although it has no effect on the shape. When stibnite is dissolved „n a solution of potassium tartrate end potassium hydroxide (4 M pot as; ^ura hydroxide plus 2 11 potassium tartrate, the anodic sulfide tjave is well defined, but the cPthodlc" antimony wave is not. A peculiar hump was also noted just prior to the antimony wave. This was not accidental, for it was observed in all our experiments. Solutions of "synthetic" stibnite, formed by adding stoichinmetric amounts of potassium antimony! tartrate and sodium sulfide to the alkaline tartrt.te electrolyte showed the same unfortunate characteristics, so they cannot be due to the natural material itself. Since either ion produces on excellent wave by itself in this medium the observed behavior must be due to their simultaneous presence. It was noted that solutions of stibnite in the alkaline tartrate modi urn slowly deposit a dark precipitate on standing a fev; hours. Palarographic analysis of this residue indicates that it contains antimony. Table IV shows the effect of antimony on the sulfide wave.
Table IV Influence of Antimony on Anodic Diffusion Current of Sulfide Ion in 0.25 M Hotassium Hydroxide, 0.125 U Potassium T-artrute, 0.005#
Gelatin (Sulfide as Sodium Sulfide,, Antimony^as Potassium Antimonyl Tartrate
S'
J (
, millimolar Sb *, millimolar id/(Cm t ) sulfide ion
0.567 0.000 3.78 0.565 0.196 3.52 0.546 0.365 3.38 (« Sb 0.528 1.S9 3.08 0.510 . 2.M £.91
From the above results it appears reasonable to believe that in
CONFIDENTIAL

OONH. &RXAL -e-
s
an alkaline tertrate solution containing both antimony mil fide part of the sulfide exists In a complex with the antimony. In the absence of sulfide the antimony is possibly present as a hydroxy-tartrato complex, but when the sulfide is added it apparently replaces part of the hydroxy or tartrato groups, so that there then exists a hydroxy- tartrato- sulfldo complex. Such a complex would undoubtedly give a "sulfide'' wave, but since the size of such a complex Is much greater then that of the sulfide ion, its diffusion current constant is much smaller. Therefore the existenoe of such a complex would account for the anomalous behavior we hare observed. Our oxporienoes thus far led us to ascertain whether the diffusion current is proportional to the concentration of sulfide ion whan the ratio of sulfur to antimony is constant. In many experiments a fair proportionality was observed, but difficulties, later traced to sir oxidation of the sulfide, convinced us that attempts to determine sulfide in the presence of antimony were not profitable, and we ab&ndoned this line of endeavor.
Lead, Mercury, and Antimony Ions
Previously published investigations3 have shown that the wave
(3) JT. J. Lingane, Ind. Eng. Cham., And. Ed., 15, 583 (1943).
of + 3 antimony precedes that of I'- i in 1 N hydrochloric acid, but that in 1 N sodium hydroxide the t .der is reversed. Both -naves are
*' well defined in both media, and are directly proportional to the con- centration over the entire practical polarographlc range. The
<fl simultaneous polarographic determination of these two metals presents no problem. If the lead predominates an acid medium is called for, an^ Tie6 versa. Good waves are also obtained in alkaline tartrate; the lead wave comes first and again both arc well defined. Satis- factory waves are also obtained in 1 N" nitric acid.
Mercury produces a good nave which in all cases starts from zero applied voltage. This wave is well defined, and proportional to the concentration over the range of the method.
Cupric Ion
The cuprous thiocyanate used in this Investigation wee prepared In this laboratory. It was analyzed by the iodometric method and was found to contain 96.4# of the theoretical amount of copper.
It was found that 50 rag. of this material would not dissolve In a convenient volume (SO cc.) of 2 M ammonium acetate or potassium nitrate. It war found that the addition of oxidizing agents Increases the solubility markedly, and 30$ hydrogon peroxide was finally chosen, since any excess could be conveniently boiled off without contamination of the solutions.
COM JBJTIAL
I!

OOOTIDEHTIAL -7-
«
)
Lingane4 has previously reported the behavior of the ouprio-
(4) J. J. Lingane, J. Am. Cham. Soo., 65, 666 (1943).
tartrato complex. In en acid tartrate medium one well-defined step Is obtained, while in basic tartrato a doublet is found. Neutral tartrate also gives a single ware. In ammonia-ammonium chloride a doublet is obtained, but in ammonium acetate - acid tartrate mixtures only a single wave Is observed.
Summary of Pol. ^,graphic Characteristics
The half-wave potentials and the diffusion current constants of the chief metallic constituents of primers were determined in various supporting electrolytes. Using these values concentrations con be found directly from measured diffusion currents and the known values of m and t for the electrode.3 Table T lists the data. All half-wave potential values are referred to the saturated calomel electrode, diffusion currents were measured at "25.0° C, and 0.01% of gelatin was present In all supporting electrolytes as a maximum suppressor.
Table V. Polarofcraphic Constants of Primer Metals
Supporting Electrolyte SL, volts i a/lCni8 /3tl/6
Sb Cu Pb Hg Sb Cu Pb Hg
1 MHC1 -0.15 +0*04 Ä „„ -0.22 -0.43 5.54 3.39 3.86
0.3 11 2n(N03)e + 1 11 HN03
-0.025 -0.40 „ 2.34 3.50 £.6?
1 If NHs + 1 11 NH^Cl -0.S4 -0.50 3.75
0.4 11 sodium tartrate + 0.1 M sodium hydro- gen tartrate
-0.60 -0.09 -0.46 5,40 £.37 2.37
0.9 M sodium tartrate -1.0 -0.12 -0.50 3.90 2. £4 £.30
0.5 U sodium tartrate + 0.1 M NaOH -1.3«
-1. JO . 3.54 — £.39
1 H HC1 + 0.3 11 KC1 + 0.2 U tartarie acid -0.16 4.56 T
1 11 NH4& + 1 11 acetic aoid + 1 M HC1
1 M ammonium acetate + 0.4 11 sodium tartrate + 1 11 sodium hydrogen, tartrate
-0.26 -0.40 .0.45 —-^ 3.20 3.71 3;84
-0.19 -0.50 «.98 8.71
OOMTCDENTIAL
i

OONnOENTtAL
General plan of Analysis
ffe first oought to separate the various components from mixtures preliminary to polarographic analysis. These mixtures were made by
• weiring out know quantities of potassium chlorate, stibnlte, lead « azide, mercury fulminate, and cuprous thiocyanate. Separation of the
stibnlte was effected by extraction with ammonium acetate containing a I smell amount of hydrogen peroxide, which dissolved everything except
the stibnlte.
The residue of stibnlte is dissolved In an alkaline tartrate solution, the solution is then acidified strongly with hydrochloric add, and the hydrogen sulfide evolved is absorbed in an excess of a
' standard iodine solution, which is finally baak-tltrrtea with standard thlosulfate solution. The residual acid solution in the still is diluted to a known volume, end its antimony content is determined polsrographi eally.
As a result of much trial and error the apparatus show In Tig. lwas finally developed for the sulfide determination. The 80-cc. flask (A) hns two side tubes, one for the slow stroim of purified nitrogen T&ich is swept through the system constantly to prevent air oxidation end the other to servo as a reservoir for the concentrated hydrochlario acid used to evolve the hydrogen sulfide from the dissolved stibnlte. Since antimony trichloride is appreciably volatile at temperatures In the neighborhood of 100° C,
* the flask was fitted by a ground joint to the condenser (B). The hydrogen sulfide is collected in a 250-cc. bottle, fitted with a
<t gas-lift type bubbler tube (C), riiich contains the standard iodine solution. As a supplementary absorber the outlet from this bottle is passed into a test-tube (D) which contains a few cubic centimeters
. of dilute potassium hydroxide. Before titrstlon of the excess iodine the contents of (D) are added to (C). Table VI gives the results far the determination of sulfur in several stibnlte samples-
Table VI Determination of Sulfur in Stibnlte
Stibnlte mg.
18.2 £8.4 £1.2
Sulfide recovery
98.0 94.1 96.0
That the average recovery of sulfur In stibnlte is several per cent low is not surprising. Experiments have shovm, that the samples we used contained about 2$ of material insoluble in the alkaline tartrate solution (probably siliceous material), a small amount of lead (probably as galena), and a smell amount of iron. If this last is
CONFIDENTIAL

GOMFWÄN"^
32.A n.
^=o *=J^< "V
^S
^> J>
CD
CONFIDENTIAL

CONFIDENTIAL -9-
present in the ferric state it will cause low results for sulfur when tne sample is acidified due to the reaction,
2Fe+++ ♦ HgS - 2Fe+* + S + 2H+, (3)
Small deposits of free sulfur were noted on the inner tube of the condenser from this reaction*
The simultaneous determination of mercury, copper, and lead ires first attempted by direct polarography of the ammonium acetate extract from v&ioh the stibnite had been separated. Results were discouragingly low, and addition of sodium tartrate plus sodium hydrogen tartrate did not improve them. Experiments with tho metals individually pointed to mercuric fulminate as the source of difficulty, apparently through some oxidation produot of the fulminate ion. Attempts to recover the metals by a sulfide precipitation and subsequent solution with nitric acid were also unsatisfactory. It was finally decided to attempt to recover the free metals from the extract by plating them out on a mett-1 more base than any ordinarily encountered in Ordnance material. Zinc was chosen since its wave occurs at a potential considerably more negative than those of the other metals. The plated zinc can be dis- solved in nitric acid, and, after i .luting to a knovn volume the mer- cury, lead, end copper in this solu ,ion cm be determined simultaneously from a single polarogrom. That this procedure is satisfactory is indicated by the results show in Table VII.
Table VII. Recovery of Known Metal Samples by Zinc Plating Method
Metal taken, mg.
Hg 14.1 Cu 0.34 Pb 11.6 Hg 20.2 Cu 0.49 Pb 16.6
.Hg 40.2 Cu 0.98 Pb 33.1 Hg 12.6 Cu 6.1 Pb 1.04 Hg 25.2 Cu 12.2 Pb 2.07 Hg 2.52 Cu 4.90 Pb 10.35 Hg 1.00 Cu 1.97 Pb 4.14
Metul found, mg.
Hg 14.1 Cu 0.34 Pb 11.6 Hg 20.00 Cu 0.49 Pb 16.6 Hg 39.8 Cu 0.98 Pb 33.1 Hg 12.2 Cu 6.1 Pb 1.04 Hg 25.2 Cu 12.2 Pb 2.07 Hg 2.42 Cu 4.90 Pb 10.35 Hg 0.97 Cu 1.98 PI. 4.14
Recovery, %
100.0 100.0 100.0 99.0
100.0 100.0 99.0
100.0 100.0 96.7
100.0 100.0 100.0 100.0 100.0 96.2
100.0 100.0 97.0
100.8 . 100.0
CONFIDENTIAL
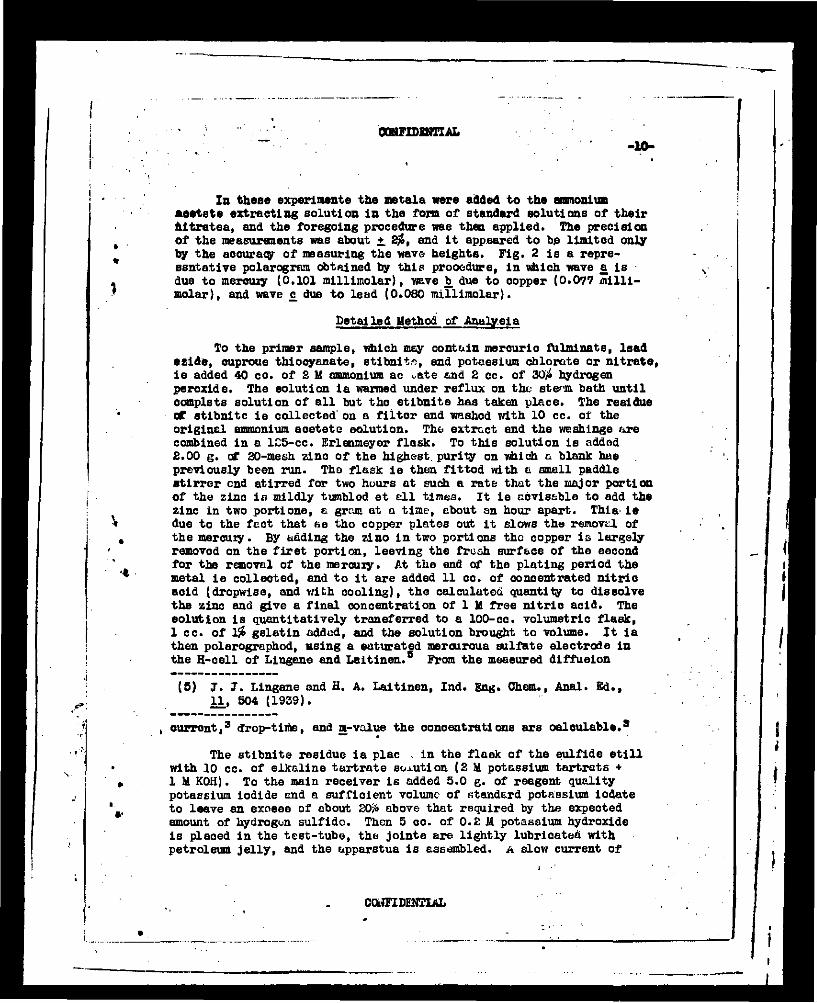
CONFIDENTIAL -10-
In these experiments the metals «ere added to the ammonium aoetate extracting solution in the form of standard solutions of their nitrates, and the foregoing procedure was then applied. The precision of the measurements was about + 2#, and it appeared to be limited only by the aa curacy of measuring the wave heights. Fig. 2 is a repre- sentative polarogram obtained by this procedure, in which wave a is due to mercury (0.101 millimolar), wave b due to copper (0.077 milll- molar), and wave c_ due to lead (0.080 millimolar).
Detailed Method of Analysis
To the primer sample, which may contain mercuric fulminate, lead azide, cuprous thiocyanate, stibnits, and potassium chlorate or nitrate, is added 40 cc. of 2 M ammonium ac ^ete and £ cc. of 30# hydrogen peroxide. The solution is warmed under reflux on the stem bath until complete solution of all but the stibnite has taken place. The residue of stibnite is collected on a filter and washed with 10 cc. of the original ammonium acetate solution. The extract end the washings are combined in a l£5-cc. Erlenmeyor flask. To this solution is added 2.00 g. of 20-mesh zinc of the highest, purity on which a blank has previously been run. The flask is then fitted with a small paddle stirrer and stirred for two hours at such a rate that the major portion of the zinc in mildly tumbled at all times. It ie advisable to add the zinc in two portions, a gram at a time, about an hour apart. This-is due to the fact that as tho copper plates out it slows the renovtO. of the mercury. By adding the zinc in two portions the copper is largely removed on the first portion, leaving the fresh surface of the second for the removal of the mercury. At the end of the plating period the metal is collected, and to it are added 11 cc. of concentrated nitric acid (dropwise, and with cooling), the calculated quantity to dissolve the zinc and give a final concentration of 1 11 free nitric acid. The solution is quantitatively transferred to a 100-cc. volumetric flask, 1 cc. of I/O gelatin added, and the solution brought to volume. It is than polarographod, nsing a saturated mercurous sulfate electrode in the H-cell of Lingane and Lai tinea.5 From the measured diffusion
(5) J. J. Lingane and H. A. Laitinen, Ind. Eng. Chem., Anal, fid., U, 504 (1939).
current,3 drop-time, and m-value the concentrations are calculable.*
The stibnite residue is plac in the flask of the aulfide still with 10 cc. of alkaline tartrate solution (£ M potassium tartrat6 + 1 U KOH). To the main receiver is added 5.0 g. of reagent quality potassium iodide end a sufficient volume of standard potassium iodate to leave an exoess of about Z0> above that required by the expected amount of hydrogen sulfidc. Then 5 oo. of 0.2 M potassium hydroxide is placed in the test-tube, the joints are lightly lubricated with petroleum jelly, and the apparatus is assembled, A slow current of
CONFIDENTIAL

ooHfxmzjiif -li-
altrogen Is bubbled through the ay. ten for ten Minutes to sweep out the air, and then a small flame from a micro burner is applied to the still flask. The solution is brought to the boiling point and held there until solution of the stibnite has taken place, usually about thirty minutes. After boiling for fifteen minutes of this time, the receiving bottle is slipped below the bubbler tube, 15 cc. of 1 M hydrochloric acid is added, -and the bottle quickly replaced. Ten cc. of concentrated hydrochloric acid is then added to the still reservoir, a quantity sufficient to make the contents of the still 4-5 M in free acid, end to make the solution, upon dilution to 100 cc, 1 M in free add.
When solution is complete the flame is removed, the flask allowed to oool slightly, and the nitrogen stream adjusted so that bubbles Btill issue slowly and regularly from tho absorption system. The concentrated acid is added to the still flask through the stopcock, the flame again applied, the nitrogen stream readjusted, and the distillation allowed to proceed for one hour. At the end of the distillation the bubbler is dipped from the rubber connection, the contents of the test-tube added to the main receiver, and the bubbler and test-tube are washed into the main receiver. The «hole solution Is immediately titrated with standard sodium thiosulfate, using ettreh as an indicator in the usual manner.
The solution in the still flask is transferred, with the washings from the inner-tub.? of the condenser, to a 100-cc. volumetric flask, 1 cc. of I/» gelatin solution is added, and tho solution is brought to volume. The antimony wave is then -ecorded in the same manner as the other metals, and the same teehniqv . applied to determine the con- centration.
Discussion of Results
Table VIII contains data on the complete analysis according to the methods herein outlined. It can be seen that the recovery of mercury is the poorest of any of the metals Involved. The presence of thlocyanate ion or its oxidation products does not seem to affect the recovery of lead, which is approximately the same in the oases where thlocyanate ion is or is not present.
The sulfide determination is subject to errors already pointed out, the possible oxidation by ferric iron, and incomplete absorption by the iodine (we found it practically impossible to obtain complete absorption of the gas in any medium used}. Therefore the antimony would be a more: reliable guide to the stibnite content.
/
■ >*«•» tüMnümwmumßi* CaOTBENTIAL

CONFIDENTIAL -IE-
Table VIII Analysis of Synthetic Primer Mixtures
Sain- Wt. sample, mg. pie No. Hg(OCN)E CuCNS PbOHN3 Sb2S3 Hg
£ Recovery
Cu Pb Sb
1 33.6 18.8 27.0 16.0 46.2 97 4 95.0 96.2 90.4 2 25.9 5 9 29.0 17.5 53.3 78.2 93.5 100.0 95.5 3 26.5 11 6 37.8 18.0 96.3 93 5 94.8 98.7 98.5 4 26.0 9 7 37.0 18.0 98.2 96 7 93.0 96.2 97.8 5 29.0 5 9 16.9 17.4 100.0 96 6 99.1 86.2 84.5 6 13.9 6. 8 13.2 7.5 99.0 106 0 90.0 92.5 56.2
7 50.8 50.5 50.3 95.0 98.1 99.0 87.4 6 102.3 100.3 100.2 99.4 97.6 94.4 86.6 9 24.3 28.7 28.4 91.8 95.3 96.8 94.0
10 24.3 24.1 21.2 95.0 92.9 96.7 93.9 11 15.8 15.1 18.": 69.4 76.6 98.0 92.0 12 16.8 16.7 17. 98.4 98.0 97.5 92.0
(potassium chloreto was present in all samples In the same order of weight as the other components)
'. We have determined that the plating process is completely
efficient, so that the observed errors cannot be due to this stop. A possible source of error is incomplete extraction of the components by the ammonium acetate. If this is tho case, part of the "soluble" material will remain with the stibnite residue, and can then be found with the antimony. When this happens the final concentration of metal can be regarded as the sum of the concentrations obtained from the plated zinc and that found with the antimony residue.
We feel that in addition to furnishing a roughly quantitative voltemmetric analysis for the azide ion, we have developed & quantitative polarographic method for the analysis of simple primer mixtures, «mich can be extended to include other components, and v&ich can doubtless be improved by further experimentation.
Acknowledgment: The experiments involving azide ion were dene largely with the aid of Mr. Leo Kovar, and
the remainder of the work was done with the assistance of Mr. Robert Dryer, both Che- >.oal Research Assistants on
this 'oject.
CONFIDENTIAL
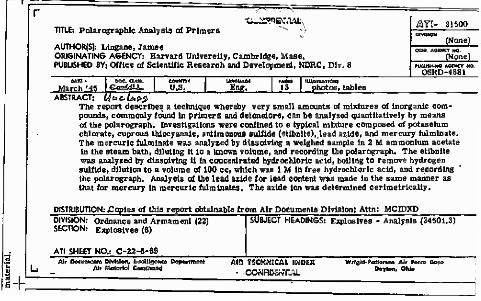
TTTLE: Polaroyraphlc Analysis of Primers "^ ••
AUTHORfSl: Llngaoe, James ORIGINATING AGENCY: Harvard University, Cambridge, Mass. PUBLISHED BY: Office of Scientific Research and Development, NDRC, Div.
AYQ- 31500
JNa coo. *0O«CT «to. (None)
U.S. LAMOUJUM
Eng. iLUnnATiOHi
photos, tables „March'45 €«g&aj». ABSTRACT: ts}tac.li*f>2
The report describes a technique whereby very small amounts of mixtures of inorganic com- pounds, commonly found In primers and detonators, can be analysed quantitatively by means of the polarograph. Investigations were confined to a typical mixture composed of potassium chlorate, cuprous thlocyanate, antimönous Sulfide (stibölte), lead ai.ide, and mercury fulminate. The mercuric fulminate was analyzed by dissolving a weighed sample in 2 M ammonium acetate In the steam bath, diluting It to a known volume, and recording the polarograph. The stibnite was analyzed by dissolving It In concentrated hydrochloric acid, boiling to remove hydrogen sulfide, dilution to a volume of 100 cc, which was 1 M in free hydrochloric acid, and recording the polarograph. Analysis of the lead azide for lead content was made in the same manner as that for mercury in mercuric fulminates. The azide ion was determined cerlmetricaliy.
jMSTRJBUTlON: Ccplea afthifl report obtainable from Air Documents Division; Attn: MCIDXTJ DIVISION: Ordnance and Armament (22) SECTION: Explosives (9)
ATI SHEET NO.: C-22-6-68
SUBJECT HEADINGS: Explosives - Analysis (34501.3)
AID f5CMMICflL INDES
• CONHD&rfl-U Wright-folMnon AJ» Foiro Do.o
Daylm, Ohio