to analyze the shifting people towards super markets
TRANSCRIPT
0 | P a g e
TO ANALYZE SHIFTING PREFERENCES OF CONSUMERS
TOWARDS ORGANIZED RETAILING OVER UNORGANIZED
RETAILING
Submitted to
Mem-Saba Zehra
Submitted by
Syed Tufail Haider (1204177)
Abdul Latif (1204101)
Muhammad Waseem (1204136)
Muhammad Waheed (1204132)
Abdul Haq Campus Karachi, Pakistan
November 11, 2014

1 | P a g e
ACKNOWLEDGEMENT
On behalf of my whole group,
I start with the name of Almighty ALLAH for giving me strength, potential and
strong points to complete this entire significance research in a relevant manner.
I would like to think the people who have made this work possible. My prime
appreciation goes to my supervisor Mem-Saba Zehra, the encouragement,
motivation and support she provided with her knowledge on the subject. She had
constantly challenged us to think about the research in new ways, and had
consistently supported us in our research endeavors. Through her guidance, we
have gained invaluable experience. We could not have had better advisor then
her.
Moreover, We would especially thankful to all the respondents, who co-operated
with us and in filling out the questionnaire.
Finally, we would like to thank our parents. They have always encouraged us
through all our endeavors. Their support and advices has given us the motivation
to achieve our goals.

2 | P a g e
TABLE OF CONTENTS
S.NO. DESCRIPTION PAGE NO.
1 ACKNOWLEDGEMENTS…………………………………….. 1
2 TABLE OF CONTENT..……………………………………….. 2
3 EXECUTIVE SUMMARY..………………………………....... 3
4 ABSTRACT …………………………………………………… 4
5 INTRODUCTION…………………………................................. 5
6 LITERATURE REVIEW………………………………............ 6-7
7 RESEARCH METHODOLOGY…………………………….. 8-9
Research Question
Research Objective
Hypothesis
Future Implications of the Study
8 DATA ANALYSIS………………………………………....... 10-29
9 INTERVIEW QUESTIONS………………………………….
03-31
10
INTERPRETATIONS OF RESULTS 32-33
11 CONCLUSION …………………………………………….. 34
12 SUGGESTIONS & RECOMMENDATIONS……………….
35
13 LIMITATION…………………………………………………. 36
14 REFERENCES………………………………………………… 37
15 BIBLIOGRAPHY ……………………………………………..
38-41

3 | P a g e
EEXXEECCUUTTIIVVEE SSUUMMMMAARRYY The retail sector is expanding and modernizing rapidly in line with Pakistan’s
economic growth. Retailing is defined as “all the activities involved in selling
goods or services directly to final consumers for personal, non business use”.
Retailing consists of the sale of goods or merchandise. It is divided into two
sectors organized retailing (which also known as modern trade retailing) and
unorganized retailing (also known as traditional retailing).
Organized retailing is a new concept in Pakistan. Since last few years a rapid
growth has been observed in Pakistan’s retailing. Organized Retail Stores are the
market leader in the field of Retailing.
This study analyzes the factors which influence the consumers to move towards
organized retailing from unorganized retailing. The study also helps
the retailers by revealing the facts regarding the most prioritized attributes of the
retail stores which attract the consumers towards them. This survey also revealed
the future of organized and unorganized retailing in Pakistan and the impact of
organized retail outlets on unorganized retail outlets.
After the analysis it was observed that customers are very much anxious towards
organized retailing and they expect variety along with quality as a primary
attribute from retailers.
The study also revealed that lower income group are still not attracting towards
organized retailing due to inconvenient location, higher prices, unavailability of
small quantity, unavailability of credit facility.
However the study concluded that both the concept organized and unorganized
retailing will grow in future and will not replace each other and there will be no
such impact of departmental stores on general stores.
4 | P a g e
AABBSSTTRRAACCTT
The retail industry in Pakistan is emerging as one of the largest industry. In last
few years we have observed that modern and organized retailing concept is
booming in Pakistan.
This research was undertaken to analyze shifting preferences of consumer
towards organized retailing from unorganized. We also analyze factors which
influence them to select the retailing format. For purpose we took responses
through random sampling from 300 respondent using questionnaires in Karachi.
We tried to get an adequate ratio of middle age men and women as they
influence the most in selecting the retailing format. We also conducted interview
from owners of organized and unorganized retail outlets in order to find out the
impact of these departmental /general stores on their sales volume. These
interviews were recorded as well.

5 | P a g e
IINNTTRROODDUUCCTTIIOONN Retailing is the final step in the distribution of merchandise i.e. the last link in the
supply chain. It connects the bulk producers of commodities to the final
consumer. Retailing covers diverse products such as food, apparels, consumer
goods etc.
The retail industry in Pakistan is emerging as one of the largest industries. Retail
industry is divided into unorganized and organized sectors. In Pakistan,
unorganized retailing has been predominantly in the form of local general stores
also called Kiryana shops which sell multiple brand grocery items of daily use.
Such outlets are generally owned by a single individual and managed by him
alone or with some help of one or two workers. Most of the general stores rely on
counter sales only. On the other hand organized retailing refers to licensed
retailers who are registered for sales tax, income tax etc. like, Hyperstar, Metro,
Chase-up and so on. The retail sector is expanding and modernizing rapidly.
Organized retailing is booming and creating huge opportunity for enterprises in
Pakistan. Ever increasing number of hypermarkets, departmental stores and
shopping malls are inviting potential investors to invest in Pakistan. After looking
at the dynamics of retailing in Pakistan, one confronts an obvious question that
how retailing in Pakistan is going to be shaped in coming years. This necessitates
study of the factors which influence the consumers to move towards the
organized retailing from unorganized retailing and impact of these departmental
stores on the sales volume of general stores.
This research project is undertaken with a view to analyze shifting preferences of
consumers towards organized retailing over unorganized retailing and vice-versa
and also role of income level of consumers in the selection of retail formats.
6 | P a g e
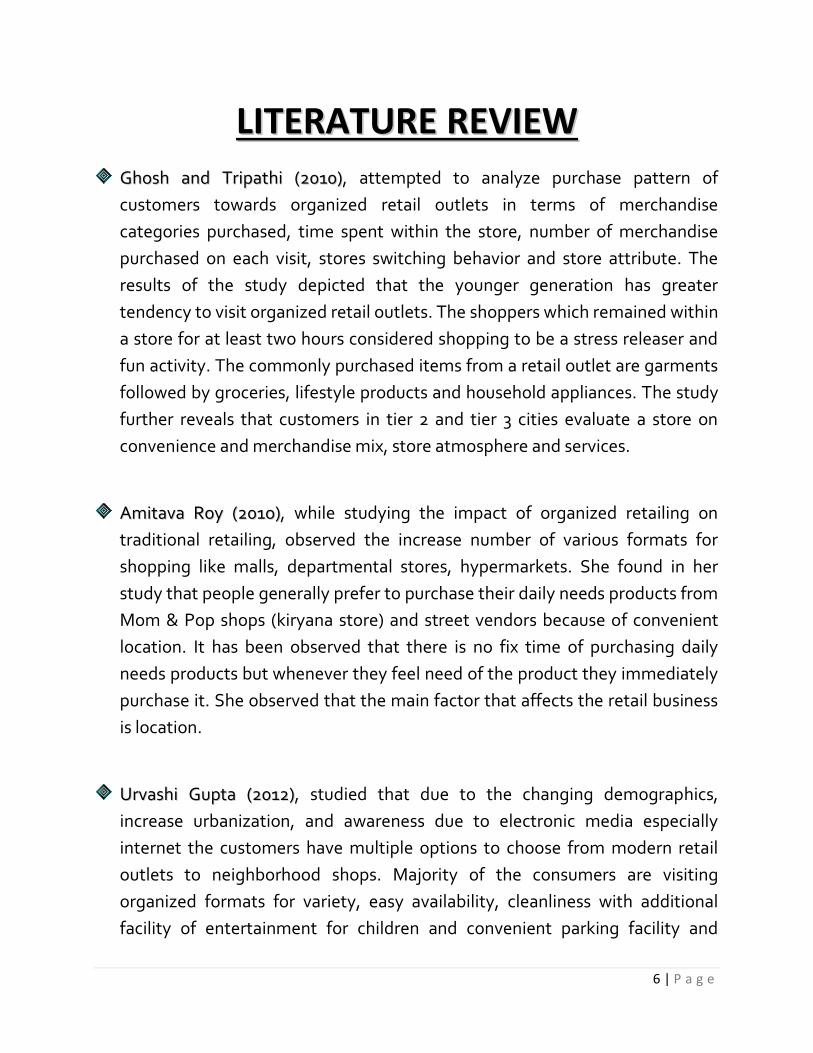
LLIITTEERRAATTUURREE RREEVVIIEEWW
GGhhoosshh aanndd TTrriippaatthhii ((22001100)), attempted to analyze purchase pattern of
customers towards organized retail outlets in terms of merchandise
categories purchased, time spent within the store, number of merchandise
purchased on each visit, stores switching behavior and store attribute. The
results of the study depicted that the younger generation has greater
tendency to visit organized retail outlets. The shoppers which remained within
a store for at least two hours considered shopping to be a stress releaser and
fun activity. The commonly purchased items from a retail outlet are garments
followed by groceries, lifestyle products and household appliances. The study
further reveals that customers in tier 2 and tier 3 cities evaluate a store on
convenience and merchandise mix, store atmosphere and services.
AAmmiittaavvaa RRooyy ((220011oo)), while studying the impact of organized retailing on
traditional retailing, observed the increase number of various formats for
shopping like malls, departmental stores, hypermarkets. She found in her
study that people generally prefer to purchase their daily needs products from
Mom & Pop shops (kiryana store) and street vendors because of convenient
location. It has been observed that there is no fix time of purchasing daily
needs products but whenever they feel need of the product they immediately
purchase it. She observed that the main factor that affects the retail business
is location.
UUrrvvaasshhii GGuuppttaa ((22001122)), studied that due to the changing demographics,
increase urbanization, and awareness due to electronic media especially
internet the customers have multiple options to choose from modern retail
outlets to neighborhood shops. Majority of the consumers are visiting
organized formats for variety, easy availability, cleanliness with additional
facility of entertainment for children and convenient parking facility and

7 | P a g e
restaurant etc. In case of unorganized outlets immediacy of the store, credit
and bargaining facility balance the tilt. Unlike higher age groups who prefer to
visit Kiryana stores, the younger generation has more inclination towards
organized retail. Families with annual income less than 4.0 Lakh and having a
single bread earner prefer shopping with nearby mom-n-pop stores. The
organized formats have entered into the tier-II cities and other small cities and
focusing on the middle class people as it had almost covered the metropolitan
cities. Both organized as well as unorganized retailers need to add value
added services to make the shopping experience more comfortable and value
oriented.

8 | P a g e
MMEETTHHOODDOOLLGGYY This research is based on primary data as well as secondary data. The primary
data was collected from consumers and owners through questionnaire and
structured interviews across different departmental stores namely FFaarriidd, IImmttiiaazz,
cchhaasseeuupp & NNaahheeeedd ssuuppeerrssttoorree and unorganized retail outlets (KKiirryyaannaa shops) in
Karachi. The stores and shops were chosen from different parts of city to enable
a wider spread of samples. Most of the respondents were approached outside the
billing counter of departmental stores after they had finished shopping, before
leaving stores and at the counter of kkiirryyaannaa shops and rest of the respondents
were approached at their houses. The respondents were given multiple choice
questionnaire to respond their views about changing shopping preferences.
Interviews were conducted from owners of organized and unorganized retail
outlets (these interviews were recorded as well). The secondary data was drawn
from various articles, journals and internet.
The aim was to collect 320 samples for the analysis (300 consumers of both
organized and unorganized retail outlets, 15 owners of general stores and 5
owners of departmental stores). Respondents were selected randomly
throughout the city. We tried to get an adequate ration of men and women. The
main demographics target was the middle age men and women as in Pakistan
they influence the most in selecting the retail format for shopping. Buyers who
have been visiting Department Stores were better able to answer the questions
regarding the influencing factors and the reasons for their consumption and
purchase. After the collection of data, analysis was carried out using statistical
tool.
Primary Data Source Tool
Consumers of Departmental stores Questionnaire
Consumers of General stores Questionnaire
Owners of Departmental stores Interview
Owners of General stores Interview

9 | P a g e
RREESSEEAARRCCHH QQUUEESSTTIIOONN
What are the impacts of shifting consumer preferences towards organized
retailing from unorganized retailing?
RREESSEEAARRCCHH OOBBJJEECCTTIIVVEE
To analyze shifting preferences of consumers towards organized retailing over
unorganized retailing.
HHYYPPOOTTHHEESSIISS
DDeeppeennddeenntt VVaarr iiaabbllee::
Sales volume of Departmental and General Stores.
IInnddeeppeennddeenntt VVaarr iiaabblleess ::
Consumer preferences.
Income of consumers.
FFUUTTUURREE IIMMPPLLIICCAATTIIOONNSS OOFF TTHHEE SSTTUUDDYY
This study gives an insight into the changing customer preferences from unorganized retailers to organized retailers in Karachi. It also enables us to understand the factors responsible for making a purchase from either of the retail formats. It will further help the retailers to make an analysis of factors which have an impact on the customers to make a purchase from organized/unorganized retail outlets. By understanding this picture, retailers can focus and devise their strategies to increase their profits and trade.

10 | P a g e
DDAATTAA AANNAALLYYSSIISS
Q1: Have you ever visited departmental stores? In question 1 we have asked that whether the respondent have visited the store
ever. As per analysis it was revealed that 280 respondents out of 300 have visited
the departmental stores and 20 respondents have not visited any departmental
stores ever. The results are summarized in the table below.
There are significant amount of people who visit the departmental store to
purchase general products. Here we have observed that children’s demand has
the least influence to visit departmental stores because only 17 respondents visit
departmental store due to children’s demand.
Frequency Percent Valid Percent
Valid Yes 280 92.1 93.3
No 20 6.6 6.7
Total 300 98.7 100.0
Q2: What is your main purpose to visit departmental store?
Frequency Percent Valid Percent
Valid Leisure Time Activity 32 10.5 11.5
Purchase of Special Products 58 19.1 20.8
Children’s Demand 17 5.6 6.1
Purchase of General Products 172 56.6 61.6
Total 279 91.8 100.0
Missing System 21 8.2
Total 300 100.0
11 | P a g e
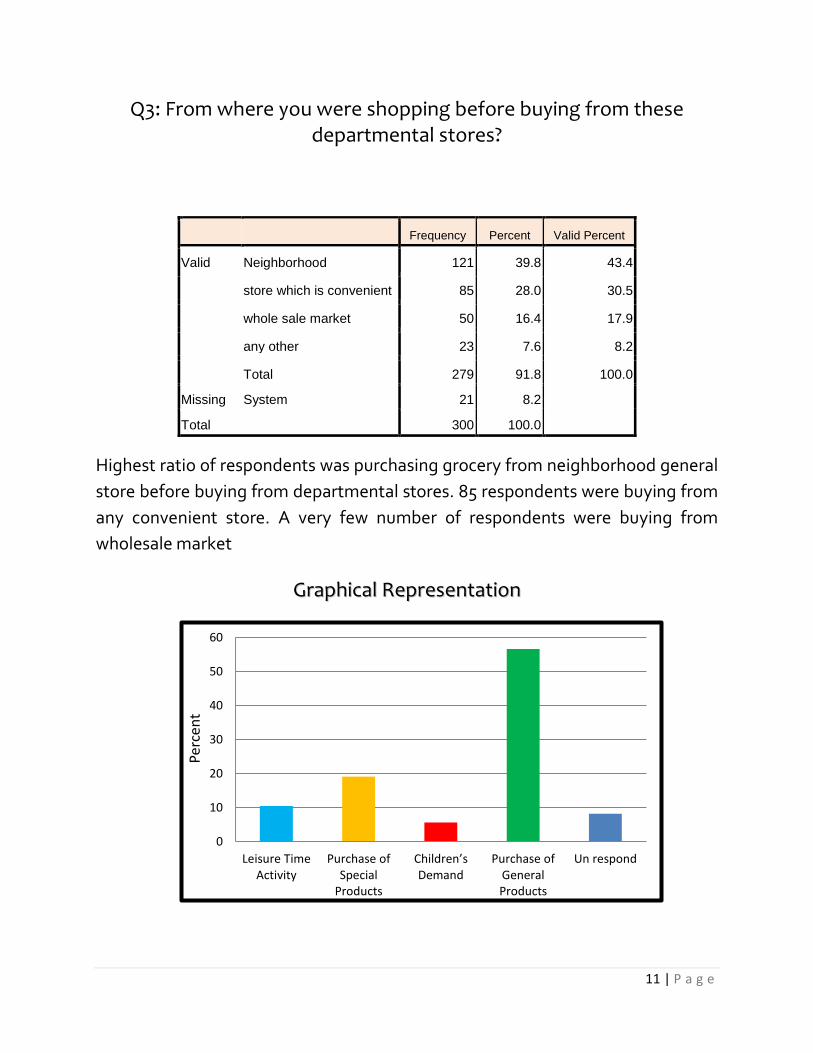
Q3: From where you were shopping before buying from these departmental stores?
Highest ratio of respondents was purchasing grocery from neighborhood general
store before buying from departmental stores. 85 respondents were buying from
any convenient store. A very few number of respondents were buying from
wholesale market
GGrraapphhiiccaall RReepprreesseennttaattiioonn
Frequency Percent Valid Percent
Valid Neighborhood 121 39.8 43.4
store which is convenient 85 28.0 30.5
whole sale market 50 16.4 17.9
any other 23 7.6 8.2
Total 279 91.8 100.0
Missing System 21 8.2
Total 300 100.0
0
10
20
30
40
50
60
Leisure TimeActivity
Purchase ofSpecial
Products
Children’s Demand
Purchase ofGeneralProducts
Un respond
Perc
ent
12 | P a g e
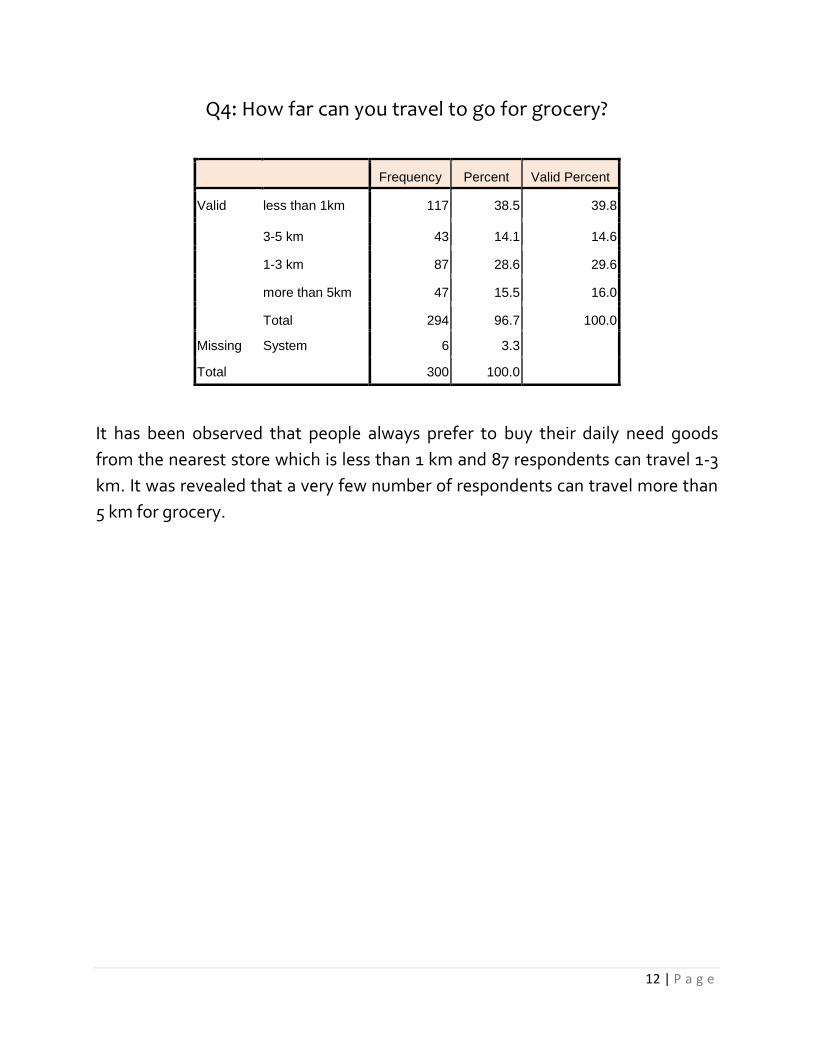
Q4: How far can you travel to go for grocery?
It has been observed that people always prefer to buy their daily need goods
from the nearest store which is less than 1 km and 87 respondents can travel 1-3
km. It was revealed that a very few number of respondents can travel more than
5 km for grocery.
Frequency Percent Valid Percent
Valid less than 1km 117 38.5 39.8
3-5 km 43 14.1 14.6
1-3 km 87 28.6 29.6
more than 5km 47 15.5 16.0
Total 294 96.7 100.0
Missing System 6 3.3
Total 300 100.0

13 | P a g e
Q5 (a): How frequently do you purchase Fruits and Vegetables?
Frequency Percent Valid Percent
Valid Daily 126 41.9 42.7
weekly 153 50.8 51.9
fortnightly 6 2.0 2.0
monthly 8 2.7 2.7
more than a month 2 .7 .7
Total 295 98.0 100.0
Missing System 5 2.0
Total 300 100.0
It has been observed that mostly people prefer to buy fruits and vegetables
weekly and daily as they are perishable goods and they are too difficult to store
without refrigerator and most of the surveyed people come under monthly
income slab of 5,000-20,000.
Q5 (b): How frequently do you purchase Grocery?
Frequency Percent Valid Percent
Valid daily 29 9.6 9.7
weekly 87 28.9 29.1
fortnightly 29 9.6 9.7
monthly 142 47.2 47.5
more than a month 12 4.0 4.0
Total 299 99.3 100.0
Missing System 1 0.7
Total 300 100.0
Mostly people purchase grocery for whole month because they are not
perishable goods as fruits and vegetables so people prefer to purchase grocery
monthly.
14 | P a g e
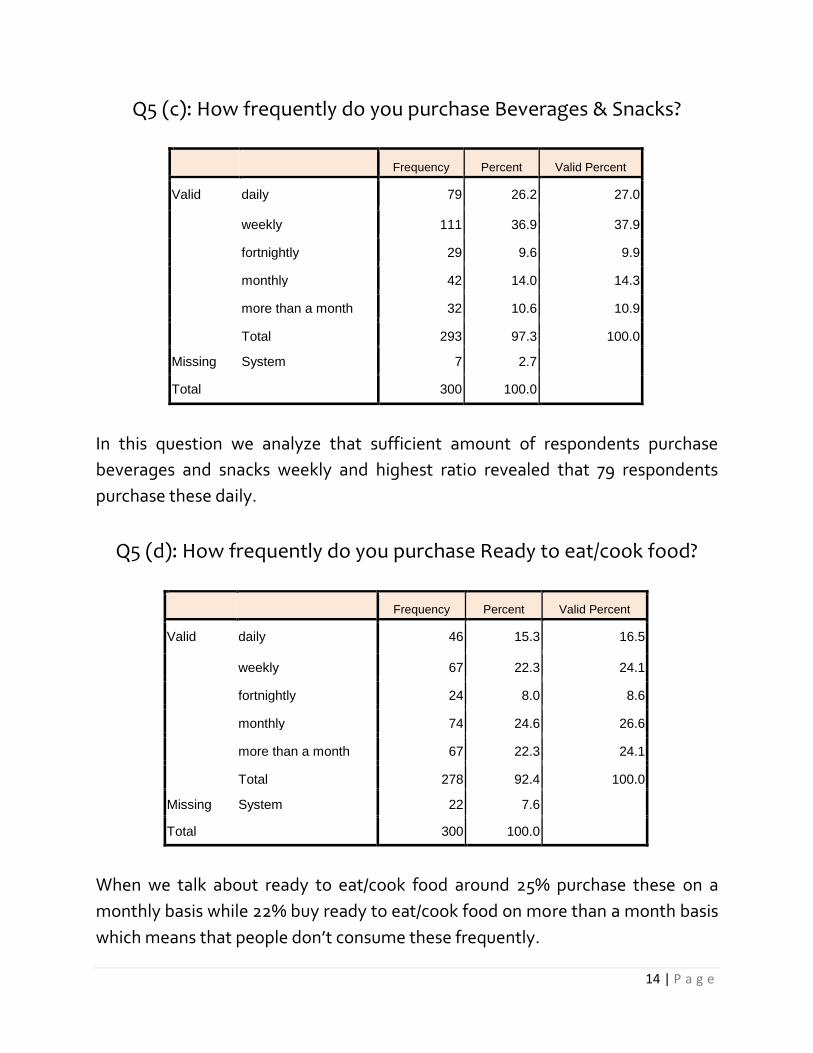
Q5 (c): How frequently do you purchase Beverages & Snacks?
Frequency Percent Valid Percent
Valid daily 79 26.2 27.0
weekly 111 36.9 37.9
fortnightly 29 9.6 9.9
monthly 42 14.0 14.3
more than a month 32 10.6 10.9
Total 293 97.3 100.0
Missing System 7 2.7
Total 300 100.0
In this question we analyze that sufficient amount of respondents purchase
beverages and snacks weekly and highest ratio revealed that 79 respondents
purchase these daily.
Q5 (d): How frequently do you purchase Ready to eat/cook food?
Frequency Percent Valid Percent
Valid daily 46 15.3 16.5
weekly 67 22.3 24.1
fortnightly 24 8.0 8.6
monthly 74 24.6 26.6
more than a month 67 22.3 24.1
Total 278 92.4 100.0
Missing System 22 7.6
Total 300 100.0
When we talk about ready to eat/cook food around 25% purchase these on a
monthly basis while 22% buy ready to eat/cook food on more than a month basis
which means that people don’t consume these frequently.

15 | P a g e
Q6 (a): From where you mostly purchase Fruits and Vegetables?
A large number of respondents purchase fruits and vegetables from un organized
retail outlets which means that although the respondent are purchasing grocery
or other goods from organized retail outlets but still mostly do not purchase
fruits and vegetables from organize retail outlets.
It has been observed that around 59% respondents purchase grocery from
organized retail outlets which shows that mostly people prefer organized retail
outlets for grocery.
Frequency Percent Valid Percent
Valid organized 56 18.6 18.7
Unorganized 243 80.7 81.0
4 1 .3 .3
Total 300 99.7 100.0
Missing System 0 0
Total 300 100.0
Q6 (b): From where you mostly purchase Grocery?
Frequency Percent Valid Percent
Valid organized 176 58.5 58.9
Unorganized 122 40.5 40.8
4 1 .3 .3
Total 299 99.3 100.0
Missing System 1 .7
Total 300 100.0

16 | P a g e
When we talk about beverages and snacks it has been observed that sufficient
amount of respondents prefer to purchase these from organized retail outlets.
Q6 (d): From where you mostly purchase Ready to eat/cook food?
Again a huge number of respondents prefer to buy ready to eat/cook food from
organized retail outlets rather than from unorganized retail outlets.
Frequency Percent Valid Percent
Valid organized 177 58.8 60.0
Unorganized 118 39.2 40.0
Total 295 98.0 100.0
Missing System 5 2.0
Total 300 100.0
Q6 (c): From where you mostly purchase Beverages & Snacks?
Frequency Percent Valid Percent
Valid organized 211 70.1 75.4
Unorganized 68 22.6 24.3
4 1 .3 .4
Total 280 93.0 100.0
Missing System 20 7.0
Total 300 100.0
17 | P a g e
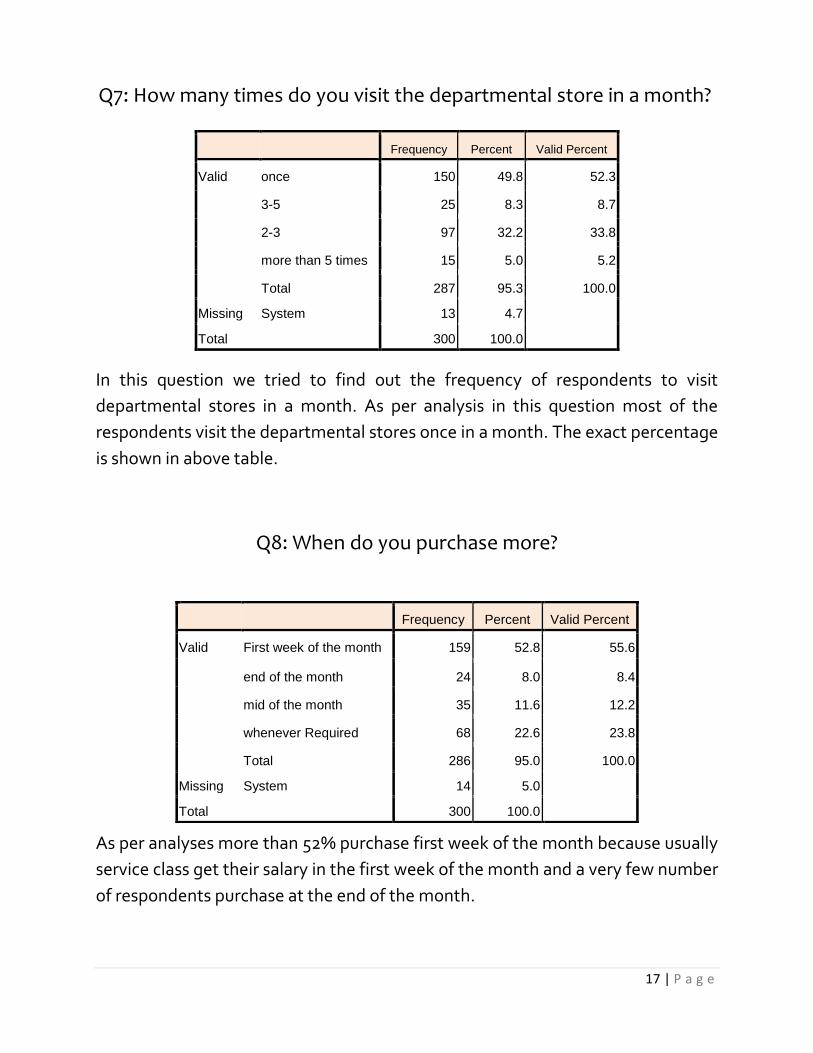
In this question we tried to find out the frequency of respondents to visit
departmental stores in a month. As per analysis in this question most of the
respondents visit the departmental stores once in a month. The exact percentage
is shown in above table.
Q8: When do you purchase more?
As per analyses more than 52% purchase first week of the month because usually
service class get their salary in the first week of the month and a very few number
of respondents purchase at the end of the month.
Q7: How many times do you visit the departmental store in a month?
Frequency Percent Valid Percent
Valid once 150 49.8 52.3
3-5 25 8.3 8.7
2-3 97 32.2 33.8
more than 5 times 15 5.0 5.2
Total 287 95.3 100.0
Missing System 13 4.7
Total 300 100.0
Frequency Percent Valid Percent
Valid First week of the month 159 52.8 55.6
end of the month 24 8.0 8.4
mid of the month 35 11.6 12.2
whenever Required 68 22.6 23.8
Total 286 95.0 100.0
Missing System 14 5.0
Total 300 100.0

18 | P a g e
Increased Remain Same Decreased Un Respond
Percent 51.5 31.9 11.6 5
0
10
20
30
40
50
60
Q9: Do you think by shopping at departmental stores, your monthly expenditure:
In this question the respondents were asked about their monthly expenditures.
As per analyses 51.5% respondents replied that by shopping at departmental
stores their expenditures increased, 32% replied that their expenditures remain
same and only 12% replied that their expenditures decreased.
GGrraapphhiiccaall RReepprreesseennttaattiioonn
Frequency Percent Valid Percent
Valid Increased 155 51.5 54.2
Remain Same 96 31.9 33.6
Decreased 35 11.6 12.2
Total 286 95.0 100.0
Missing System 14 5.0
Total 300 100.0
19 | P a g e
definitelyyes
can't saydefinitely
notprobably
yesprobably
notUn
Respond
Percent 48.2 14.3 2.3 31.2 1.3 2.7
0
10
20
30
40
50
60
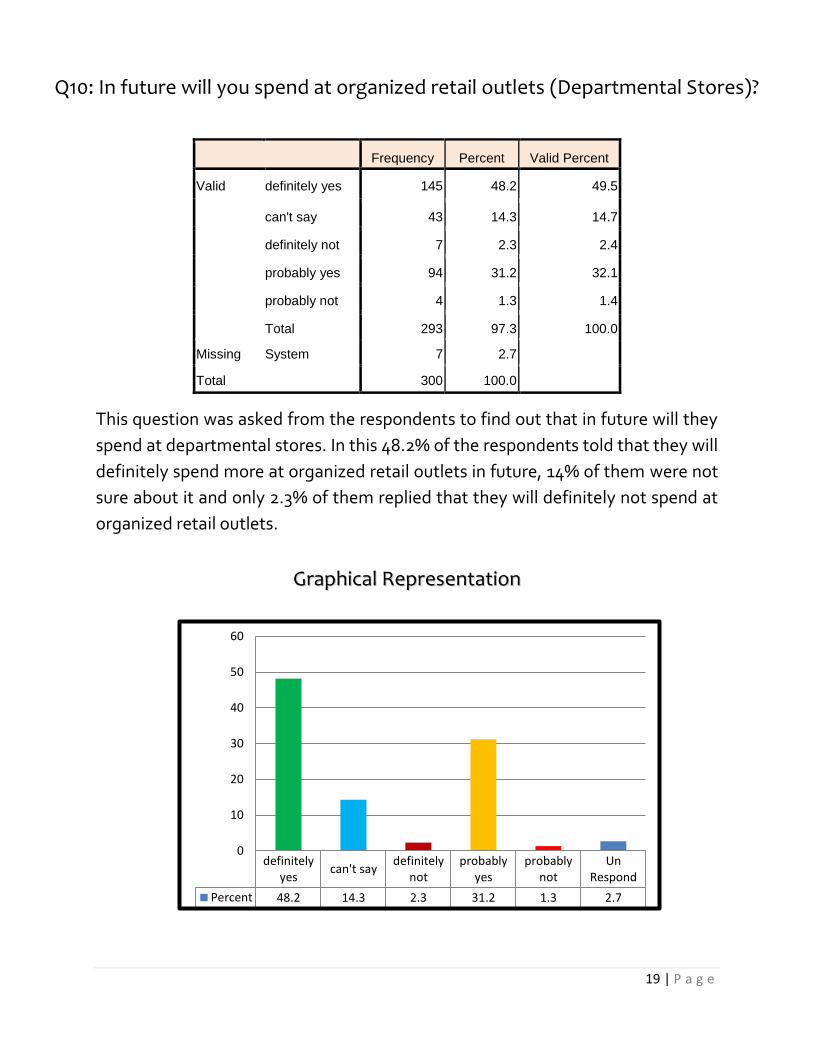
This question was asked from the respondents to find out that in future will they
spend at departmental stores. In this 48.2% of the respondents told that they will
definitely spend more at organized retail outlets in future, 14% of them were not
sure about it and only 2.3% of them replied that they will definitely not spend at
organized retail outlets.
GGrraapphhiiccaall RReepprreesseennttaattiioonn
Q10: In future will you spend at organized retail outlets (Departmental Stores)?
Frequency Percent Valid Percent
Valid definitely yes 145 48.2 49.5
can't say 43 14.3 14.7
definitely not 7 2.3 2.4
probably yes 94 31.2 32.1
probably not 4 1.3 1.4
Total 293 97.3 100.0
Missing System 7 2.7
Total 300 100.0
20 | P a g e
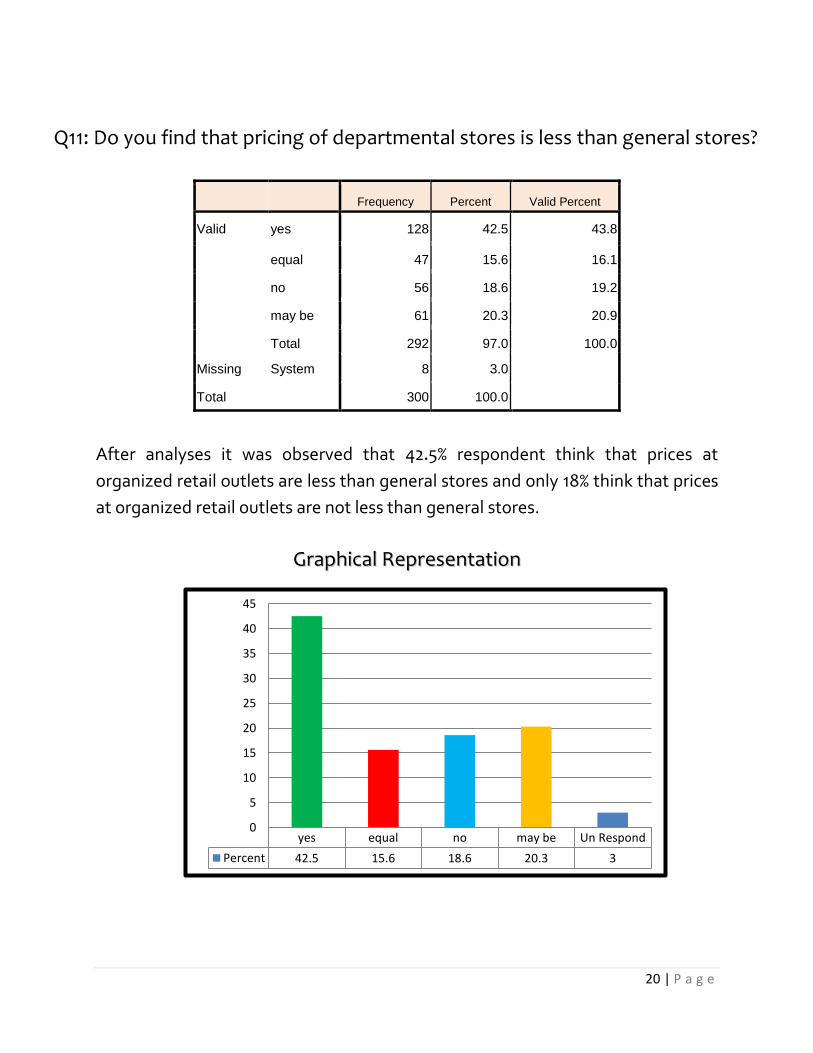
Q11: Do you find that pricing of departmental stores is less than general stores?
After analyses it was observed that 42.5% respondent think that prices at
organized retail outlets are less than general stores and only 18% think that prices
at organized retail outlets are not less than general stores.
GGrraapphhiiccaall RReepprreesseennttaattiioonn
Frequency Percent Valid Percent
Valid yes 128 42.5 43.8
equal 47 15.6 16.1
no 56 18.6 19.2
may be 61 20.3 20.9
Total 292 97.0 100.0
Missing System 8 3.0
Total 300 100.0
yes equal no may be Un Respond
Percent 42.5 15.6 18.6 20.3 3
0
5
10
15
20
25
30
35
40
45

21 | P a g e
definitelyIncrease
RemainSame
Decrease IncreasedefinitelyDecrease
UnRespond
Percent 16.3 36.2 21.9 11.3 12 2.3
0
5
10
15
20
25
30
35
40
This question was asked from the respondents in order to check their perception
about unorganized retail outlets in the city. They were asked that what they think
about the sales volume of unorganized retail outlets in the city will it decrease,
increase or remain same. In this question we have analyze that a large number of
respondents think that the sales volume of unorganized retail outlets (general
stores) will remain same and around 22% think that sales volume will decrease.
Exact percentage is given in the above table.
GGrraapphhiiccaall RReepprreesseennttaattiioonn
Frequency Percent Valid Percent
Valid definitely Increase 49 16.3 16.7
Remain Same 109 36.2 37.1
Decrease 66 21.9 22.4
Increase 34 11.3 11.6
definitely Decrease 36 12.0 12.2
Total 294 97.7 100.0
Missing System 6 2.3
Total 300 100.0
Q12: Do you think the sales volume of unorganized retail outlets (general stores) will?

22 | P a g e
As per analyses we have observed that,
Quality is the most important factor for the people when they go for shopping
as 30.2% ranked quality as their first priority.
35.3% ranked customer service on number second as their second priority.
15% of people prefer pricing and discounts as their third priority because
people are price conscious.
28.3% of people prefer variety as their fourth priority.
29.2 people consider location as their fifth priority which shows that they can
travel far and wide but they will not compromise on quality.
Q13: According to you, what are important factors for you when you go for shopping?
RANK
Factors 1 2 3 4 5 Total
Location 51 20 25 35 54 185
(Percentage) 27.6 10.8 13.5 18.9 29.2 100.0
Variety 13 23 23 47 59 165
(Percentage) 7.8 13.9 13.9 28.3 35.5 100.0
Customer service 48 48 37 21 36 190
(Percentage) 25.3 25.3 19.5 11.1 18.9 100.0
Quality 57 46 41 27 18 189
(Percentage) 30.2 24.3 21.7 14.3 9.5 100.0
pricing and discounts 122 27 33 16 21 219
(Percentage) 55.7 12.3 15.1 7.3 9.6 100.0

23 | P a g e
When respondents were asked to specify the reasons which influence them to
purchase from these organized retail outlets, then 33% of the respondents told
that they purchase due to better quality provided by these stores, 16 % told that
second reason is good environment, 12% replied that reasonable pricing is the
third 17% told that display of product is at fourth reason then time saving and
lastly wide range.
GGrraapphhiiccaall RReepprreesseennttaattiioonn
RANK
Factors 1 2 3 4 5 6 Total
Better Quality 87 31 22 25 14 11 190
(Percentage) 45.8 16.3 11.6 13.2 7.4 5.8 100.0
Good Environment 53 38 31 24 20 11 177
(Percentage) 29.9 21.5 17.5 13.6 11.3 6.2 100.0
Display of Products 14 17 21 34 27 36 149
(Percentage) 9.4 11.4 14.1 22.8 18.1 24.2 100.0
Wide Range 55 18 18 28 24 26 169
(Percentage) 32.5 10.7 10.7 16.6 14.2 15.4 100.0
Time Saving 46 30 24 11 25 35 171
(Percentage) 26.9 17.5 14.0 6.4 14.6 20.5 100.0
Reasonable Pricing 28 12 27 17 27 51 162
(Percentage) 17.3 7.4 16.7 10.5 16.7 31.5 100.0
45.8%
21.5% 16.7%
22.8%
14.6%
15.4% 1 Better Quality
2 Good Environment
3 Reasonable Pricing
4 Display of Products
5 Time Saving
6 Wide Range
Q14: What are your reasons for shopping from departmental stores? (Rank 1-6)

24 | P a g e
61.2%
21.3% 19.9%
15.3%
23.6%
17.9%
1 convenient Location
2 Credit Facility
3 Easy Replacment
4 small Quantity
5 Home Delivery Service
6 Bargaing Facility
In this question respondents were asked to rank the reasons for shopping from
general stores. The analyses shows that 61.2% respondents ranked convenient
location as the first reason for shopping from general stores, credit facility on
second, third reason is easy replacement, availability of small quantity Is at
fourth, then home delivery service and bargaining facility. Exact figures are
shown in table and graph as well.
GGrraapphhiiccaall RReepprreesseennttaattiioonn
Q15: What are your reasons for shopping from General stores? (Rank 1-6)
RANK
Factors 1 2 3 4 5 6 Total
convenient Location 126 20 18 13 12 17 206
(Percentage) 61.2 9.7 8.7 6.3 5.8 8.3 100.0
Home Delivery Service 21 13 19 23 37 44 157
(Percentage) 13.4 8.3 12.1 14.6 23.6 28.0 100.0
Easy Replacement 35 22 33 34 18 24 166
(Percentage) 21.1 13.3 19.9 20.5 10.8 14.5 100.0
Credit Facility 39 37 16 15 21 46 174
(Percentage) 22.4 21.3 9.2 8.6 12.1 26.4 100.0
small Quantity 52 28 31 26 14 19 170
(Percentage) 30.6 16.5 18.2 15.3 8.2 11.2 100.0
Bargaining Facility 24 24 23 23 30 28 152
(Percentage) 15.8 15.8 15.1 15.1 19.7 17.9 100.0

25 | P a g e
As per survey conducted,
56% of consumers, who visited departmental stores, always find employees’
attitude cooperative.
19.3% of consumers find employees’ attitude satisfactory.
Whereas 17.9% of people think that they have to always call employees of
departmental stores to help them.
While only 1.7% thinks that they behave rudely.
Q16: How do you find employees’ attitude in the departmental stores as compare to general stores?
Frequency Percent Valid Percent
Valid cooperative 169 56.1 59.1
satisfactory 58 19.3 20.3
rude 5 1.7 1.7
they only help when they are
asked
54 17.9 18.9
Total 286 95.0 100.0
Missing System 14 5.0
Total 300 100.0
26 | P a g e
57.5%
20.4% 17.1%
22.5%
13%
45.5%
1 Long Queuing for billing
2 Improper Space Management
3 No Home Delivery Service
4 Poor after Sales Service
5 Inconvenient Location
6 Non-cooperative attitude ofstaff
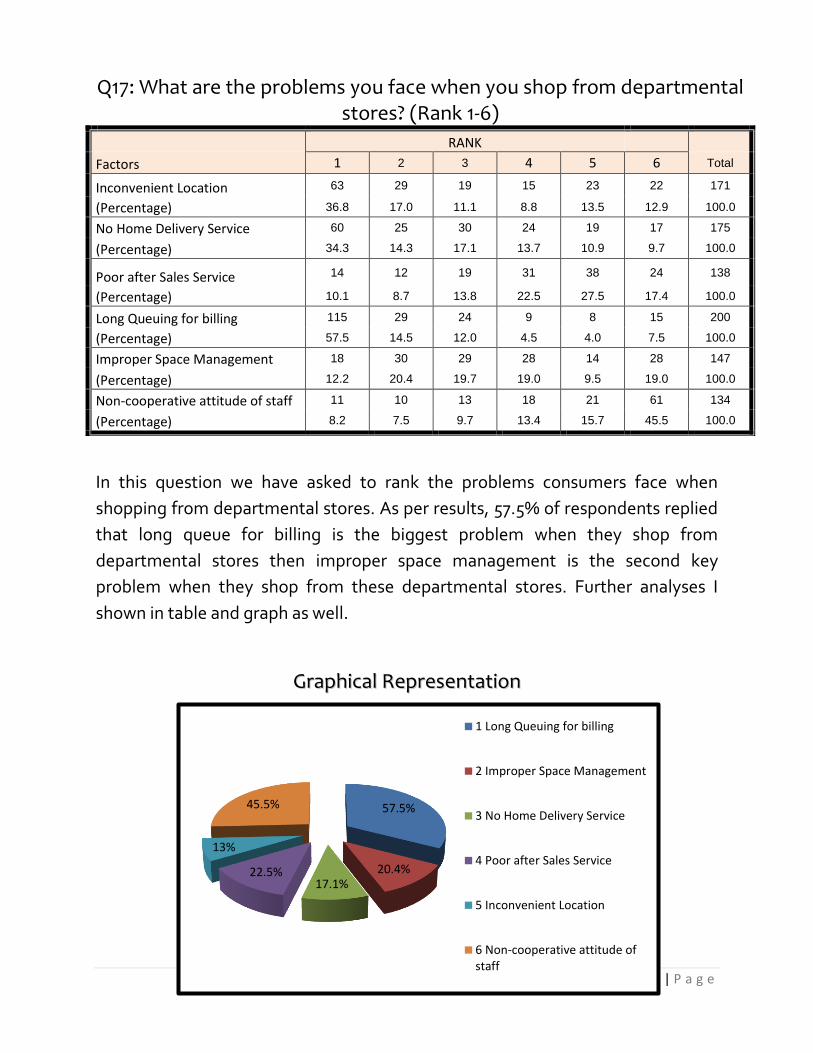
In this question we have asked to rank the problems consumers face when
shopping from departmental stores. As per results, 57.5% of respondents replied
that long queue for billing is the biggest problem when they shop from
departmental stores then improper space management is the second key
problem when they shop from these departmental stores. Further analyses I
shown in table and graph as well.
GGrraapphhiiccaall RReepprreesseennttaattiioonn
Q17: What are the problems you face when you shop from departmental stores? (Rank 1-6)
RANK
Factors 1 2 3 4 5 6 Total
Inconvenient Location 63 29 19 15 23 22 171
(Percentage) 36.8 17.0 11.1 8.8 13.5 12.9 100.0
No Home Delivery Service 60 25 30 24 19 17 175
(Percentage) 34.3 14.3 17.1 13.7 10.9 9.7 100.0
Poor after Sales Service 14 12 19 31 38 24 138
(Percentage) 10.1 8.7 13.8 22.5 27.5 17.4 100.0
Long Queuing for billing 115 29 24 9 8 15 200
(Percentage) 57.5 14.5 12.0 4.5 4.0 7.5 100.0
Improper Space Management 18 30 29 28 14 28 147
(Percentage) 12.2 20.4 19.7 19.0 9.5 19.0 100.0
Non-cooperative attitude of staff 11 10 13 18 21 61 134
(Percentage) 8.2 7.5 9.7 13.4 15.7 45.5 100.0
27 | P a g e
48.7%
18.5% 22.8%
16%
27.2%
20.2%
1 Unhygienic Condition of Stores
2 Poor display product
3 Home Delivery Service
4 Unavailability of desirable product
5 Billing problems
6 Improper Parking Facility
3 Improper shelf space
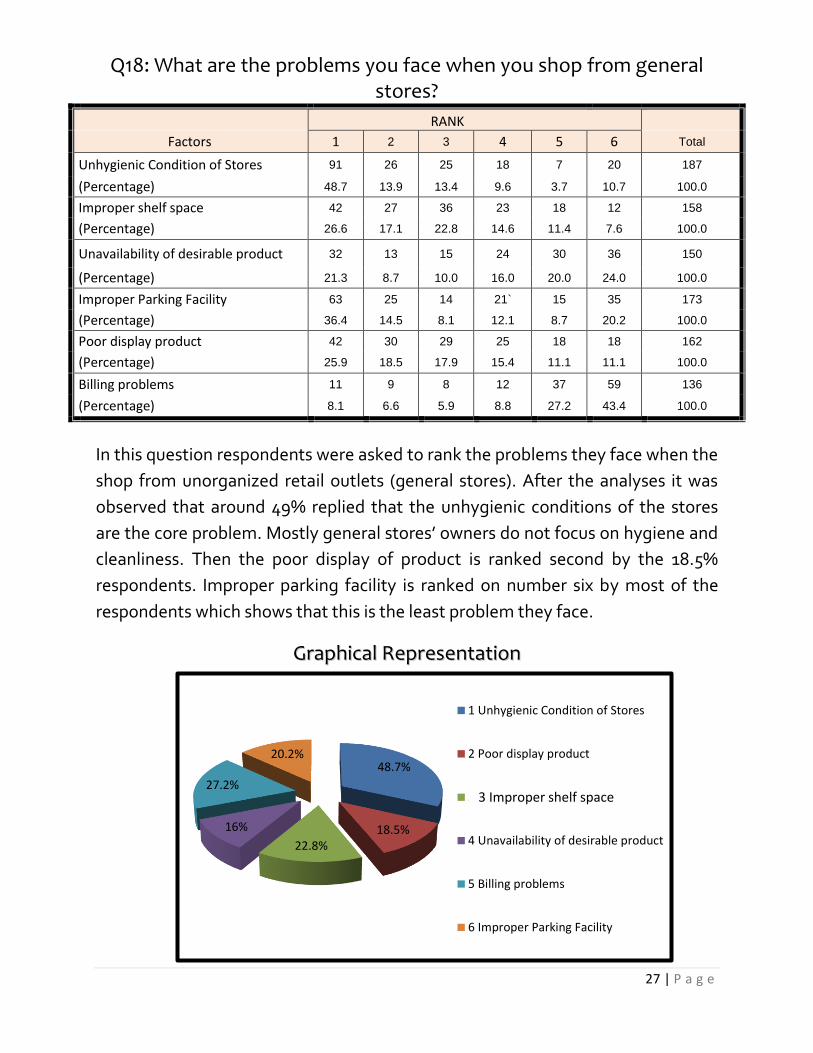
In this question respondents were asked to rank the problems they face when the
shop from unorganized retail outlets (general stores). After the analyses it was
observed that around 49% replied that the unhygienic conditions of the stores
are the core problem. Mostly general stores’ owners do not focus on hygiene and
cleanliness. Then the poor display of product is ranked second by the 18.5%
respondents. Improper parking facility is ranked on number six by most of the
respondents which shows that this is the least problem they face.
GGrraapphhiiccaall RReepprreesseennttaattiioonn
Q18: What are the problems you face when you shop from general stores?
RANK
Factors 1 2 3 4 5 6 Total
Unhygienic Condition of Stores 91 26 25 18 7 20 187
(Percentage) 48.7 13.9 13.4 9.6 3.7 10.7 100.0
Improper shelf space 42 27 36 23 18 12 158
(Percentage) 26.6 17.1 22.8 14.6 11.4 7.6 100.0
Unavailability of desirable product 32 13 15 24 30 36 150
(Percentage) 21.3 8.7 10.0 16.0 20.0 24.0 100.0
Improper Parking Facility 63 25 14 21` 15 35 173
(Percentage) 36.4 14.5 8.1 12.1 8.7 20.2 100.0
Poor display product 42 30 29 25 18 18 162
(Percentage) 25.9 18.5 17.9 15.4 11.1 11.1 100.0
Billing problems 11 9 8 12 37 59 136
(Percentage) 8.1 6.6 5.9 8.8 27.2 43.4 100.0
28 | P a g e
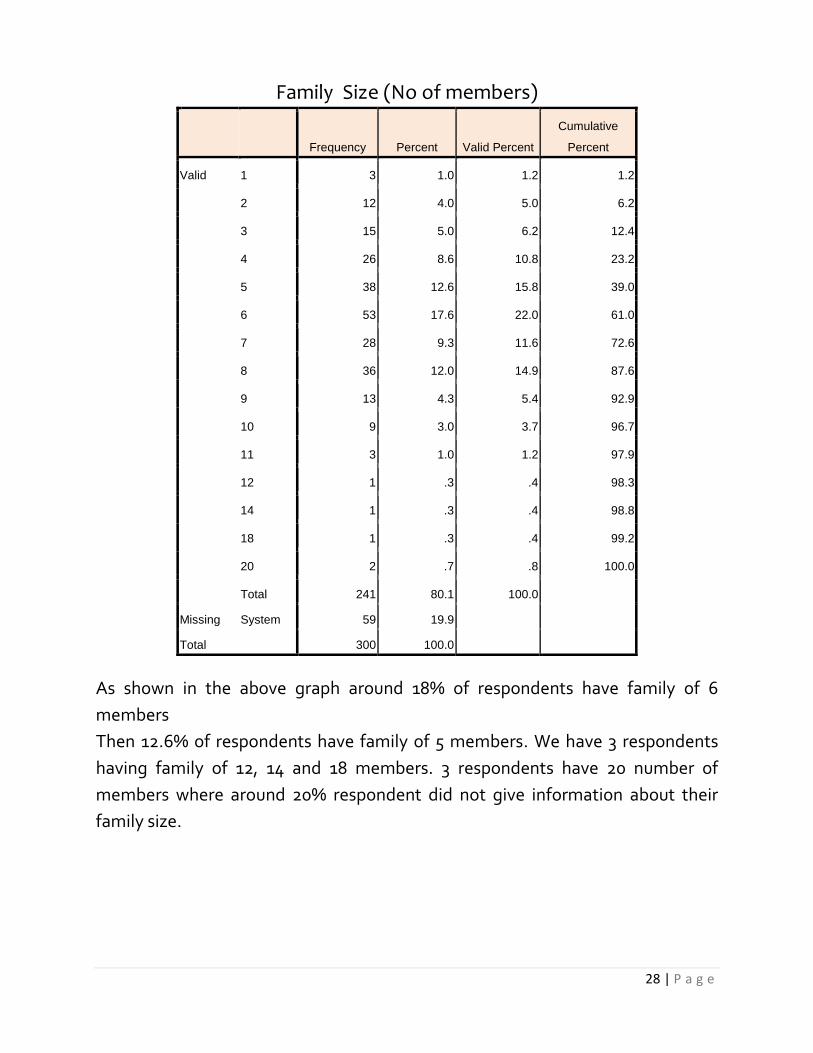
As shown in the above graph around 18% of respondents have family of 6
members
Then 12.6% of respondents have family of 5 members. We have 3 respondents
having family of 12, 14 and 18 members. 3 respondents have 20 number of
members where around 20% respondent did not give information about their
family size.
Family Size (No of members)
Frequency Percent Valid Percent
Cumulative
Percent
Valid 1 3 1.0 1.2 1.2
2 12 4.0 5.0 6.2
3 15 5.0 6.2 12.4
4 26 8.6 10.8 23.2
5 38 12.6 15.8 39.0
6 53 17.6 22.0 61.0
7 28 9.3 11.6 72.6
8 36 12.0 14.9 87.6
9 13 4.3 5.4 92.9
10 9 3.0 3.7 96.7
11 3 1.0 1.2 97.9
12 1 .3 .4 98.3
14 1 .3 .4 98.8
18 1 .3 .4 99.2
20 2 .7 .8 100.0
Total 241 80.1 100.0
Missing System 59 19.9
Total 300 100.0
29 | P a g e
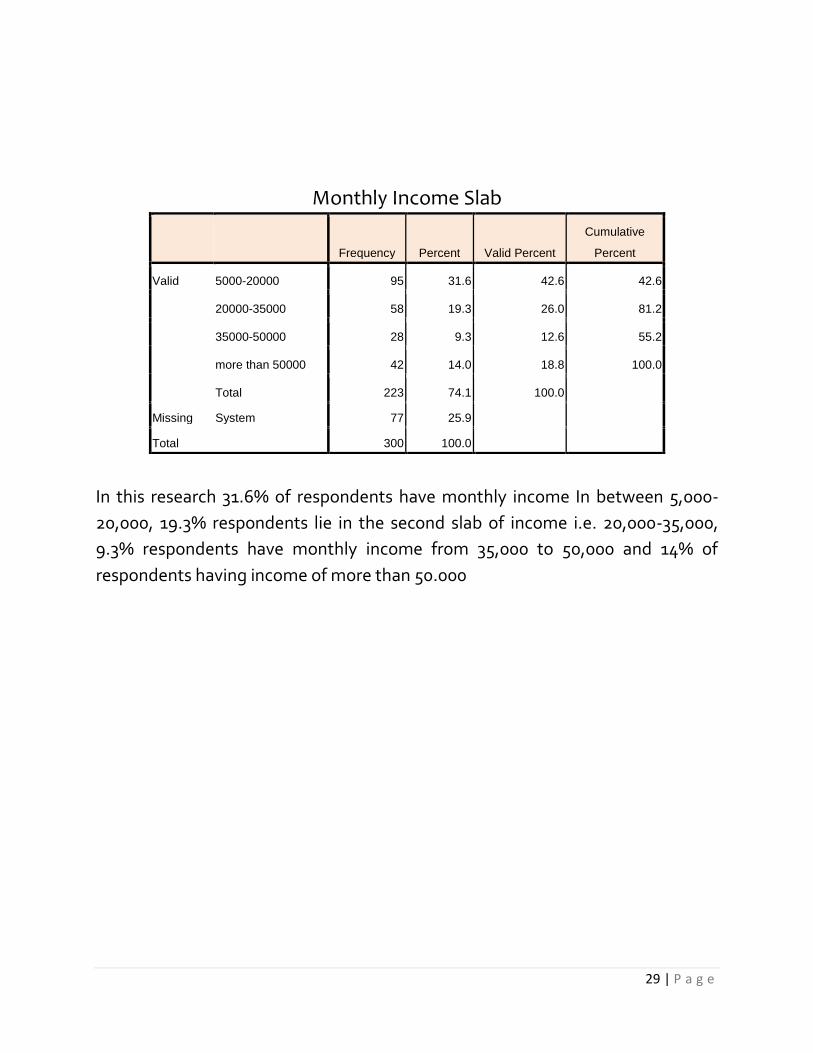
In this research 31.6% of respondents have monthly income In between 5,000-
20,000, 19.3% respondents lie in the second slab of income i.e. 20,000-35,000,
9.3% respondents have monthly income from 35,000 to 50,000 and 14% of
respondents having income of more than 50.000
Monthly Income Slab
Frequency Percent Valid Percent
Cumulative
Percent
Valid 5000-20000 95 31.6 42.6 42.6
20000-35000 58 19.3 26.0 81.2
35000-50000 28 9.3 12.6 55.2
more than 50000 42 14.0 18.8 100.0
Total 223 74.1 100.0
Missing System 77 25.9
Total 300 100.0
30 | P a g e
IINNTTEERRVVIIEEWW QQUUEESSTTIIOONNSS
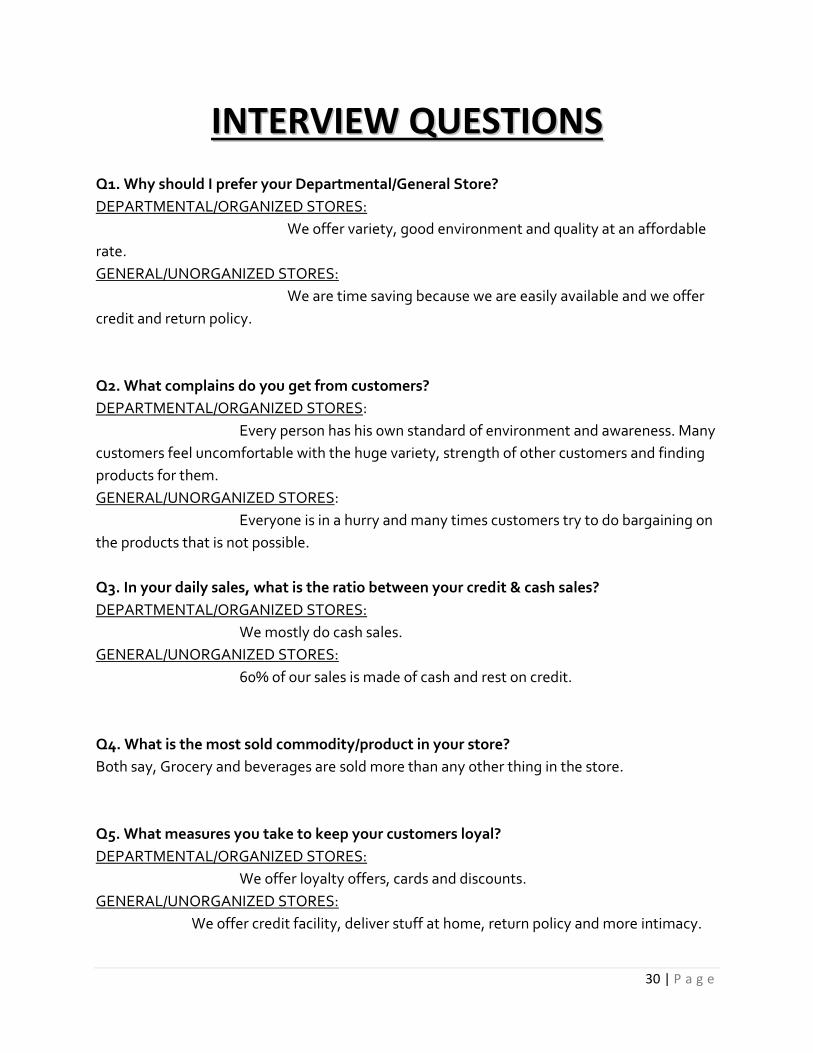
Q1. Why should I prefer your Departmental/General Store?
DEPARTMENTAL/ORGANIZED STORES:
We offer variety, good environment and quality at an affordable
rate.
GENERAL/UNORGANIZED STORES:
We are time saving because we are easily available and we offer
credit and return policy.
Q2. What complains do you get from customers?
DEPARTMENTAL/ORGANIZED STORES:
Every person has his own standard of environment and awareness. Many
customers feel uncomfortable with the huge variety, strength of other customers and finding
products for them.
GENERAL/UNORGANIZED STORES:
Everyone is in a hurry and many times customers try to do bargaining on
the products that is not possible.
Q3. In your daily sales, what is the ratio between your credit & cash sales?
DEPARTMENTAL/ORGANIZED STORES:
We mostly do cash sales.
GENERAL/UNORGANIZED STORES:
60% of our sales is made of cash and rest on credit.
Q4. What is the most sold commodity/product in your store?
Both say, Grocery and beverages are sold more than any other thing in the store.
Q5. What measures you take to keep your customers loyal?
DEPARTMENTAL/ORGANIZED STORES:
We offer loyalty offers, cards and discounts.
GENERAL/UNORGANIZED STORES:
We offer credit facility, deliver stuff at home, return policy and more intimacy.

31 | P a g e
Q6. What plans do you have for business expansion?
DEPARTMENTAL/ORGANIZED STORES:
Yes, we have plans to expand our business in the future in different
locations.
GENERAL/UNORGANIZED STORES:
We do not have any plans regarding expansion because of complexities
like human resource management and raising capital.
Q7. What do you think about future of General stores in Pakistan, and why?
Both predict, it will remain same because departmental stores require a lot of planning and
large capital to establish and general stores require less planning and capital. Both increase
with the population.
Q8. Why don’t you promote your store through mass marketing? (Departmental Store)
We spend more on customer service and facility that’s why we spend more amounts on
customer service than mass marketing. We think customer service is itself a tool of marketing.
Q10. Do you think the pricing of departmental stores is less than general stores?
Both agree that pricing of departmental stores is less than general stores because they
purchase in bulk quantity.
Q9. What is the impact of your sales volume in last few years?
It remained same because of increasing competition and population.
Q10. What is an average purchase of goods by a customer?
It depends on customers need. Some buy in hundreds and some in thousands.
Q11. How will be retailing in Pakistan, completely organized, unorganized or both?
Both think it will remain same in the future.

32 | P a g e
IINNTTEERRPPRREETTAATTIIOONN OOFF RREESSUULLTTSS Most of the people prefer to purchase their daily needs products from unorganized retail
outlets (general stores) because of the convenient location
About 93% of the respondents have visited a departmental store which shows that the concept of organized retailing attract them.
In survey it has been seen that people prefer to buy Fruits and vegetables on daily or weekly basis Grocery on monthly basis Beverages and snacks on weekly basis Ready to eat/cook food on monthly basis
The main purpose to visit departmental store for most of the respondents were to purchase
of general products.
It has been clearly observed that people want to purchase their grocery from shops which are less than 1 km far away from their homes they do not want to travel widely for grocery.
Majority of people buy fruits and vegetables from unorganized retailers.
Around 53% of respondents think that their monthly expenditures increases when they shop from organized retail outlets (departmental stores).
A large number of people replied that in future they will spend at organized retail outlets.
About 43% of people find prices of goods in departmental stores is less than general stores and when the same question was asked to the owners of both the retail outlets they also said that prices in departmental stores is less than general sores.

33 | P a g e
It has been clearly observed in this survey that there is no such impact of organized retail outlets on unorganized retail outlets. Both organized and unorganized retailers will run their business at their places
.
The most important reason for shopping from organized retail outlets is better quality products provided by these organized retail outlets.
A sufficient amount of people prefer to buy from general sores because of convenience.
It has been observed that long queue for billing in departmental stores is the core problem faced by most of the respondents.
Unhygienic conditions of the general stores are the biggest problem that people are facing.
It has been seen that there is no impact of family size in the selection of retailing format
In survey we find most of the people are from lower income level group
About 10 % of respondent are from middle income group and 14 % of respondents are from high income group.
Results revealed that most of the respondents are educated and most of them are doing private job.
34 | P a g e
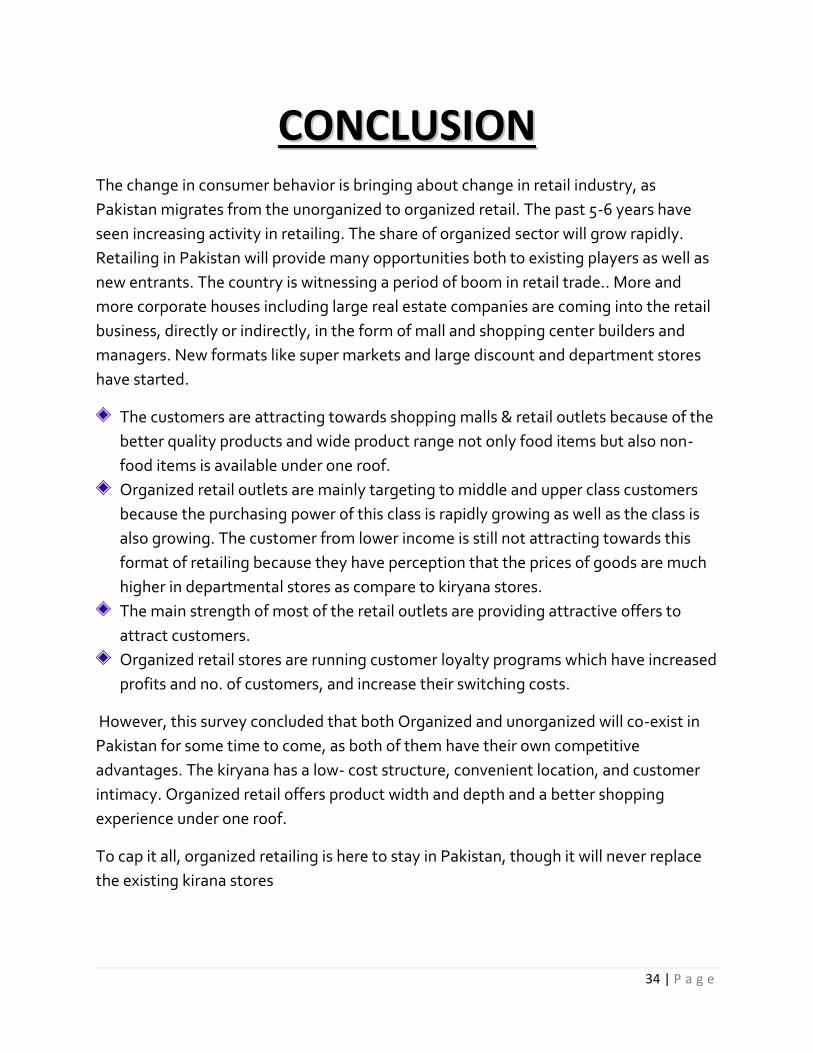
CCOONNCCLLUUSSIIOONN The change in consumer behavior is bringing about change in retail industry, as
Pakistan migrates from the unorganized to organized retail. The past 5-6 years have
seen increasing activity in retailing. The share of organized sector will grow rapidly.
Retailing in Pakistan will provide many opportunities both to existing players as well as
new entrants. The country is witnessing a period of boom in retail trade.. More and
more corporate houses including large real estate companies are coming into the retail
business, directly or indirectly, in the form of mall and shopping center builders and
managers. New formats like super markets and large discount and department stores
have started.
The customers are attracting towards shopping malls & retail outlets because of the
better quality products and wide product range not only food items but also non-
food items is available under one roof.
Organized retail outlets are mainly targeting to middle and upper class customers
because the purchasing power of this class is rapidly growing as well as the class is
also growing. The customer from lower income is still not attracting towards this
format of retailing because they have perception that the prices of goods are much
higher in departmental stores as compare to kiryana stores.
The main strength of most of the retail outlets are providing attractive offers to
attract customers.
Organized retail stores are running customer loyalty programs which have increased
profits and no. of customers, and increase their switching costs.
However, this survey concluded that both Organized and unorganized will co-exist in
Pakistan for some time to come, as both of them have their own competitive
advantages. The kiryana has a low- cost structure, convenient location, and customer
intimacy. Organized retail offers product width and depth and a better shopping
experience under one roof.
To cap it all, organized retailing is here to stay in Pakistan, though it will never replace
the existing kirana stores
35 | P a g e
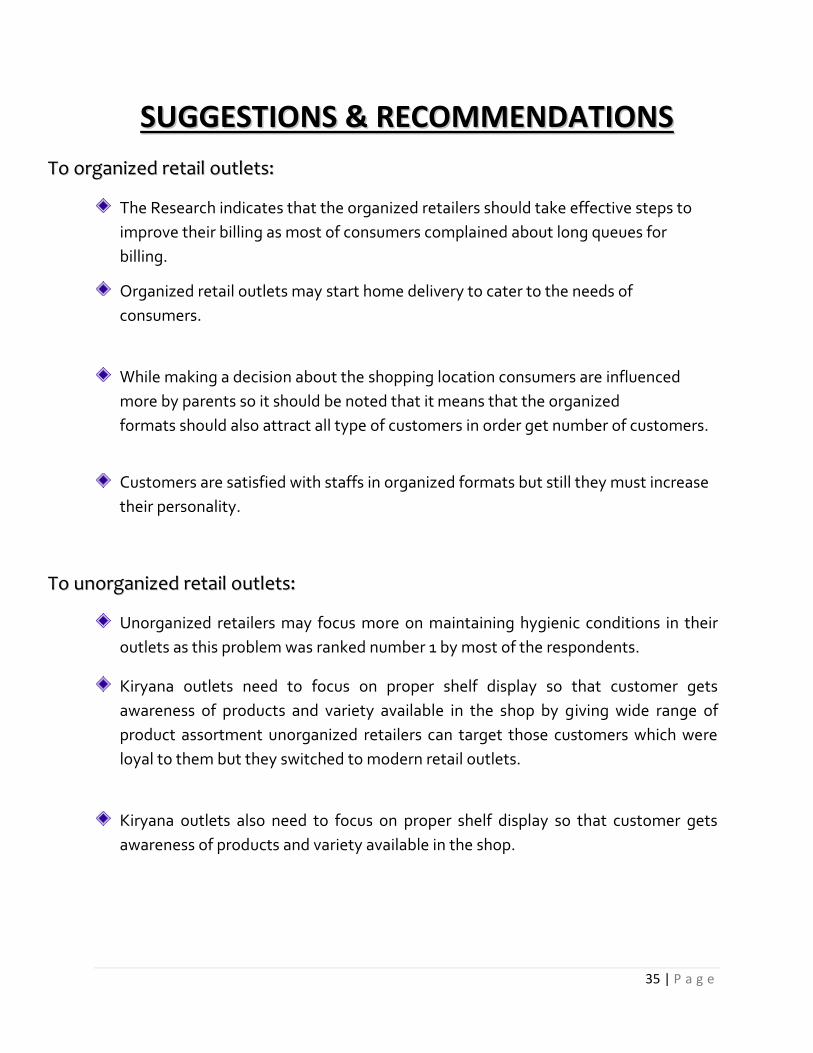
SSUUGGGGEESSTTIIOONNSS && RREECCOOMMMMEENNDDAATTIIOONNSS
TToo oorrggaanniizzeedd rreettaaiill oouuttlleettss::
The Research indicates that the organized retailers should take effective steps to
improve their billing as most of consumers complained about long queues for
billing.
Organized retail outlets may start home delivery to cater to the needs of
consumers.
While making a decision about the shopping location consumers are influenced
more by parents so it should be noted that it means that the organized
formats should also attract all type of customers in order get number of customers.
Customers are satisfied with staffs in organized formats but still they must increase
their personality.
TToo uunnoorrggaanniizzeedd rreettaaiill oouuttlleettss::
Unorganized retailers may focus more on maintaining hygienic conditions in their
outlets as this problem was ranked number 1 by most of the respondents.
Kiryana outlets need to focus on proper shelf display so that customer gets
awareness of products and variety available in the shop by giving wide range of
product assortment unorganized retailers can target those customers which were
loyal to them but they switched to modern retail outlets.
Kiryana outlets also need to focus on proper shelf display so that customer gets
awareness of products and variety available in the shop.

36 | P a g e
LLIIMMIITTAATTIIOONNSS The survey was conducted in specific regions of Karachi so result extracted
from this may vary in other regions
Due to time constraints the sample size was restricted to 300 which is
comparatively very less as compare to the entire population of the city.
The respondents had replied according to their own perception and experienc
e and therefore personal bias may also possible.
Some of the respondents were unable or unwilling to give a complete and
accurate response to certain questions.
37 | P a g e
REFERENCES Ghosh and Tripathi, (2010) “Customer expectations of store attributes: A study of
organizedretail outlets in India”, Journal of Retail & Leisure Property, Vol. 9, No 1, pg: 75–87.
Urvashi Gupta, (November 2012) “Changing consumers’ preferences from unorganized
retailing towards organized retailing: A study in Jammu”, Journal of Emerging Knowledge on
Emerging Markets, Volume 4.
Amitava Roy (July, 10, 2010), “Consumer buying behaviors towards organized retail outlets”,
Asia Pacific Journal of Marketing and Logistics, Vol. 21, No. 1, pp 127-143.
WEB LINKS:
http://www.freeonlineresearchpapers.com/department-stores-pakistan
http://www.euromonitor.com/retailing-in-pakistan/report
http://www.retailindustry.about.com
www.google.com
http://thepiratebay.se/
38 | P a g e
BBiibblliiooggrraapphhyy
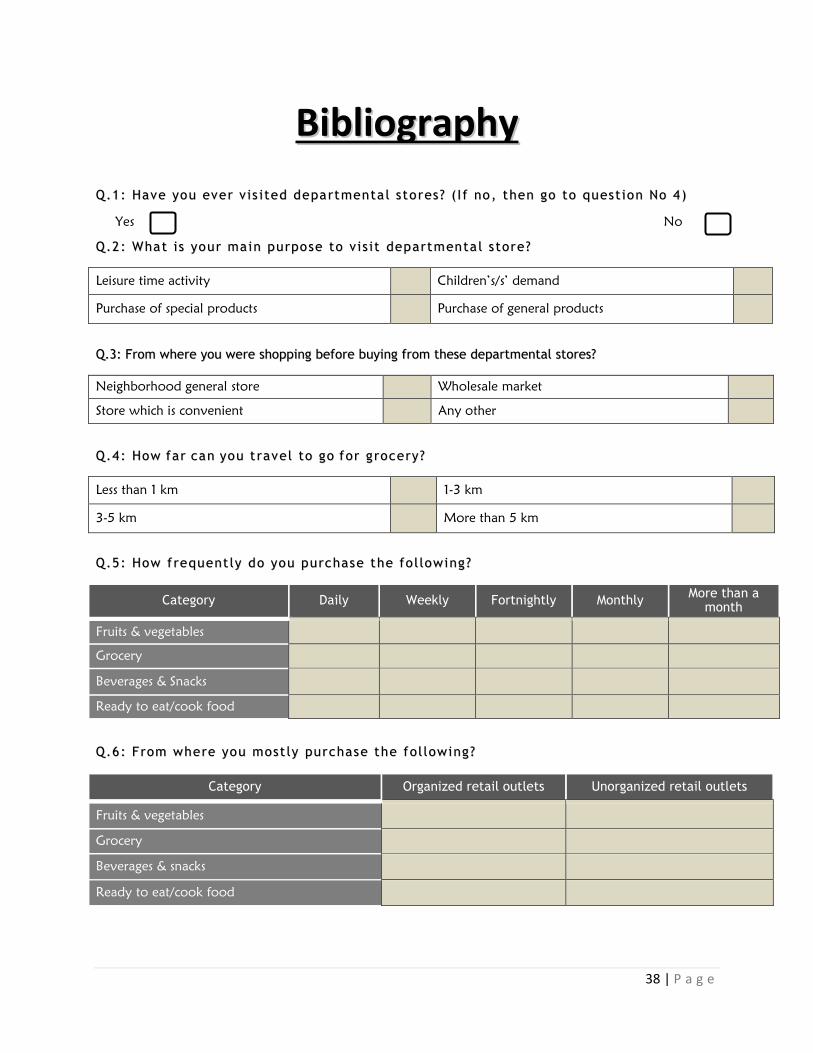
QQ..11 :: HHaavvee yyoouu eevvee rr vv ii ss ii tteedd ddeeppaa rr ttmmeennttaa ll ss tt oo rreess ?? (( II ff nnoo ,, tt hheenn ggoo ttoo qquueess tt ii oonn NNoo 44 ))
Yes No
QQ..22 :: WWhhaa tt ii ss yyoouu rr mmaa ii nn ppuu rrppoo ssee ttoo vv ii ss ii tt ddeeppaarr ttmmeennttaa ll ss ttoo rree ??
Leisure time activity Children’s/s’ demand
Purchase of special products Purchase of general products
QQ..33:: FFrroomm wwhheerree yyoouu wweerree sshhooppppiinngg bbeeffoorree bbuuyyiinngg ffrroomm tthheessee ddeeppaarrttmmeennttaall ssttoorreess??
Neighborhood general store Wholesale market
Store which is convenient Any other
QQ..44 :: HHooww ff aa rr ccaann yyoouu tt rraavvee ll ttoo ggoo ff oo rr gg rrooccee rryy ??
Less than 1 km 1-3 km
3-5 km More than 5 km
QQ..55 :: HHooww ff rreeqquueenntt ll yy ddoo yyoouu ppuu rrcchhaass ee tt hhee ff oo ll ll oowwii nngg ??
Category Daily Weekly Fortnightly Monthly More than a
month
Fruits & vegetables
Grocery
Beverages & Snacks
Ready to eat/cook food
QQ..66 :: FF rroomm wwhhee rree yyoouu mmooss tt ll yy ppuu rr cchhaass ee tt hhee ff oo ll ll oowwii nngg ??
Category Organized retail outlets Unorganized retail outlets
Fruits & vegetables
Grocery
Beverages & snacks
Ready to eat/cook food
39 | P a g e
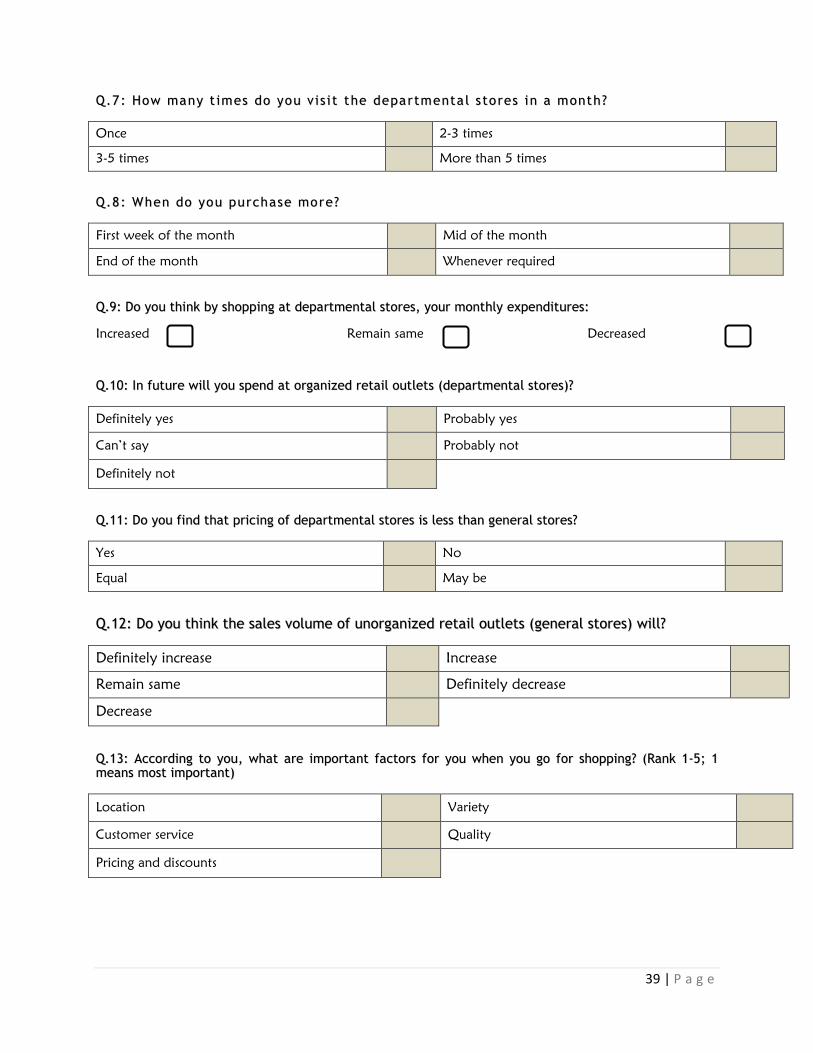
QQ..77 :: HHooww mmaannyy tt iimmeess ddoo yyoouu vv ii ss ii tt tt hhee ddeeppaa rr ttmmeennttaa ll ss ttoo rreess ii nn aa mmoonntthh ??
Once 2-3 times
3-5 times More than 5 times
QQ ..88 :: WWhheenn ddoo yyoouu ppuu rr cchhaassee mmoo rree ??
First week of the month Mid of the month
End of the month Whenever required
QQ..99:: DDoo yyoouu tthhiinnkk bbyy sshhooppppiinngg aatt ddeeppaarrttmmeennttaall ssttoorreess,, yyoouurr mmoonntthhllyy eexxppeennddiittuurreess::
Increased Remain same Decreased
QQ..1100:: IInn ffuuttuurree wwiillll yyoouu ssppeenndd aatt oorrggaanniizzeedd rreettaaiill oouuttlleettss ((ddeeppaarrttmmeennttaall ssttoorreess))??
Definitely yes Probably yes
Can’t say Probably not
Definitely not
QQ..1111:: DDoo yyoouu ffiinndd tthhaatt pprriicciinngg ooff ddeeppaarrttmmeennttaall ssttoorreess iiss lleessss tthhaann ggeenneerraall ssttoorreess??
Yes No
Equal May be
QQ..1122:: DDoo yyoouu tthhiinnkk tthhee ssaalleess vvoolluummee ooff uunnoorrggaanniizzeedd rreettaaiill oouuttlleettss ((ggeenneerraall ssttoorreess)) wwiillll??
Definitely increase Increase
Remain same Definitely decrease
Decrease
QQ..1133:: AAccccoorrddiinngg ttoo yyoouu,, wwhhaatt aarree iimmppoorrttaanntt ffaaccttoorrss ffoorr yyoouu wwhheenn yyoouu ggoo ffoorr sshhooppppiinngg?? ((RRaannkk 11--55;; 11 mmeeaannss mmoosstt iimmppoorrttaanntt))
Location Variety
Customer service Quality
Pricing and discounts

40 | P a g e
QQ..1144:: WWhhaatt aarree yyoouurr rreeaassoonnss ffoorr sshhooppppiinngg ffrroomm ddeeppaarrttmmeennttaall ssttoorreess?? ((RRaannkk 11--66))
Better quality Wide product range
Good environment Time saving
Display of products Reasonable pricing/ promotional schemes
QQ..1155:: WWhhaatt aarr ee yyoouurr rreeaassoonnss ffoorr sshhoopppp iinngg ff rroomm ggeenneerr aa ll ss ttoorree ss ?? ((RRaannkk 11 -- 66))
Convenient location Credit facility
Home delivery service Easy availability of small quantity
Easy replacement of defective goods Bargaining facility
QQ..1166:: HHooww ddoo yyoouu ffiinndd eemmppllooyyeeeess’’ aattttiittuuddee iinn tthhee ddeeppaarrttmmeennttaall ssttoorreess iinn ccoommppaarree ttoo ggeenneerraall ssttoorreess??
Co-operative Rude
Satisfactory They only help when they are asked
QQ..1177:: WWhhaatt aarree tthhee pprroobblleemmss yyoouu ffaaccee wwhheenn yyoouu sshhoopp ffrroomm oorrggaanniizzeedd rreettaaiill oouuttlleettss
((ddeeppaarrttmmeennttaall ssttoorreess))?? ((RRaattee 11--66))
Inconvenient location Long queue for billing
No home delivery Improper space management
Poor after sales service Non cooperative attitude of staff
QQ..1188:: WWhhaatt aarree tthhee pprroobblleemmss yyoouu ffaaccee wwhheenn yyoouu sshhoopp ffrroomm oorrggaanniizzeedd rreettaaiill oouuttlleettss ((ggeenneerraall ssttoorreess))??
((RRaattee 11--66))
Unhygienic conditions of the stores Improper parking facility
Improper shelf space Poor display of products
Unavailability of desirable products Billing problems
NNaammee:: __________________________ GGeennddeerr : Male Female
FFaammii ll yy ss ii zzee (( nnoo .. oo ff mmeemmbbeerr ss )) :: ____ EE --mmaa ii ll :: _______________________
QQuuaa ll ii ff ii ccaa tt ii oonn :: CCoonnttaacc tt NNOO:: ___________________
Below matric Under graduate
Graduate Post graduate
Other (specify)

41 | P a g e
AAggee:: Below 20 20-30 30-40 Above 40
OOccccuuppaa tt ii oonn// PPrroo ffeess ss ii oonn ::
Self employed /Business Government job
Private job House wife
Any other (specify)
MMoonntthh ll yy ii nnccoommee lleevvee ll ::
5,000-20,000 20,000-35,000
35,000-50,000 More than 50,000
TThhaannkk yyoouu ssoo mmuucchh ffoorr yyoouurr ccooooppeerraattiioonn aanndd ggiivviinngg uuss yyoouurr vvaalluuaabbllee iinnffoorrmmaattiioonn..