to - british columbiaa100.gov.bc.ca/appsdata/acat/documents/r5046/656_1143144427025... · -2- a .e...
TRANSCRIPT

T(@A.P. Kohut Senior Geological Engineer Groundwater Sec t ion Water Management Branch
Date: January 9 , 1985
Our File: 92 B/12 #15
Re: A Proposed Groundwater Qual i t y Monitoring Program f o r the Mill Bay Area i n the Shawnigan Land District
T h i s study has been prepared a s a result of Mr. Saunders' concerns on the dec l in ing well y i e l d s during summer m o n t h s and the p o s s i b i l i t y of inter- ference by an i r r i g a t i o n well of Mr. Herb Bootsman. The purpose of t h i s study is to a s s e s s the need f o r a groundwater q u a l i t y monitoring program f o r the Mill Bay a rea t h a t i s bounded by Hutchinson Road on the north, Solarium Road on the south, Saanich In le t on the east and Wilkinson Road on the west (see Figure 1). T h i s study was a l s o designed to determine i f the hydro- chemical ana lyses t h a t a r e a v a i l a b l e f o r t h e study a rea e x h i b i t any temporal trends ( i ncreas i ng o r decreas i ng) . GENERAL GEOLOGY
Most of the s tudy a rea i s under la in by igneous rocks of J u r a s s i c Age termed the I s l and I n t r u s i o n s (Mu1 ler , 1975). These g r a n i t i c parent rocks produce hard boulders and sand g r a i n s b u t break down through weathering and o t h e r processes i n t o clayey ma te r i a l s . Minor amounts of l imestone lenti ls and volcanic rocks a r e a l s o found i n the region (Clapp, 1917). The underlying g r a n i t i c rocks which make up most of this a rea appear to be p a r a l l e l to the Trans Canada Highway along the coas t a l bel t between Saanich I n l e t and Shawnigan Lake (Figure 2 ) .
According t o the well logs i n the o f f i c e , severa l wells i n Range 8, Sec t ion 4 o f Shawnigan Land District were dril led through a limestone l a y e r varying from 25 feet t o 230 feet before they . terminated i n bedrock. Most o f the o t h e r wells under cons ide ra t ion were d r i l l e d i n g r a n i t i c rocks.
In genera l , the s u r f i c i a l s o i l s i n th is a rea a r e mixtures of p a r t i c l e s derived from many d i f f e r e n t rock sources . Hard boulders and gravel i n this a r e a are mostly o r i g i n a t e d from the g r a n i t i c and volcanic rocks. Some bedrock exposed near the Trans Canada Highway a t Kilmalu Road is covered by a t h i n l a y e r of g l a c i a l ma te r i a l s . Mr. Bootsman's well (Range 8, Sect ion 7 , No. 11) i s a l s o loca ted i n the bedrock w i t h t h i n patches of overburden.
GROUNDWATER PROBLEM
The 510 f o o t deep well of Mr. Bootsman, repor ted to produce 135 USgpm, is l o c a t e d on the west side of the Trans Canada Highway. Whereas Saunders' 208 f o o t s h a l l o w well y i e l d i n g 1 5 USgpm i s a b o u t 1000 f e e t from Mr. Bootsman's well i n a nor thwes ter ly d i r e c t i o n . Both wells te rmina te i n

- 2 -
A .e Ko hu t January 9, 1985
the same a q u i f e r o r interconnected aqu i fe r , b u t Mr . Bootsman's we l l i s about 302 f e e t deeper than M r . Saunders' w e l l . I n the summer o f 1979, M r . Saunders' w e l l t h a t experienced a l a rge drop i n capacity, was down t o 0.5 USgpm. Decl ines i n water l e v e l s o f the observation we l l (No. 256) were a l s o noted i n the summers o f 1980 t o 1983 (see F igure 3). Th is observation w e l l i s loca ted about 3000 f e e t southeast o f M r . Bootsman's we l l . M r . Barry, a neighbour o f Mr. Saunders, a lso experienced a dramatic dec l ine i n water l e v e l s i n h i s wel l dur ing the summers o f 1980 and 1981. In te r fe rence a t the observation wel l No. 256 was about 80.8 f e e t below ground l e v e l on August 18, 1980 and 87.5 f e e t on August 26, 1981 (Kalyn, December 1981).
HYDROCHEMICAL DATA
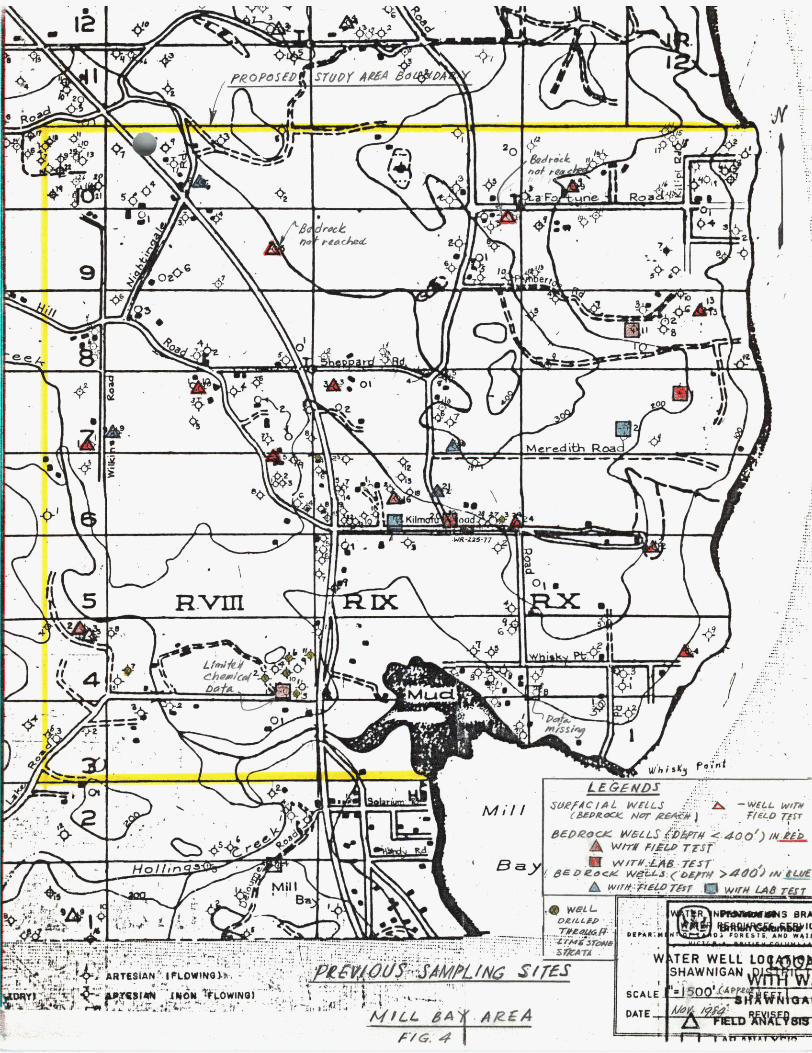
Most o f the shortcomings o f t h i s study area are because o f i n s u f f i c i e n t continuous data. Wi th in the study area, 24 chemical analyses o f the 22 groundwater w e l l s are l i s t e d i n Table 1. Only f i v e we l l s have one complete hydrochemical ana lys is since i n s t a l l a t i o n . Continuous h i s t o r i c data on chemical analyses of groundwater fo r a l l the wells i n the e n t i r e area are n o t ava i lab le , except one observation wel l No. 256 (Range 9, Section 6, No. 17) i n the K i lma lu Road area w i t h i n t e r m i t t e n t records (1981, 1982 and 1984). Other groundwater we l l s have only one f i e l d (Hach) t e s t w i t h l i m i t e d analyses performed since i n s t a l l a t i o n (see F igure 4 f o r we l l s i t e s and Table 1 f o r chemical analyses).
Continuous basic data o f groundwater q u a l i t y f o r an area t h a t depends heav i l y on groundwater as a major source of water supply are des i rab le.
I .
EVALUATION OF CHEMICAL ANALYSES OF GROUNDWATER
Resul ts of 24 chemical analyses on samples taken from 22 w e l l s w i t h i n the study area i nd i ca ted t h a t concentrat ions o f d isso lved cons t i t uen ts remain a t low l e v e l s from 1973 t o 1984 (see Table 1 ) . The water q u a l i t y i n t h i s a q u i f e r was mainly sodium-cal cium-bicarbonate type i n which c h l o r i d e and su lphate ions were a lso s i g n i f i c a n t (see Appendix I ) . The ca lcu la ted d isso lved s o l i d s concentrat ions ranged from 98 t o 448 ppm. The pH o f groundwater var ied from 6.5 t o 8.5 The hardness covered a wide range o f 25 t o 238 ppm.
I n view o f i n s u f f i c i e n t h i s t o r i c base data, a p l o t o f concentrat ion o f c h l o r i d e ions i n ppm versus we l l depths i nd i ca tes t h a t the concentrat ion o f c h l o r i d e ions increases w i t h depth (see F igure 5) . When the ava i l ab le water q u a l i t y based on l abo ra to ry analyses i s shown diagrammatical ly i n the p i e diagram as i n F igure 6, the s i ze o f c i r c l e i s p ropor t iona l t o the concen- t r a t i o n o f the t o t a l d isso lved so l ids . I n general, the shallow groundwaters

W d L L NO.
R 9 6 17 9 6 17 /o 10 9 9 9 9 8 IO 6 9 7 9 9 7 3 f0 B /.3 IO 4 4 8 9 1 /o 5 2 ? $ S 2 L . s 7 7 1 8 7 9 6 17 8 4 /L I O 7 2

- 3 -
A .@ Kohu t January 9, 1985
are lower i n total dissolved solids and of the calcium-magnesium-bicarbonate type, while deeper groundwaters are higher i n total dissolved solids and of the sodium-bicarbonate-chl ori de type.
In order to assess the temporal trend of groundwater quality for the obser- v a t i o n well (No. 2561, concqntrations of dissolved constituents are correlated w i t h time. The concentration of total dissolved solids (T.D.S.) i s increasing w i t h time a t a slow rate i n the p l o t o f T.D.S. versus time (see Figure 7 ) . Other major ions such as calcium and bicarbonate display a similar trend. The concentration of chloride ions declines from 1981 t o 1983, b u t increases s l i g h t l y i n 1984. Hardness i n the groundwater of the observation well has increased s l i g h t l y from 106 ppm to 137 ppm i n 1981 t o 1984 since the pumping of Mr. Bootsman's well has been operated.
DISCUSSIONS
1. Dissolved Solids
The dissolved calcium ions i n the groundwater of the observation well replaces the sodium ions as a result of the migration of groundwater furnished by pumping i n this area and the electrochemical character- is t ics of these ions. The chemical equilibrium of the groundwater i s only maintained when the rate of increase i n calcium ions balances the rate of decrease i n sodium ions. The graph of dissolved solids versus time exhibits such interaction.
From the hardness distribution map (Figure 8) established for the study area, the hardness of groundwater concentrates around Mr. Bootsman's well w h i c h yields 135 USgpm. During irrigation period, reduction i n groundwater volume by pumping may cause an increase i n concentration of dissolved so l ids when l i t t l e direct runoff i s available for recharging the aquifer.
2. Seawater Intrusion
Since the study area is situated next to the Saanich Inlet, excessive groundwater u t i l i z a t i o n by pumping may lower the water table. I f the water table is lowered, equilibrium between fresh and salt groundwater along the coastlines may be disturbed and an inverted cone of salt water may rise under those wells adjacent t o the Saanich Inlet. Also, overdraft of the groundwater may reduce the seaward gradient and permit the seawater to advance i n l a n d . T h i s effect requires continuous monitoring t o substantiate such intrusion.
- 4 -
A .1) Kohu t January 9 , 1985
3. Water Demand
Many wells dr i l led recently i n the Mill Bay area produce significant amounts of groundwater for some individual users, for example, Mr. Bootsman and Mr. Horton. In addition, the Mill Bay Waterworks extract groundwater as their major source of supply instead of surface water from Shawnigan Creek. Due to increase i n pumping ra te , the water levels will be declining and the f i e ld of interference will be extended.
CONCLUSIONS
Available hydrochemical data of the groundwater indicate tha t the concentrations of dissolved sol i d s , cal c i urn, chl oride and bicarbonate increased s l i g h t l y a f t e r the rate o f pumping has been increased. Such increase i n pumping ra te could change the water quality and could overdraft the capacity of the aquifer d u r i n g i r r igat ion seasons. Incidental increase i n hardness centering around Mr. Bootsman's well (Q = 135 USgpm) could be linked to the overdraft o f the aquifer by pumping i n this area (see Figure 8).
Based on the short-term data of the observation well (No. 2561, the analyses suggest that groundwater quality i n the bedrock i s changing w i t h time. A complete groundwater quality evaluation for this Mill Bay area i s recommended to monitor the changes.
Since groundwater u t i 1 ization i n this area is increasing and interference has been experienced by some users, management of groundwater would be required to ensure an optimal devel opment of groundwater resource w i thout endangeri ng the water qual i ty.
RECOMMENDATIONS
On the basis of t h i s study, the following groundwater quality monitoring program i s recommended.
1. A long-term groundwater monitoring program is proposed to col lect continuous data i n order to assess chemical, physical and bacterio- logical character is t ics of groundwater and the acceptabil i t y of concen- t ra t ions of ions for domestic, industrial and agricultural uses. With the evaluation of hydrochemical analyses, we hope to understand geochemical and hydrologic re1 ationships i n the aquifer and to evaluate the e f fec t of man's ac t iv i t i e s on the aquifer.
Approaches for groundwater qual i ty monitoring program are proposed as f 01 1 ows :

- 5 -
A .@ Kohu t January 9 , 1985
Sampl i ng s i tes sel ec ti on Sampl i ng depth Method of collection for laboratory o r field test Frequency of sanpl i ng Eva1 ua t ion of collected da ta Devel opment of an areal water-qual i ty pattern to review sampl i ng sites for comprehensive analyses Key constituents selection for addi t iona l sampl i ng Repeat ( i f ) t o ( v ) u n t i l a l l important water qua l i ty changes can be identified, because changes to pumping rate, chemical composition of recharge and inflow from surrounding area may affect the groundwater qual i ty .
short-term monitoring program similar to the above approaches shoul d be undertaken u n t i l an assessment of temporal variations i n groundwater can be determined. Among a l l previous sampling sites, five of these had a laboratory analysis on major constituents, one had a l imited chemical analysis performed and 17 had a simplified field test completed (Figure 4 ) . Of the 52 proposed sampling sites as shown i n Figure 9 , seven sampling sites w i t h a well depth i n excess of 400 feet below ground level and 10 sampling sites w i t h a well depth less t h a n 400 feet shall have a chemical analysis performed i n the laboratory. Whereas supplemental samples shall be provided by the remaining 35 proposed sampl i ng sites . For the suppl emental sampl i ng, f i el d tests incl ud i ng a l k a l i n i t y , chloride, iron, hardness, pH and specific conductance shall be performed on the collected samples i n the field.
Pending on the establ i shment of temporal trend i n groundwater qual i ty , the proposed groundwater qual i ty monitoring program will last a m i n i m u m of 2 t o 3 years. During the f i r s t year of monitoring, sampling on a l l proposed sites should be carried ou t twice a year: once during recharge period (e.g., April or May) and the other a t the end of irrigation season (e.g., August or September). Duration of sampling will take a b o u t two to three weeks to cover a l l the proposed sites. Frequency of sampling may be reduced to once a year during the following years. Chemical analyses shall be evaluated whenever they are made available. Other analyses or sites may be added i f there i s any reason to suspect t h a t other effluents such as herbicides, insecticides, gasoline and detergents, are affecting water qual i t y .
Geol og i i a l Engi neer Groundwater Section Water Management Branch
JK/dma

- 6 -
January 9, 1985 0
A . P . Kohut
REFERENCES
Clapp, C . H . 1917. Sooke and Duncan Map-areas, Vancouver Is1 and. Geological Survey o f Canada, Memoir 96, pp. 10-18.
Kalyn, D . 1981. Saunders' Well - Cobble Hill-Mill Bay Area. Ministry o f Environment, Water Management Branch, Fi le 92B/12 #15.
Muller, J . E . 1975. Victoria Map-area, British Columbia (92B). In Report o f Activities, Geological Survey o f Canada, Paper 75-1, Part A, p p . 21-26.

FIGURES


i I
-3.C! i
I I
I i .i
I 1 4 1

. . _..--_ ~ . . . . . . . . . . . . . . - ..... "__ . . . . . . . . . . . . . . . . . _ - . . ...... . . . . . . . . . . . . . . . . . . . ; . , -.. . . . . . . . . . . . . . . . . . . . . . . . . .
~ - . . , . . . . . . . . . . .
. . . .
. . . . . . . . . _. - . . . . . . . . . . . . ._. ... ...... . . . . . . . . ...... . . . . . . . . . . .
Q . . . .
. . . . . . .
. . . _. . . . .
._ .
- . ,_ .........
._ ....... . . . .
- . . . . . . . . . . . . . . . _. .. , . . . ........ . -___ ...... . .
____ . ......................... .
1 -. - ._
. . . . .
..... . . . . . . . . . . . ...... . - . . . . . . . . . . . . . . . . . . . . . - . -.
. . . . .
. . . . . . . . . . - - . . . . . . . . 0 ...
. . . . . . - . . - . . . . . . . . . . . . .. ._.__ -_ ...L.._._.
. . . . . . . . . . . . . , . . . . . . . . . . . . . . . . . .
........... .. - . . .
. . . . . . .
*_ . . . . . . . . .
,_I . . . . . . . . . . . . . . . .... .. . -. . . . . . . . . . . . . . . . .
. . . . . . . . . . - . . . . . .- -. ..... -- . . _. .. ._ .
. ., .
. . ....
. . . . . ..... - ...
............. . . . . . . . . ._. .
. . . . . . . . . . . . . . . . . * 1 1 I 1 I 1 I I I t 4
. . -~ .... . -
. . . . . . . . . . . . . . . . . 40- 60 ' 80 ' 100 /eo. - eo
. . ' . .-:: . . . . . . . . -..: :-.' : CL. [Ch/oric/y. lun )hpp'-n-: .....:_ :_I.. ..I. .... .:. ..L .. _ _ . . . . . . . . . - . . . . . . . . .
, I . . . . . . . . . . . . . . . . . . . . . . . . . . . . . . . . . . . . . . . . .. . . . . . . . . ......... . . .
. - .. - - ,
. . . . . . . . . . . . . . . . . . _. . . . I
* . . . . . . . . . . . . . , . .
. _ . . .
~.
"..*._. .. ._.... .... __.*... .. __i ..- .... .. ._. - ... .__- . ." .. .-__" .--.,.--- _._I_ - -
. . . . .- . . . . -


I 1
rc
r) / I 7.6 32-7
U 5- 76 0. /9 3 *2
.... -- ....... _- ..... .- ._ .._
2 66-96 - .. 5.9 -
I. , .
.......... . . .
I
. . _ .
_--. 35.4'

I PP e
...... 57.0 _.
63-2
0. o/ --i
c - .-.
-. 5-68
._
, .
100.0
. -
.
. . . . . XC6 -.= h.22 3 ....
. . - ............ ..c.._-_.--- - ..
.. ___ ... - - .... ........ .___ __ ......

1. . .-:-. ........ - ....... -_ .. ..... --- - ........
. I .
. . . . .... .......... ............. .. .____._. ,
j - ' ~ ' . &fU/ Ca/'/OnJ . . . . . . . . . . .
' . _ . -_--- ~ ,&._ . . . . . . . .
I . . . . . . . . . . . . . . . . . .
I::*,.--. . . r . ., - .* .> - _. - -3 . .
0-93
Id4 4 3 *
41.7 . . . . '-:i---:-I--:
0.d2
/*7/ . ____I_-
.- .......... I
0.7/
..... -_--
. . . .
......
. - .. ....... ._ ............. -I_.. ... ........ ........... - ...
........... ._l___l_l_ _.._ -.-
_ - _ . . . . . . .... ------
t . . ~ . . .. , . . .: . . . . . . . . . . . . . . . ~ . . . . . . , . ,
. . . . . ' . . . . . . . . . . . . ,- - . _ . . . . , ., . . . , .. . . .
. . . .

PP"
3.5-
0.049
1-59 _ _
---- . .. ' 8.55- , ,
. . .

PP" '62.0 /. 75
2 a 7 5
.... sq 7 ......
73 -/
20.2 ___^_ ___. . . . . . . . . . . . . .
.................. -___ ---.--. ..
I, . 1 . . .
. .
. . . . . . . . . . . . . j . . . . . . . . . . . . . / . . . . . . . . . . . . . . . . . . . . . . . : . + - , . . . . .+--.-*_I- -v-- . . . . . . . . . . . . I -.:._. i
, - , . . . . . . . . . 3 . . . -%.: .. .i ._ . . - .. . . , ,7'. ,. .' . . . . . .
. . . . . . . . . . . .

I --A- #a&
/*43 7
68.0
-_.--I---. -_ ....... I ......
1.3 ~ / * _ .. .. . .
. . ___ / F 3
I----- , . ......... ------ . ..r---iT* ... , , . . , . .
0.60 472
__-- . .
f &?. p ' ., . . - . . . . . . . . . . . .._
,. , . . . . . . . . . . .
47.73
----
5b 2
. . . . . . . . ...... __--__-_ --- . . . .
- .. . . . . . . . . . . : , '. ' . ' .- .
. . _ . .---: . . . .
-__I- F - * -
. . -- . . . . . . . .
. . .

80 -5 __-..---.._I-
o* /? __- .-
__
/ 03.4 --
0.003
__ .. - I -I ..
-,
.- .
6./8: . . _--4-- . . . . , ........
--- . . ... ._..._..--- .... ~ .......
. .
..
. - .. I . I ..
__..___.."__--__-_I_-----=---- . . . . . . . .~ . r _ . I .
. .- . . '.' . .
. _ . . _.,., -
. . I I..-- . . . . ........ . . . . . . . . . . . . . . . .....-.-. - - - - - - - ; - " ~ *.. ,
. . . . . . . . . . . . .; . . . . . .
. .