to: enrico c. cecchi, idi group companies
TRANSCRIPT

To: Enrico C. Cecchi, IDI Group Companies Patrick Rhodes, IDI Group Companies
From: John Andrus Christopher Turnbull
Subject: Paul VI – Residential Condominium
Parking Modification Analysis
Date: March 15, 2018
Introduction This memorandum provides parking analyses in support of a parking modification for the proposed residential condominiums of the Paul VI Redevelopment project. The site is located south of Fairfax Boulevard, east of Oak Street, and west of McLean Avenue in the City of Fairfax, Virginia. The property is currently developed with the Paul VI Catholic High School. The redevelopment plan calls for the school use to be replaced with a mix of residential, retail, and community uses to include 164 condominium units, 137 town homes, 44,000 square feet (SF) of local serving retail, and community use space. This parking modification analysis supports the proposed reduction in required parking for the condominium units. Parking Analysis
Current City of Fairfax zoning code requirements for residential condominiums are as follows: Unit Type Required Spaces Efficiency 1.25 Spaces 1 Bedroom 1.50 Spaces 2+ Bedrooms 2.00 Spaces Of the proposed 164 residential condominiums, 71 are anticipated to be 1-Bedroom units and 93 are anticipated to be 2 or more bedrooms. This mix of units and zoning

2
parking requirements would require a total of 293 spaces, or an overall rate of 1.79 spaces per unit. A parking modification request has been made to reduce the required parking for the residential condominiums to 263 spaces (a reduction from code of 30 spaces or approximately 10-percent). The spaces will be located in a parking garage under the condominium building and results in an overall parking ratio of 1.6 spaces per unit. The residential parking modification is supported by 1) national parking data published by the Institute of Transportation Engineers(ITE), 2) IDI Group Companies (IDI) experience at comparable locations, and 3) City of Fairfax recent approvals also for comparable locations.
1) The Institute of Transportation Engineers’ (ITE) Parking Generation, 4th Edition data shows that residential condominium’s peak parking demand (85th percentile) is 1.59 spaces per dwelling unit for suburban locations. The rate includes a five percent circulation factor and actual parking demands of residents and visitors. Based on ITE, the 164 residential condominiums for the project would require 261 parking spaces, two (2) spaces less than that to be provided.
2) IDI have developed many residential projects throughout the Washington
Metropolitan area including The Enclave located in the City of Fairfax. These projects include similar or lower parking ratios than those requested with this project. A listing of the IDI comparable residential projects is shown in Attachment 2. Three (3) projects are similar to the Paul VI project while another six (6) projects are active adult residential units. Although the site is not primarily an active adult development, it is anticipated that a portion of the units are likely to be sold to active adults. As shown in Attachment 2, the IDI comparable residential projects have an average parking ratio of 1.51 spaces per unit and the active adult projects have a rate of 1.31 spaces per unit.
3) The City of Fairfax have approved a parking rate of 1.6 spaces per dwelling unit
for four (4) multifamily developments, plus The Enclave project, which also provides a basis for the parking modification. A Staff Report prepared for The Enclave also provided additional analysis for the reduced rate. An excerpt of that Staff Report is attached and noted that “Staff believes that a parking ratio of 1.56 is sufficient to meet the demands of the use type given the site location and regional trends.”

3
The three elements above provide the basis for the parking modification of 1.6 spaces per unit for the Paul VI condominium building and although not directly used for the parking modification, the site’s accessibility to transit along Fairfax Boulevard would likely achieve an even lower parking rate. These transit services include:
- The City of Fairfax’s City-University Energysaver (CUE) Bus “Gold Route” along Fairfax Boulevard and Warwick Avenue provides access between the George Mason University (GMU) campus, Old Town Fairfax, the Fairfax County Judicial Center and the Vienna/Fairfax – GMU Metrorail Station. This route operates 7 days a week and stops are provided on Fairfax Boulevard just east of McLean Avenue.
- Metrobus Route 1C provides access between Fair Oaks Mall, Fairfax County Government Center, Inova Fairfax Hospital and the Dunn Loring Metrorail Station. This route operates 7 days a week and stops are provided along Fairfax Boulevard along the site frontage.
In addition, approximately 67 on-street parallel parking spaces will be available within 300 feet of the proposed residential condominium building to accommodate any short-term residential parking demands. Conclusions The conclusion of this parking review is that the parking modification for Paul VI residential condominiums to 1.6 spaces per unit is supported by the Institute of Transportation Engineers’ Parking Generation, IDI Group Companies experience at comparable locations, and the City of Fairfax’s recent approvals also for comparable locations. Transit accessibility and available of additional on-street parking also provides a basis for the modification supporting the 164 condominiums parking demands.
Attachments
1. ITE Parking Generation -LU 230 - Residential Condominium/Townhouse 2. Listing of Parking Ratios at other area IDI communities 3. Extract from Staff Report, Mantua Professional Center, City Council Meeting June 23, 2015.

Attachment 1

Attachment 2
Parking Ratios at IDI Communities
Number Parking Parking
Of Units Spaces Ratio
Communities Without Active Adult Companent
Rotunda, Tysons Corner, Virginia 1,164 1,875 1.61Montebello, Alexandria, Virginia 1,016 1,403 1.38
Average of Communities without Active Adult Component 2,180 3,278 1.50
Communities With Active Adult Component
Blue Ridge, Lansdowne, Virginia 242 308 1.27Riverbend, Lansdowne, Virginia 231 291 1.26Potomac Ridge, Lansdowne, Virginia 231 289 1.25Magnolia's, Lansdowne, Virginia 163 216 1.33Overlook, Silver Spring, Maryland 260 356 1.37Creekside, Silver Spring, Maryland 190 259 1.36The Enclave, City of Fairfax, Virginia 80 125 1.56
Average of Communities with Active Adult Component 1,397 1,844 1.32
Average All Communities 3,577 5,122 1.43
Community, Location
3/13/2018
18.0313 Other Parking Ratios
Wells + Associates, Inc.
Tysons, Virginia

City of Fairfax, Virginia City Council Public Hearing
Agenda Item # ______
City Council Meeting ______
TO: Honorable Mayor and Members of City Council
FROM: Robert Sisson, City Manager
SUBJECT: Requests by IDI-RJL Development, LLC, David Houston, agent, for a Comprehensive Plan Amendment and General Development Plan Amendment with special exceptions and variances to allow the development of 80 residential condominium units in the Mantua Professional Center at 9450 and 9464 Silver King Court.
ISSUE(S): Public hearing and City Council action on the applicant’s request for a Comprehensive Plan Amendment to change the designation of the existing Mantua Professional Center Commercial Planned Development from business-commercial to mixed-use. The applicant also requests a General Development Plan Amendment, special exceptions to the height, density, commercial ratio and parking lot landscaping requirements, and variances to private accessway widths and sidewalk requirements.
SUMMARY: The applicant proposes to modify the General Development Plan for the Mantua Professional Center by replacing approximately 55,000 square feet of approved office space with 80 residential condominiums. The proposal requires City Council approval for a Comprehensive Plan Amendment, General Development Plan Amendment, special exceptions and subdivision variances. The Planning Commission held a public hearing on June 8, 2015 and recommended approval with conditions.
FISCAL IMPACT: This proposal is projected to yield a net annual fiscal benefit to the City of approximately $176,855. Further detail is provided in the attached Staff Analysis.
RECOMMENDATION: Staff recommends approval with conditions.
ALTERNATIVE COURSE OF ACTION:
City Council may approve, approve with conditions, or deny the application.
RESPONSIBLE STAFF/POC:
Paul Nabti, Senior Planner Jason D. Sutphin, Chief, Community Development Division Brooke Hardin, Director, Community Development & Planning
COORDINATION: Community Development & Planning Fairfax Water Treasurer City Attorney Public Works Commissioner of Revenue Code Administration Police Fire Department of Parks & Recreation Human Services Historic Resources
ATTACHMENTS: Staff Report with summary of zoning districts.
8b
6/23/2015
Attachment 3

Page 12 ATTACHMENT 1
previously approved General Development Plan (GDP), this area is proposed for office development. By not encroaching development into this area, the proposed plan allows it to serve as a buffer between the commercial and residential uses. A second open space, which is intended to provide more active uses for the residents of the community, is located between the north building and Pickett Road.
Figure 1: Building orientation and open spaces
At the north end of the site, the proposed residential buildings would have a more direct impact on the buildings and site for The New School. The proposed plan includes extensive landscaping adjacent to the residential building edges that are closest to The New School, as well as improved pedestrian amenities. In addition, the applicant proposes a lot line adjustment for the three primary properties within the CPD to ensure that surface parking associated with each use is provided within the same parcel as that use. This also allows two buildings recently acquired by The New School, and their associated parking, to be incorporated to The New School site. This lot line adjustment triggers the need for a variance to parking setbacks adjacent to lot lines internal to the CDP area. Staff believes that the overall inward orientation and suburban nature of the site plan is appropriate for this site given existing context along Pickett Road and the lack of potential for future pedestrian oriented development within the immediate vicinity. Staff supports the proposed lot line adjustments as proposed in order to incorporate like uses with associated parking on the same parcel. Parking: A total of 125 parking spaces are proposed to serve the 80 residential units, a ratio of 1.56 parking spaces per unit where 2.0 parking spaces per unit are required under the current City Code. Three parking spaces that were located along the north entrance drive near the intersection of Pickett Road have been removed since the April 7 work session due to safety concerns raised by staff. Three multifamily developments have been approved in the City since 2013, each with an exception to provide a residential parking ratio of 1.60 spaces per dwelling unit. It should be noted that all three of these developments propose multifamily rentals as opposed to multifamily condominiums, and they are all generally provide fewer bedrooms per unit than the proposal subject to this application. Based on the number of bedrooms per unit, staff calculated the number

Page 13 ATTACHMENT 1
of parking spaces for this proposal that would be required by the zoning code in several peer jurisdictions, as summarized below:
Proposed Parking Spaces 125 City of Fairfax 160
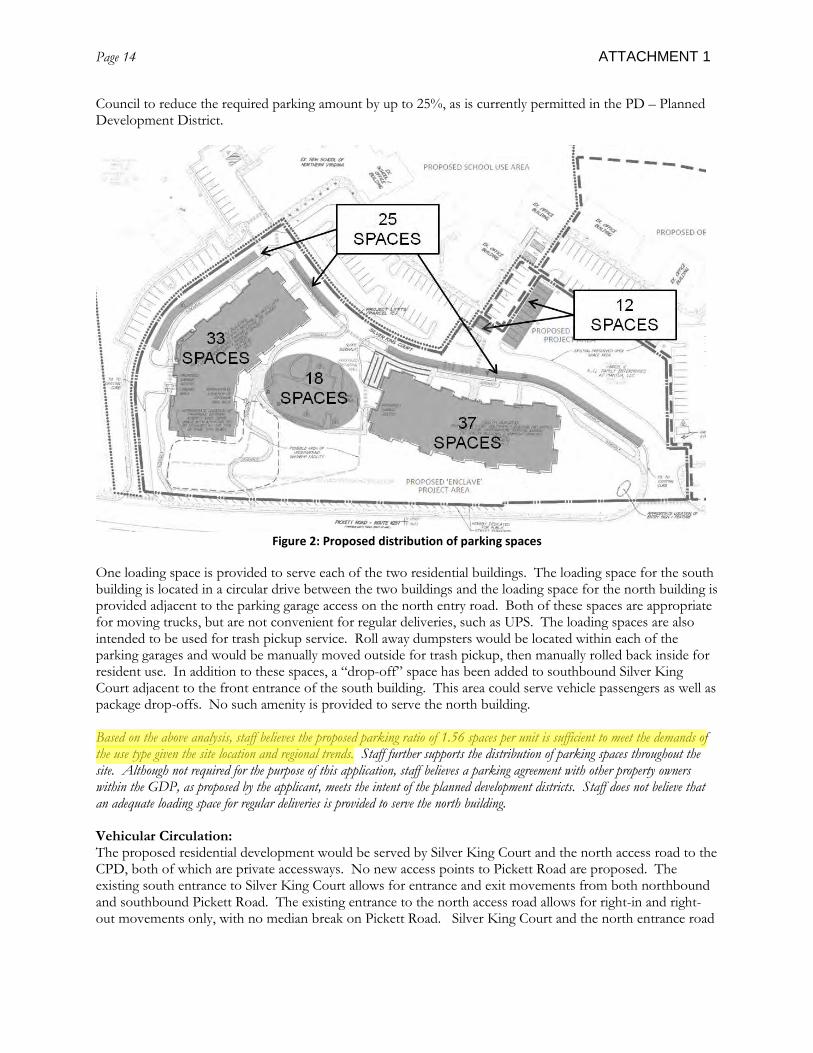
Fairfax County 128 Loudoun County 160 Montgomery County 124 City of Alexandria 140 Average Requirement 142 Staff also consulted the Institute for Transportation Engineers Parking Generation Manual – 4th Edition (ITE Manual), which provides observations on parking space demand as opposed to supply. Observed peak hour demands for condominium/townhouse developments in suburban locations are 1.52 spaces per unit at the 85th percentile. This would equate to a total of 122 parking spaces at the proposed development. Given the proximity to metro and access to CUE bus service at this site, actual demand would likely be lower than that of the 85th percentile. The applicant also proposes an agreement with the other properties within the CPD area that would not restrict some of the uses in the CPD from occupying parking spaces in other parcels of the CPD at certain times. This would allow occasional peak hour overflow from the residential buildings to utilize parking spaces in the office parcel. Peak hours for residential uses tend to occur during weekday overnight hours, whereas peak hours for commercial uses tend to occur during weekday mid-day hours. Peak hours for the school use could be expected to vary. This arrangement, however, would be dependent on continuation of existing uses on the other sites in the CPD. At this time, the language for this agreement has not been shared with staff for a comprehensive review. The applicant also requests a subdivision adjustment for the three properties in order for parking that is required for each use to be located within their respective parcel. The proposed parking spaces are distributed between single level garages below each of the buildings, a circular driveway between the two buildings, parallel on-street spaces along Silver King Court and a portion of the existing parking lot on the opposite side of Silver King Court from the south building. The number of parking spaces provided at each location is summarized in the table below and shown in Figure 2.
Location Spaces Garages 70 Circular Drive 18 Silver King Court 25 Office Parking Lot 12 Total 125
Although fewer than one space per unit is provided in the parking garages, which provide the most direct access to the units internal to the buildings, the applicant has provided parking distributions for numerous other properties in it’s portfolio that have an equal or smaller ratio of parking provided within the building containing the units they serve. This indicates that this parking ratio would be acceptable to potential buyers. Regarding parking spaces on Silver King Court, code provisions preventing on-street parking from applying toward a required parking quantity for a proposal do not apply to this application because Silver King Court is a private street. In addition, parking requirements are not subject to the general off-street parking requirements of the zoning code, such as landscaping, because they are governed by independent provisions within the CPD district. The applicant’s current parking proposal would result in a total of 267 parking spaces for the entire GDP area, including the school, offices and residential units, where 307 spaces are required under the CPD code, a 13.1% reduction. The amended text of the CPD district permits City
Page 14 ATTACHMENT 1
Council to reduce the required parking amount by up to 25%, as is currently permitted in the PD – Planned Development District.
Figure 2: Proposed distribution of parking spaces
One loading space is provided to serve each of the two residential buildings. The loading space for the south building is located in a circular drive between the two buildings and the loading space for the north building is provided adjacent to the parking garage access on the north entry road. Both of these spaces are appropriate for moving trucks, but are not convenient for regular deliveries, such as UPS. The loading spaces are also intended to be used for trash pickup service. Roll away dumpsters would be located within each of the parking garages and would be manually moved outside for trash pickup, then manually rolled back inside for resident use. In addition to these spaces, a “drop-off” space has been added to southbound Silver King Court adjacent to the front entrance of the south building. This area could serve vehicle passengers as well as package drop-offs. No such amenity is provided to serve the north building. Based on the above analysis, staff believes the proposed parking ratio of 1.56 spaces per unit is sufficient to meet the demands of the use type given the site location and regional trends. Staff further supports the distribution of parking spaces throughout the site. Although not required for the purpose of this application, staff believes a parking agreement with other property owners within the GDP, as proposed by the applicant, meets the intent of the planned development districts. Staff does not believe that an adequate loading space for regular deliveries is provided to serve the north building. Vehicular Circulation: The proposed residential development would be served by Silver King Court and the north access road to the CPD, both of which are private accessways. No new access points to Pickett Road are proposed. The existing south entrance to Silver King Court allows for entrance and exit movements from both northbound and southbound Pickett Road. The existing entrance to the north access road allows for right-in and right-out movements only, with no median break on Pickett Road. Silver King Court and the north entrance road

1420 Spring Hill Road, Suite 610, Tysons, VA 22102 703-917-6620 WellsandAssociates.com
M E M O R A N D U M
TO: Enrico C. Cecchi, IDI Group Companies
Patrick Rhodes, IDI Group Companies FROM: John J. Andrus Christopher Turnbull COPY: David Houston, Blank Rome LLP RE: Paul VI – Shared Parking Analysis Retail, Restaurant, and Community/Office Uses DATE: March 23, 2018 INTRODUCTION This memorandum presents the results of a shared parking analysis to modify the parking requirement for the commercial uses associated with the redevelopment of the Paul VI Catholic High School (Paul VI) in the City of Fairfax, Virginia. IDI Group Companies proposes to develop the site with 164 residential condominium units, 137 town homes, and a mix of retail, restaurant, and community/office uses totaling 44,000 square feet. Because parking for residential uses will not be shared, this shared parking analysis considers only the commercial uses although walking trips (internal) are anticipated. Two alternative land use scenarios for the retail, restaurant, and community/office uses are examined. Those scenarios are as follows: Scenario A - 14,000 SF Retail space
- 6,000 SF Restaurant space - 24,000 SF Community/Office space
44,000 SF Total Scenario B - 26,000 SF Retail space
- 6,000 SF Restaurant space - 12,000 SF Community/Office space
44,000 SF Total Shared parking analyses are based on data published by the Urban Land Institute (ULI), the Institute of Transportation Engineers (ITE), The City of Fairfax, and the Paul VI Master

2
M E M O R A N D U M
Development Plan by christopher consultants. The shared parking analysis prepared reviews peak weekday/weekend parking demands, taking into account seasonal, monthly, daily, and hourly variations in parking demands for each of the planned land uses. CITY OF FAIRFAX ZONING ORDINANCE REQUIREMENTS The City of Fairfax Zoning Ordinance establishes parking requirements for various land uses by providing parking rates per unit of land use (i.e., per residential dwelling unit, per 1,000 GSF of retail uses, etc.). The parking requirements for each use are:
• Retail General - One space for every 200 square feet of floor area (5 spaces/1,000 sf) • Restaurant - One space for every 200 square feet of floor area (5 spaces/1,000 sf) • Community Services/Office General - One space for every 300 square feet of floor area
(3.3 spaces/1,000 sf)
As reflected on Tables 1A and 1B, the Zoning Ordinance parking requirements for Scenario A land uses would require 180 parking spaces and Scenario B land uses would require 200 parking spaces. SHARED PARKING CONCEPT The Urban Land Institute (ULI) publication Shared Parking, 2nd edition has established a model and methodology for determining parking demands for various types and mixes of developments. This methodology is especially useful in cases such as the Paul VI redevelopment, where a single parking space may be used for retail, office, and/or restaurant uses. Because each land use within the development may experience a peak parking demand at different times of day, or different months of the year relative to the other land uses on-site, the actual peak parking demand of the entire development is typically less than if the peak parking demand of each land use was considered separately. For example, office uses tend to experience peak parking demand during late morning and early afternoon hours while restaurant uses tend to experience peak parking demand during evening hours, while retail uses experience peak demand just after the noon hour. Based on the monthly and weekday/weekend adjustment calculations, the shared parking model establishes a peak demand hour and month during which project uses parking requirements would be at their highest. In addition to the hourly, monthly, and weekday/weekend adjustment factors, the ULI model also considers parking rate modifications for alternate modes of transportation and captive market considerations, also known as internal capture.

3
M E M O R A N D U M
ALTERNATE MODES In addition to the multiple use nature of the proposed development and different peak parking demands, the site is served by the City of Fairfax’s City-University Energysaver (CUE) Bus “Gold Route” and Metro’s “Green Route”, both providing access to GMU campus, Old Town Fairfax, and the Vienna/Fairfax-GMU Metrorail station. US Census Bureau 2012-2016 American Community Survey indicates that approximately 15% of nearby residents currently use public transit. The mode share is noted as follows:
• Drive Alone: 69.3% • Carpool: 6.4% • Public Transit: 14.7% • Other: 9.6%
Total 100%
The project is anticipated to have a similar mode split when completed. A summary of this data is provided in Attachment 1.
CAPTIVE MARKET Certain land use relationships produce additional reductions in parking demand. According to ULI, “market synergy” or internal capture is typical in mixed-use developments (i.e. on-site/nearby residential users would support community-office, retail, and restaurant uses, on-site retail or community/office users would patronize restaurant uses, etc.) To quantify the reductions related to on-site synergy, the percentage of internal trips that could be expected for each land use scenario was determined based on methodologies for multi-use trip generation calculations developed by the Institute of Transportation Engineers. The multi-use trip generation analyses and the associated internal trip percentages for each land use scenario are provided in Attachments 2 and 3. Attachment 2 indicates an on-site synergy of approximately 17% for land use Scenario A and Attachment 3 indicates an on-site synergy of approximately 21% for land use Scenario B. The difference in on-site synergy is attributed to the land use differences. ULI SHARED PARKING ANALYSIS Shared parking analyses for land use Scenario A and Scenario B was conducted based on parking ratios identified in the City of Fairfax Zoning Code. ULI hourly, monthly and weekday/weekend adjustment factors to the parking demands of each of the individual land uses; a Mode Adjustment

4
M E M O R A N D U M
factor of 14%; and a Captive ratio of 17% for land use Scenario A and 20% for land use Scenario B. Refer to Tables 2A and 2B.
The Mode Adjustment factor used is consistent with U.S. Census data and the Captive (on-site synergy) ratio is based on multi-use trip generation calculations for each land use scenario as detailed above.
The results of these analyses indicate a peak weekday parking demand of 120 vehicles and a peak weekend parking demand of 69 vehicles for land use Scenario A. Similarly, the analyses indicate a peak weekday parking demand of 127 vehicles and a peak weekend parking demand of 104 vehicles for land use Scenario B. Tables 3A and 3B show the base parking ratio for each land use, the Mode Adjustment factor, the Captive Ratio, and the peak month weekday and weekend parking demand for each land use scenario.
Figures 1A and 2A show the peak month weekday and weekend parking accumulation by hour between 6 AM and 12 Mid for Scenario A land uses. Figures 1B and 2B show the peak month weekday and weekend parking accumulation by hour between 6 AM and 12 Mid for Scenario B land uses.
It is noted that the weekday and weekend parking accumulations discussed above are accumulations anticipated for the peak month during the year. Lower parking demand is anticipated during all other months of the year. Specifically, the maximum parking demand during the 2nd highest month is anticipated to be only 112 vehicles for land use Scenario A and 109 vehicles for land use Scenario B. See Tables 4A and 4B.

5
M E M O R A N D U M
CONCLUSIONS Based on the documentation provided herein, the following can be concluded:
1. The Zoning Ordinance parking requirements would require the provision of 180 to 200 parking spaces to accommodate land use scenarios considered in this analysis.
2. US Census Bureau 2012-2016 American Community Survey indicates that approximately 15% of near-by residents currently use public transit and the project is anticipated to have a similar mode split when completed.
3. Methodologies for multi-use trip generation calculations developed by the Institute of Transportation Engineers were used to determine the level of on-site synergy that could be expected for each land use scenario. The results indicate an on-site synergy of approximately 17% for land use Scenario A, 21% for land use Scenario B.
4. Considering hourly, monthly and weekday/weekend adjustment factors, mode
adjustment factor and on-site synergy adjustments, a maximum weekday parking demand of 120 vehicles and a peak weekend parking demand of 69 vehicles is anticipated for land use Scenario A.
5. Considering hourly, monthly and weekday/weekend adjustment factors, a mode adjustment factor and on-site synergy adjustments, a maximum weekday parking demand of 127 vehicles and a peak weekend parking demand of 104 vehicles is anticipated for land use Scenario B.
6. The maximum parking accumulations discussed above relate to peak month conditions. Lower parking demand is anticipated during all other months of the year. Specifically, the maximum parking demand during the other months will range from 103 to 112 vehicles for land use Scenario A and from 95 to 109 vehicles for land use Scenario B

PAUL VI SHARED PARKING ANALYSIS
LAND USE SCENARIO A
14,000 SF Retail 6,000 SF Restaurant 24,000 SF Community/Office 44,000 SF Total

Table 1AShared Parking Analysis Summary
Paul VI - Commercial/Community Uses (1)
Land Use Amount Units Parking Spaces
Demand (No Shared Parking)
Retail (1) 14,000 S.F.
Restaurant (Fine/Casual Dining) 6,000 S.F.
Community Use/Office 24,000 S.F.
Total 44,000 S.F.
Shared Parking Demand (Peak Month - Late Dec) Weekday Weekend
Retail 47 50
Restaurant (Fine/Casual Dining) 15 12
Community Use/Office 58 7
Total Shared Spaces 120 69
Savings Due to Sharing (60) (111)
Percent Saved -33% -62%
Parking Supply 140 140
Extra Spaces (Supply - Demand) 20 71
Notes:
(1)
70
30
80
180
City of Fairfax Base Rates Used With a 14% Mode Split Adjustment and a 17% On-Site Synergy Adjustment based on ITE Internal Trip Analysis (See Attachment 2).
3/23/201818.0321 Paul VI Shared Parking- Land Use Scenario A
Wells + Associates, Inc.Tysons, Virginia

Table 2A
Parking Required Without Sharing
Paul VI - Commercial/Community Uses
Demand Weekday Weekend Weekday Weekend
Land Use Quantity Weekday Weekend Daytime Evening Daytime Evening Daytime Evening Daytime Evening
Retail 14,000 sf GLA 60 59 86% 86% 86% 86% 83.0% 83.0% 83.0% 83.0%
Employee 10 11 86% 86% 86% 86% 83.0% 83.0% 83.0% 83.0%
Fine/Casual Dining Restaurant 6,000 sf GLA 26 25 86% 86% 86% 86% 83.0% 83.0% 83.0% 83.0%
Employee 4 5 86% 86% 86% 86% 83.0% 83.0% 83.0% 83.0%
Community Use/Office 24,000 sf GLA 5 1 86% 86% 86% 86% 100.0% 100.0% 100.0% 100.0%
Employee 75 8 86% 86% 86% 86% 100.0% 100.0% 100.0% 100.0%
Subtotal Customer/Guest Spaces 91 85
Subtotal Employee/Resident Spaces 89 24
Total Parking Spaces 180 109
Mode Adjustment Noncaptive Ratio
3/22/201818.0321 Paul VI Shared Parking- Land Use Scenario A
Wells+Associates, Inc.Tysons, Virginia
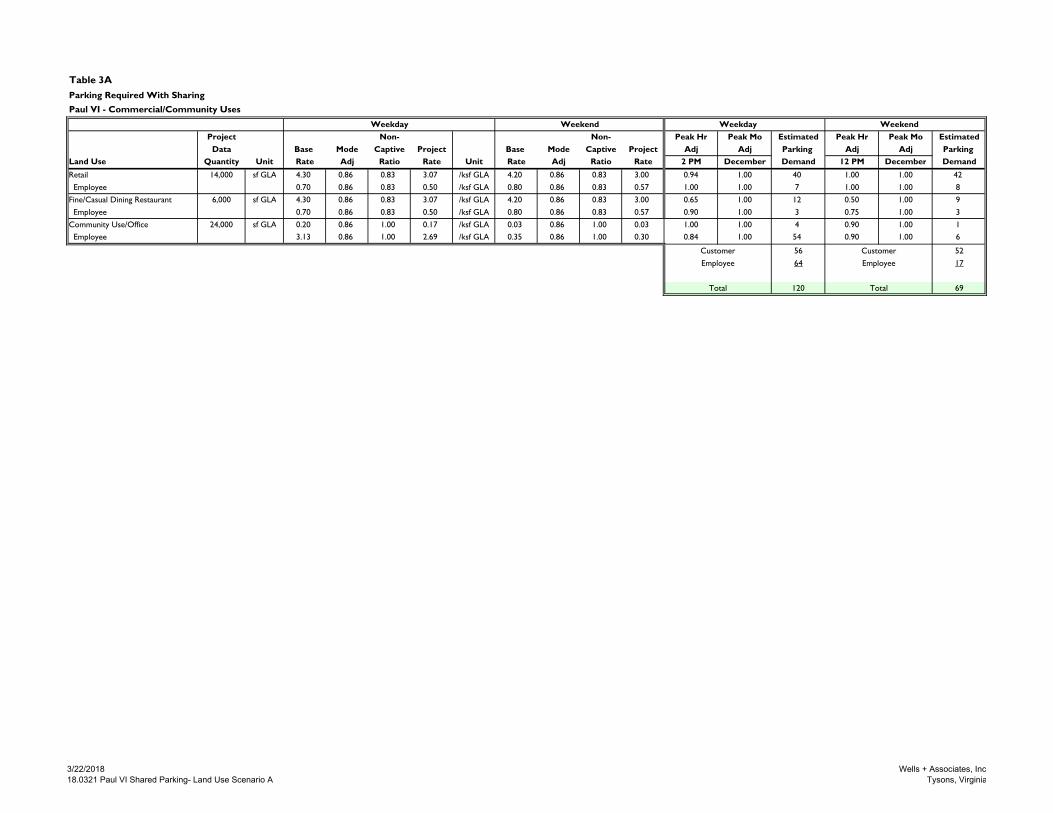
Table 3A
Parking Required With Sharing
Paul VI - Commercial/Community Uses
Weekday Weekend Weekday Weekend
Project Non- Non- Peak Hr Peak Mo Estimated Peak Hr Peak Mo Estimated
Data Base Mode Captive Project Base Mode Captive Project Adj Adj Parking Adj Adj Parking
Land Use Quantity Unit Rate Adj Ratio Rate Unit Rate Adj Ratio Rate 2 PM December Demand 12 PM December Demand
Retail 14,000 sf GLA 4.30 0.86 0.83 3.07 /ksf GLA 4.20 0.86 0.83 3.00 0.94 1.00 40 1.00 1.00 42
Employee 0.70 0.86 0.83 0.50 /ksf GLA 0.80 0.86 0.83 0.57 1.00 1.00 7 1.00 1.00 8
Fine/Casual Dining Restaurant 6,000 sf GLA 4.30 0.86 0.83 3.07 /ksf GLA 4.20 0.86 0.83 3.00 0.65 1.00 12 0.50 1.00 9
Employee 0.70 0.86 0.83 0.50 /ksf GLA 0.80 0.86 0.83 0.57 0.90 1.00 3 0.75 1.00 3
Community Use/Office 24,000 sf GLA 0.20 0.86 1.00 0.17 /ksf GLA 0.03 0.86 1.00 0.03 1.00 1.00 4 0.90 1.00 1
Employee 3.13 0.86 1.00 2.69 /ksf GLA 0.35 0.86 1.00 0.30 0.84 1.00 54 0.90 1.00 6
Customer 56 Customer 52
Employee 64 Employee 17
Total 120 Total 69
3/22/201818.0321 Paul VI Shared Parking- Land Use Scenario A
Wells + Associates, IncTysons, Virginia

Table 4A
Shared Parking Demand By MonthPaul VI - Commercial/Community Uses
Month Weekday Weekend
January 103 48
February 103 48
March 108 52
April 108 52
May 109 53
June 110 53
July 107 52
August 109 54
September 108 52
October 109 53
November 112 56December 120 69
3/22/201818.0321 Paul VI Shared Parking- Land Use Scenario A
Wells + Associates, Inc.Tysons, Virginia

6:00AM
7:00AM
8:00AM
9:00AM
10:00AM
11:00AM
12:00PM
1:00PM
2:00PM
3:00PM
4:00PM
5:00PM
6:00PM
7:00PM
8:00PM
9:00PM
10:00PM
11:00PM
12:00AM
Community Use/Office 2 38 52 64 69 65 59 52 58 54 47 30 16 6 5 2 1 0 0
Restaurant 0 1 1 2 6 10 17 17 15 9 11 17 21 22 22 22 21 16 6
Retail 1 5 10 29 30 43 43 43 47 46 42 47 50 47 47 42 9 3 0
0
50
100
150
200
Par
kin
g S
pac
es
Figure 1APaul VI Commercial and Community Uses
Weekday Hourly Parking Needs
Community Use/Office
Restaurant
Retail
Total 3 12011211911744 10563 95 109 100 94 87 75 74 66 31 19 6
Maximum Parking Accumulation= 120 Vehicles at 2:00 PM

6:00AM
7:00AM
8:00AM
9:00AM
10:00AM
11:00AM
12:00PM
1:00PM
2:00PM
3:00PM
4:00PM
5:00PM
6:00PM
7:00PM
8:00PM
9:00PM
10:00PM
11:00PM
12:00AM
Community Use/Office 0 1 5 7 7 8 7 7 5 3 1 1 0 0 0 0 0 0 0
Restaurant 0 1 1 2 3 6 12 13 11 11 11 15 20 21 22 20 20 19 11
Retail 1 3 19 35 39 46 50 48 49 48 45 42 37 31 27 18 12 5 0
0
50
100
150
200
Par
kin
g S
pac
es
Figure 2APaul VI Commercial and Community Uses
Weekend Hourly Parking Needs
Community Use/Office
Restaurant
Retail
Total 1 656869605 4925 44 62 57 58 57 52 49 38 32 24 11
Maximum Parking Accumulation= 69 Vehicles at 12:00 Noon

PAUL VI SHARED PARKING ANALYSIS
LAND USE SCENARIO B
26,000 SF Retail 6,000 SF Restaurant 12,000 SF Community/Office 44,000 SF Total

Table 1BShared Parking Analysis Summary
Paul VI - Commercial/Community Uses (1)
Land Use Amount Units Parking Spaces
Demand (No Shared Parking)
Retail (1) 26,000 S.F.
Restaurant (Fine/Casual Dining) 6,000 S.F.
Community Use/Office 12,000 S.F.
Total 44,000 S.F.
Shared Parking Demand (Peak Month - Late Dec) Weekday Weekend
Retail 84 89
Restaurant (Fine/Casual Dining) 14 12
Community Use/Office 29 3
Total Shared Spaces 127 104
Savings Due to Sharing (73) (96)
Percent Saved -37% -48%
Parking Supply 140 140
Extra Spaces (Supply - Demand) 13 36
Notes:
(1)
130
30
40
200
City of Fairfax Base Rates Used With a 14% Mode Split Adjustment and a 20% On-Site Synergy Adjustment based on ITE Internal Trip Analysis (See Attachment 3).
3/23/201818.0321 Paul VI Shared Parking- Land Use Scenario B
Wells + Associates, Inc.Tysons, Virginia

Table 2B
Parking Required Without Sharing
Paul VI - Commercial/Community Uses
Demand Weekday Weekend Weekday Weekend
Land Use Quantity Weekday Weekend Daytime Evening Daytime Evening Daytime Evening Daytime Evening
Retail 26,000 sf GLA 112 109 86% 86% 86% 86% 80.0% 80.0% 80.0% 80.0%
Employee 18 21 86% 86% 86% 86% 80.0% 80.0% 80.0% 80.0%
Fine/Casual Dining Restaurant 6,000 sf GLA 26 25 86% 86% 86% 86% 80.0% 80.0% 80.0% 80.0%
Employee 4 5 86% 86% 86% 86% 80.0% 80.0% 80.0% 80.0%
Community Use/Office 12,000 sf GLA 2 0 86% 86% 86% 86% 100.0% 100.0% 100.0% 100.0%
Employee 38 4 86% 86% 86% 86% 100.0% 100.0% 100.0% 100.0%
Subtotal Customer/Guest Spaces 140 134
Subtotal Employee/Resident Spaces 60 30
Total Parking Spaces 200 164
Mode Adjustment Noncaptive Ratio
3/22/201818.0321 Paul VI Shared Parking- Land Use Scenario B
Wells+Associates, Inc.Tysons, Virginia

Table 3B
Parking Required With Sharing
Paul VI - Commercial/Community Uses
Weekday Weekend Weekday Weekend
Project Non- Non- Peak Hr Peak Mo Estimated Peak Hr Peak Mo Estimated
Data Base Mode Captive Project Base Mode Captive Project Adj Adj Parking Adj Adj Parking
Land Use Quantity Unit Rate Adj Ratio Rate Unit Rate Adj Ratio Rate 2 PM December Demand 12 PM December Demand
Retail 26,000 sf GLA 4.30 0.86 0.80 2.96 /ksf GLA 4.20 0.86 0.80 2.89 0.94 1.00 72 1.00 1.00 75
Employee 0.70 0.86 0.80 0.48 /ksf GLA 0.80 0.86 0.80 0.55 1.00 1.00 12 1.00 1.00 14
Fine/Casual Dining Restaurant 6,000 sf GLA 4.30 0.86 0.80 2.96 /ksf GLA 4.20 0.86 0.80 2.89 0.65 1.00 12 0.50 1.00 9
Employee 0.70 0.86 0.80 0.48 /ksf GLA 0.80 0.86 0.80 0.55 0.90 1.00 2 0.75 1.00 3
Community Use/Office 12,000 sf GLA 0.20 0.86 1.00 0.17 /ksf GLA 0.03 0.86 1.00 0.03 1.00 1.00 2 0.90 1.00 0
Employee 3.13 0.86 1.00 2.69 /ksf GLA 0.35 0.86 1.00 0.30 0.84 1.00 27 0.90 1.00 3
Customer 86 Customer 84
Employee 41 Employee 20
Total 127 Total 104
3/22/201818.0321 Paul VI Shared Parking- Land Use Scenario B
Wells + Associates, IncTysons, Virginia

Table 4B
Shared Parking Demand By MonthPaul VI - Commercial/Community Uses
Month Weekday Weekend
January 95 67
February 97 68
March 103 75
April 102 74
May 105 77
June 106 78
July 102 75
August 106 79
September 102 75
October 105 76
November 109 82December 127 104
3/22/201818.0321 Paul VI Shared Parking- Land Use Scenario B
Wells + Associates, Inc.Tysons, Virginia

6:00AM
7:00AM
8:00AM
9:00AM
10:00AM
11:00AM
12:00PM
1:00PM
2:00PM
3:00PM
4:00PM
5:00PM
6:00PM
7:00PM
8:00PM
9:00PM
10:00PM
11:00PM
12:00AM
Community Use/Office 1 19 26 32 35 33 29 26 29 27 24 15 8 3 2 1 0 0 0
Restaurant 0 1 1 2 5 9 15 15 14 9 11 16 20 21 21 21 20 15 5
Retail 2 9 17 51 55 77 77 76 84 81 74 84 89 84 85 76 17 6 0
0
50
100
150
200
Par
kin
g S
pac
es
Figure 1BPaul VI Commercial and Community Uses
Weekday Hourly Parking Needs
Community Use/Office
Restaurant
Retail
Total 3 12711712111929 9544 84 117 109 115 117 108 108 98 37 21 5
Maximum Parking Accumulation= 127 Vehicles at 2:00 PM

6:00AM
7:00AM
8:00AM
9:00AM
10:00AM
11:00AM
12:00PM
1:00PM
2:00PM
3:00PM
4:00PM
5:00PM
6:00PM
7:00PM
8:00PM
9:00PM
10:00PM
11:00PM
12:00AM
Community Use/Office 0 1 2 3 3 3 3 3 2 1 1 0 0 0 0 0 0 0 0
Restaurant 0 1 1 2 3 6 12 12 11 11 11 13 18 19 20 18 18 18 11
Retail 2 6 35 62 70 84 89 84 87 86 81 76 66 57 48 31 22 9 0
0
50
100
150
200
Par
kin
g S
pac
es
Figure 2BPaul VI Commercial and Community Uses
Weekend Hourly Parking Needs
Community Use/Office
Restaurant
Retail
Total 2 10099104938 7638 67 98 93 89 84 76 68 49 30 27 11
Maximum Parking Accumulation= 104 Vehicles at 12:00 Noon

ATTACHMENT 1
US Census Bureau Data

Attachment 1Mode Adjustment Calculations
Number ofUS Census Data (2016 - 5-year estimates) Households Percent
Census Tract 3001, Fairfax City, Virginia
Drive Alone 1,961 69.8%Carpool 181 6.4%
Public Transit 413 14.7%Other 255 9.1%
TOTAL 2,810 100.0%
3/22/201818.0321 Paul VI Shared Parking Analysis
Wells+Associates, Inc.Tysons, Virginia


ATTACHMENT 2
Multi-Use Trip Generation Analysis Land Use Scenario A

Attachment 2Paul VI Redevelopment
Site Trip Generation Analysis (Program Change Comparison)
In Out Total In Out Total
Condominiums 232 164 DU 14 62 76 44 27 71 842Townhomes 230 137 DU 11 55 66 52 26 78 846
Community Center 495 24,000 SF 32 17 49 32 34 66 812Restaurant 931 6,000 SF 2 3 5 30 15 45 540Local Serving Retail 820 14,000 SF 8 5 13 77 83 160 1,892
Total Trips 67 142 209 235 185 420 4,932
Total Residential Trips 25 117 142 96 53 149 1,688Total Commercial Trips 10 8 18 107 98 205 2,432Internal Trips ‐3 ‐3 ‐6 ‐51 ‐51 ‐102 ‐740Internal Percent 2 2.9% 24.3% 17.2%Total Community Center Trips 32 17 49 32 34 66 812
64 139 203 184 134 318 4,192
Notes: 1. Institute of Transportation Engineer's (ITE), Trip Generation Manual, 9th Edition
2.Daily Internal Percentage is Weighted Average and AM and PM Internal Percentages.
Total External Trips
AM Peak Hour PM Peak HourAverage
Daily Trips
Development ITE Land
Use Code1Amount Units
3/22/2018
18.0312 ‐ Internal Calculations ‐ Land Use Scenario A
Wells + Associates, Inc.
Tysons, Virginia

ATTACHMENT 2Analyst JJA MULTI-USE DEVELOPMENT Job Number
Date 14-Mar-18 TRIP GENERATION Time Period
AND INTERNAL CAPTURE SUMMARY
Residential RetailITE LU Code ITE LU Code
Size 301 DU Balanced Size 14000 SFTotal Internal External 2% 1 1 14% 1 Total Internal External
Enter 25 1 24 Enter 8 2 6Exit 117 2 115 Exit 5 1 4Total 142 2 140 1% 1 1 17% 1 Total 13 3 10% 2% 98% Balanced % 21% 79%
13% 1
Balanced1% 1 1
Balanced20% 23 5% 1 0 50% 1 1% 0 1% 0
1% 01% 0
20% 0 4% 0 Balanced 1% 0 1% 08% 1 0
Balanced0 1% 0
Restaurant 14% 0 LAND USE DITE LU Code ITE LU Code
Size 6,000 SF Balanced SizeTotal Internal External 1% 0 0 1% 0 Total Internal External
Enter 2 1 1 Enter 0 0 0Exit 3 1 2 Exit 0 0 0Total 5 2 3 1% 0 0 1% 0 Total 0 0 0% 32% 68% Balanced %
6709
AM Peak
230 & 232 820Demand Demand
Demand DemandDemand
Demand
Demand Demand Demand Demand
Balanced Balanced Demand Balanced Balanced
Demand
931 x
0 0 Demand 0 0
Demand Demand Demand DemandDemand
Demand
Demand
Demand Demand x
Demand Demand

ATTACHMENT 2Analyst JJA MULTI-USE DEVELOPMENT Job Number
Date 14-Mar-18 TRIP GENERATION Time Period
AND INTERNAL CAPTURE SUMMARY
Residential RetailITE LU Code ITE LU Code
Size 301 DU Balanced Size 14,000 SFTotal Internal External 46% 44 22 26% 22 Total Internal External
Enter 96 24 72 Enter 77 14 63Exit 53 12 41 Exit 83 30 53Total 149 36 113 42% 22 8 10% 8 Total 160 44 116% 24% 76% Balanced % 28% 72%
29% 24
Balanced1% 1 9
Balanced21% 11 16% 15 0 29% 9 1% 1 1% 1
1% 01% 1
14% 4 18% 3 Balanced 1% 0 1% 050% 39 0
Balanced6 1% 0
Restaurant 41% 6 LAND USE DITE LU Code ITE LU Code
Size 6,000 SF Balanced SizeTotal Internal External 1% 0 0 1% 0 Total Internal External
Enter 30 13 17 Enter 0 0 0Exit 15 9 6 Exit 0 0 0Total 45 22 23 1% 0 0 1% 0 Total 0 0 0% 48% 52% Balanced %
6709
PM PEAK
230 & 232 820Demand Demand
Demand DemandDemand
Demand
Demand Demand Demand Demand
Balanced Balanced Demand Balanced Balanced
Demand
931 x
4 3 Demand 0 0
Demand Demand Demand DemandDemand
Demand
Demand
Demand Demand x
Demand Demand

ATTACHMENT 3
Multi-Use Trip Generation Analysis Land Use Scenario B

Attachment 3Paul VI Redevelopment
Site Trip Generation Analysis (Program Change Comparison)
In Out Total In Out Total
Condominiums 232 164 DU 14 62 76 44 27 71 842Townhomes 230 137 DU 11 55 66 52 26 78 846
Community Center 495 12,000 SF 17 8 25 16 17 33 406Restaurant 931 6,000 SF 2 3 5 30 15 45 540Local Serving Retail 820 26,000 SF 16 9 25 117 126 243 2,829
Total Trips 60 137 197 259 211 470 5,463
Total Residential Trips 25 117 142 96 53 149 1,688Total Commercial Trips 18 12 30 147 141 288 3,369Internal Trips ‐4 ‐4 ‐8 ‐66 ‐66 ‐132 ‐819Internal Percent2 4.1% 28.1% 21.0%Total Community Center Trips 17 8 25 16 17 33 406
56 133 189 193 145 338 4,644
Notes: 1. Institute of Transportation Engineer's (ITE), Trip Generation Manual, 9th Edition
2.Daily Internal Percentage is Weighted Average and AM and PM Internal Percentages.
Development ITE Land
Use Code1Amount Units
AM Peak Hour PM Peak HourAverage
Daily Trips
Total External Trips
3/22/2018
18.0312 ‐ Internal Calculations ‐ Land Use Scenario B
Wells + Associates, Inc.
Tysons, Virginia

ATTACHMENT 3Analyst JJA MULTI-USE DEVELOPMENT Job Number
Date 14-Mar-18 TRIP GENERATION Time Period
AND INTERNAL CAPTURE SUMMARY
Residential RetailITE LU Code ITE LU Code
Size 301 DU Balanced Size 26,000 SFTotal Internal External 2% 1 1 14% 1 Total Internal External
Enter 25 1 24 Enter 16 2 14Exit 117 2 115 Exit 9 2 8Total 142 2 140 1% 1 1 17% 3 Total 25 3 22% 2% 98% Balanced % 12% 88%
13% 1
Balanced1% 1 1
Balanced20% 23 5% 1 0 50% 1 1% 0 1% 0
1% 01% 0
20% 0 4% 0 Balanced 1% 0 1% 08% 1 0
Balanced0 1% 0
Restaurant 14% 0 LAND USE DITE LU Code ITE LU Code
Size 6,000 SF Balanced Size xTotal Internal External 1% 0 0 1% 0 Total Internal External
Enter 2 1 1 Enter 0 0 0Exit 3 1 2 Exit 0 0 0Total 5 2 3 1% 0 0 1% 0 Total 0 0 0% 39% 61% Balanced %
Demand Demand
Demand Demand
931 x
0 0 Demand 0 0
Demand Demand Demand DemandDemand
Demand
Demand
Balanced Balanced Demand Balanced Balanced
Demand
Demand Demand Demand DemandDemand
Demand Demand
Demand DemandDemand
6709
AM Peak
230 & 232 820

ATTACHMENT 3Analyst JJA MULTI-USE DEVELOPMENT Job Number
Date 14-Mar-18 TRIP GENERATION Time Period
AND INTERNAL CAPTURE SUMMARY
Residential RetailITE LU Code ITE LU Code
Size 301 DU Balanced Size 26,000 SFTotal Internal External 46% 44 33 26% 33 Total Internal External
Enter 96 35 61 Enter 117 18 99Exit 53 16 37 Exit 126 41 85Total 149 51 98 42% 22 12 10% 12 Total 243 59 184% 34% 66% Balanced % 24% 76%
29% 37
Balanced1% 1 9
Balanced21% 11 16% 15 0 29% 9 1% 1 1% 1
1% 01% 1
14% 4 18% 3 Balanced 1% 0 1% 050% 59 0
Balanced6 1% 0
Restaurant 41% 6 LAND USE DITE LU Code ITE LU Code
Size 6,000 SF Balanced Size xTotal Internal External 1% 0 0 1% 0 Total Internal External
Enter 30 13 17 Enter 0 0 0Exit 15 9 6 Exit 0 0 0Total 45 22 23 1% 0 0 1% 0 Total 0 0 0% 48% 52% Balanced %
Demand Demand
Demand Demand
931 x
4 3 Demand 0 0
Demand Demand Demand DemandDemand
Demand
Demand
Balanced Balanced Demand Balanced Balanced
Demand
Demand Demand Demand DemandDemand
Demand Demand
Demand DemandDemand
6709
PM PEAK
230 & 232 820

Fiscal Impact Estimate - Paul VI Redevelopment SUMMARY
Existing
Potential
Redevelopment
LOW
Potential
Redevelopment
HIGH
RESIDENTIAL REVENUES
Real Estate Tax $1,716,000 $1,910,000BPOL (Rental Tax) $0 $0Personal Property Tax $240,000 $266,000Retail Sales Tax (1%) $21,000 $23,000Restaurant Tax (1% + 4%) $23,000 $25,000TOTAL $2,000,000 $2,224,000
RESIDENTIAL EXPENSES
Education $592,000 $654,000Police/Fire $290,000 $320,000Misc. Gov't $452,000 $500,000TOTAL $1,334,000 $1,474,000
COMMERCIAL REVENUES
Real Estate Tax $105,000 $128,000BPOL (Rental Tax) $1,000 $1,000Retail Sales Tax (1%) $46,000 $53,000Restaurant Tax (4%) $76,000 $88,000(Less ⅛ resident spending) ($6,000) ($6,000)Retail/Restaurant BPOL/BPP $14,000 $16,000Office BPOL/BPP $4,000 $4,000TOTAL $240,000 $284,000
COMMERCIAL EXPENSES
Police/Fire $145,000 $14,000 $16,000Misc. Gov't $155,000 $15,000 $17,000TOTAL $300,000 $29,000 $33,000
BALANCE ($300,000) $733,000 $1,145,000
Note: All figures rounded. Page 1

Fiscal Impact Estimate - Paul VI Redevelopment Real Estate
REAL ESTATE RELATED REVENUES (RESIDENTIAL)
Real Estate Tax
Proposed Development# of
Units
Value/Unit
LOW
Value/Unit
HIGH
Total Value
LOW
Total Value
HIGH
Tax
Rate
Tax
Receipts
LOW
Tax
Receipts
HIGH
Townhomes 137 $710,000 $790,000 $97,270,000 $108,230,000 $1.060 $1,031,062 $1,147,238Condominiums 164 $394,000 $439,000 $64,616,000 $71,996,000 $1.060 $684,930 $763,158 0 $0 $0 $0 $0 $1.060 $0 $0 0 $0 $0 $0 $0 $1.060 $0 $0
TOTAL (rounded) 301 $161,886,000 $180,226,000 $1.060 $1,716,000 $1,910,000
Business Privilege Tax (on Apartment Rental Income)
Proposed Development# of
Units
Per Unit
Mo. Rent
LOW
Per Unit
Mo. Rent
HIGH
Total
Ann. Rent
LOW
Total
Ann. Rent
HIGH
Tax
Rate
Tax
Receipts
LOW
Tax
Receipts
HIGH
Townhomes 137
Condominiums 164
0 $0 $0 $0 $0 0.5% $0 $0 0 $0 $0 $0 $0 0.5% $0 $0
TOTAL (rounded) 301 $0 $0 0.5% $0 $0
Page 2

Fiscal Impact Estimate - Paul VI Redevelopment Personal Property and Retail Tax Revenues
VEHICLE & RETAIL/RESTAURANT EXPENDITURE REVENUES (RESIDENTIAL)
Vehicle Property Tax & License Fee
Development FY14 Adopted Total City HH's Per Capita New Units Revenue
Townhomes $7,599,000 9,000 $840 137 $115,000
Condominiums $7,599,000 9,000 $840 164 $138,000
$0 0 $0 0 $0
$0 0 $0 0 $0
TOTAL (rounded) 301 $253,000
Retail/Restaurant Taxes
CDP Est. of Avg. % income on Per Cap Retail % spent in $ spent in Total Retail Tax TaxHH Income Retail Expenditures City City Expenditures Rate Receipts
Townhomes $105,297 20% $21,059 40% $8,424 $1,154,055 1% $12,000
Condominiums $78,973 20% $15,795 40% $6,318 $1,036,122 1% $10,000
$0 0% $0 0% $0 $0 1% $0
$0 0% $0 0% $0 $0 1% $0
TOTAL (rounded) $2,190,178 $22,000
CDP Est. of Avg. % income on Per Cap Rest. % spent in $ spent in Total Retail Tax TaxHH Income Restaurants Expenditures City City Expenditures Rate Receipts
Townhomes $105,297 5% $5,265 35% $1,843 $252,450 5% $13,000
Condominiums $78,973 5% $3,949 35% $1,382 $226,652 5% $11,000
$0 0% $0 0% $0 $0 5% $0
$0 0% $0 0% $0 $0 5% $0
TOTAL (rounded) $479,101 $24,000
Development
Development
Page 3

Fiscal Impact Estimate - Paul VI Redevelopment Residential Expense Estimates
ESTIMATED EXPENSES (RESIDENTIAL)
City Government Expenses% FY 18 Per Capita for For
Applic. to Residential 9,000 301Residential Expenditures Units Units
General Government $13,184,938 30% $3,955,481 $439 $132,289Police $11,427,922 40% $4,571,169 $508 $152,880Fire $11,376,481 40% $4,550,592 $506 $152,192Public Works (n/incl refuse) $4,093,231 30% $1,227,969 $136 $41,069Social Services $5,564,184 80% $4,451,347 $495 $148,873Culture and Recreation $4,733,095 90% $4,259,786 $473 $142,466Planning and Development $2,204,657 15% $330,699 $37 $11,060Education $45,358,560 100% $623,196TOTAL $97,943,068 $1,404,025
Education worksheet
Unit Type HU's Yield Ratio StudentsCost per
StudentCost
Townhouse 137 0.220 30
Apartment, all units 0 0.123 0Apartment, 2+ br. units ONLY 0 0.274 0Multifamily, all units FCPS 0 0.100 0Apartment (Avg. of Above) #DIV/0! 0
Condo, all units 164 0.062 10Condo, 2+ br. units ONLY 93 0.137 13Multifamily, all units FCPS 164 0.075 12Condo (Avg. of Above) 0.073 12
TOTAL OF ABOVE 42 $14,838 $623,196
City Cost Center
FY 18
Net
Cost to City
Page 4

Fiscal Impact Estimate - Paul VI Redevelopment Retail/Office Addendum
REAL ESTATE RELATED REVENUES (COMMERCIAL)
Real Estate Tax
Proposed DevelopmentSq.
Ft.
Value/Sq. Ft.
LOW
Value/Unit
HIGH
Total Value
LOW
Total Value
HIGH
Tax
Rate
Tax
Receipts
LOW
Tax
Receipts
HIGH
Retail 20,000 $450 $550 $9,000,000 $11,000,000 $1.165 $104,850 $128,150Community Use 24,000 $0 $0 $0 $0 $1.165 $0 $0
TOTAL (rounded) 44,000 $9,000,000 $11,000,000 $1.165 $105,000 $128,000
Business Privilege Tax (on Commercial Rental Income)
Proposed DevelopmentSq.
Ft.
Per Sq. Ft.
Ann. Rent
LOW
Per Sq. Ft.
Ann. Rent
HIGH
Total
Ann. Rent
LOW
Total
Ann. Rent
HIGH
Tax
Rate
Tax
Receipts
LOW
Tax
Receipts
HIGH
Retail 20,000 $20 $30 $400,000 $600,000 0.23% $920 $1,380Community Use 24,000 $0 $0 $0 $0 0.23% $0 $0
TOTAL (rounded) 44,000 $400,000 $600,000 0.23% $1,000 $1,000
Page 5

Fiscal Impact Estimate - Davies Property Paul VI Redevelopment Retail/Office Addendum
SALES, BPOL & BPP TAX REVENUES (COMMERCIAL)
GENERAL RETAIL/OFFICE SPACE
ComponentCommercial
SF
Retail
SF
Restaurant
SF
Office
SF
Commercial Space 20,000Retail 8,000 8,000Restaurant 10,000 10,000Office 2,000 2,000
TOTAL 20,000 8,000 10,000 2,000
RETAIL/RESTAURANT -- ESTIMATES OF FUTURE SALES
ComponentRetail
SF
Est.
Sales/SF
EST.
SALES
Restaurant
SF
Est.
Sales/SF
EST.
SALES
Retail
Tax
Rate
Meals
Retail
Tax
Revenue
Meals
Retail 8,000 $350 $2,800,000 1% 4% $28,000 $0Restaurant 5,000 $400 $2,000,000 1% 4% $20,000 $80,000
TOTAL 8,000 $2,800,000 5,000 $2,000,000 $48,000 $80,000
100%
Estimated
Component
40%50%10%
Page 6

Fiscal Impact Estimate - Davies Property Paul VI Redevelopment Retail/Office Addendum
RETAIL/RESTAURANT -- ESTIMATES OF FUTURE BPOL AND BPP
Component
Retail &
Restaurant
SF
Est.
BPOL
per SF
EST.
BPOL
Est. BPP
per SF
EST.
BPP
Retail 8,000 $0.63 $5,000 $0.20 $1,600Restaurant 10,000 $0.63 $6,300 $0.20 $2,000
TOTAL 18,000 $11,300 $3,600
OFFICE -- ESTIMATES OF FUTURE BPOL AND BPP
ComponentOffice
SF
Est.
BPOL
per SF
EST.
BPOL
Est. BPP
per SF
EST.
BPP
Office 2,000 $1.63 $3,300 $0.24 $500
TOTAL 2,000 $3,300 $500
Page 7

Fiscal Impact Estimate - Paul VI Redevelopment Retail/Office Addendum
ESTIMATED EXPENSES
City Government Expenses (Commercial)
% FY 18 Expenses for For
Applic. to Commercial 1,000 20,000
Commercial Expenditures Sq. Ft. Sq. Ft.
General Government $13,184,938 35% $4,614,728 $513 $10,255Police $11,427,922 30% $3,428,377 $381 $7,619Fire $11,376,481 30% $3,412,944 $379 $7,584Public Works $4,093,231 25% $1,023,308 $114 $2,274Social Services $5,564,184 10% $556,418 $62 $1,236Culture and Recreation $4,733,095 5% $236,655 $26 $526Planning and Development $2,204,657 40% $881,863 $98 $1,960Education $45,358,560 0% $0TOTAL $97,943,068 $31,000
based on: 9,000,000 sq. ft. total Commercial space in City
FY 18
Net
Cost to City
Page 8

Fiscal Impact Estimate - Paul VI Redevelopment Existing
ESTIMATED EXPENSES
City Government Expenses (Commercial)
% FY 18 Expenses for ForApplic. to Commercial 1,000 190,532
Commercial Expenditures Sq. Ft. Sq. Ft.General Government $13,184,938 35% $4,614,728 $513 $97,695Police $11,427,922 30% $3,428,377 $381 $72,579Fire $11,376,481 30% $3,412,944 $379 $72,253Public Works $4,093,231 25% $1,023,308 $114 $21,664Social Services $5,564,184 10% $556,418 $62 $11,780Culture and Recreation $4,733,095 5% $236,655 $26 $5,010Planning and Development $2,204,657 40% $881,863 $98 $18,669Education $45,358,560 0% $0TOTAL $97,943,068 $300,000
based on: 9,000,000 sq. ft. total Commercial space in City
Real Estate Tax
Existing Use Sq. Ft.
Est. Assessed
Value of
Complex
Tax Rate Tax Receipts
School 190,532 $27,398,000 $0.000 $0 TOTAL 190,532 $27,398,000 $0.000 $0
FY 18
Net
Cost to City
Page 9

Paul VI Condo Proposal
Unit #Low Est.
per Unit
High Est.
per Unit
Low
Total
High
Total1-bedroom 71 $320,000 $360,000 $22,720,000 $25,560,0002-bedroom 93 $450,000 $500,000 $41,850,000 $46,500,000TOTAL 164 $393,720 $439,390 $64,570,000 $72,060,000
rounded $394,000 $439,000 $64,616,000 $71,996,000
109116122