to illuminate or not to illuminate: roadway lighting as it ... · speed indicator* (1 = 50 mph or...
TRANSCRIPT

© 2013 Rensselaer Polytechnic Institute and Pennsylvania State University. All rights reserved.
To Illuminate or Not to Illuminate: Roadway Lighting as
It Affects Traffic Safety at Intersections
April 2, 2013
Mark ReaLighting Research Center
Rensselaer Polytechnic Institute
Eric DonnellDept. of Civil and
Environmental Engineering Pennsylvania State
University
John BulloughLighting Research Center
Rensselaer Polytechnic Institute
© 2013 Rensselaer Polytechnic Institute and Pennsylvania State University. All rights reserved.
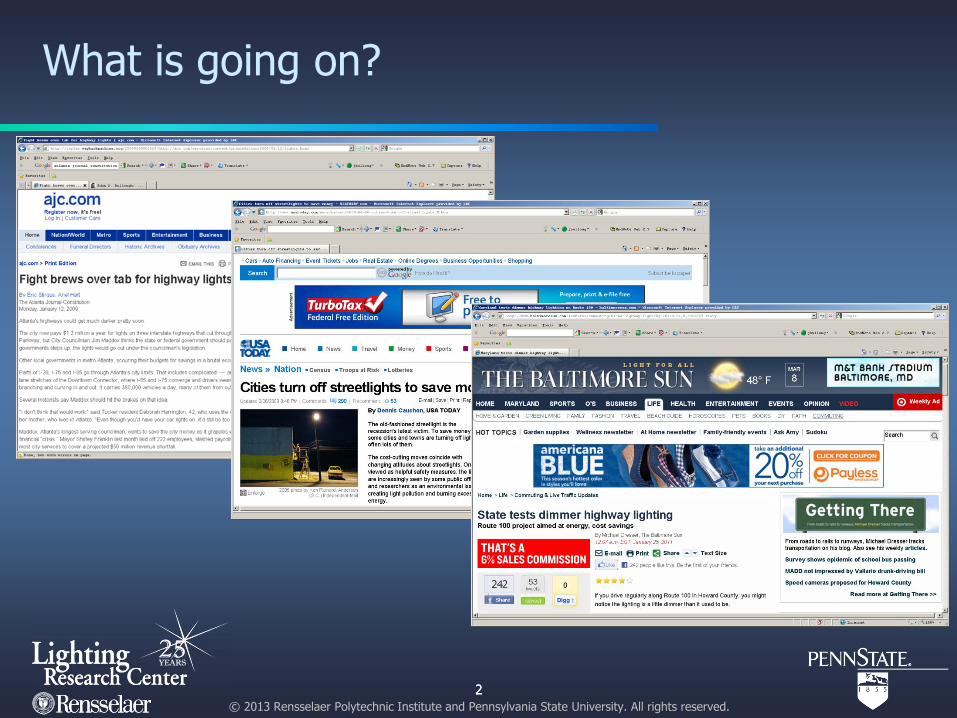
What is going on?
22
© 2013 Rensselaer Polytechnic Institute and Pennsylvania State University. All rights reserved.
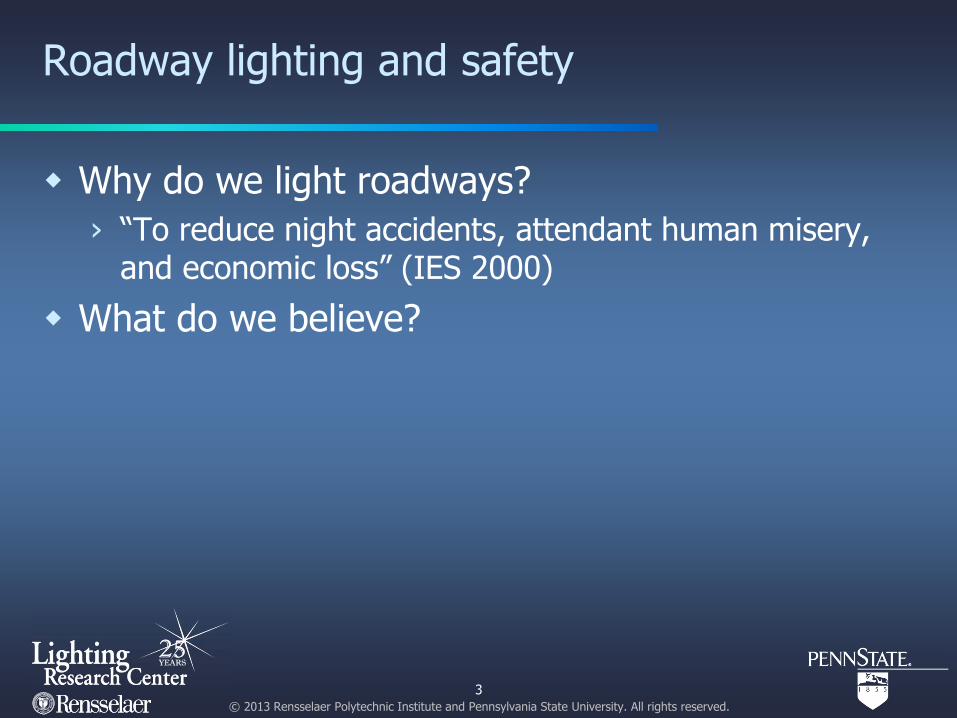
Roadway lighting and safety
Why do we light roadways?› “To reduce night accidents, attendant human misery,
and economic loss” (IES 2000)
What do we believe?
3

© 2013 Rensselaer Polytechnic Institute and Pennsylvania State University. All rights reserved.
We believe…
Roadway lighting improves visibility, which in turn leads to increased safety (fewer crashes): A + B = C
4

© 2013 Rensselaer Polytechnic Institute and Pennsylvania State University. All rights reserved.
Roadway lighting and safety
What is the evidence?› Published literature (IES 1989; CIE 1992; Elvik 1995) and
many state policies suggest that roadway lighting can be associated with a 30% nighttime crash reduction
What is the problem?› Potential for sampling bias, small samples, lack of
statistical control› Inconsistent empirical findings – higher illuminance levels
not always associate with lower nighttime crashes
5
© 2013 Rensselaer Polytechnic Institute and Pennsylvania State University. All rights reserved.
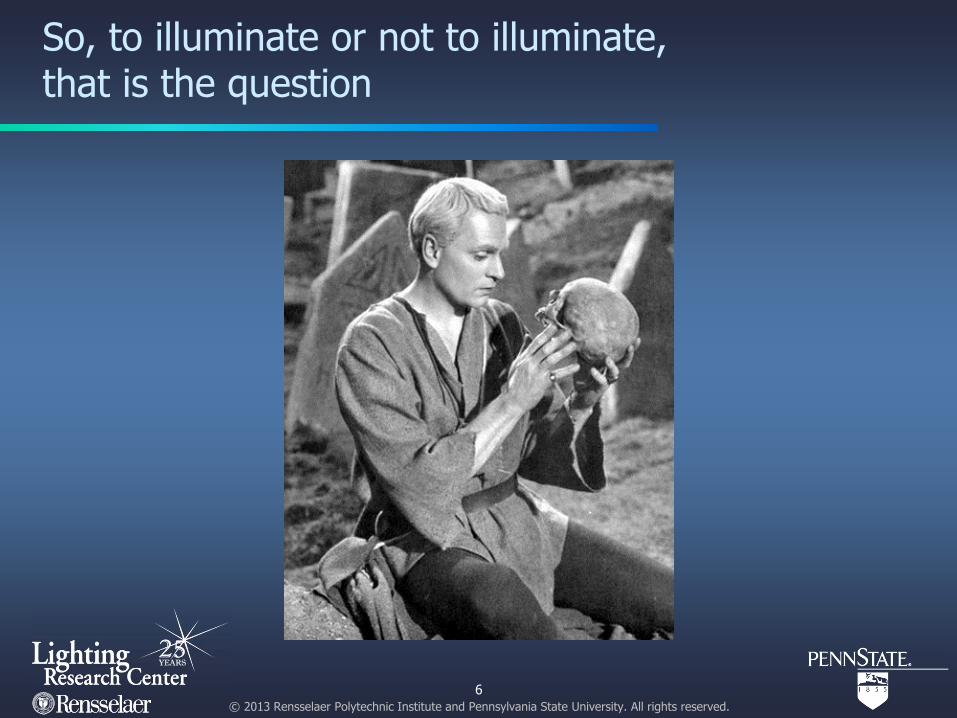
So, to illuminate or not to illuminate, that is the question
6

© 2013 Rensselaer Polytechnic Institute and Pennsylvania State University. All rights reserved.
So, to illuminate or not to illuminate, that is the question
7

© 2013 Rensselaer Polytechnic Institute and Pennsylvania State University. All rights reserved.
How can we know if lighting really matters?
Converging approaches: Statistical approach from Minnesota Highway Safety
Information System (HSIS) statewide database including lighting and crash data
Analytical approachusing visibility coverage areas based on Minnesota DOT practices
8
© 2013 Rensselaer Polytechnic Institute and Pennsylvania State University. All rights reserved.
Statistical Approach
Eric DonnellDept. of Civil and Environmental Engineering
Pennsylvania State University
9

© 2013 Rensselaer Polytechnic Institute and Pennsylvania State University. All rights reserved.
Background
National- and state-level guidance documents conclusively state that fixed roadway lighting improves safety› MnDOT estimates B/C = 21:1› Published safety estimates are:
• 25-52% lower nighttime accident rate• 13-49% fewer nighttime accidents• 22-40% reduction in night-day accident ratio
Most research limited to rural, stop-controlled intersections
10
© 2013 Rensselaer Polytechnic Institute and Pennsylvania State University. All rights reserved.
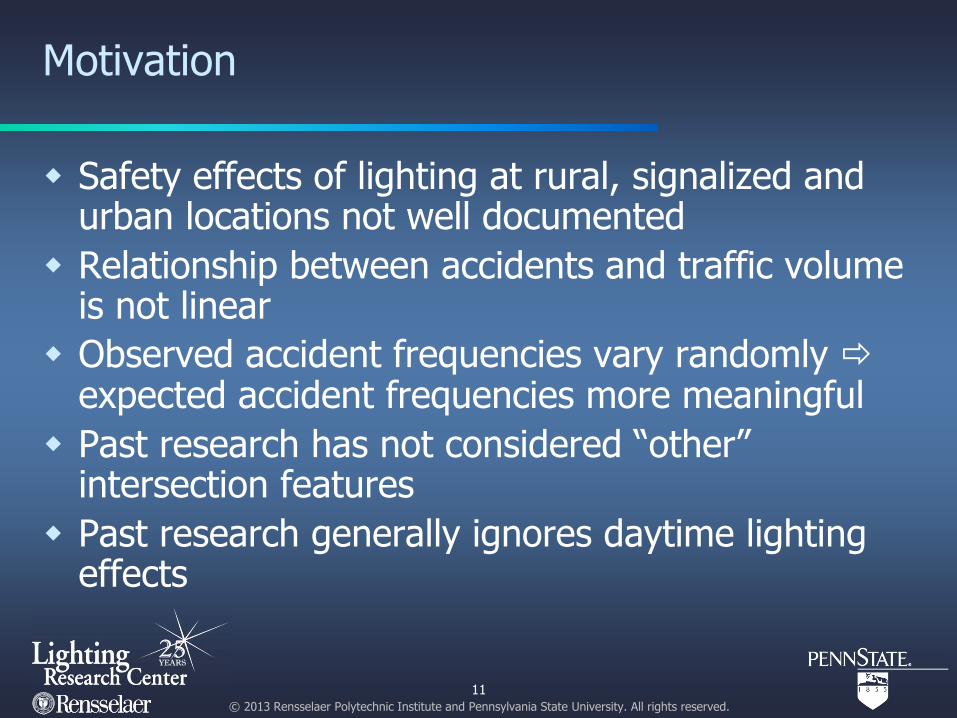
Motivation
Safety effects of lighting at rural, signalized and urban locations not well documented
Relationship between accidents and traffic volume is not linear
Observed accident frequencies vary randomly expected accident frequencies more meaningful
Past research has not considered “other” intersection features
Past research generally ignores daytime lighting effects
11

© 2013 Rensselaer Polytechnic Institute and Pennsylvania State University. All rights reserved.
Highway Safety Manual
Published in 2010 Contains accident prediction algorithms:
› Base crash prediction models› Accident modification factors (AMF)
Lighting AMF for intersections:
12
nipniinifni ppppAMF 83.072.036.011int
AMF ≈ 0.96 or 4% reduction in total crashes with lighting

© 2013 Rensselaer Polytechnic Institute and Pennsylvania State University. All rights reserved.
Statistical analysis framework
13
Accident, lighting, and roadway inventory data
Data structures
Analysis taxonomy
Daytime and nighttime model specification and estimation
Interpret model parameters

© 2013 Rensselaer Polytechnic Institute and Pennsylvania State University. All rights reserved.
Available data and data structures
Highway Safety Information System (HSIS):› Minnesota
• 6,464 intersections• 38,437 reported accidents
Analysis period: 1999 to 2002 (inclusive) Accident, traffic volume, lighting presence,
geometric design, and traffic control data No lighting type or lighting design data
1414

© 2013 Rensselaer Polytechnic Institute and Pennsylvania State University. All rights reserved.
Data summary
15
Variable Minimum Maximum Mean Standard Deviation
Night accident frequency (per year) 0 28 0.3655 0.9687 Day accident frequency (per year) 0 55 1.1211 2.4570 Major road average daily traffic 40 77,430 8,284 9,381 Percent heavy vehicles on major road 0 61.11 8.8880 5.1092 Minor road average daily traffic 1 77,430 3,164 5,179 Area type indicator (1 = urban/suburban; 0 = rural)
0 1 0.4456 0.4970
Traffic control indicator (1 = signal; 0 = stop-control)
0 1 0.1373 0.3442
Lighting indicator (1 = present; 0 = not present)
0 1 0.4212 0.4938
Intersection type indicator (1 = skew; 0 = cross or tee)
0 1 0.1095 0.3123
Speed indicator* (1 = 50 mph or greater; 0 otherwise)
0 1 0.6731 0.4691
No access control indicator * (1 = no access; 0 = partial access control)
0 1 0.9426 0.2326
Depressed median indicator* (1 = depressed median; 0 = barrier or no median)
0 1 0.1162 0.3204
Paved left-shoulder indicator* (1 = paved shoulder; 0 = unpaved or no shoulder)
0 1 0.4577 0.4982
Paved right-shoulder indicator* (1 = paved shoulder; 0 = unpaved or no shoulder)
0 1 0.5096 0.4999
*indicates that data were used for the major intersecting roadway only

© 2013 Rensselaer Polytechnic Institute and Pennsylvania State University. All rights reserved.
Analysis taxonomy
16
All Intersections
Urban
Signalized Unsignalized
Rural
Signalized Unsignalized
© 2013 Rensselaer Polytechnic Institute and Pennsylvania State University. All rights reserved.
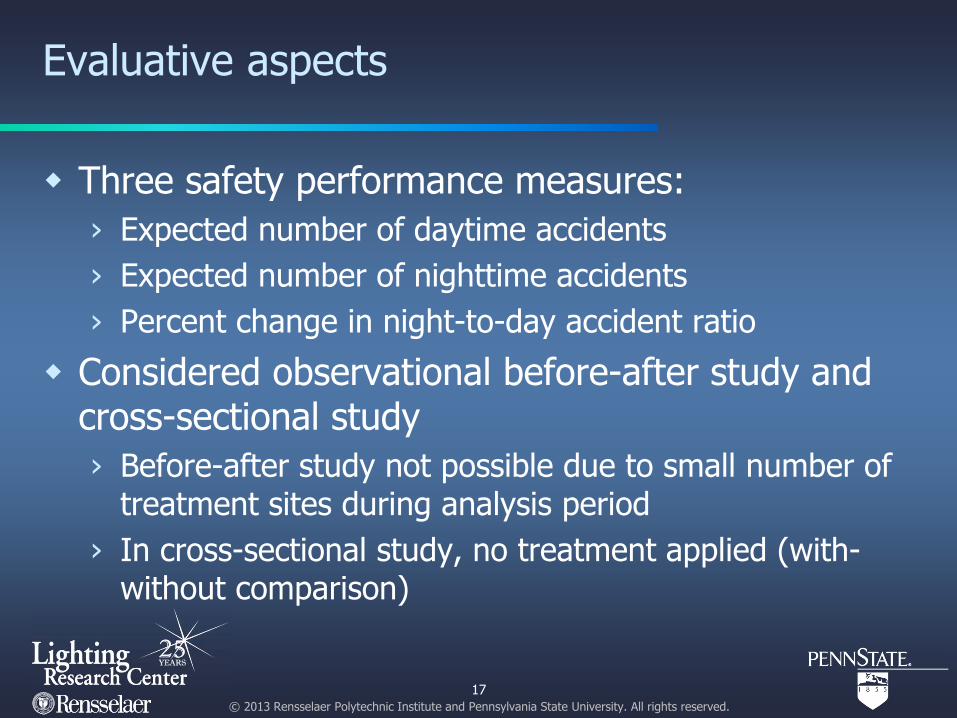
Evaluative aspects
Three safety performance measures:› Expected number of daytime accidents› Expected number of nighttime accidents› Percent change in night-to-day accident ratio
Considered observational before-after study and cross-sectional study› Before-after study not possible due to small number of
treatment sites during analysis period› In cross-sectional study, no treatment applied (with-
without comparison)
17

© 2013 Rensselaer Polytechnic Institute and Pennsylvania State University. All rights reserved.
Statistical modeling approach
Negative binomial regression:
18
iii X ln
• Percent change in night‐to‐day ratio:
wo
wow
DN
DN
DN
Use estimates from lighting parameter in models

© 2013 Rensselaer Polytechnic Institute and Pennsylvania State University. All rights reserved.
Minnesota model estimation results
1919
Variable
Daytime Model Nighttime Model
Parameter Estimate
Standard Error t-stat Parameter
EstimateStandard
Error t-stat
Constant -6.5373 0.151 -43.37 -6.8986 0.206 -33.53Log major road average daily traffic 0.6011 0.015 38.88 0.5737 0.021 26.85Percent heavy vehicles on major road -0.0092 0.003 -3.30 -0.0168 0.004 -4.37Log minor road average daily traffic 0.1603 0.007 21.79 0.1262 0.010 12.29Area type indicator (1 = urban/suburban; 0 = rural) -0.0992 0.029 -3.39 -0.4212 0.040 -10.52
Traffic control indicator (1 = signal; 0 = stop-control) 0.6445 0.031 21.07 0.7120 0.041 17.20
Lighting indicator (1 = present; 0 = not present) 0.0477 0.031 1.56 -0.0791 0.042 -1.86
Intersection type indicator(1 = skew; 0 = cross or tee) 0.4862 0.031 15.86 0.4845 0.040 12.17
Speed indicator*(1 = 50 mph or greater; 0 otherwise) -0.1601 0.022 -7.36 -0.1131 0.029 -3.88
No access control indicator *(1 = no access; 0 = partial access control) -0.0416 0.038 -1.09 -0.0148 0.047 -0.31
Depressed median indicator*(1 = depressed median; 0 = barrier or no median) 0.0851 0.034 2.53 0.1712 0.043 3.99
Paved left-shoulder indicator*(1 = paved shoulder; 0 = unpaved or no shoulder) -0.1163 0.042 -2.75 -0.2907 0.053 -5.44
Paved right-shoulder indicator*(1 = paved shoulder; 0 = unpaved or no shoulder) 0.0798 0.041 1.93 0.2153 0.052 4.11
Dispersion parameter () 0.9487 0.024 40.31 0.8948 0.041 21.99
Number of observations = 22,058LL (constant only) = -28,954.27LL (full model) = -27,084.31Pseudo R2 = 0.1355
Number of observations = 22,058LL (constant only) = -17,842.15LL (full model) = -15,165.85Pseudo R2 = 0.1259

© 2013 Rensselaer Polytechnic Institute and Pennsylvania State University. All rights reserved.
Elasticities (continuous variables)
20
Variable Daytime Elasticity
Nighttime Elasticity
Log major road average daily traffic 0.601 0.574
Log minor road average daily traffic 0.160 0.126
Percent heavy vehicles on major road -0.082 -0.149

© 2013 Rensselaer Polytechnic Institute and Pennsylvania State University. All rights reserved.
Elasticities (categorical variables)
21
Variable Daytime Nighttime
Area type indicator (1 = urban/suburban; 0 = rural) -10.4 -52.4
Traffic control indicator (1 = signal; 0 = stop-control) 47.5 50.9
Lighting indicator (1 = present; 0 = not present) 4.7 -8.2
Intersection type indicator(1 = skew; 0 = cross or tee) 38.5 38.4
Speed indicator*(1 = 50 mph or greater; 0 otherwise) -17.4 -12.0
No access control indicator*(1 = no access; 0 = partial access control) -4.2 -1.5
Depressed median indicator*(1 = depressed median; 0 = barrier or no median) 8.2 15.7
Paved left-shoulder indicator*(1 = paved shoulder; 0 = unpaved or no shoulder) -12.3 -33.7
Paved right-shoulder indicator*(1 = paved shoulder; 0 = unpaved or no shoulder) 7.7 19.4

© 2013 Rensselaer Polytechnic Institute and Pennsylvania State University. All rights reserved.
Percent difference in night-to-day ratio (MN)
22
Intersection Type Model Descriptive Statistics Sample SizeAll -11.9% -28.0% 22,058Urban Unsignalized -13.3% -18.9% 7,730Urban Signalized -6.5% 13.5% 2,875Rural Unsignalized -1.6% -7.6% 11,101Rural Signalized 0.3% -8.7% 352
22
© 2013 Rensselaer Polytechnic Institute and Pennsylvania State University. All rights reserved.
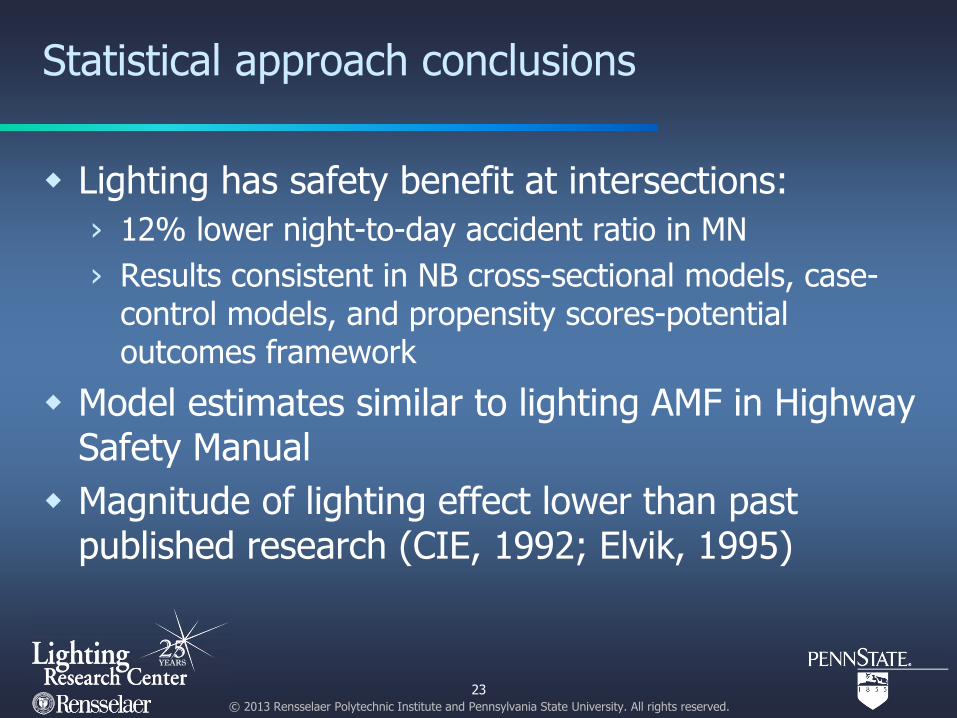
Statistical approach conclusions
Lighting has safety benefit at intersections:› 12% lower night-to-day accident ratio in MN› Results consistent in NB cross-sectional models, case-
control models, and propensity scores-potential outcomes framework
Model estimates similar to lighting AMF in Highway Safety Manual
Magnitude of lighting effect lower than past published research (CIE, 1992; Elvik, 1995)
23

© 2013 Rensselaer Polytechnic Institute and Pennsylvania State University. All rights reserved.
Analytical Approach
John BulloughLighting Research Center
Rensselaer Polytechnic Institute

© 2013 Rensselaer Polytechnic Institute and Pennsylvania State University. All rights reserved.
How are Minnesota’s intersections illuminated?
MnDOT’s Roadway Lighting Design Manual is regularly maintained
Practices closely follow Illuminating Engineering Society (IES) and American Association of State Highway and Transportation Officials (AASHTO) recommendations
Photolog spot checks confirm that they “practice what they preach”
25
Roadway Intersection Type Roadway Illuminance
Intersection Illuminance
Ambient Illuminance
Speed Limit
Extended/ Localized
Urban signalized 18 lx 30 lx 2 lx 30 mph Extended Suburban unsignalized 9 lx 15 lx 0.2 lx 30 mph Extended Rural signalized 6 lx 10 lx 0.2 lx 55 mph Localized Rural unsignalized 6 lx 10 lx 0.02 lx 55 mph Localized

© 2013 Rensselaer Polytechnic Institute and Pennsylvania State University. All rights reserved.
Visibility analysis approach
How much (if at all) does lighting, as practiced along roadway intersections in Minnesota, improve visual performance› Including the impacts of vehicle headlights (on visibility and glare)
For:› Rural, unsignalized intersections› Rural, signalized intersections› Urban/suburban, unsignalized intersections› Urban/suburban, signalized intersections
Using:› Photometrically accurate, field-verified lighting calculation/simulation
software and a validated model of visual performance
26

© 2013 Rensselaer Polytechnic Institute and Pennsylvania State University. All rights reserved.
Common intersection crash types
Misjudgment of location/velocity of adjacent vehicles is a common cause of crashes at intersections (after red light running) (Chovan et al. 1994)
27

© 2013 Rensselaer Polytechnic Institute and Pennsylvania State University. All rights reserved.
Potential role of lighting in safety
28
Which car would you rather be facing?

© 2013 Rensselaer Polytechnic Institute and Pennsylvania State University. All rights reserved.
Visibility coverage area
Characterizes drivers’ ability see potential hazards (other vehicles) and surrounding terrain for different driving speeds
Includes headlamps, ambient light (in urban/suburban and rural locations), extended (continuous) and localized (“point”) lighting, driver age (30, 45 and 60 year olds)
29
Rea et al. 2010
Relevant locations for high speeds (≥40 mph)
Relevant locations for low speeds (<40 mph)
(40 mph =65 km/h)
29

© 2013 Rensselaer Polytechnic Institute and Pennsylvania State University. All rights reserved.
Relative visual performance (RVP) model
30
Speed‐accuracy is a function of object brightness, contrast, size, and observer age
Once high visual performance is achieved, further increases in light level do not improve speed‐accuracy
Rea and Ouellette 1991
© 2013 Rensselaer Polytechnic Institute and Pennsylvania State University. All rights reserved.
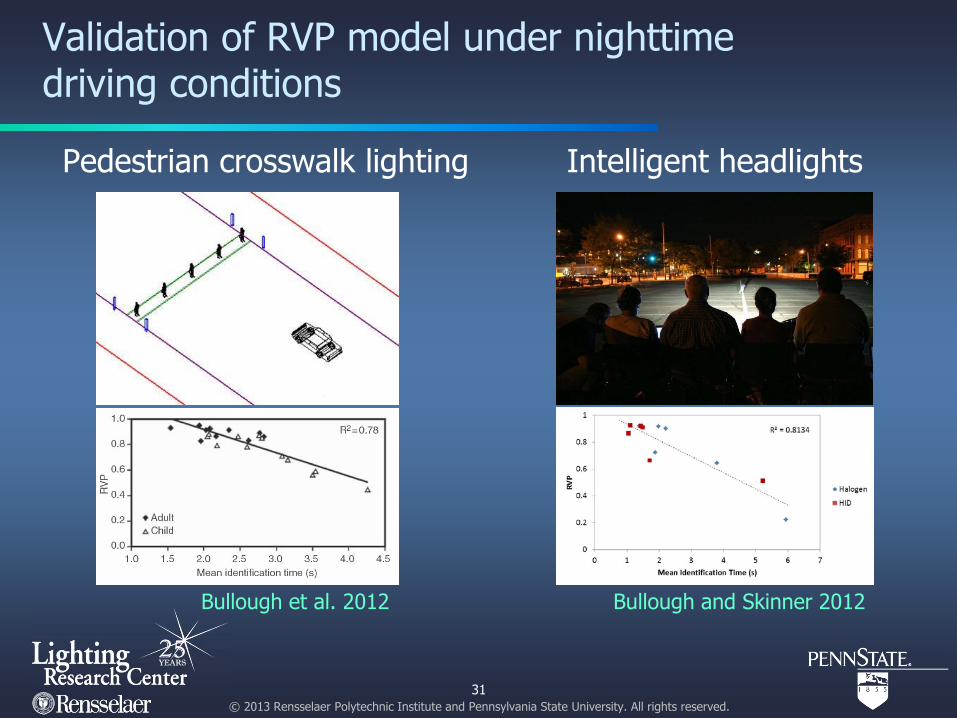
Validation of RVP model under nighttime driving conditions
Pedestrian crosswalk lighting
31
Intelligent headlights
Bullough et al. 2012 Bullough and Skinner 2012

© 2013 Rensselaer Polytechnic Institute and Pennsylvania State University. All rights reserved.
Target characteristics
A target with the characteristics specified by the IES (2000) “small target visibility” procedure was used
Provides sensitivity for visual performance analysis
32
Rea et al. 2010

© 2013 Rensselaer Polytechnic Institute and Pennsylvania State University. All rights reserved.
RVP score
33

© 2013 Rensselaer Polytechnic Institute and Pennsylvania State University. All rights reserved.
Analytical approach results
34
MnDOT 2006; Rea et al. 2010
Visibility ≠ Light Level!

© 2013 Rensselaer Polytechnic Institute and Pennsylvania State University. All rights reserved.
A provisional transfer function for visibility and nighttime crash safety
35

© 2013 Rensselaer Polytechnic Institute and Pennsylvania State University. All rights reserved.
Applying the provisional transfer function
36
Roadway lighting, as practiced by MnDOT (based on IES recommendations), would be expected to reduce nighttime crashes by 1.5% at rural unsignalized intersections, and by 5.3% at urban signalized intersections

© 2013 Rensselaer Polytechnic Institute and Pennsylvania State University. All rights reserved.
Extended lighting
To the extent visual performance and safety are correlated, it can be possible to optimize lighting beyond existing practices to improve nighttime safety
For example: most rural intersection lighting is localized or “point” lighting› Expected to reduce nighttime crashes by
1.5%› An array of five streetlights illuminating
the major intersecting roadway and to a higher light level might reduce nighttime crashes by 11% - a sevenfold increase in benefit with an approximately fivefold increase in cost
37

© 2013 Rensselaer Polytechnic Institute and Pennsylvania State University. All rights reserved.
Analytical approach conclusions
The relative visual performance (RVP) model is a robust predictor of speed and accuracy of seeing under nighttime driving conditions
Increases in visual performance from roadway intersection lighting are correlated with improvements in nighttime driving safety
Increases in visual performance from roadway intersection lighting are not directly correlated with higher horizontal illuminances on the roadway
38

© 2013 Rensselaer Polytechnic Institute and Pennsylvania State University. All rights reserved.
Benefit/Cost
Mark ReaLighting Research Center
Rensselaer Polytechnic Institute

© 2013 Rensselaer Polytechnic Institute and Pennsylvania State University. All rights reserved.
Economic costs of roadway intersection lighting
Installation cost: Assumes dedicated poles with underground wiring (R.S. Means 2008)› Urban signalized: $13,500 (annualized over 20 yr: $1080)› Rural unsignalized: $4,600 (annualized over 20 yr: $370)
Operation and maintenance cost:› Urban signalized: $710 (annual)› Rural unsignalized: $230 (annual)
Overall annual(ized) cost: › Urban signalized: $1,790 (annual)› Rural unsignalized: $600 (annual)
Cost is unrelated to traffic volume
40

© 2013 Rensselaer Polytechnic Institute and Pennsylvania State University. All rights reserved.
Economic benefits of avoided crashes
U.S. DOT (2008) estimates for different crash severities:› Fatality: $5,800,00› Incapacitating injury: $401,538› Evident injury: $80,308› Possible injury: $42,385› Property damage only: $4,462
Fatal and injury crashes are more prevalent at rural locations (higher speeds), so average weighted crash costs are:› Urban signalized: $122,056› Rural unsignalized: $232,142
41
© 2013 Rensselaer Polytechnic Institute and Pennsylvania State University. All rights reserved.
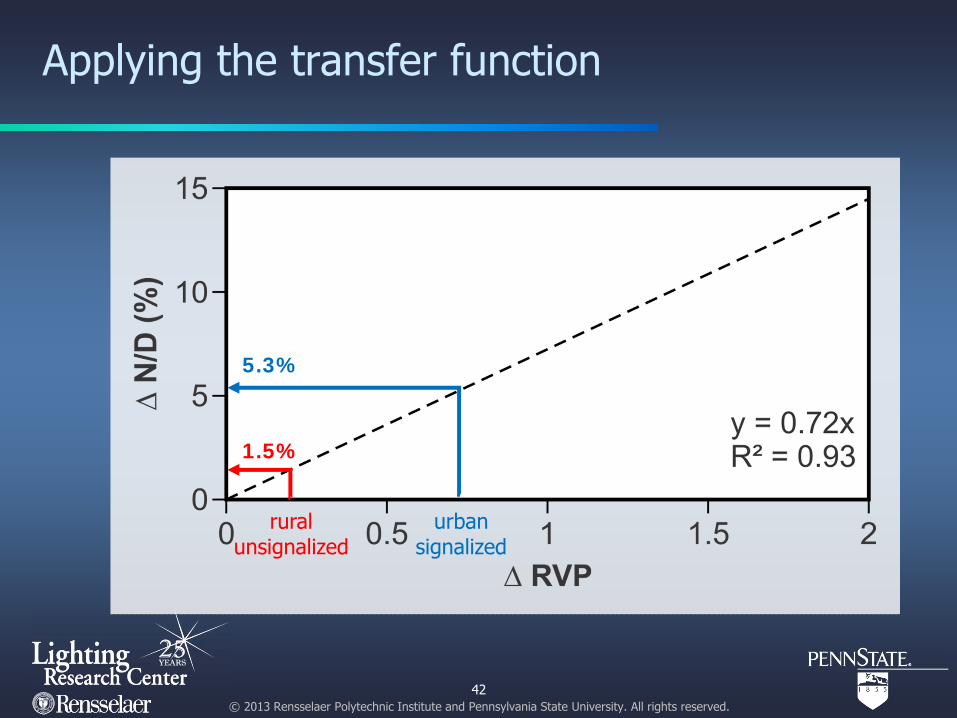
Applying the transfer function
42
Roadway lighting, as practiced by MNDOT (based on IES recommendations), would be expected to reduce nighttime crashes by 1.5% at rural unsignalized intersections, and by 5.3% at urban signalized intersections
ruralunsignalized
urbansignalized
1.5%
5.3%

© 2013 Rensselaer Polytechnic Institute and Pennsylvania State University. All rights reserved.
Reduction in nighttime crashes associated with roadway intersection lighting
43
5.3% of eachvalue
$122,056
1.5% of eachvalue
$232,142
(annual average daily traffic)

© 2013 Rensselaer Polytechnic Institute and Pennsylvania State University. All rights reserved.44
Benefit/cost ratios
Urban signalized intersections
Rural unsignalized intersections16400 Mean(MN)
3200 Mean(MN)

© 2013 Rensselaer Polytechnic Institute and Pennsylvania State University. All rights reserved.
Rural example: Extended lighting
Changing from localized lighting at rural intersections to extended lighting with a higher illuminance› Using an array of five luminaires
along the major intersecting roadway
The alternative lighting would be expected to improve the crash reduction factor from 1.5% (0.21 ∆RVP units) to 11.0% (1.53 ∆RVP units)
45
extended/ increased
illuminance(30 lx)
11.0%
ruralunsignalized
(10 lx)
1.5%
AADT = 3200 vehicles/day (mean in MN)

© 2013 Rensselaer Polytechnic Institute and Pennsylvania State University. All rights reserved.46
Rural example: Extended lighting
Simple payback for installation cost:< 6 months
3200 Mean(MN)
874

© 2013 Rensselaer Polytechnic Institute and Pennsylvania State University. All rights reserved.
Rural example: Adaptive lighting
Nighttime traffic volume is not uniform throughout the night
47
50% of crashes are expected during the busiest four hours of the 12‐hour night
Ivan et al. 2002 AADT = 3200 vehicles/day (mean in MN)
*
**
*
* = 61%

© 2013 Rensselaer Polytechnic Institute and Pennsylvania State University. All rights reserved.
Rural example: Adaptive lighting
Tripling the light level during these hours at a rural unsignalized intersection from 10 to 30 lux would improve the crash reduction factor from 1.5% (0.21 ∆RVP units) to 5.6% (0.78 ∆RVP units)› Turning lights off during the remaining 8 hours of the night would
result in nominally equal operating costs› Overall crash reduction would be 2.8% (50% x 5.6%), compared to
1.5% for the lower light level throughout entire night Assuming an initial cost of $250 for such a control system,
simple payback would occur within four months
48
AADT = 3200 vehicles/day (mean in MN)
increasedilluminance
(30 lx)
5.6%
ruralunsignalized
(10 lx)
1.5%

© 2013 Rensselaer Polytechnic Institute and Pennsylvania State University. All rights reserved.
Rural example: Decommissioning
Switch off lighting, eliminate energy and maintenance costs› 1.5% N/D @ 10 lux
0
1
2
3
100 1000 10000 100000
Major road AADT (vehicles/day)
B/C
ratio
for s
witc
hing
off
light
ing
353
Breakeven traffic volume is so much lower because cannot recover pole installation costs
3200 MeanMN
49

© 2013 Rensselaer Polytechnic Institute and Pennsylvania State University. All rights reserved.
Summary
Roadway lighting can improve safety› Not necessarily as much as previously assumed
Safety can be increased by increasing visibility› Predictions possible, not just post hoc inferences
Value (benefits/costs) can be now calculated to compare lighting of different types and with other possible safety interventions
50

© 2013 Rensselaer Polytechnic Institute and Pennsylvania State University. All rights reserved.
Thank you!
Mark ReaLighting Research Center
Rensselaer Polytechnic Institute
Eric DonnellDept. of Civil and
Environmental Engineering Pennsylvania State
University
John BulloughLighting Research Center
Rensselaer Polytechnic Institute
References: www.lrc.rpi.edu/lighting-safety