to maintain productive land and restore clean water · most desirable fish species have declined....
TRANSCRIPT
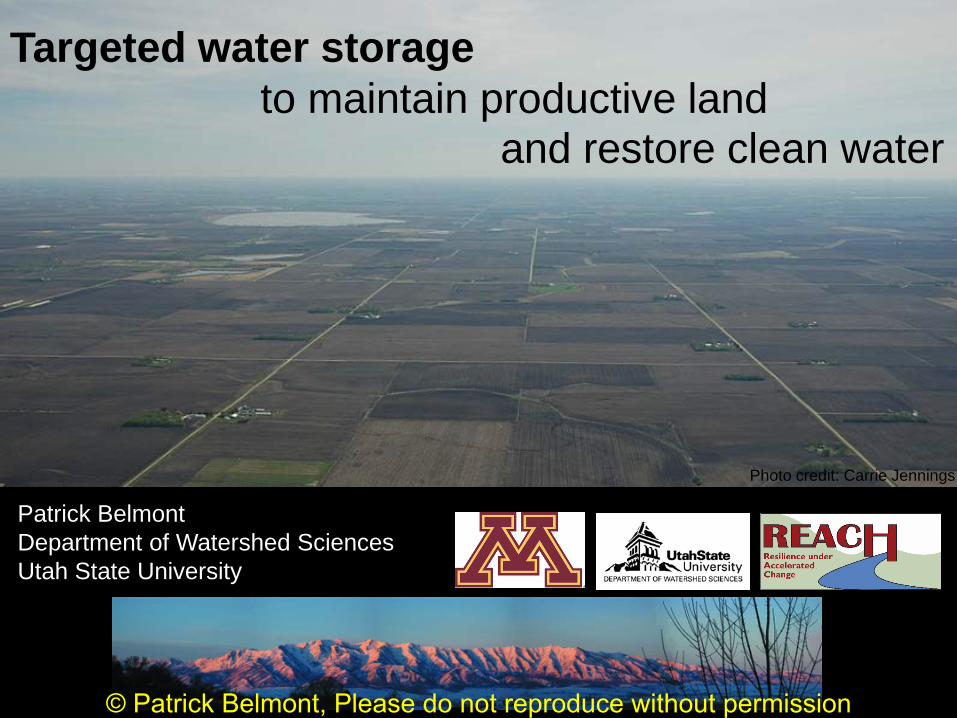
Patrick BelmontDepartment of Watershed SciencesUtah State University
Targeted water storage to maintain productive land
and restore clean water
Photo credit: Carrie Jennings
© Patrick Belmont, Please do not reproduce without permission

Efi Foufoula
UMN
Hydrology
Karen Gran
UMN-D
Geology
Jacques Finlay
UMN
Ecology
Peter Wilcock
USU
Sed. Transport
Gary Parker
UIUC
Morphodynamics
Praveen Kumar
UIUC
Hydrology
Patrick Belmont
USU
Geomorphology
ENG 1209402
Collaborators:Barbara HeitkampShawn SchottlerStephanie DayBrent DalzellChris LenhartJ. Wesley LauerCarrie Jennings
Students:Se Jong ChoSara KellyKeelin SchaffrathZeinab TakbiriJon CzubaMartin Bevis Nate MitchellTim BeachAngus VaughanBruce CallShayler LevinePatrick AdamsAdam Fisher
Funding provided by:
Post-docs:Amy HansenKarthik Kumarasamy
None of our work would be possible without the tireless and meticulous workof innumerable state and local agency staffandthe interest and support of south central Minnesotans.
© Patrick Belmont, Please do not reproduce without permission

3
Rivers are fascinating things…W
illiam
s R
iver
, AK,
pho
to b
y N
.D. S
mith Esther Eke
© Patrick Belmont, Please do not reproduce without permission

Photo: Star Tribune4
© Patrick Belmont, Please do not reproduce without permission

BEC SWCD© Patrick Belmont, Please do not reproduce without permission
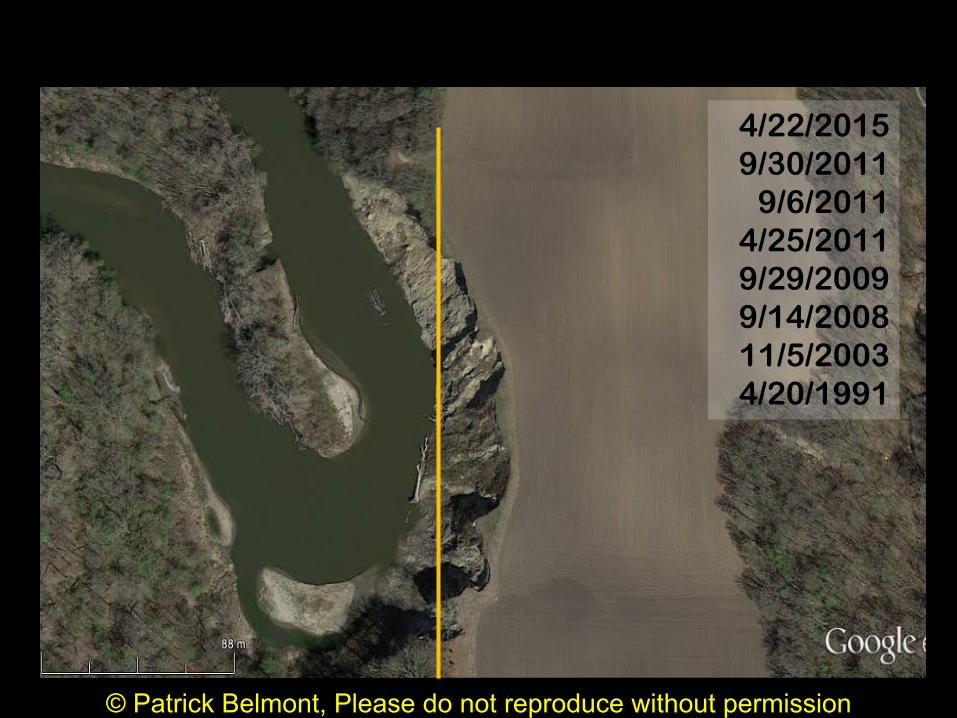
4/22/20159/30/2011
9/6/20114/25/20119/29/20099/14/200811/5/20034/20/1991
© Patrick Belmont, Please do not reproduce without permission

Sediment, nutrient problems in Minnesota
MRB is primary source of sedimentand nutrients for Lake Pepin
Minnesota River Basin: 336 impairments forsediment, nutrients, aquatic life
MRB
Where is the sediment coming from?
How much is human/natural?
How can we clean these rivers up?
Lake Pepin Sedimentation
Kelley & Nater. 2000
Year
Sedimentation Rate (Mg/yr)
P. Wilcock© Patrick Belmont, Please do not reproduce without permission

Sediment and nutrient managementProjects 1997 - 2008
Lots of money invested, but no reduction in sediment?
Past and future investments...
We will invest a lot more money…let’s get the best bang for the buck
Musser et al., 2009
© Patrick Belmont, Please do not reproduce without permission
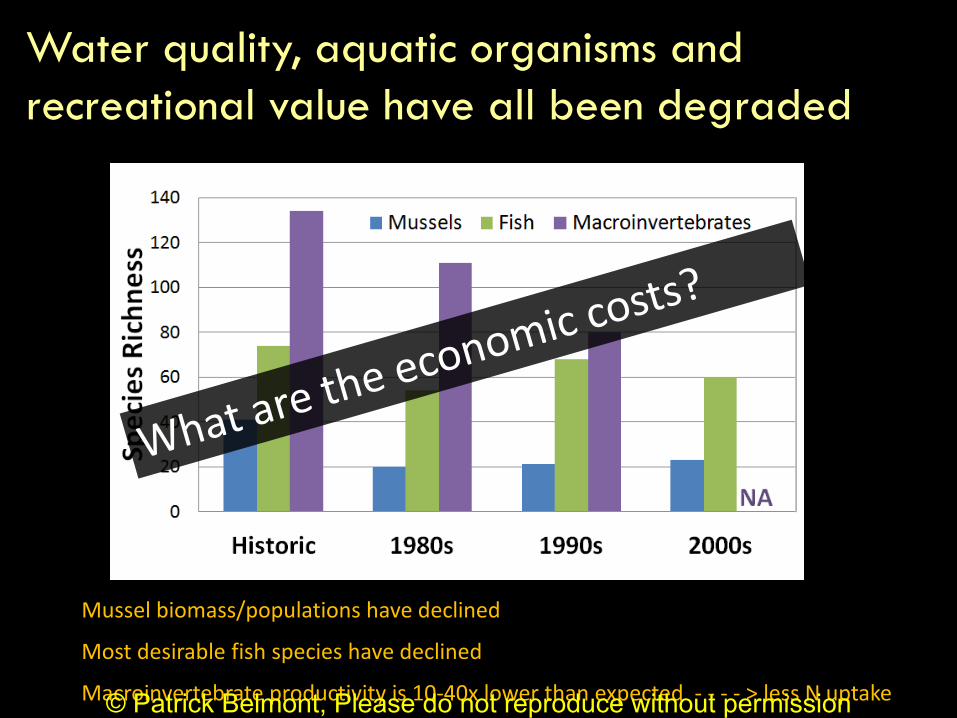
Water quality, aquatic organisms and recreational value have all been degraded
Mussel biomass/populations have declined
Most desirable fish species have declined
Macroinvertebrate productivity is 10-40x lower than expected - - - - > less N uptake© Patrick Belmont, Please do not reproduce without permission

Carrie Jennings
The cause of the problem is obvious, right?
© Patrick Belmont, Please do not reproduce without permission

11
What do we know? How do we know it?
What are the implications formanagement, policy and restoration?
What are we shooting for? What is desirable? How do we get there?
© Patrick Belmont, Please do not reproduce without permission
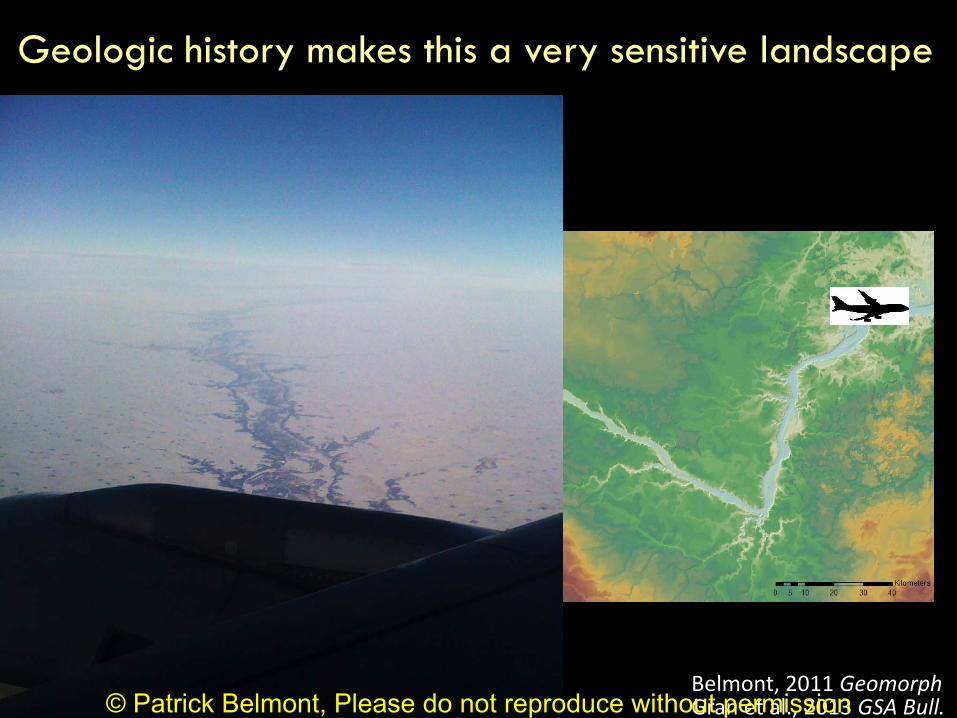
Geologic history makes this a very sensitive landscape
Belmont, 2011 GeomorphGran et al., 2013 GSA Bull.© Patrick Belmont, Please do not reproduce without permission

Uplands: flat land, passive rivers
Knick zone: steep, highly dynamic, incising rivers
Minnesota River Valley: rapidly aggrading channel and floodplain
13
Each region responds differently to changes in water and sediment loads
Geologic history makes this a very sensitive landscape
© Patrick Belmont, Please do not reproduce without permission

Poorly drained, fine textured soils
Down-cutting rapidly for past 13,400 years
Agriculture and drainage began mid 1800s Continue to evolve in effectiveness, intensity,precision, productivity, etc.
NAT
URA
LHU
MAN
Le Sueur River example
knick zone
© Patrick Belmont, Please do not reproduce without permission
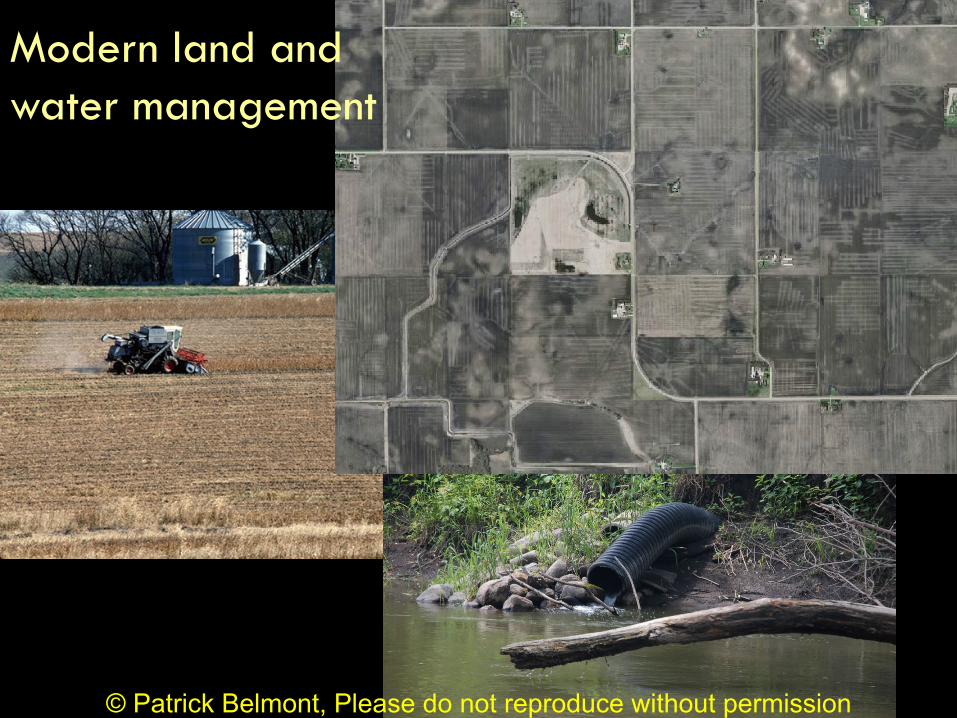
Modern land andwater management
© Patrick Belmont, Please do not reproduce without permission

The up-sides of drainage
NASA's Goddard Space Flight Center
1. Crop productivity is way up!2. More rainfall infiltrates into the soil, less runs off the surface
July 2013 fluorescence
© Patrick Belmont, Please do not reproduce without permission

The down-sides of drainage1. Concentrating flow in some sensitive areas2. Increasing the amount and rate of water delivered to the river
© Patrick Belmont, Please do not reproduce without permission

Novotny and Stefan (2007), Additional data from Sara Kelly
And we’re getting more rain
10-1
100
101
102
10-5
10-4
10-3
10-2
10-1
100
Precip.-mmP
rob.
of.
Ex.
loglog plot of Prob . Of. Exceedance
Post-PeriodPre-Period
1
0.1
0.01
0.001
0.0001Ex
ceed
ance
prob
abili
ty
1948-19771977-2011
Total event precipitation (mm)Zeinab Takbiri
Precip has increased!
Big events are getting bigger
MSP precipitation
12 gages in MRB
© Patrick Belmont, Please do not reproduce without permission

19
You are HERE
20 km
Where is the sediment coming from?
© Patrick Belmont, Please do not reproduce without permission

14C & OSL-Dates for Incision History
4 Years of Repeat Terrestrial Lidar
Gages galore!
Migration & Widening Rates
7 Decades of Air Photos
Sediment fingerprinting
10Be 210Pb 137Cs
GeoNet and Lidar Analysis
Field Surveys
A Sediment Budget for the Le Sueur WatershedMany tools employed...
© Patrick Belmont, Please do not reproduce without permission

1. Gaging data 2. Geochemical tracers 3. Aerial lidar analysis4. Terrestrial lidar scans 5. Air photo analysis 6.Numerical modeling7. Field surveys 8. Optically Stimulated Luminescence and 14C dating
U: UplandsFp: FloodplainBl: BluffsBa: BanksC: Channel incisionR: Ravines
Sources
Constraints
Belmont et al. 2011 ES&TLe Sueur Sediment Budget
© Patrick Belmont, Please do not reproduce without permission

10 km
Lake
Pep
in S
edim
ent C
ore
Sediment Fingerprinting Results
Pre-settlement: primarily near-channel sources
Late 20th Century: Sediment loading remains high but sources shift from top soil to banks & bluffs
Mid 20th Century: Poor land management causes pulse of upland soil erosion
Belmont et al. 2011 ES&T
Bluffs, banks = [LOW] Ag field soil = [HIGH]
Corroboration of Le Sueur sediment budget in the geochemical profile of Lake Pepin sediments
© Patrick Belmont, Please do not reproduce without permission

23
What do we know now?
2. This landscape is geologically primed to generate lots of sediment.
3. Agricultural drainage has significantly increased flows in the river.It is also raining more, and more intensely.
1. This is some of the most productive ag land in the world andlocal economies/communities depend on it staying that way.
4. Ag erosion dominated 50+ years ago. Today, most sediment comesfrom near-channel sources, amplified by increased flows.
5. These rivers are special, have been severely degraded, and havegreat potential for improvement. Better water quality benefits biodiversity, human health, recreation, industry, land values, etc.
We need to manage water runoff better!
© Patrick Belmont, Please do not reproduce without permission

0.5 - 7.5% of total area
Temporary water storage
Water detention basins (aka. ephemeral wetlands) reduce sediment loading downstream
N Mitchell, K Gran
SJ Cho, P Wilcock
Reduces peak flows downstreamReduces bluff erosion
in the knick zone
© Patrick Belmont, Please do not reproduce without permission

Wetlands also decrease nitrogen concentrations in ditches during most critical season
L
25
• Reduces N during highest flows• Apr-June flux sets size of Gulf Hypoxic Zone
(Turner et al. 2012)
June decreases in TDN correlate with wetland coverage:
• 94 sites in 3 HUC-8 basins, sampled same week in June 2014
• Drainage areas: 3 to 5800 km2
• Correlation with % wetland + lake holds when control for % cropland (85% cropland +/- 2.5%, r2 = 0.30, p = 0.009, n = 22)
J. Finlay, A. Hansen © Patrick Belmont, Please do not reproduce without permission

26
We have some great examples to follow
U of M Southwest Research and Outreach Center
Elm Creek Restoration Project, Lenhart, Brooks & Magner
BE County Ditch 57 Restoration Project, Duncanson, Brandel, BEC
Swift County JD 8 Restoration Project, Kriter, Magner and others
© Patrick Belmont, Please do not reproduce without permission

27
What needs to happen?1. Slow the flow! Store more water in the landscape.
• Make better use of existing water storage sites• Install new water detention basins• Controlled drainage• Increase soil carbon
1a. Water needs to be detained long enough to not add to peak.
1b. Make the most of that dedicated land. Habitat benefits? Nutrient reduction? Hay in dry years?
3. Provide incentives with minimal red tape. Coordinate efforts…the collective, downstream impacts matter.
2. Continue to maintain and improve field practices.
1c. Make the improvements ‘permanent’.
© Patrick Belmont, Please do not reproduce without permission