to supply from local stock nationwide the small builder’s ... · half-yearly report for the 24...
TRANSCRIPT

Half-yearly report for tHe 24 weeks ended 9 June 2012
to supply from local stock nationwide the small builder’s ever-changing routine kitchen and joinery requirements,
assuring no-call-back quality and best local price.
21886_Half Year Report Final_V2.indd 1 16/07/2012 17:08

The condensed consolidated financial statements
Condensed consolidated income statement 10
Condensed consolidated statement of comprehensive income 11
Condensed consolidated balance sheet 12
Condensed consolidated statement of changes in equity 13
Condensed consolidated cash flow statement 14
Notes to the condensed consolidated financial statements 15
Independent review report to Howden Joinery Group Plc 23
Financial calendar 24
The business review
Highlights 01
Our business 02
Summary of Group results 04
Interim management report 05

Howden Joinery Group Plc Half-yearly report for the 24 weeks ended 9 June 2012
01
Highlights
Financial resulTs
• Howden Joinery UK depot revenue increased by 6.8% to £357.7m (up 5.0% on a same depot basis). Group revenue was £364.6m (2011: £341.7m)
• Gross profit margin was 60.1% (2011: 59.3%)
• Operating profit rose to £29.1m (2011: £25.5m)
• Profit before tax increased to £25.4m (2011: £23.5m)
• Basic earnings per share increased to 3.2p (2011: 2.8p)
• Net cash of £37.4m at 9 June 2012 (24 December 2011: £57.1m net cash, 11 June 2011: £5.1m net cash)
• Interim dividend of 0.3p per share declared
Business develoPmenTs
• Investment in the future growth of the business continues:
– new products introduced across entire spectrum of offer
– eight new UK depots opened so far in 2012, bringing total to 517, and one new depot opened in France, where there are now 11
– capital expenditure totalled £6.5m
• Further mitigation of legacy property liability, with termination of leases on two more legacy properties since the Interim Management Statement, bringing the total so far this year to five and the total remaining to 16
• Agreement reached on funding of pension scheme deficit for the three years ending April 2015 and existing banking facility extended to July 2016
currenT TradinG
• Howden Joinery UK depot total revenue decreased by 0.9% in the first four weeks of the second half of the year compared with the same period last year, when sales rose sharply (+10.5%) as a price increase was initiated
• Management’s expectations for the year remain unchanged

02
Howdens has a history of seeking out opportunities within its proven model while adapting successfully to rapidly changing circumstances
The Howden proposition Stages of development
Opened 500th depot in 2011
1995 – 1997Trade onlyHowdens sells a considered range of kitchens and joinery to small builders and professional fitters, not directly to retail customers. We believe this is the best and most efficient way to get a good kitchen properly fitted and working in the home.
A complete service to the builderHowdens offers trade terms, including a net monthly account, to allow small builders to manage their margin and cash flow and plan their business. We also support the builder’s sale via industry-leading kitchen planning services together with a range of catalogues and publications to inspire the purchaser.
Very local depots, always in stockThe builder knows that every one of the 517 Howdens depots will keep everything in stock, all the time. This means he can collect exactly what he needs, when he wants it, and can finish his job on time.
Easy to fit, reliable productHowdens offers exclusive product designed to be quick and easy to fit and reliable both at the time of installation and in daily use. Our promise to the builder, and to the end user in the home, is that Howdens’ product does not break.
Up-to-date product design that meets evolving routine needsTechnological innovation, increasing regulation, the need for more functionality, and changing trends drive a continually sophisticating market. Our product offer is constantly developing with the introduction of new and improved kitchen ranges, accessories, joinery, flooring, hardware and appliances.
Knowledgeable depot staffHowdens’ depot staff understand what local builders need and offer a service they can trust. In the first half of 2012 we opened 17,000 net new customer accounts, bringing our total account base to nearly 260,000.
Local managers with the authority to make commercial decisionsHowdens’ depot managers hire their own staff, select their own stock levels, do their own local marketing and are responsible for their own sales and margin. They and their staff are incentivised on a share of their depot’s profit, so their interests are aligned with those of the business as a whole.
Focused supplyHowdens’ supply chain is geared entirely to the needs of the depot. We manufacture all our own cabinets and most of our worktops in England: we have invested in our manufacturing, warehouse and distribution systems in order to guarantee quality, accuracy and security of supply at least cost.
Start upThe Howdens model is refined and established, initially in 14 depots. Rollout to more locations begins.
Roll out to 300+ depotsRapid growth and development. Howdens business develops scale and reputation; grows accounts with trade customers.
MFI heads into crisisMFI incurs losses of c. £140m between 2004 and 2006.
Corporate reconstructionGroup financing renegotiated and strategic options reviewed: MFI Retail business sold.
Economic crisisDivested MFI business collapses, resulting in significant pensions and property “legacy” for Howdens (now greatly diminished: by 2012, £320m of payments had been made by Howdens and 108 properties reduced to 16).
Howden model proven post-2008Reported PBT of £100m in 2010.
Howdens wins several awards, including “Turnaround of the Year, 2009” and Sunday Times “Top 25 Best Companies to Work For, 2010”.
Re-engineering the business
Howdens business is entirely re-engineered around its ex-stock,
trade-only model, with manufacturing re-focused on the needs of the small builder. New systems are required to
support every part of the business and make sure it works seamlessly
and efficiently. Positive product development is resumed.
Rapid product development
Developing competitive advantage, supported by focused manufacturing,
effective systems and lowest cost of production and distribution.
Best Demonstrated PracticeSignificant improvements in margin and product
delivered. Dynamic review process initiated, revealing further sales and profit opportunities.
Ongoing adaptation A business model suited to a changing environment.
1997 – 2004
2004 – 2006
2005 – 2008
2008
From 2006
2009 – 2011
2010 – 2012
2012...
21886_Half Year Report Final_V2.indd 2-3 25/07/2012 11:19

03
Howdens has a history of seeking out opportunities within its proven model while adapting successfully to rapidly changing circumstances
The Howden proposition Stages of development
Opened 500th depot in 2011
1995 – 1997Trade onlyHowdens sells a considered range of kitchens and joinery to small builders and professional fitters, not directly to retail customers. We believe this is the best and most efficient way to get a good kitchen properly fitted and working in the home.
A complete service to the builderHowdens offers trade terms, including a net monthly account, to allow small builders to manage their margin and cash flow and plan their business. We also support the builder’s sale via industry-leading kitchen planning services together with a range of catalogues and publications to inspire the purchaser.
Very local depots, always in stockThe builder knows that every one of the 517 Howdens depots will keep everything in stock, all the time. This means he can collect exactly what he needs, when he wants it, and can finish his job on time.
Easy to fit, reliable productHowdens offers exclusive product designed to be quick and easy to fit and reliable both at the time of installation and in daily use. Our promise to the builder, and to the end user in the home, is that Howdens’ product does not break.
Up-to-date product design that meets evolving routine needsTechnological innovation, increasing regulation, the need for more functionality, and changing trends drive a continually sophisticating market. Our product offer is constantly developing with the introduction of new and improved kitchen ranges, accessories, joinery, flooring, hardware and appliances.
Knowledgeable depot staffHowdens’ depot staff understand what local builders need and offer a service they can trust. In the first half of 2012 we opened 17,000 net new customer accounts, bringing our total account base to nearly 260,000.
Local managers with the authority to make commercial decisionsHowdens’ depot managers hire their own staff, select their own stock levels, do their own local marketing and are responsible for their own sales and margin. They and their staff are incentivised on a share of their depot’s profit, so their interests are aligned with those of the business as a whole.
Focused supplyHowdens’ supply chain is geared entirely to the needs of the depot. We manufacture all our own cabinets and most of our worktops in England: we have invested in our manufacturing, warehouse and distribution systems in order to guarantee quality, accuracy and security of supply at least cost.
Start upThe Howdens model is refined and established, initially in 14 depots. Rollout to more locations begins.
Roll out to 300+ depotsRapid growth and development. Howdens business develops scale and reputation; grows accounts with trade customers.
MFI heads into crisisMFI incurs losses of c. £140m between 2004 and 2006.
Corporate reconstructionGroup financing renegotiated and strategic options reviewed: MFI Retail business sold.
Economic crisisDivested MFI business collapses, resulting in significant pensions and property “legacy” for Howdens (now greatly diminished: by 2012, £320m of payments had been made by Howdens and 108 properties reduced to 16).
Howden model proven post-2008Reported PBT of £100m in 2010.
Howdens wins several awards, including “Turnaround of the Year, 2009” and Sunday Times “Top 25 Best Companies to Work For, 2010”.
Re-engineering the business
Howdens business is entirely re-engineered around its ex-stock,
trade-only model, with manufacturing re-focused on the needs of the small builder. New systems are required to
support every part of the business and make sure it works seamlessly
and efficiently. Positive product development is resumed.
Rapid product development
Developing competitive advantage, supported by focused manufacturing,
effective systems and lowest cost of production and distribution.
Best Demonstrated PracticeSignificant improvements in margin and product
delivered. Dynamic review process initiated, revealing further sales and profit opportunities.
Ongoing adaptation A business model suited to a changing environment.
1997 – 2004
2004 – 2006
2005 – 2008
2008
From 2006
2009 – 2011
2010 – 2012
2012...
21886_Half Year Report Final_V2.indd 2-3 25/07/2012 11:19
04
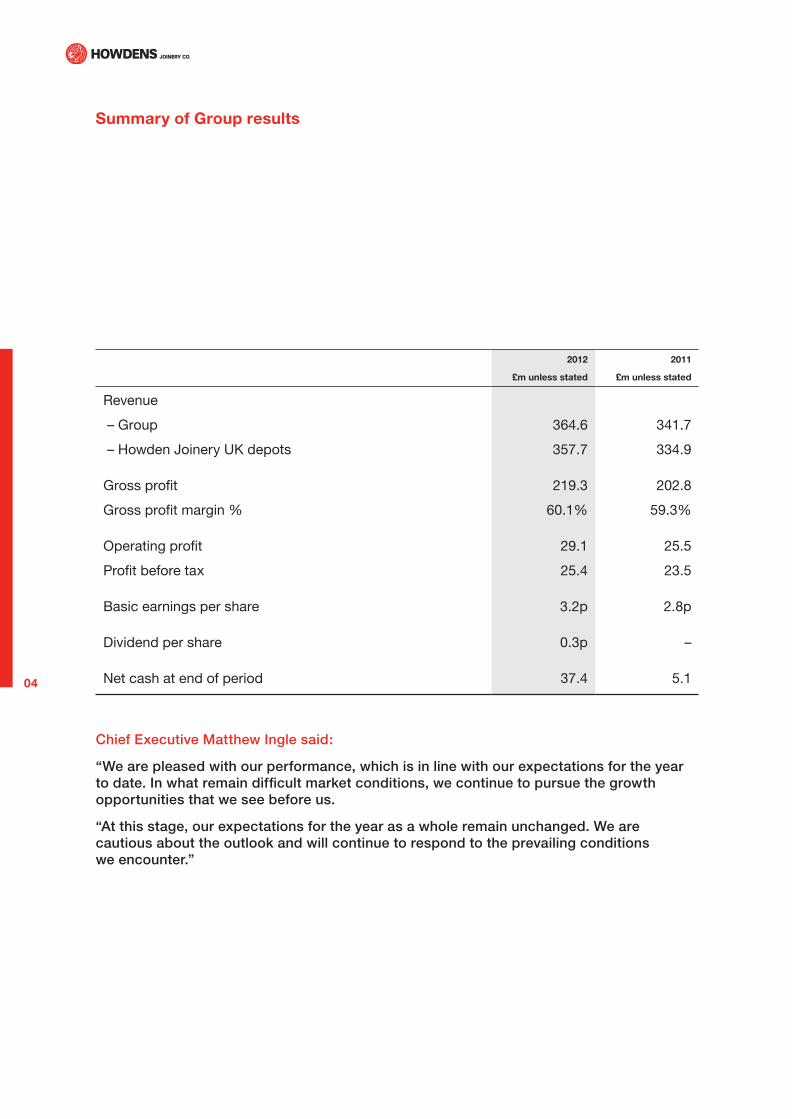
summary of Group results
2012
£m unless stated
2011
£m unless stated
Revenue
– Group 364.6 341.7
– Howden Joinery UK depots 357.7 334.9
Gross profit 219.3 202.8
Gross profit margin % 60.1% 59.3%
Operating profit 29.1 25.5
Profit before tax 25.4 23.5
Basic earnings per share 3.2p 2.8p
Dividend per share 0.3p –
Net cash at end of period 37.4 5.1
Chief Executive Matthew Ingle said:
“We are pleased with our performance, which is in line with our expectations for the year to date. In what remain difficult market conditions, we continue to pursue the growth opportunities that we see before us.
“At this stage, our expectations for the year as a whole remain unchanged. We are cautious about the outlook and will continue to respond to the prevailing conditions we encounter.”

05
Howden Joinery Group Plc Half-yearly report for the 24 weeks ended 9 June 2012
interim management report
Financial resulTs For FirsT HalF oF 2012
The financial results of the Group during the first half of 2012 benefited from the Group’s competitive position and actions taken to improve performance.
Total Group revenue increased by £22.9m to £364.6m.
revenue
2012
£m
2011
£m
Group 364.6 341.7
comprising:
Howden Joinery UK depots 357.7 334.9
Howden Joinery French depots 6.9 6.8
Howden Joinery UK depots’ revenue rose by 6.8%, increasing 5.0% on a same depot basis.
In demanding market conditions, this growth has been achieved through a number of factors and is a testament to the strength of our business model. The increase in the growth rate compared with that seen in 2011 reflects the initiation of a price rise in late February. This was earlier than the price rise in 2011, which occurred in the second half of June and which has also benefited the comparative sales performance so far this year. In addition, the number of customer accounts has continued to increase.
Sales by our French depots of £6.9m were up over 5% in constant currency terms.
Gross profit rose by £16.5m to £219.3m, with a gross profit margin of 60.1% (2011: 59.3%).
Selling and distribution costs and administrative and other expenses increased by £12.9m to £190.2m. This reflects the costs of new depots, additional staffing in existing depots and the impact of inflation, particularly on payroll costs.
Operating profit increased by £3.6m to £29.1m.
The net interest charge increased by £1.7m to £3.7m, reflecting the increased finance expense in respect of pensions. The net result was that profit before tax rose by £1.9m to £25.4m.
The tax charge on profit before tax was £5.6m, based on the estimated effective rate of tax on profit before tax for the 2012 financial year of 22.0%. This tax rate reflects the impact of the change in the corporation tax rate on the deferred tax asset relating to pensions.
Basic earnings per share were 3.2p (2011: 2.8p).
At 9 June 2012, the pension deficit shown on the balance sheet was £122.1m (24 December 2011: £136.9m). The decrease in the deficit in the period was largely driven by the Company’s contribution (£20.1m), made as part of the 2009 agreement to clear the actuarial deficit.
There was a net cash outflow from operating activities of £15.5m.
The financial results of the Group during the first half of 2012 benefited from the Group’s competitive position and actions taken to improve performance.
Gross profit rose by £16.5m to £219.3m, with a gross profit margin of 60.1% (2011: 59.3%).

06
interim management report continued
This included payments relating to legacy properties totalling £13.9m and a cash contribution to the Group’s pension schemes, in excess of the operating charge, of £20.1m.
Excluding legacy property payments, underlying working capital increased by £10.4m. Within this, debtors at the end of the period were £24.6m higher than at the beginning of the year. Offsetting this, stock levels were £6.0m lower and creditors increased by £8.2m.
Also included within net cash flows from operating activities was tax paid totalling £9.0m.
Payments to acquire fixed and intangible assets totalled £6.5m (2011: £7.9m).
Reflecting the above, there was a £19.7m net cash outflow in the first half of the year, the Group having net cash at the end of the period of £37.4m (24 December 2011: £57.1m net cash, 11 June 2011: £5.1m net cash). Excluding payments in respect of legacy properties and the contribution to the pension deficit, there was a cash inflow of £14.3m.
dividendIn setting the level of dividend the Board takes into account of a number of factors, including its desire to signal its confidence in the longer term prospects of the business and to reward shareholders. It is the Board’s aim to have a progressive dividend policy. Additionally, the Board will seek to ensure that the Group maintains an appropriate capital
structure in the future, taking into account the working capital cycle.
In the nearer term, the Board expects to target a prudent level of cover, taking into account: the opportunities we see to invest in the growth of the business, through the opening of new depots and investment in our UK manufacturing operations and the funding of deals to terminate leases on legacy properties, all of which should deliver good returns; the need to contribute to the legacy pension deficit; and our desire to maintain a strong balance sheet given prevailing economic conditions, all of which the Board believes to be in the best interest of shareholders.
In respect of the relative scale of interim and final dividends, the Board currently expects that the interim dividend will be between one-fifth and one-third of the total dividend for the year.
Reflecting this, the Board has approved the payment of an interim dividend of 0.3p per share (2011: nil). It will be paid on 30 November 2012 to shareholders on the register at close of business on 2 November 2012.
oPeraTional revieW
The business model of Howden Joinery is “To supply from local stock nationwide the small builder’s ever-changing routine kitchen and joinery requirements, assuring no- call-back quality and best local price”.
In July 2010, in our Half-Yearly Report, we said that the opportunity to transform the scale of the
The Board will seek to ensure that the Group maintains an appropriate capital structure in the future, taking into account the working capital cycle.

07
Howden Joinery Group Plc Half-yearly report for the 24 weeks ended 9 June 2012
business was apparent and that as the performance of the business was improving and legacy issues were diminishing, we were stepping up investment in the future growth of Howden.
Since then, this investment in growth has seen not only a step- up in capital expenditure but also increased expenditure in a number of other areas, and we have continued with this in the first half of 2012.
depot networkEight new depots have been opened in the UK so far this year, bringing the total to 517. A number of other depots are at various stages of the acquisition/shopfitting process.
In France, we have opened one new depot in Amiens, to bring the total to 11, and we are progressing one other in Le Havre.
Product and marketingWe continue to enhance our product offering, having introduced a number of new products in the first half of the year across all of our product categories. Notable amongst these are: three new kitchen ranges – grey options in our integrated handle and Greenwich ranges, and a gloss grey option in our Burford range; seven new square-edged worktops; significant changes to our sinks category; and a range of black appliances.
To support our kitchen designers, we have begun trials of a ‘virtual showroom’ in a small number of depots. When working with our builder-customers’ clients in our depots, this allows kitchen designs
to be projected on to a wall in the depot in a large high definition format, as well as showing other material designed to support product sales.
In addition to updating our extensive product literature, we have introduced a wider format Joinery brochure and a new Hardware catalogue.
manufacturing and logistics operationsThe £20m two-year programme of investment in new production facilities at our two manufacturing sites is progressing to plan. At Runcorn, the first of the three lines that make up the new facility at the site is being commissioned.
We have also introduced ‘in-cab’ technology throughout our delivery truck fleet. This allows us to better monitor all aspects of the fleet’s operations, helping us improve operational efficiency and improving the service to our depots.
GrouP develoPmenTs
legacy propertiesThe Group continues to reduce its legacy property portfolio.
Since the release of the Interim Management Statement, on 26 April 2012, the leases of a further two properties have been terminated, at a cost of £4.0m. This means that the leases of five properties have been terminated so far this year, at a cost of £11.7m (all of which was incurred in the first half of the year), mitigating future liabilities that would have totalled over £27m.
Eight new depots have been opened in the UK so far this year, bringing the total to 517.

08
interim management report continued
As a result, the number of legacy properties now stands at 16, compared with 21 at the end of 2011. Included within this are eight properties that are fully or partly occupied by tenants.
The profile of properties remaining and the net annual rent and rates (current values) for the associated leases going forward, before any further mitigating action is taken, is shown in the table below.
Estimated future costs associated with these properties were provided for in previous years.
Pension scheme funding and banking arrangementsAs recently announced, the Group has reached agreement with the Trustees of its defined benefit pension scheme in relation to the schedule of payment towards the funding of the scheme’s deficit for the three years ending 5 April 2015. Under the agreement, the Group’s contributions to the pension deficit are expected to be £35m per annum.
As also announced, the Group has reached agreement to extend its existing £160m committed bank facility until July 2016.
currenT TradinG and ouTlooK
Howden Joinery UK depot total sales fell by 0.9% in the first four weeks of the second half of 2012. This was against a strong comparator, sales in the same period in 2011 (which increased by 10.5%) having included the benefit of a price rise being initiated, with some associated pull-through effect on sales.
For the remainder of 2012, the key risk to performance is the challenging market conditions we face and the continuing uncertainty surrounding the general economic environment, in the light of which we remain cautious about the outlook. We also continue to see some pressure on product input costs.
At this stage, our expectations for the year remain unchanged.
We will continue to invest in the longer-term growth and development of the business. However, as in recent years, we will continue to manage the business flexibly in light of economic conditions.
GoinG concern
The Group meets its day-to-day working capital requirements through an asset-backed lending facility of £160m. As announced on 18 June 2012, this facility has been extended until July 2016, having previously run to May 2014. The current economic conditions create uncertainty, particularly over (a) the level of demand for the Group’s products and, (b) the exchange rate between sterling and both the Euro and the US Dollar, which would affect the cost of the Group’s operations.
The Group’s forecasts and projections have been stress-tested for reasonably possible adverse variations in trading performance. The results of this testing show that the Group should be able to operate within the level of its current facility and covenants.
After making due enquiries, the directors have a reasonable expectation that the Company and the Group have adequate resources to continue in operational existence for the foreseeable future. Accordingly, they continue to adopt the going concern basis in
as at 31 december
legacy Properties current 2012 2014 2019 2024
Number of properties1 16 16 8 6 2
Net annual rent and rates, £m2 4.9 4.9 2.3 2.3 0.23
1. Vacant and tenanted.
2. Gross rent & rates less payments by tenants.
3. The remaining leases all expire during the course of 2025.
09
Howden Joinery Group Plc Half-yearly report for the 24 weeks ended 9 June 2012
preparing the half-yearly condensed financial statements.
relaTed ParTies
Related party transactions are disclosed in note 14 to the condensed set of financial statements. There have been no material changes to the related party transactions described in the last Annual Report.
risKs and uncerTainTies
The Board continually assesses and monitors the key risks of the business. The principal risks and uncertainties that could have a material impact on the Group’s performance over the remaining 29 weeks of the financial year have not changed from those which are set out in detail on pages 23 to 25 of the Group’s 2011 Annual Report, and which are summarised below:
• Market conditions – a severe downturn in market conditions could put pressure on our ability to meet sales and profit forecasts, which in turn could put pressure on cash availability and banking covenants
• Failure to implement the Group’s business model and culture –could have a severe affect on the Group’s future financial condition and profitability
• Failure to maximise exploiting the growth potential of the businesses – could adversely affect the Group’s ability to obtain
maximum benefit from its growth potential
• Continuity of supply – could adversely affect the Group’s ability to implement the business model
• Loss of key personnel – could adversely affect the Group’s operations
• Input price pressure – could adversely affect profitability
• Financial position – if it were to deteriorate significantly, this could limit the financial resources available to fund the growth and development of the business
A copy of the Group’s 2011 Annual Report is available on the Group’s website, www.howdenjoinerygroupplc.com.
cauTionarY sTaTemenT
Certain statements in this Half-Yearly Report are forward-looking. Although the Group believes that the expectations reflected in these forward-looking statements are reasonable, we can give no assurance that these expectations will prove to have been correct. Because these statements contain risks and uncertainties, actual results may differ materially from those expressed or implied by these forward-looking statements. We undertake no obligation to update any forward-looking statements whether as a result of new information, future events or otherwise.
resPonsiBiliTY sTaTemenT
We confirm that to the best of our knowledge:
(a) the condensed set of financial statements has been prepared in accordance with IAS 34 ‘Interim Financial Reporting’;
(b) the interim management report includes a fair review of the information required by DTR 4.2.7R (indication of important events during the first 24 weeks and description of principal risks and uncertainties for the remaining 29 weeks of the year); and
(c) the interim management report includes a fair review of the information required by DTR 4.2.8R (disclosure of related parties’ transactions and changes therein).
The directors are responsible for the maintenance and integrity of the corporate and financial information included in the Company’s website. Legislation in the United Kingdom governing the preparation and dissemination of financial information differs from legislation in other jurisdictions.
By order of the Board
matthew ingle chief executive
mark robsonchief Financial officer
18 July 2012
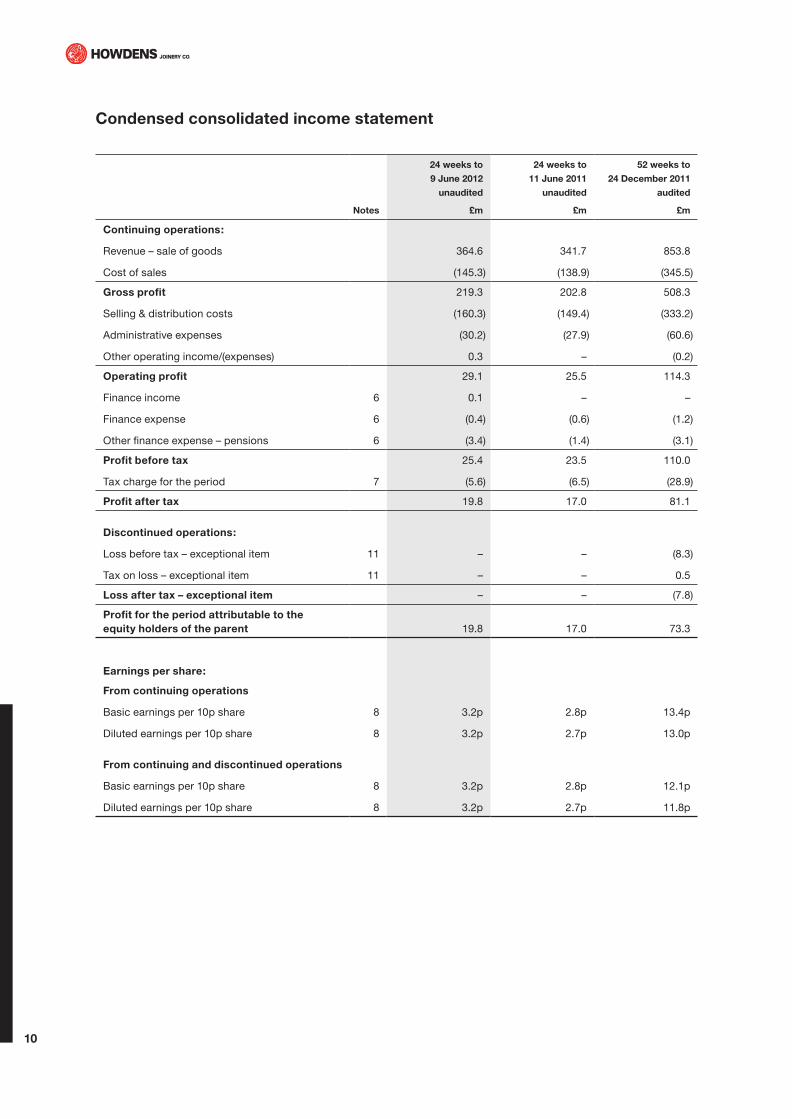
condensed consolidated income statement
notes
24 weeks to
9 June 2012
unaudited
£m
24 weeks to
11 June 2011
unaudited
£m
52 weeks to
24 december 2011
audited
£m
continuing operations:
Revenue – sale of goods 364.6 341.7 853.8
Cost of sales (145.3) (138.9) (345.5)
Gross profit 219.3 202.8 508.3
Selling & distribution costs (160.3) (149.4) (333.2)
Administrative expenses (30.2) (27.9) (60.6)
Other operating income/(expenses) 0.3 – (0.2)
operating profit 29.1 25.5 114.3
Finance income 6 0.1 – –
Finance expense 6 (0.4) (0.6) (1.2)
Other finance expense – pensions 6 (3.4) (1.4) (3.1)
Profit before tax 25.4 23.5 110.0
Tax charge for the period 7 (5.6) (6.5) (28.9)
Profit after tax 19.8 17.0 81.1
discontinued operations:
Loss before tax – exceptional item 11 – – (8.3)
Tax on loss – exceptional item 11 – – 0.5
loss after tax – exceptional item – – (7.8)
Profit for the period attributable to the equity holders of the parent 19.8 17.0 73.3
earnings per share:
From continuing operations
Basic earnings per 10p share 8 3.2p 2.8p 13.4p
Diluted earnings per 10p share 8 3.2p 2.7p 13.0p
From continuing and discontinued operations
Basic earnings per 10p share 8 3.2p 2.8p 12.1p
Diluted earnings per 10p share 8 3.2p 2.7p 11.8p
10

Howden Joinery Group Plc Half-yearly report for the 24 weeks ended 9 June 2012
condensed consolidated statement of comprehensive income
notes
24 weeks to
9 June 2012
unaudited
£m
24 weeks to
11 June 2011
unaudited
£m
52 weeks to
24 december 2011
audited
£m
Profit for the period 19.8 17.0 73.3
items of other comprehensive income:
Actuarial (loss)/gain on defined benefit pension scheme 12 (1.9) 8.4 (31.4)
Deferred tax on actuarial loss/gain on defined benefit pension scheme 0.5 (2.2) 8.5
Deferred tax on share schemes 0.1 (0.3) 0.3
Effect of change in UK tax rate on deferred tax on cumulative actuarial loss (3.3) (2.8) (6.5)
Currency translation differences (0.1) (0.4) (0.3)
Other comprehensive income for the period (4.7) 2.7 (29.4)
Total comprehensive income for the period attributable to equity holders of the parent 15.1 19.7 43.9
11
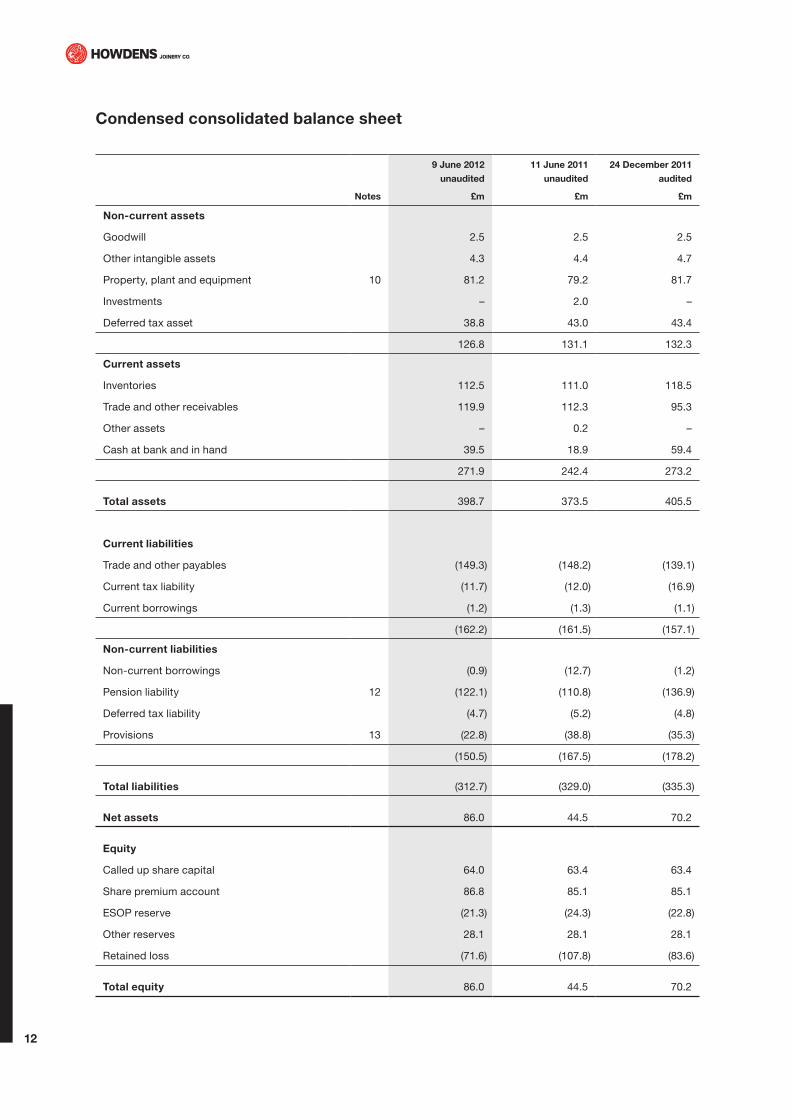
condensed consolidated balance sheet
notes
9 June 2012
unaudited
£m
11 June 2011
unaudited
£m
24 december 2011
audited
£m
non-current assets
Goodwill 2.5 2.5 2.5
Other intangible assets 4.3 4.4 4.7
Property, plant and equipment 10 81.2 79.2 81.7
Investments – 2.0 –
Deferred tax asset 38.8 43.0 43.4
126.8 131.1 132.3
current assets
Inventories 112.5 111.0 118.5
Trade and other receivables 119.9 112.3 95.3
Other assets – 0.2 –
Cash at bank and in hand 39.5 18.9 59.4
271.9 242.4 273.2
Total assets 398.7 373.5 405.5
current liabilities
Trade and other payables (149.3) (148.2) (139.1)
Current tax liability (11.7) (12.0) (16.9)
Current borrowings (1.2) (1.3) (1.1)
(162.2) (161.5) (157.1)
non-current liabilities
Non-current borrowings (0.9) (12.7) (1.2)
Pension liability 12 (122.1) (110.8) (136.9)
Deferred tax liability (4.7) (5.2) (4.8)
Provisions 13 (22.8) (38.8) (35.3)
(150.5) (167.5) (178.2)
Total liabilities (312.7) (329.0) (335.3)
net assets 86.0 44.5 70.2
equity
Called up share capital 64.0 63.4 63.4
Share premium account 86.8 85.1 85.1
ESOP reserve (21.3) (24.3) (22.8)
Other reserves 28.1 28.1 28.1
Retained loss (71.6) (107.8) (83.6)
Total equity 86.0 44.5 70.2
12

Howden Joinery Group Plc Half-yearly report for the 24 weeks ended 9 June 2012
condensed consolidated statement of changes in equity
called
up share
capital
£m
share
premium
account
£m
esoP
reserve
£m
other
reserves
£m
retained
loss
£m
Total
£m
24 weeks to 9 June 2012
As at 24 December 2011 – audited 63.4 85.1 (22.8) 28.1 (83.6) 70.2
Accumulated profit for the period – – – – 19.8 19.8
Dividend declared – – – – (3.1) (3.1)
Net actuarial loss on defined benefit pension scheme – – – – (1.4) (1.4)
Currency translation differences – – – – (0.1) (0.1)
Net movement in ESOP – – 1.5 – – 1.5
Issue of new shares 0.6 1.7 – – – 2.3
Deferred tax on share schemes – – – – 0.1 0.1
Effect of change in UK tax rate on deferred tax on cumulative actuarial loss – – – – (3.3) (3.3)
As at 9 June 2012 – unaudited 64.0 86.8 (21.3) 28.1 (71.6) 86.0
During the current period, the Group issued 6,325,814 shares.
24 weeks to 11 June 2011
As at 25 December 2010 – audited 63.4 85.1 (26.0) 28.1 (127.5) 23.1
Accumulated profit for the period – – – – 17.0 17.0
Net actuarial gain on defined benefit scheme – – – – 6.2 6.2
Currency translation differences – – – – (0.4) (0.4)
Net movement in ESOP – – 1.7 – – 1.7
Deferred tax on share schemes – – – – (0.3) (0.3)
Effect of change in UK tax rate on deferred tax on cumulative actuarial loss – – – – (2.8) (2.8)
As at 11 June 2011 – unaudited 63.4 85.1 (24.3) 28.1 (107.8) 44.5
During the period above, the Group did not issue any shares.
52 weeks to 24 december 2011
As at 25 December 2010 63.4 85.1 (26.0) 28.1 (127.5) 23.1
Accumulated profit for the period – – – – 73.3 73.3
Net actuarial loss on defined benefit scheme – – – – (22.9) (22.9)
Currency translation differences – – – – (0.3) (0.3)
Net movement in ESOP – – 3.2 – – 3.2
Deferred tax on share schemes – – – – 0.3 0.3
Effect of change in UK tax rate on deferred tax on cumulative actuarial loss – – – – (6.5) (6.5)
As at 24 December 2011 – audited 63.4 85.1 (22.8) 28.1 (83.6) 70.2
During the period above, the Group did not issue any shares.
13

condensed consolidated cash flow statement
notes
24 weeks to
9 June 2012
unaudited
£m
24 weeks to
11 June 2011
unaudited
£m
52 weeks to
24 december 2011
audited
£m
net cash flows (used in)/from operating activities 15 (15.5) (21.5) 40.2
cash flows from investing activities
Interest received 0.1 – –
Payments to acquire property, plant and equipment, and intangible assets (6.5) (7.9) (19.6)
Receipts from sale of property, plant and equipment, and intangible assets 0.4 – –
Repayment of investment – – 2.0
net cash used in investing activities (6.0) (7.9) (17.6)
cash flows from financing activities
Interest paid (0.2) (0.5) (1.0)
Receipts from release of shares from share trust – – 0.5
Issue of new shares 2.3 – –
(Decrease)/increase in loans (0.5) 10.4 (1.1)
Repayment of capital element of obligations under finance leases – (0.2) (0.4)
Decrease in other assets – – 0.2
net cash from/(used in) financing activities 1.6 9.7 (1.8)
net (decrease)/increase in cash and cash equivalents (19.9) (19.7) 20.8
Cash and cash equivalents at beginning of period 15 59.4 38.6 38.6
cash and cash equivalents at end of period 15 39.5 18.9 59.4
14

Howden Joinery Group Plc Half-yearly report for the 24 weeks ended 9 June 2012
notes to the condensed consolidated financial statements
1 General inFormaTion
The results for the 24 week periods ended 9 June 2012 and 11 June 2011 are unaudited but have been reviewed by the Group’s auditors, whose report on the current period forms part of this document. The information for the 52 week period ended 24 December 2011 does not constitute statutory accounts as defined in section 434 of the Companies Act 2006. A copy of the statutory accounts for that period has been delivered to the Registrar of Companies and is available via the Group’s website at www.howdenjoinerygroupplc.com. The auditor’s report on those accounts was not qualified or modified, did not draw attention to any matters by way of emphasis and did not contain statements under section 498(2) or (3) of the Companies Act 2006.
2 accounTinG Policies
The annual financial statements of Howden Joinery Group Plc are prepared in accordance with IFRSs as adopted by the European Union. The condensed consolidated set of financial statements included in this half-yearly financial report has been prepared in accordance with International Accounting Standard 34 ‘Interim Financial Reporting’, as adopted by the European Union.
Basis of preparationThe Group’s business activities, together with the factors likely to affect its future development, performance, and position are set out on pages 5 to 9, which include a summary of the Group’s financial position, its cash flows and borrowing facilities, and a discussion of why the directors consider that the going concern basis is appropriate.
The same accounting policies, presentation methods and methods of computation are followed in the condensed consolidated set of financial statements as applied in the Group’s latest annual audited financial statements, except that the taxation charge for the half-year is calculated by applying the annual estimated effective tax rate to the profit for the period.
adoption of new accounting standards in the current periodThere are no new accounting standards which are applicable to the Group in the current period.
3 seGmenTal resulTs
Basis of segmentationInformation reported to the Group’s Chief Executive is focused on one operating segment, Howden Joinery. Thus, the information required in respect of segmental disclosure can all be found in the condensed consolidated income statement and condensed consolidated balance sheet.
4 seasonaliTY oF revenue
Howden Joinery sales are more heavily weighted to the second half of the financial year. This partly reflects the fact that there are 24 weeks in the first half of the financial year and 29 weeks in the second half (2011: 28 weeks). It also reflects sales in the peak October trading period. In the last two financial years, approximately 60% of sales have been in the second half of the year.
5 WriTe doWn oF invenTories
During the period, the Group has recognised a net credit of £0.2m in respect of writing inventories down to their net realisable value (24 weeks to 11 June 2011–net credit of £0.5m, 52 weeks to 24 December 2011–net charge of £0.4m).
15

notes to the condensed consolidated financial statements continued
6 Finance income, Finance exPense and oTHer Finance exPense – Pensions
24 weeks to
9 June 2012
unaudited
£m
24 weeks to
11 June 2011
unaudited
£m
52 weeks to
24 december 2011
audited
£m
Finance income
Bank interest receivable 0.1 – –
Finance expense
Interest payable on bank loans (0.2) (0.5) (1.0)
Other interest (including finance lease interest) payable (0.1) – –
Finance charge on remeasuring creditors to fair value (0.1) (0.1) (0.2)
(0.4) (0.6) (1.2)
other finance expense – pensions
Pensions finance expense (3.4) (1.4) (3.1)
7 Tax
Tax for the 24 weeks to 9 June 2012 is charged at 22.0% (24 weeks to 11 June 2011: 27.6%), representing the best estimate of the average effective tax rate expected for the full year applied to the pre-tax income of the 24 week period.
16

Howden Joinery Group Plc Half-yearly report for the 24 weeks ended 9 June 2012
8 earninGs Per sHare
24 weeks to 9 June 2012
unaudited
24 weeks to 11 June 2011
unaudited
52 weeks to 24 december 2011
audited
earnings
£m
Weighted
average
number
of shares
m
earnings
per share
p
earnings
£m
Weighted
average
number
of shares
m
earnings
per share
p
earnings
£m
Weighted
average
number
of shares
m
earnings
per share
p
From continuing operations
Basic earnings per share 19.8 623.6 3.2 17.0 606.7 2.8 81.1 606.3 13.4
Effect of dilutive share options – 4.9 – – 15.6 (0.1) – 16.7 (0.4)
Diluted earnings per share 19.8 628.5 3.2 17.0 622.3 2.7 81.1 623.0 13.0
From discontinued operations
Basic earnings per share (7.8) 606.3 (1.3)
Effect of dilutive share options – 16.7 –
Diluted earnings per share (7.8) 623.0 (1.3)
From continuing and discontinued operations
Basic earnings per share 19.8 623.6 3.2 17.0 606.7 2.8 73.3 606.3 12.1
Effect of dilutive share options – 4.9 – – 15.6 (0.1) – 16.7 (0.3)
Diluted earnings per share 19.8 628.5 3.2 17.0 622.3 2.7 73.3 623.0 11.8
There were no discontinued operations in the current period or the 24 weeks to 11 June 2011.
17

notes to the condensed consolidated financial statements continued
9 dividends
Amounts were recognised as distributions to equity shareholders in the following period:
24 weeks to 9 June
2012
£m
24 weeks to 11 June
2011
£m
52 weeks to 24 dec
2011
£m
Final dividend for 52 weeks to 24 December 2011 – 0.5p per share 3.1 – –
No dividends were paid in the period or the comparative periods. The final dividend for the 52 weeks to 24 December 2011 was approved at the 2012 AGM, in May 2012, and was paid on 22 June 2012.
On 18 July 2012, the Board recommended an interim dividend for the 53 weeks to 29 December 2012 of 0.3p per share. This will be paid to shareholders on the register at close of business on 2 November 2012.
24 weeks to 9 June 2012
£m
24 weeks to 11 June 2011
£m
52 weeks to 24 dec 2011
£m
Proposed interim dividend for 53 weeks to 29 December 2012 – 0.3p per share 1.9 –
Proposed final dividend for 52 weeks to 24 December 2011 – 0.5p per share 3.1
10 ProPerTY, PlanT and equiPmenT
During the period, the Group spent £6.4m on additions to property, plant and equipment (24 weeks to 11 June 2011 – £7.9m; 52 weeks to 24 December 2011 – £18.5m). It also disposed of property, plant and equipment with a net book value of £0.1m (24 weeks to 11 June 2011 – £nil; 52 weeks to 24 December 2011 – £0.2m) for proceeds of £0.4m (24 weeks to 11 June 2011 – £nil; 52 weeks to 24 December 2011 – £nil).
There are non-cancellable commitments to purchase property, plant and equipment of £11.5m at the current period end (24 weeks to 11 June 2011 – £7.4m; 52 weeks to 24 December 2011 – £11.6m).
11 disconTinued oPeraTions
There were no discontinued operations in the current period or in the 24 weeks to 11 June 2011.
Discontinued operations in the 52 weeks to 24 December 2011 are shown below:
£m
Increase to property provision 7.7
Interest 0.6
Total exceptional item before tax 8.3
Tax on exceptional item (0.5)
Total exceptional item after tax 7.8
The increase to the property provision in the 52 weeks to 24 December 2011 related to future rent, rates, surrender fees and associated costs in respect of legacy properties. More details of the provision itself can be found at note 24 of the Group’s 2011 Annual Report. The original provision was created as a discontinued exceptional item in the 52 weeks to December 2008, and the events surrounding its creation are described in more detail on page 55 of the Annual Report for that period.
Interest relates to interest which would be payable if we lost a tax dispute with HM Revenue & Customs, relating to the legacy properties. The tax which is in dispute has already been provided for in prior periods.
18

Howden Joinery Group Plc Half-yearly report for the 24 weeks ended 9 June 2012
12 reTiremenT BeneFiT oBliGaTions
(a) Total amounts charged in respect of defined benefit pensions in the period
24 weeks to
9 June 2012
unaudited
£m
24 weeks to
11 June 2011
unaudited
£m
52 weeks to
24 december 2011
audited
£m
charged to the income statement
Defined benefit scheme – total operating charge 5.2 4.2 9.1
Defined benefit scheme – net finance charge 3.4 1.4 3.1
Total net amount charged to profit before tax 8.6 5.6 12.2
charged to equity
Defined benefit scheme – net actuarial losses/(gains) net of deferred tax 1.4 (6.2) 22.9
(b) other information – defined benefit pension schemeThe most recent actuarial valuation was carried out at 5 April 2011 by the scheme actuary. The actuary advising the Group has subsequently rolled forward the results of this valuation to 9 June 2012 and restated the results onto a basis consistent with market conditions at that date. The pension deficit has decreased over the 24 weeks ended 9 June 2012. The following summary information analyses the main changes in greater detail.
Key assumptions used in the valuation of the scheme
24 weeks to 9 June 2012
unaudited
%
24 weeks to 11 June 2011
unaudited
%
52 weeks to 24 december 2011
audited
%
Rate of increase of pensions in deferment capped at lower of CPI and 5% 1.75 2.80 2.95
Rate of CARE revaluation capped at lower of RPI and 3% 2.35 3.00 2.55
Rate of increase of pensions in payment:
– pensions with increases capped at the lower of CPI and 5% 3.05 2.80 2.95
– pensions with increases capped at the lower of CPI and 5%, with a 3% minimum 3.70 3.20 3.50
– pensions with increases capped at the lower of RPI and 2.5% 2.10 2.50 2.15
Rate of increase in salaries 4.05 4.50 4.35
Inflation assumption – RPI 3.05 3.50 3.35
Inflation assumption – CPI 2.05 2.80 2.65
Expected return on scheme assets (weighted average) 5.07 6.30 5.07
Discount rate 4.70 5.55 5.05
19

notes to the condensed consolidated financial statements continued
Balance sheetMovements in the deficit during the period are as follows:
24 weeks to
9 June 2012
unaudited
£m
24 weeks to
11 June 2011
unaudited
£m
52 weeks to
24 december 2011
audited
£m
Deficit at start of period (136.9) (135.7) (135.7)
Current service cost (5.2) (4.2) (9.1)
Employer contributions 25.3 22.1 42.4
Other finance charge (3.4) (1.4) (3.1)
Actuarial (losses)/gains gross of deferred tax (1.9) 8.4 (31.4)
Deficit at end of period (122.1) (110.8) (136.9)
statement of comprehensive incomeAmounts taken to equity via the statement of comprehensive income in respect of the Group’s defined benefit scheme are shown below:
24 weeks to
9 June 2012
unaudited
£m
24 weeks to
11 June 2011
unaudited
£m
52 weeks to
24 december 2011
audited
£m
Actuarial loss on scheme assets (2.6) (0.5) (18.5)
Actuarial gain/(loss) on scheme liabilities 0.7 8.9 (12.9)
Total actuarial (loss)/gain before tax (1.9) 8.4 (31.4)
13 Provisions
Property provision
£m
other provisions
£m
Total
£m
At 24 December 2011 – audited 33.0 2.3 35.3
Created in the period 1.0 1.4 2.4
Utilised in the period (13.9) (1.0) (14.9)
at 9 June 2012 – unaudited 20.1 2.7 22.8
The property provision covers onerous leases on any non-trading leased properties. For some properties, the provision is based on the shortfall between rent payable and rent receivable. For other properties, where negotiations to surrender the lease are in progress, the provision is based on the amount which the landlord has indicated that they are willing to take as a premium to surrender the lease. The provision is based on the period until the end of the lease, or until the Group considers that it can cover the shortfall by subletting, assigning or surrendering the lease. Throughout the course of the year, the Group reviews the range of options for unused properties and maintains ongoing discussions with landlords and external agents, with a view to identifying possible lease surrenders and finding tenants. The property provision also includes amounts for any related shortfalls in business rates on these properties, dilapidations, agents’ fees and other professional fees.
During the current period, the property provision has been increased by £0.1m arising from an unwinding of the discount rate over time. None of this amount relates to a change in the discount rate. This amount is shown as a finance charge in note 6. The amount of the expected future cash flows has been adjusted to reflect the expected range of possibilities and, as the outflows under this provision are expected to take place over a number or years, the provision has been discounted to its present value.
The timing of the outflows from the provision is variable, and is dependent on property lease expiry dates and opportunities to surrender leases.
Other provisions relate to amounts due in respect of warranties.20
Howden Joinery Group Plc Half-yearly report for the 24 weeks ended 9 June 2012
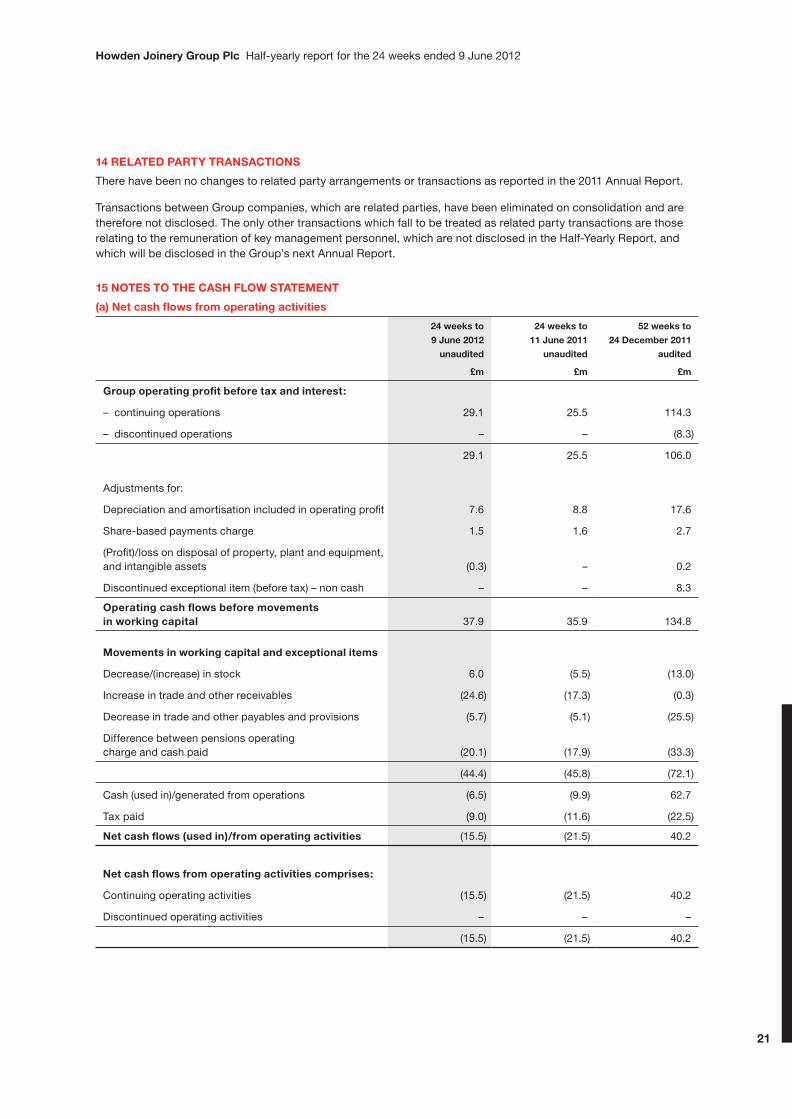
14 relaTed ParTY TransacTions
There have been no changes to related party arrangements or transactions as reported in the 2011 Annual Report.
Transactions between Group companies, which are related parties, have been eliminated on consolidation and are therefore not disclosed. The only other transactions which fall to be treated as related party transactions are those relating to the remuneration of key management personnel, which are not disclosed in the Half-Yearly Report, and which will be disclosed in the Group’s next Annual Report.
15 noTes To THe casH FloW sTaTemenT
(a) net cash flows from operating activities
24 weeks to
9 June 2012
unaudited
£m
24 weeks to
11 June 2011
unaudited
£m
52 weeks to
24 december 2011
audited
£m
Group operating profit before tax and interest:
– continuing operations 29.1 25.5 114.3
– discontinued operations – – (8.3)
29.1 25.5 106.0
Adjustments for:
Depreciation and amortisation included in operating profit 7.6 8.8 17.6
Share-based payments charge 1.5 1.6 2.7
(Profit)/loss on disposal of property, plant and equipment, and intangible assets (0.3) – 0.2
Discontinued exceptional item (before tax) – non cash – – 8.3
operating cash flows before movements in working capital 37.9 35.9 134.8
movements in working capital and exceptional items
Decrease/(increase) in stock 6.0 (5.5) (13.0)
Increase in trade and other receivables (24.6) (17.3) (0.3)
Decrease in trade and other payables and provisions (5.7) (5.1) (25.5)
Difference between pensions operating charge and cash paid (20.1) (17.9) (33.3)
(44.4) (45.8) (72.1)
Cash (used in)/generated from operations (6.5) (9.9) 62.7
Tax paid (9.0) (11.6) (22.5)
net cash flows (used in)/from operating activities (15.5) (21.5) 40.2
net cash flows from operating activities comprises:
Continuing operating activities (15.5) (21.5) 40.2
Discontinued operating activities – – –
(15.5) (21.5) 40.2
21

notes to the condensed consolidated financial statements continued
(b) reconciliation of movement in net funds
24 weeks to
9 June 2012
unaudited
£m
24 weeks to
11 June 2011
unaudited
£m
52 weeks to
24 december 2011
audited
£m
net funds at start of period 57.1 35.0 35.0
Net (decrease)/increase in cash and cash equivalents (19.9) (19.7) 20.8
Decrease in investments – – (0.2)
Decrease/(increase) in bank borrowings 0.5 (10.4) 1.1
(Increase)/decrease in finance leases (0.3) 0.2 0.4
net funds at end of period 37.4 5.1 57.1
represented by:
Cash and cash equivalents 39.5 18.9 59.4
Investments – 0.2 –
Bank loans (1.8) (13.8) (2.3)
Finance leases (0.3) (0.2) –
37.4 5.1 57.1
(c) analysis of net funds
cash and cash
equivalents
£m
Bank loans
£m
Finance leases
£m
net funds
£m
At 24 December 2011 – audited 59.4 (2.3) – 57.1
Cash flow (19.9) 0.5 (0.3) (19.7)
at 9 June 2012 – unaudited 39.5 (1.8) (0.3) 37.4
Closing bank loans at 9 June 2012 comprise £0.7m of non-current liabilities and £1.1m of current liabilities.
Closing finance leases at 9 June 2012 comprise £0.2m of non-current liabilities and £0.1m of current liabilities.
As previously disclosed, the Group’s debt facilities are due to expire in July 2016.
22

Howden Joinery Group Plc Half-yearly report for the 24 weeks ended 9 June 2012
independent review report to Howden Joinery Group Plc
We have been engaged by the Company to review the condensed set of financial statements in the half-yearly financial report for the 24 week period ended 9 June 2012, which comprises the income statement, the statement of comprehensive income, the balance sheet, the statement of changes in equity, the cash flow statement and related notes 1 to 15. We have read the other information contained in the half-yearly financial report and considered whether it contains any apparent misstatements or material inconsistencies with the information in the condensed set of financial statements.
This report is made solely to the Company in accordance with International Standard on Review Engagements (UK and Ireland) 2410 “Review of Interim Financial Information Performed by the Independent Auditor of the Entity” issued by the Auditing Practices Board. Our work has been undertaken so that we might state to the Company those matters we are required to state to it in an independent review report and for no other purpose. To the fullest extent permitted by law, we do not accept or assume responsibility to anyone other than the Company, for our review work, for this report, or for the conclusions we have formed.
direcTors’ resPonsiBiliTies
The half-yearly financial report is the responsibility of, and has been approved by, the directors. The directors are responsible for preparing the half-yearly financial report in accordance with the Disclosure and Transparency Rules of the United Kingdom’s Financial Services Authority.
As disclosed in note 2, the annual financial statements of the Group are prepared in accordance with IFRSs as adopted by the European Union. The condensed set of financial statements included in this half-yearly financial report has been prepared in accordance with International Accounting Standard 34, “Interim Financial Reporting,” as adopted by the European Union.
our resPonsiBiliTY
Our responsibility is to express to the Company a conclusion on the condensed set of financial statements in the half-yearly financial report based on our review.
scoPe oF revieW
We conducted our review in accordance with International Standard on Review Engagements (UK and Ireland) 2410, “Review of Interim Financial Information Performed by the Independent Auditor of the Entity” issued by the Auditing Practices Board for use in the United Kingdom. A review of interim financial information consists of making inquiries, primarily of persons responsible for financial and accounting matters, and applying analytical and other review procedures. A review is substantially less in scope than an audit conducted in accordance with International Standards on Auditing (UK and Ireland) and consequently does not enable us to obtain assurance that we would become aware of all significant matters that might be identified in an audit. Accordingly, we do not express an audit opinion.
conclusion
Based on our review, nothing has come to our attention that causes us to believe that the condensed set of financial statements in the half-yearly financial report for the 24 week period ended 9 June 2012 is not prepared, in all material respects, in accordance with International Accounting Standard 34 as adopted by the European Union and the Disclosure and Transparency Rules of the United Kingdom’s Financial Services Authority.
deloitte llPchartered accountants and statutory auditor, london
18 July 2012
23

2012
Interim Management Statement 8 November 2012
End of financial year 29 December 2012
2013
2012 Preliminary Results 28 February 2013
Interim Management Statement 2 May 2013
Half-Yearly Report 25 July 2013
Interim Management Statement 14 November 2013
End of financial year 28 December 2013
Financial calendar
24

Howden Joinery Group Plc Half-yearly report for the 24 weeks ended 9 June 2012
Howden Joinery Group Plc is the parent company of Howden Joinery. In the UK, Howden Joinery is engaged in the sale of kitchens and joinery products to trade customers, primarily small local builders, through 517 depots. Around one-third of the products it sells are manufactured in the company’s own factories in Runcorn, Cheshire, and Howden, East Yorkshire.
For more information about Howden Joinery, its products, philosophy and people, please visit www.howdens.com or our corporate website www.howdenjoinerygroupplc.com
25This report is printed on 140gsm Ability Offset

www.howdenjoinerygroupplc.com www.howdens.com
Half-yearly report for tHe 24 weeks ended 9 June 2012
to supply from local stock nationwide the small builder’s ever-changing routine kitchen and joinery requirements,
assuring no-call-back quality and best local price.
21886_Half Year Report Final_V2.indd 1 16/07/2012 17:08