to the people of pennsylvania - budget.pa.gov
TRANSCRIPT


�
To the People of Pennsylvania:
When I began my first term four years ago, I laid out a set of ambitious goals for improving the lives of Pennsylvania’s citizens. I am happy to report that, working with the members of the General Assembly, my administration has made tremendous progress in accomplishing those goals.
We have invested significantly in Pennsylvania’s children, with more than $1.8 billion of new funding for public education. We have helped revive the commonwealth’s economy with a $3 billion economic stimulus program that has touched all areas of the state, and we have improved state programs in workforce development and expanded funding for higher education. We have reaffirmed our stewardship of “Penn’s Woods” through a $625 million investment in the Growing Greener II initiative. And we have fulfilled my pledge to identify and eliminate waste in government, achieving annual savings of $1 billion in the operations of the commonwealth.
At the same time, we have maintained our commitment to protect our most vulnerable citizens by preserving the state’s social safety net. And we extended that commitment by expanding prescription drug coverage for senior citizens and by ensuring that all of Pennsylvania’s children will have access to health insurance.
As I begin my second term, I have an equally ambitious agenda – an Agenda for Pennsylvania Progress – that builds on the success we had during my first term.
I recently announced a key element of that agenda, the Prescription for Pennsylvania – a comprehensive initiative to increase access to affordable health care, improve the quality of care and bring soaring health care costs under control. Other elements of the agenda are equally important. In this year’s budget I call for major new strategic investments in education; in renewable and alternative energy development; in highway, bridge and mass transportation funding; and in continuing to grow an ever more competitive Pennsylvania economy.
I continue to be firmly committed to bringing property tax relief to all Pennsylvanians, and this year we will at last achieve this important goal. The budget I am proposing for 2007-08 contains $900 million in property tax relief that will become available in July of this year, benefiting senior citizens and every Pennsylvania homeowner.
As I begin my second term, I am deeply grateful for the opportunity to continue to work on your behalf for the betterment of this extraordinary state. Pennsylvania is poised for greatness on all fronts – from the development of a vibrant, 21st-century economy, to the education of our children for the jobs of the future, to continuing leadership in the production of renewable energy, to forward-thinking solutions to the pressing concerns of transportation funding, health care costs and the care of our most vulnerable residents.
I am as enthusiastic about helping Pennsylvania achieve its boundless potential as I was on my first day in office. We have accomplished much in the past four years, but much work remains to be done. This budget provides the resources and the blueprint to accomplish many of our most important objectives.
Sincerely
Edward G. Rendell
Commonwealth of Pennsylvania
offiCe of the Governor
harrisburG
the GovernorFebruary 6, 2007
�
A complete copy of the Governor’s Executive Budget, Budget in Briefand more budget information can be found on our web site
http://www.budget.state.pa.us–click Budget & Financial Reports–
Commonwealth of Pennsylvania
2007-08Budget in Brief

�
2007-08 Budget Overview ................................................................ 4
Agenda for Pennsylvania Progress .................................................. 5
2007-08 Budget Highlights ............................................................... 6
Property Tax Relief for Pennsylvania ................................................ 8
Education – Investing in Our Children to Prepare Them for the Future ................................................................................ 9
Energy Independence ...................................................................... 12
Making Pennsylvania More Competitive .......................................... 13
Pennsylvania’s Transportation System – Transit Bridges and Highways in Crisis .................................................... 16
Prescription for Pennsylvania ........................................................... 19
Long Term Living ............................................................................. 22
Caring for All Pennsylvanians .......................................................... 24
Public Safety – A Commonwealth Priority ........................................ 28
Emergency Preparedness ................................................................ 30
Making Government Work Smarter .................................................. 31
Pennsylvania’s Tax Structure ........................................................... 33
Budget Growth in Perspective .......................................................... 34
Impact of Federal Funding Cuts ....................................................... 35 2007-08 General Fund Revenues .................................................... 36
2007-08 Motor License Fund............................................................ 36
2007-08 General Fund Expenditures ............................................... 38 2007-08 General Fund Financial Statement..................................... 39
2007-08 Rainy Day Fund.................................................................. 39
The Economic Outlook for 2007-08 .................................................. 40
Capital Budget .................................................................................. 43
TABLE OF CONTENTS

�
Budget Overview
Total Operating Budget
General FundRevenues
General FundExpenditures
All Other Funds$6.9 B
General Fund$27.3 B
Federal Funds$17.5 B
Tobacco Settlement Fund$0.4 B
Motor License Fund$3.3 B
Lottery Fund$1.8 B
Augmentations & Fees$1.9 B
PersonalIncome Tax
37%
Sales & Use Tax34%
Non-Tax Revenues2%
Corporate Net Income/Capital Stock & Franchise Tax
12%
Gross Receipts Tax4%
Cigarette Tax3%
Other Taxes8%
PreK-12Education
34%
Higher Education7%
Debt Service3%
Medical Assistance19%
Corrections6%
Other DPW Human Services
Programs 17%
The total Fiscal Year 2007-08 operating budget, including all Commonwealth funds, is $59.1 billion. The General Fund represents 46 percent of this amount.Total
$59.1 Billion
All Other14%
$27.3 Billion

�
Agenda for Pennsylvania Progress
Reduce property taxes
Make needed investments in education: Improve our children’s academic performance so they can compete in the global economy
Implement the Prescription for Pennsylvania:Improve health care access, quality and affordability
Achieve greater energy independence
Partner with private industry to make Pennsylvania a strong competitor for jobs and business investment
Solve the transportation funding crisis: Provide adequate funding for highways, bridges and transit
Maintain the social safety net that protects the elderly, persons with disabilities, abused and neglected children, and others in need. Cope with federal cutbacks and unfunded federal mandates without setting back Pennsylvania’s progress
Continue to move people off welfare and into the labor force
Manage the growing prison population and reduce prison re-entry rates
Protect Pennsylvania’s natural beauty and maintain a clean, healthy environment for the next generation
•
•
•
•
•
•
•
•
•
•
�
The 2007-08 budget provides $900 million in property tax relief for Pennsylvania homeowners, invests in our children, promotes job creation, increases our state’s global competitiveness and preserves the social safety net that protects the elderly, people with disabilities and other Pennsylvanians in need.
The 2007-08 General Fund budget is $27.3 billion, an increase of $948 million, or 3.6 percent, over 2006-07.
In the 2007-08 General Fund budget, $544 million, or more than half, of the $948 million increase in General Fund expenditures is for Education.
The 2007-08 General Fund budget reduces spending by 3.6 percent in all areas other than Education, Public Welfare, Corrections, and Probation & Parole, while improving many vital state-supported services.
Administrative spending in 2007-08 is 2 percent below 2002-03 levels.
Since 2002-03, the federal government has cut $2 billion in funding for Pennsylvania, forcing the commonwealth to use state funds to replace lost federal funds. In 2007-08, federal cutbacks will cost the commonwealth nearly $720 million.
The 2007-08 budget re-invests savings realized through innovation and increased efficiency. By eliminating waste and improving government operations, the commonwealth has achieved more than $1 billion in annual recurring cost savings since Governor Rendell has taken office.
The 2007-08 budget reduces the commonwealth’s authorized complement by an additional 708 positions with no layoffs, furloughs or cutbacks in government services. Complement additions to several agencies in 2007-08 will ensure successful implementation of the Governor’s new initiatives while still achieving a net reduction of 2,811 positions since Governor Rendell took office.
2007-08 Budget Highlights2007-08 Budget Highlights
Making Pennsylvania More Competitive
Property Tax Relief –$900 million in 2007-08 property tax relief for homeowners.
Energy Independence Initiative – $850 million that will bring new clean energy companies and investment to Pennsylvania – saving $10 billion in energy costs over 10 years, creating new jobs and making the commonwealth more environmentally sustainable.
New Transportation Investments – $965 million of new investment to ensure smoother and safer roads and safer bridges. Also, $760 million to stabilize our public transit system.
Jonas Salk Legacy Fund: Accelerating Medical Research in Pennsylvania – $500 million of accelerated investments, which will leverage another $500 million in matching funds, to promote biomedical research in Pennsylvania.
Environment – Preserving the Hazardous Sites Cleanup Program –New fees on the disposal of municipal solid waste to provide sufficient revenue of $37.7 million in 2007-08 and $50.2 million annually thereafter to ensure that current and future site cleanups will go on and emergency response to hazardous materials incidents will continue.
Environment – Ensuring Continued Success of the Growing Greener Program –Increased municipal solid waste disposal fees dedicated to the Environmental Stewardship Fund to provide $8.4 million in 2007-08 and $11.2 million annually thereafter to contribute to debt service costs of the $625 million Growing Greener II environmental bond issue.
Business and Job Development – $22.5 million for multi-year grants, a $7.5 million increase, for new infrastructure and facility improvement projects.
�
Budget HighlightsEducation – Investing in Our Children to Prepare Them for the Future
PreK-12 Education – $9.3 billion in total funding for basic education, a $529 million, or 6 percent increase.
Basic Education Funding – $4.95 billion, nearly a 3.5 percent increase, to support PreK-12 education and to continue a foundation funding approach to assist school districts in reaching a research-based adequate funding level.
Special Education Funding – $1 billion in total, a 29.4 million, or 3 percent, increase.
Accountability Block Grant – $350 million, a $100 million increase. Provides an additional $75 million for PreK (see next item) and an additional $25 million for school districts to invest in full-day kindergarten programs by launching or expanding these essential early educational experiences across the commonwealth.
Pennsylvania Pre-K Counts – $75 million, as a new component to the Accountability Block Grant, so that 11,100 more children can get a vital early start to learning.
Classrooms for the Future – $90 million, a $70 million increase, to continue changing the way teachers teach and students learn in Pennsylvania high schools by putting a laptop on every student’s desk and using the power of the Internet to engage the Technology Generation and make learning come alive. Over 350 schools will benefit.
Science: It’s Elementary – $15 million, a 50 percent increase, to help nearly 50,000 more students in 85 school districts become active science explorers.
Project 720 – A total of $11 million, a 37 percent increase, to transform 30 additional Pennsylvania high schools by increasing the rigor of academic programs.
Dual Enrollment – A total of $10 million, a 25 percent increase, to help high school students earn college credit. High school students are taking nearly 10,000 college credit courses this year as a result of our first year investment of $8 million.
Caring for All Pennsylvanians
Public Safety – A Commonwealth Priority
Prescription for Pennsylvania – $255.3 million in state and federal funds to implement Prescription for Pennsylvania, a plan designed to increase access to affordable health care coverage for all Pennsylvanians, improve the quality of care delivered throughout the commonwealth, and help bring health care costs under control for employers and employees.
Cover All Pennsylvanians – A critical component of Prescription for Pennsylvania that will provide an affordable basic health insurance plan for small businesses and uninsured individuals. Cover All Pennsylvanians is projected to enroll 153,600 adults in 2007-08 growing to 431,300 adults in 2011-12.
Cover All Kids – Second-year funding to provide access to affordable, comprehensive health care coverage for all uninsured children in Pennsylvania. Provides $12.2
million in state funds and $20.5 million in federal funds to cover a total of 21,000 children.
Early Intervention – $292.8 million in state funds, an increase of $45.4 million or 18.4 percent, to serve 76,325 children birth to age 5 who are experiencing developmental delays. Early intervention services minimize the need for special education and related services and assist families in meeting the special needs of their children.
PACE Plus Medicare – $276.4 million in second-year funding for a comprehensive state pharmaceutical benefit that complements Medicare Part D and ensures that PACE enrollees will not incur an increase in out-of-pocket costs, with funding to enable an additional 32,000 people to be served by PACE for a total of 357,725 by June 2008.
State Police – Provides funding for the highest number ever of state troopers in the commonwealth. By September 2008 there will be 4,660 troopers serving Pennsylvanians.
Corrections and Probation & Parole – Provides $198.6 million, a 13 percent increase, in new funding to address continuing increases in the inmate and post-incarceration population, and to reduce the growth. In December
2006, Pennsylvania’s inmate population was 44,365, 1,231 more than a year before. The prison population is projected to grow to nearly 51,000 inmates by July, 2011 without corrective action.
First Responders – $25 million for the Volunteer Company Grants program from the State Gaming Fund.
Pandemic and Avian Flu Preparedness – $14 million to purchase and store antiviral medications.

�
Tax Year 2006 Old PTRR AdditionalClaimants
Total NewPTRR
Homeowners 169,808 409,179 578,987Renters 167,309 10,745 178,054Total 337,116 419,924 757,040
Tax Year 2007 Old PTRR AdditionalClaimants
Total NewPTRR
Homeowners 169,393 411,558 580,951Renters 169,563 10,504 180,067Total 338,956 422,062 761,018
prescription drugs. This makes the sales tax more fair, and it is the reason that currently Pennsylvanians pay 10 percent less in sales tax per person than the average American.
The expanded Property Tax and Rent Rebate program includes 422,100 more senior citizens at a total cost of $254 million. The program adds 411,600 homeowners who will receive $223.3 million in additional rebates, and 10,500 renters who will receive $31.2 million in additional rebates.
Delivering Urgent Tax Reform and Property Tax Relief
• $900 million in property tax relief. This budget builds on the historic property tax relief enacted last year by increasing the sales tax one percent, with half of this revenue dedicated to reducing property taxes and the other half set aside for critical public services.
• The 2006 Taxpayer Relief Act – also known as Special Session Act 1 – put in place a delivery system for property tax relief. New sales tax revenue can therefore be added to gaming revenue and distributed using the same formula approved by the legislature last June. When fully in place, this tax shift will cut property taxes by more than $750 million each year, above and beyond gaming revenues.
• Using the sales tax to further reduce property taxes will make it possible to deliver the first Pennsylvania property tax cuts (and wage tax reductions in Philadelphia) in 2007-08 – a year sooner than previously estimated. These property tax cuts will average close to $170 for every Pennsylvania household.
• In just the first year, $900 million in total tax relief is possible, resulting in a decrease in property taxes of nearly 9 percent.
• In two years, when property tax relief is estimated to reach $1.4 billion, statewide property taxes could drop by as much as 12 percent.
Although Pennsylvania’s sales tax rate will increase to seven percent, Pennsylvania residents will continue to pay far less per person in sales tax than residents of at least 19 other states – including Florida, California and Michigan. Unlike many other states with sales taxes, Pennsylvania does not tax essential purchases such as food, clothing and
Property Tax Relief for Pennsylvania
Pennsylvania can become even more competitive in attracting businesses and residents by taking action in 2007-08 to further decrease the property tax burden on homeowners.
Estimated Property Tax ReliefType of Tax Relief Amount of Tax Relief
in 2007-08Amount of Tax Relief
in 2008-09Amount of Tax Relief
in 2009-10Property tax relief for all homeowners from gaming revenue and the new sales tax shift (wage tax relief in Philadelphia)
$643 million $652 million $1,192 million
Enhanced property tax rebates of up to $650 for senior citizens earning up to $35,000 a year $199 million $ 198 million $194 million
Higher rebates for senior citizens with a high tax burden or those living in cities with a high tax burden
$58 million $58 million $58 million
TOTAL $900 million $908 million $1,444 million
The 2007-08 Budget Moves Relief Up a Year and Will Provide$900 Million in Property Tax Relief this Summer
Property Tax – Rent Rebate Programfor Senior Citizens
• More than $250 million of the $1 billion from gaming will go to seniors with incomes under $35,000 to help them pay their property tax bills.
• Nearly 600,000 Pennsylvania seniors will benefit from higher state rebates or will be added to the state rebate program for the first time by increasing the maximum income limit to $35,000 (which excludes half of Social Security income) and raising the top rebate to $650.
• An estimated 155,000 senior citizens will have their school property taxes completely eliminated.

�
Pennsylvania is making important progress in preparing the next generation of leaders, entrepreneurs and innovators. Over the last four years, the commonwealth increased its investment in PreK-12 education by $1.8 billion and student achievement has shown a parallel boost. From 2003 to 2005, Pennsylvania was one of only seven states to make progress on elementary school reading and math. Today, two out of three students in Pennsylvania are on grade level in these core subjects – and we are building the support system needed to help every child in our commonwealth to succeed.
To make student success possible, the commonwealth is making targeted investments in its pre-kindergarten through grade 12 and higher education systems. First, every child – regardless of family income, background or any other factor – needs to master the early literacy and math skills that serve as a portal to future achievement in school and in life. Early childhood education, starting with high-quality pre-kindergarten, is the proven strategy for reaching this goal. Second, our schools need to continue transforming with the times so that when Pennsylvania students graduate from high school, they are ready for the high-tech, high-skills economy that will await them. That is why the commonwealth must provide the leadership and resources needed to ensure that a Pennsylvania high school diploma is a ticket to postsecondary opportunity.
Early Childhood Education: The Foundation for Student SuccessIn 2004-05, Pennsylvania made its first investment in
pre-kindergarten by providing funding for Head Start and launching the $200 million Accountability Block Grant, which school districts could use for pre-kindergarten and other proven academic programs. As of 2006-07, the Commonwealth is investing nearly $56 million for pre-kindergarten through these programs – providing quality early learning experiences to more than 10,000 additional children. Now is the time for Pennsylvania to build on that investment.
• Pennsylvania Pre-K Counts. This budget launches the $75 million Pennsylvania Pre-K Counts program as a new component of the Accountability Block Grant so that 11,100 more children can get a vital early start
Education - Investing in Our Children to Prepare Them for the FutureIn today’s global economy, Pennsylvania is competing not only against other states but also against other countries like China, Singapore and India. To ensure economic success for our future workforce and for our state, the commonwealth must provide all of its students with solid critical thinking skills and strong backgrounds in reading, math and science.
to learning. School districts, Head Start programs and other community providers with proven track records of success will be able to apply for these resources. Children from every part of the commonwealth will have new opportunities for early learning as a result of this investment – with the greatest focus on children who are at risk of future academic failure. This program grows out of a successful public-private partnership of the same name supported by corporate, foundation and public sector leaders.
• Head Start Supplemental Assistance Program. For the last three years, Pennsylvania has supplemented federal Head Start funding so the successful program can reach more families. In 2007-08, the commonwealth will maintain its $40 million funding level for the Head Start Supplemental Assistance Program – making it possible to enroll 5,790 three and four year olds.
• Early Intervention. The Early Intervention program serves children from birth through age five who have a disability or developmental delay. This budget provides $292.8 million in state funds, an increase of $45.4 million or 18.4 percent, to serve 76,325 children birth to age 5 who are experiencing developmental delays. Early intervention services minimize the need for special education and related services and assist families in meeting the special needs of their children.
�0
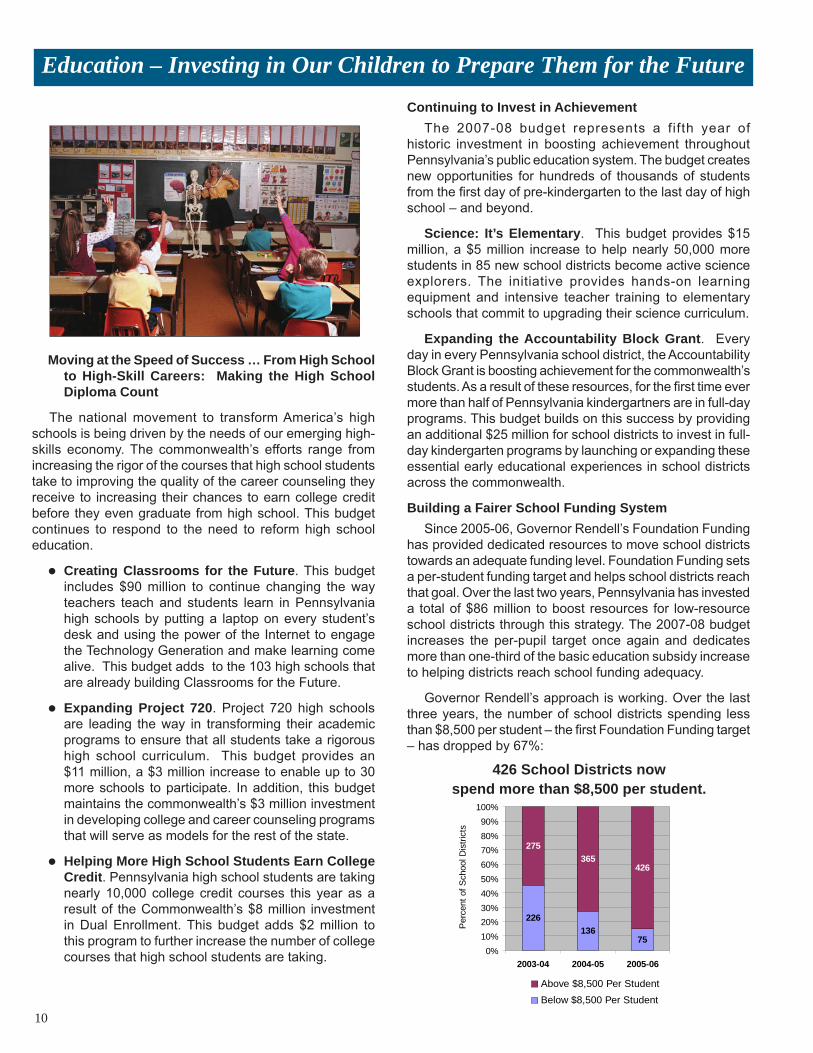
226136
75
275365
426
0%
10%
20%
30%
40%
50%
60%
70%
80%
90%
100%
2003-04 2004-05 2005-06
Above $8,500 Per Student
Below $8,500 Per Student
Per
cent
of S
choo
l Dis
tric
ts
Education – Investing in Our Children to Prepare Them for the Future
Moving at the Speed of Success … From High School to High-Skill Careers: Making the High School Diploma Count
The national movement to transform America’s high schools is being driven by the needs of our emerging high-skills economy. The commonwealth’s efforts range from increasing the rigor of the courses that high school students take to improving the quality of the career counseling they receive to increasing their chances to earn college credit before they even graduate from high school. This budget continues to respond to the need to reform high school education.
• Creating Classrooms for the Future. This budget includes $90 million to continue changing the way teachers teach and students learn in Pennsylvania high schools by putting a laptop on every student’s desk and using the power of the Internet to engage the Technology Generation and make learning come alive. This budget adds to the 103 high schools that are already building Classrooms for the Future.
• Expanding Project 720. Project 720 high schools are leading the way in transforming their academic programs to ensure that all students take a rigorous high school curriculum. This budget provides an $11 million, a $3 million increase to enable up to 30 more schools to participate. In addition, this budget maintains the commonwealth’s $3 million investment in developing college and career counseling programs that will serve as models for the rest of the state.
• Helping More High School Students Earn College Credit. Pennsylvania high school students are taking nearly 10,000 college credit courses this year as a result of the Commonwealth’s $8 million investment in Dual Enrollment. This budget adds $2 million to this program to further increase the number of college courses that high school students are taking.
Continuing to Invest in AchievementThe 2007-08 budget represents a fifth year of
historic investment in boosting achievement throughout Pennsylvania’s public education system. The budget creates new opportunities for hundreds of thousands of students from the first day of pre-kindergarten to the last day of high school – and beyond.
Science: It’s Elementary. This budget provides $15 million, a $5 million increase to help nearly 50,000 more students in 85 new school districts become active science explorers. The initiative provides hands-on learning equipment and intensive teacher training to elementary schools that commit to upgrading their science curriculum.
Expanding the Accountability Block Grant. Every day in every Pennsylvania school district, the Accountability Block Grant is boosting achievement for the commonwealth’s students. As a result of these resources, for the first time ever more than half of Pennsylvania kindergartners are in full-day programs. This budget builds on this success by providing an additional $25 million for school districts to invest in full-day kindergarten programs by launching or expanding these essential early educational experiences in school districts across the commonwealth.
Building a Fairer School Funding SystemSince 2005-06, Governor Rendell’s Foundation Funding
has provided dedicated resources to move school districts towards an adequate funding level. Foundation Funding sets a per-student funding target and helps school districts reach that goal. Over the last two years, Pennsylvania has invested a total of $86 million to boost resources for low-resource school districts through this strategy. The 2007-08 budget increases the per-pupil target once again and dedicates more than one-third of the basic education subsidy increase to helping districts reach school funding adequacy.
Governor Rendell’s approach is working. Over the last three years, the number of school districts spending less than $8,500 per student – the first Foundation Funding target – has dropped by 67%:
426 School Districts nowspend more than $8,500 per student.

��
In addition, this budget provides:
• $166.7 million increase for the basic education subsidy, an increase of nearly 3.5 percent, to support PreK-12 education and to continue a foundation funding approach to assist school districts in reaching a research-based adequate funding level.
• $29.4 million increase for special education, an increase of 3.0 percent.
Making Every Dollar Count for KidsShared Services. This budget provides $1 million so
that groups of school districts can engage a consultant to make non-binding recommendations on ways to better serve students and the public through shared services.
Statewide School Employee Health Benefits System. The Administration is also committed to achieving cost savings on behalf of students and taxpayers by implementing Governor Rendell’s proposal for a statewide school employee health benefits system. Combining the purchasing power of all 501 school districts to purchase health care for teachers and other staff members will slow the skyrocketing costs of health insurance while protecting the health care of those who serve in our public schools.
Retirement Benefits for School Employees. The commonwealth pays approximately half of the cost of providing retirement benefits for school employees. In 2007-08, the employer contribution rate is increasing from 6.46 percent of payroll to 7.13 percent. This increased rate raises the cost to the commonwealth by $83.4 million, a 22.6 percent increase, to a total of $452.2 million in 2007-08. School districts’ cost for retirement is increasing at the same rate.
School Breakfast and School Nutrition. Starting with the 2007-08 school year, any school where at least 20 percent of students are eligible for free or reduced-price lunch will be expected to offer breakfast to their students – a strategy similar to what is in place in the majority of states. Children in more than 400 additional schools will have access to breakfast once all eligible schools participate.
Higher EducationTechnical Colleges. This budget provides $2 million to
create new opportunities for postsecondary education and training in underserved regions in high-demand technical fields by launching the state’s first two Technical Colleges. The Technical Colleges will be located in parts of the state where students do not currently have access to affordable certificate and associate degree programs to prepare for high-skill technical occupations like engineering.
Key Higher Education Funding: (In Millions)
TOTAL FUNDING
3.5% for Community Colleges – Operating Costs ........................................ $ 229.4 – Capital Costs ............................................. 44.5
3.5% for the State System of Higher Education ......................................... $ 504.2
2.0% for the State-related Universities: – Pennsylvania State University .................. $ 332.9 – University of Pittsburgh ............................. 167.9 – Temple University ...................................... 172.9 – Lincoln University ...................................... 13.8
Non-State Related Universities and Colleges ................................................ $ 89.4
A Historic Investment in Libraries. Building a knowledge society demands a strong investment in our public libraries. This budget continues to increase library funding, bringing the state subsidy for local libraries to $75.8 million. This increase reaffirms Pennsylvania’s current standing as a national leader in state funding for libraries.
The 2007-08 budget continues to advance Pennsylvania’s commitment to its students and to the state’s economic well-being. These additional investments will move the commonwealth even closer to achieving educational success – and opening the doors of opportunity – for every Pennsylvanian.
Support for Public Libraries
2003-04 2007-08
Education – Investing in Our Children to Prepare Them for the Future
��
Energy Independence: Leading the Way to a Renewable Energy EconomyPennsylvania is home to some of the world’s leading renewable energy companies and is on track to produce 18 percent of all energy sold in the state from clean renewable sources by 2021. The commonwealth has proven that investment in renewable energy is an economic development strategy as well as a major step on the road towards energy independence. Strategic investments in the alternative energy sector over the last four years have helped the commonwealth become a leader in renewable energy production and use. It is time to expand Pennsylvania’s leadership in this vital emerging sector of the global economy.
“This plan will cut Pennsylvanians’ energy bills by $10 billion over the next 10 years and give us the ability to produce enough homegrown fuel to replace every
gallon Pennsylvania currently imports from the Persian Gulf.” – Governor Rendell
Energy Independence Initiative. $850 million initiative to bring new clean energy companies and investment to Pennsylvania – creating new jobs and making the commonwealth more environmentally sustainable. The Energy Independence Initiative targets biofuels, solar energy, renewable energy sources, clean coal technologies, energy efficiency and emerging technologies. The initiative will enable Pennsylvania to achieve three key goals:
• Save consumers $10 billion in energy costs over the next 10 years.
• Reduce Pennsylvania’s reliance on foreign fuels and increase Pennsylvania’s clean energy production capacity.
• Expand Pennsylvania’s energy production and energy technology sectors to create more jobs.
The Energy Independence Fund The Energy Independence Fund will support a
broad array of activities, including early stage financing and project financing, along with new incentives for energy conservation and solar energy. To fund these essential investments in Pennsylvania’s economy and energy security, the Pennsylvania Energy Development Authority will issue $850 million in bonds. Funding will come from a Systems Benefit Charge of 1/20th cent per kilowatt-hour of electricity consumption to support the Energy Independence Fund. For a cost of $0.45 per month for the average household, Pennsylvania will raise $75 million to invest in a “green” economic future.
The Energy Independence Strategy is expected to save consumers nearly 15 times more than the cost of this fee. The average residential customer is expected to save $73 per year, the average commercial customer $425 per year, and the average industrial customer $10,500 per year.
The Energy Initiative provides:
• $56 million for the Clean Energy Greenhouse. The program will help Pennsylvania translate its wealth of clean energy research and development into products that reach the marketplace.
• $50 million for the Clean Energy Venture Capital program. Venture capital turns clean energy concepts into viable employers. The commonwealth will make critical investments of between $500,000 and $2 million that will sustain the development of emerging companies.
• $300 million for the Pennsylvania Energy Development Authority to offer low-interest Clean Energy Loans of up to $25 million and Clean Energy Grants to stimulate the development of innovative clean energy projects and companies.
• $150 million for the Energy Site Preparation Program that will stimulate the development of highly efficient advanced energy business sites for clean energy companies and other businesses by offering grants and low-interest financing to prepare the infrastructure.
• $50 million for the Energy Capital Assistance Program that will provide grant funding for the acquisition, construction and improvement of regional energy projects that will create new jobs and a cleaner environment. Applicants will have to raise half of the necessary funds from other sources – leveraging the power of the private market to support Pennsylvania’s clean energy economy.
• $44 million for the Air Conditioner/Refrigerator Swap Program that will provide rebates to Pennsylvania retailers so that residential and small business customers can replace inefficient air conditioners and refrigerators with, high efficiency units at low cost.
• $200 million for the Sunshine Program that will provide incentives to jumpstart the solar market in Pennsylvania.

��
Making Pennsylvania More CompetitiveWhen Governor Rendell was sworn into office in January 2003, Pennsylvania’s under-performing economy and stagnant labor force were reeling. The Commonwealth’s employment and labor force levels were in dramatic decline, and there were more Pennsylvanians unemployed than at any time in the previous eight years. Perhaps more important, working Pennsylvanians and Pennsylvania businesses were not well positioned to take advantage of changing national and international trends. Governor Rendell responded with a successful combination of job creation, worker training, and business investment and expansion programs to transform Pennsylvania’s economy and create new opportunities for employment and investment.
5,600,000
5,650,000
5,700,000
5,750,000
5,800,000
Monthly, July 2003 to Dec 2006
To
tal N
on
farm
Jo
bs
(sea
son
ally
ad
just
ed)
Through strategic investments in job growth, coordinated economic and community development initiatives, and targeted business tax cuts over the past four years, the commonwealth is now consistently setting new records for job creation.
Now the commonwealth has a choice: Pennsylvanians can be content with the improvements of the last four years, or we can create new momentum for an even stronger future for Pennsylvania businesses, workers and families. Governor Rendell believes the choice is clear: Now is the time to build on Pennsylvania’s progress.
Building on the Success of the Governor’s Economic Stimulus Program
Pennsylvania’s $2.8 billion economic stimulus package, plus $200 million for Hometown Streets, has invested $2.18 billion to date and has created new opportunities for economic success across the commonwealth. Nearly 3,000 development projects have already been funded with these resources – enough to create a projected 193,000 new jobs.
The 2007-08 budget includes a number of strategic increases in several of the most critical components of the economic stimulus package.
Economic and Community Development Infrastructure
• Infrastructure Facilities Improvement Program. $7.5 million increase in 2007-08. Every $10 million of funding for this program creates approximately 20,000 new jobs.
• Housing and Redevelopment Assistance. $5 million increase in 2007-08. This successful program has
grown from $15 million a year to $30 million a year as a result of the economic stimulus package.
• Municipal Rightsizing Fund. $1.9 million increase to Land Use Planning and Technical Assistance appropriation and $2 million new Community Action Team appropriation in 2007-08. These new resources will provide planning funding for core communities seeking downtown revitalization projects.
Business, Capital and Financial Assistance:
• Keystone Innovation Zones (KIZ). $2 million in 2007-08. The KIZ program provides technical support to early-stage companies located in specific growth areas.
• Film Production Grant Program. This budget recommends a total of $20 million in funding in 2007-08. Each dollar invested by the commonwealth in this program generates $7.50 of economic impact for Pennsylvania.
Pennsylvania’s Job Growth Reaches New High
��
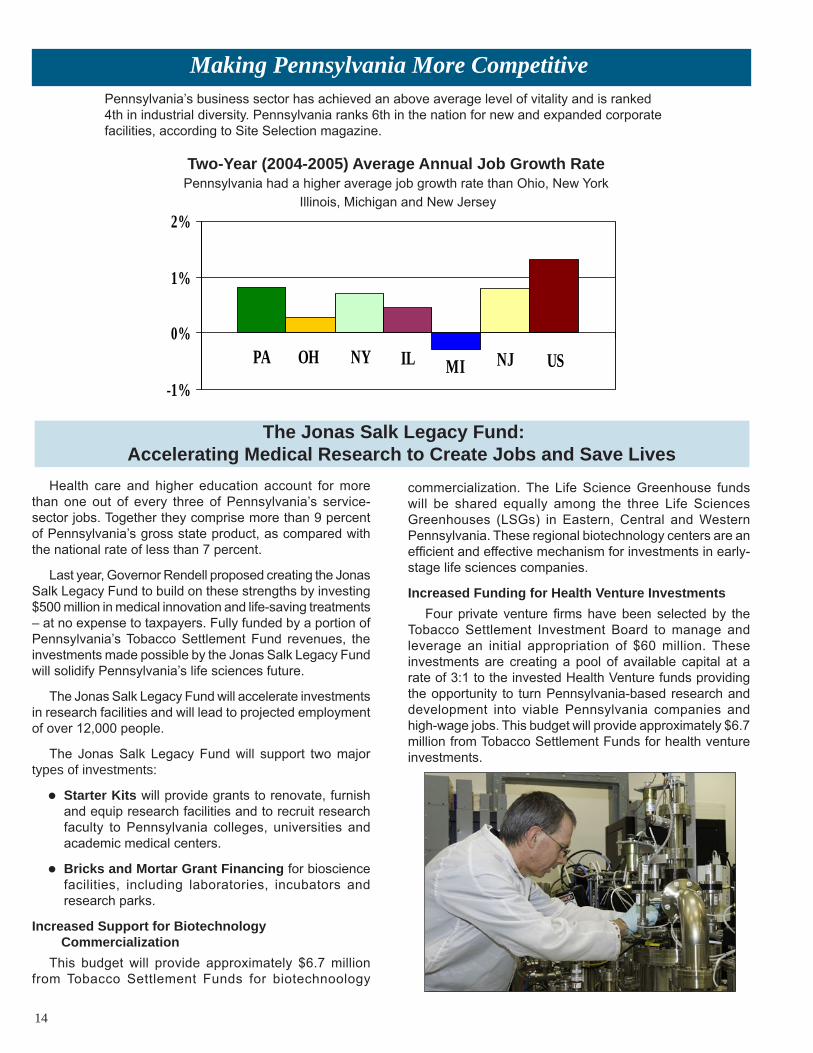
PA OH NY IL MI NJ US
-1%
0%
1%
2%
Making Pennsylvania More Competitive
The Jonas Salk Legacy Fund: Accelerating Medical Research to Create Jobs and Save Lives
Health care and higher education account for more than one out of every three of Pennsylvania’s service-sector jobs. Together they comprise more than 9 percent of Pennsylvania’s gross state product, as compared with the national rate of less than 7 percent.
Last year, Governor Rendell proposed creating the Jonas Salk Legacy Fund to build on these strengths by investing $500 million in medical innovation and life-saving treatments – at no expense to taxpayers. Fully funded by a portion of Pennsylvania’s Tobacco Settlement Fund revenues, the investments made possible by the Jonas Salk Legacy Fund will solidify Pennsylvania’s life sciences future.
The Jonas Salk Legacy Fund will accelerate investments in research facilities and will lead to projected employment of over 12,000 people.
The Jonas Salk Legacy Fund will support two major types of investments:
• Starter Kits will provide grants to renovate, furnish and equip research facilities and to recruit research faculty to Pennsylvania colleges, universities and academic medical centers.
• Bricks and Mortar Grant Financing for bioscience facilities, including laboratories, incubators and research parks.
Increased Support for Biotechnology CommercializationThis budget will provide approximately $6.7 million
from Tobacco Settlement Funds for biotechnoology
commercialization. The Life Science Greenhouse funds will be shared equally among the three Life Sciences Greenhouses (LSGs) in Eastern, Central and Western Pennsylvania. These regional biotechnology centers are an efficient and effective mechanism for investments in early-stage life sciences companies.
Increased Funding for Health Venture InvestmentsFour private venture firms have been selected by the
Tobacco Settlement Investment Board to manage and leverage an initial appropriation of $60 million. These investments are creating a pool of available capital at a rate of 3:1 to the invested Health Venture funds providing the opportunity to turn Pennsylvania-based research and development into viable Pennsylvania companies and high-wage jobs. This budget will provide approximately $6.7 million from Tobacco Settlement Funds for health venture investments.
Pennsylvania’s business sector has achieved an above average level of vitality and is ranked 4th in industrial diversity. Pennsylvania ranks 6th in the nation for new and expanded corporate facilities, according to Site Selection magazine.
Two-Year (2004-2005) Average Annual Job Growth RatePennsylvania had a higher average job growth rate than Ohio, New York
Illinois, Michigan and New Jersey
��
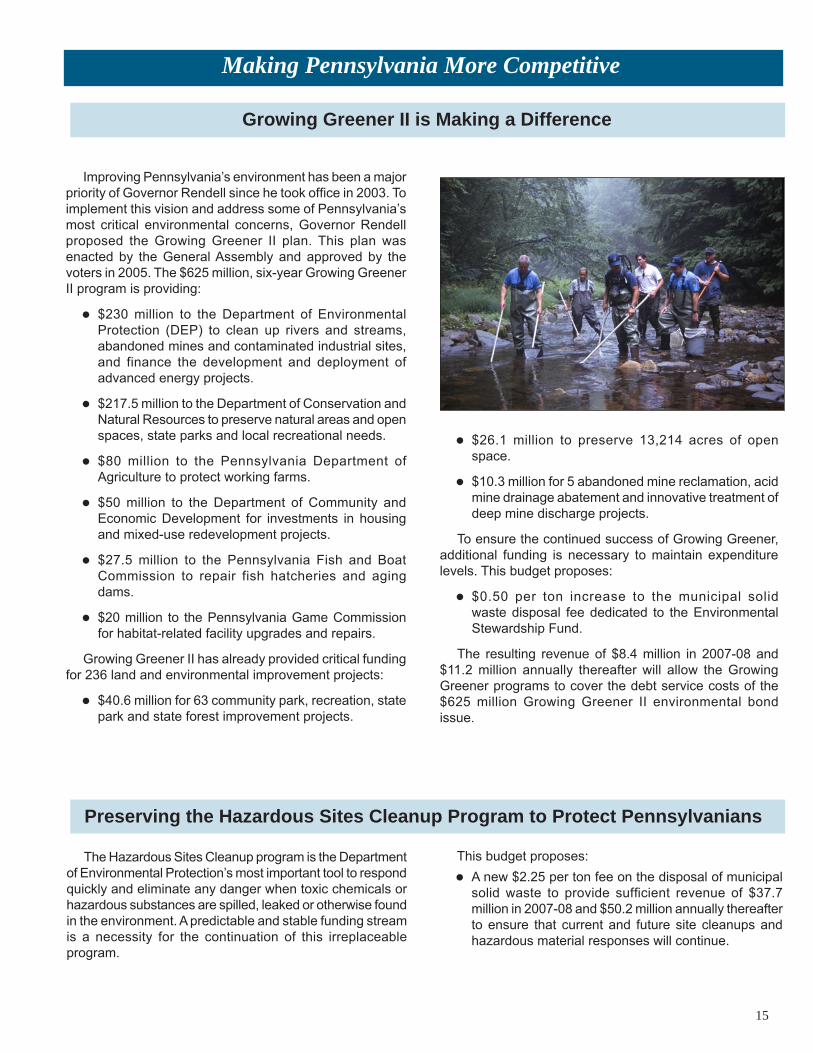
Improving Pennsylvania’s environment has been a major priority of Governor Rendell since he took office in 2003. To implement this vision and address some of Pennsylvania’s most critical environmental concerns, Governor Rendell proposed the Growing Greener II plan. This plan was enacted by the General Assembly and approved by the voters in 2005. The $625 million, six-year Growing Greener II program is providing:
• $230 million to the Department of Environmental Protection (DEP) to clean up rivers and streams, abandoned mines and contaminated industrial sites, and finance the development and deployment of advanced energy projects.
• $217.5 million to the Department of Conservation and Natural Resources to preserve natural areas and open spaces, state parks and local recreational needs.
• $80 million to the Pennsylvania Department of Agriculture to protect working farms.
• $50 million to the Department of Community and Economic Development for investments in housing and mixed-use redevelopment projects.
• $27.5 million to the Pennsylvania Fish and Boat Commission to repair fish hatcheries and aging dams.
• $20 million to the Pennsylvania Game Commission for habitat-related facility upgrades and repairs.
Growing Greener II has already provided critical funding for 236 land and environmental improvement projects:
• $40.6 million for 63 community park, recreation, state park and state forest improvement projects.
• $26.1 million to preserve 13,214 acres of open space.
• $10.3 million for 5 abandoned mine reclamation, acid mine drainage abatement and innovative treatment of deep mine discharge projects.
To ensure the continued success of Growing Greener, additional funding is necessary to maintain expenditure levels. This budget proposes:
• $0.50 per ton increase to the municipal solid waste disposal fee dedicated to the Environmental Stewardship Fund.
The resulting revenue of $8.4 million in 2007-08 and $11.2 million annually thereafter will allow the Growing Greener programs to cover the debt service costs of the $625 million Growing Greener II environmental bond issue.
The Hazardous Sites Cleanup program is the Department of Environmental Protection’s most important tool to respond quickly and eliminate any danger when toxic chemicals or hazardous substances are spilled, leaked or otherwise found in the environment. A predictable and stable funding stream is a necessity for the continuation of this irreplaceable program.
This budget proposes:
• A new $2.25 per ton fee on the disposal of municipal solid waste to provide sufficient revenue of $37.7 million in 2007-08 and $50.2 million annually thereafter to ensure that current and future site cleanups and hazardous material responses will continue.
Growing Greener II is Making a Difference
Making Pennsylvania More Competitive
Preserving the Hazardous Sites Cleanup Program to Protect Pennsylvanians

��
$200
$300
$400
$500
$600
$700
91-92 92-93 93-94 94-95 95-96 96-97 97-98 98-99 99-00 00-01 01-02 02-03 03-04 04-05 05-06
Fiscal Year
Mill
ion
s o
f D
olla
rs
State Funding State Funding Adjusted for Inflation
$91 million less purchasing power due to inflation in 2005-06.$546 million less purchasing power due to inflation since 1991-92.
0%
20%
40%
60%
80%
100%
IL MI NJ NY OH PA
State
75-over
50-74
25-49
0-24
Age of Bridges (years)
Pennsylvania’s Transportation System – Transit, Bridges and Highways in Crisis
Because of Pennsylvania’s mid-Atlantic location, transportation is an especially important segment of the commonwealth’s economy. Governor Rendell is committed to increasing the quality and safety of each part of the transportation network and investing resources wisely across the state. This year, the commonwealth faces difficult choices about the investments needed to restore and revive its public transportation, bridge and highway systems. Without new investments in our transportation system, Pennsylvania’s competitiveness will be in jeopardy because a viable transportation infrastructure is one of the key components of a vibrant economy.
Restoring and Enhancing Investment in Public TransportationThe commonwealth’s 77 public transit systems provide
more than 400 million rides a year, giving Pennsylvanians access to education, jobs, health care and other basic needs. It is estimated that more than half of these trips are work-related. Public transit is particularly important to the commonwealth’s senior citizen population, the third largest in the nation. It is also key to the mobility of students, people with disabilities and those living in poverty.
But transit agencies in the commonwealth, like other systems nationwide, face a continuing funding challenge. While Pennsylvania provides a larger percentage of transit funding than most other states do, it has not established a predictable, growing source of financing. Attempts to create reliable funding streams in the past have been unsuccessful because the new sources of revenue either had a declining tax base or imposed arbitrarily low caps on the amount of revenue provided. Because of the lack of a dedicated, adequate, predictable funding source, and years of relatively modest growth in General Fund Mass Transportation Assistance transit funding, Pennsylvania funding for public transit has not kept pace with inflation.
At the same time, transit agencies face a number of costs that are growing faster than inflation, including employee health care, pension costs, and fuel costs. Faced with these pressures, along with the loss of $830 million in federal aid to transit systems between 1995 and 2005, transit managers have repeatedly relied on capital funds to help “paper over” shortfalls in operating funding. This practice has limited transit agencies’ ability to make critical repairs and technology investments, which in turn has hurt operations and led to declining ridership and revenues.
Preserving and Improving Pennsylvania’s Highways and BridgesThe commonwealth maintains a system of 25,000 bridges
– the third largest bridge system in the nation. Compared to other states with similar weather, geography and long-established bridge systems, Pennsylvania has relatively older bridges, with an average age of about 50 years. Twenty-one percent of the state’s bridges are considered structurally deficient, compared with the national average of 11 percent. The state closed 64 bridges and posted weight restrictions on 735 bridges last year, eliminating or limiting the mobility of people, goods and public safety vehicles in the affected communities.
Base State Public Transportation FundingGeneral and Dedicated Funds Only
Source: Investing in Transportation: A Benchmarking Study of Transportation Funding and Policy, October 2006. The Pennsylvania Economy League, Inc.
Percent of Bridges by Age, 2005
��
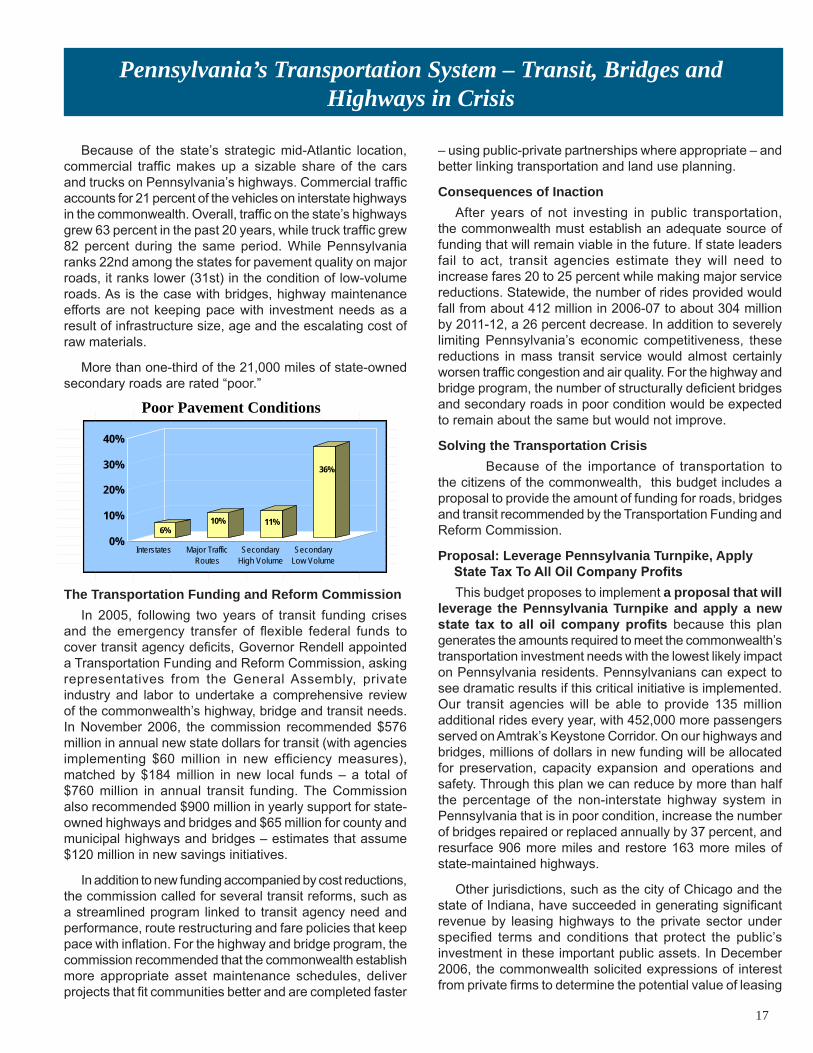
Poor Pavement Conditions
6%10% 11%
36%
0%
10%
20%
30%
40%
Interstates Major TrafficRoutes
SecondaryHigh Volume
SecondaryLow Volume
Pennsylvania’s Transportation System – Transit, Bridges and Highways in Crisis
Because of the state’s strategic mid-Atlantic location, commercial traffic makes up a sizable share of the cars and trucks on Pennsylvania’s highways. Commercial traffic accounts for 21 percent of the vehicles on interstate highways in the commonwealth. Overall, traffic on the state’s highways grew 63 percent in the past 20 years, while truck traffic grew 82 percent during the same period. While Pennsylvania ranks 22nd among the states for pavement quality on major roads, it ranks lower (31st) in the condition of low-volume roads. As is the case with bridges, highway maintenance efforts are not keeping pace with investment needs as a result of infrastructure size, age and the escalating cost of raw materials.
More than one-third of the 21,000 miles of state-owned secondary roads are rated “poor.”
– using public-private partnerships where appropriate – and better linking transportation and land use planning.
Consequences of InactionAfter years of not investing in public transportation,
the commonwealth must establish an adequate source of funding that will remain viable in the future. If state leaders fail to act, transit agencies estimate they will need to increase fares 20 to 25 percent while making major service reductions. Statewide, the number of rides provided would fall from about 412 million in 2006-07 to about 304 million by 2011-12, a 26 percent decrease. In addition to severely limiting Pennsylvania’s economic competitiveness, these reductions in mass transit service would almost certainly worsen traffic congestion and air quality. For the highway and bridge program, the number of structurally deficient bridges and secondary roads in poor condition would be expected to remain about the same but would not improve.
Solving the Transportation Crisis Because of the importance of transportation to
the citizens of the commonwealth, this budget includes a proposal to provide the amount of funding for roads, bridges and transit recommended by the Transportation Funding and Reform Commission.
Proposal: Leverage Pennsylvania Turnpike, Apply State Tax To All Oil Company ProfitsThis budget proposes to implement a proposal that will
leverage the Pennsylvania Turnpike and apply a new state tax to all oil company profits because this plan generates the amounts required to meet the commonwealth’s transportation investment needs with the lowest likely impact on Pennsylvania residents. Pennsylvanians can expect to see dramatic results if this critical initiative is implemented. Our transit agencies will be able to provide 135 million additional rides every year, with 452,000 more passengers served on Amtrak’s Keystone Corridor. On our highways and bridges, millions of dollars in new funding will be allocated for preservation, capacity expansion and operations and safety. Through this plan we can reduce by more than half the percentage of the non-interstate highway system in Pennsylvania that is in poor condition, increase the number of bridges repaired or replaced annually by 37 percent, and resurface 906 more miles and restore 163 more miles of state-maintained highways.
Other jurisdictions, such as the city of Chicago and the state of Indiana, have succeeded in generating significant revenue by leasing highways to the private sector under specified terms and conditions that protect the public’s investment in these important public assets. In December 2006, the commonwealth solicited expressions of interest from private firms to determine the potential value of leasing
The Transportation Funding and Reform CommissionIn 2005, following two years of transit funding crises
and the emergency transfer of flexible federal funds to cover transit agency deficits, Governor Rendell appointed a Transportation Funding and Reform Commission, asking representatives from the General Assembly, private industry and labor to undertake a comprehensive review of the commonwealth’s highway, bridge and transit needs. In November 2006, the commission recommended $576 million in annual new state dollars for transit (with agencies implementing $60 million in new efficiency measures), matched by $184 million in new local funds – a total of $760 million in annual transit funding. The Commission also recommended $900 million in yearly support for state-owned highways and bridges and $65 million for county and municipal highways and bridges – estimates that assume $120 million in new savings initiatives.
In addition to new funding accompanied by cost reductions, the commission called for several transit reforms, such as a streamlined program linked to transit agency need and performance, route restructuring and fare policies that keep pace with inflation. For the highway and bridge program, the commission recommended that the commonwealth establish more appropriate asset maintenance schedules, deliver projects that fit communities better and are completed faster

��
Structurally Deficient Bridges by Bridge Age - 2006
1,624 1,8481,349
4,174
2,7503,099
6,938
3,553
<1%1%
7% 13%
41%
36%
22%19%
-
1,000
2,000
3,000
4,000
5,000
6,000
7,000
8,000
0-10 11-20 21-30 31-40 41-50 51-60 61-70 >70
Bridge Age
Tota
l Cou
nt o
f Brid
ges
0.0%
10.0%
20.0%
30.0%
40.0%
50.0%
60.0%
70.0%
80.0%
90.0%
100.0%
Perc
enta
ge o
f SD
Brid
ges
by C
ount
Total Bridges% SD Bridges
Proposed New Transportation Funding(millions of dollars)
Pennsylvania’s Transportation System – Transit, Bridges and Highways in Crisis
or privatizing the Pennsylvania Turnpike. Although it is difficult to gauge the ultimate value of a turnpike lease, preliminary estimates suggest the commonwealth could generate as much as $965 million a year for transportation funding purposes by leasing the turnpike to a private company.
Because of high gasoline prices at the pump, the nation’s oil companies have recently enjoyed record profits. Chevron earned a third-quarter 2006 profit of $5 billion, the highest in the company’s 127-year history. Exxon Mobil’s profit during the same period was $10.5 billion, nearly matching its own record for America’s highest-ever profit. Pennsylvania residents and businesses helped to create these profits, yet due to the creative tax accounting methods they employ, oil
Transit Roads and BridgesOil Company Gross Profits Tax
$760PA Turnpike Leveraging
$965
companies have been able to shelter much of their profits from Pennsylvania taxes.
Subjecting oil companies to a tax collected on the basis of what is called “combined reporting” could eliminate this inequity. Using a combined reporting method, each firm’s total profits are examined, and the portion of those profits attributable to activity in Pennsylvania is subjected to Pennsylvania tax. Seventeen states currently use combined reporting in one form or another.
In this proposal, oil companies would be subject to a new Oil Company Gross Profits tax at a rate of 6.17 percent; these companies would then be exempted from the commonwealth’s 9.99 percent Corporate Net Income tax. Transferring these companies to this new tax, one that incorporates a lower rate and a tax base calculated through combined reporting, is estimated to yield the commonwealth a net revenue increase of $760 million per year. The funds raised would be dedicated exclusively to helping solve Pennsylvania’s transportation funding crisis.
The commonwealth has more than twice the percentage of structurally deficient bridges as the national average. Nearly 6,000, or 23 percent, of all the commonwealth’s bridges are structurally deficient. The percentage of structurally deficient bridges increases for older bridges – 41 percent of bridges 70 years or older are in need of major repairs.

��
Why we need to take action:
• Pennsylvania businesses suffer a competitive disadvantage when they compete in the global marketplace against companies from countries where health care costs less and is universally available.
• Pennsylvania spends 11 percent more per person on health care than the U.S. average, and our health care costs are increasing twice as fast as average wages.
• Hospital charges for care of the uninsured and for inadequate and inappropriate health care cost $21 million a day – or $7.6 billion a year.
• Only slightly more than half of Pennsylvania’s small businesses offer health insurance to their employees. About 6.5 percent of insurance premiums for businesses and families go just to cover the costs of health care for the uninsured.
Prescription for PennsylvaniaBy addressing affordability, access and quality as part of a unified health care reform plan, Prescription for Pennsylvania presents a sound, realistic approach to building a better health care system on behalf of Pennsylvania’s businesses and families – increasing the well-being of Pennsylvanians and the economic competitiveness of the commonwealth.
• Launches “Cover All Pennsylvanians” to offer an affordable basic health insurance plan for small businesses and uninsured individuals.
According to a recent survey commissioned by the Insurance Department, there are approximately 767,000 uninsured adults in Pennsylvania.
Cover All Pennsylvanians will focus on the people and small businesses that need help the most. The vast majority of Pennsylvania’s uninsured adults are employed, most of the working uninsured have full-time jobs and many are employed by small businesses. Most earn low wages and do not have access to health insurance because of the high cost for both businesses and individuals.
• Protects small businesses from extraordinary spikes in health care premium costs through more effective regulation of the small group insurance market.
This budget includes $268,000 to expand the commonwealth’s premium rate review authority to all insurers providing coverage in the individual and small-employer market.
• Provides more appropriate sites for health conditions that do not need emergency room care.
• Ensures that health system capital expenditures increase quality and access to care and are not an economic burden to health care purchasers.
This budget includes $120,000 to develop recommendations and criteria for the review and approval of health care services and facility planning process to ensure that large capital health investments meet regional health care needs and can be afforded by the health care purchasers in the region.
• Ensures that general acute-care hospitals receiving tax exemptions and other benefits as charitable institutions meet their community-benefit requirements and have uniform admission criteria and fair billing and collection practices to increase access to affordable health care for the uninsured and underinsured.
0% 20% 40% 60% 80% 100%
Increase in MedianWages
Increase in Inflation
Increase inPremiums 75.6%
From 2000 to 2006, growth in Pennsylvania family health insurance premium costs was nearly six times that of growth in median wages and more than four times that of inflation.
17.0%
13.3%
Prescription for Pennsylvania will be funded by assessing “free-rider” businesses that do not offer health insurance and thus pass the health care costs of their employees and their families on to everyone else. The plan will also be funded by increasing the cigarette tax, establishing a tax on smokeless tobacco products, using existing funding from the adultBasic program and obtaining significant new matching funds from the federal government.
Prescription for Pennsylvania - Guarantees affordable health care to Pennsylvania businesses and individuals
By driving down the cost of health care for businesses, we can help more families get coverage while ensuring that businesses are not forced to drop health care for their employees.

�0
PENNSYLVANIA'S UNINSURED ADULTS
0
50,000
100,000150,000
200,000
250,000
300,000
<100% 100%-200% 200%-300% 300%+
Percent of Federal Poverty Level
Nu
mb
er o
f A
du
lts
Insurance Department Survey, 2004
205,876247,369
186,152
127,603
0
100,000
200,000
300,000
400,000
2007-08 2008-09 2009-10 2010-11 2011-12
Current MA Adult Basic Transfers Subsidized CAP At-Cost CAP
Nu
mb
er o
f A
du
lts
Prescription for Pennsylvania
This budget includes:
$810,000 to develop standardized policies and reporting and auditing procedures for non-profit hospitals required to meet community benefit obligations.
$510,000 to standardize hospital admission criteria and fair billing and collection procedures for uninsured and underinsured patients.
Cover All Pennsylvanians – A Critical Component of Prescription for Pennsylvania
• Cover All Pennsylvanians will be supported by the state and offered through private insurance companies.
• Employers can participate if they have not offered health care coverage to their employees for at least 6 months, if they have 50 or fewer employees and if, on average, these employees earn less than the state average wage.
• All uninsured Pennsylvanians – no matter what their employment status or income level – will be able to purchase affordable health insurance through this program. A family of four that earns up to $62,000 a year will receive help from the state in paying part of their premiums.
–
–
• Uninsured adults who earn more than 300 percent of the federal poverty level ($62,000 for a family of four) can participate in Cover All Pennsylvanians by paying the full cost of the premium.
• In addition to premiums, there will be co-payments that vary depending on family income for certain health care services.
• To ensure that businesses and individuals do not drop current health care coverage to participate in Cover All Pennsylvanians, eligibility will be limited to those who have been uninsured prior to enrollment for 90 days or 180 days, depending upon family income.
Through an extensive outreach effort, Cover All Pennsylvanians expects to enroll 153,600 adults in 2007-08, the initial year of the program, growing to an enrollment of 431,300 in 2011-12. While the majority of the uninsured will enroll in the subsidized component of Cover All Pennsylvanians, including those transferring from the existing Adult Basic program, some will be eligible instead for the commonwealth’s existing Medical Assistance program. Others will purchase health care coverage through Cover All Pennsylvanians at the same affordable premium rate that the commonwealth pays.
Cover All PennsylvaniansFY 2007-08 Funding Sources
Existing State Funds - Tobacco Settlement Fund
$31.3 million
Existing State Funds - Community Health Reinvestment
$52.2 million
Federal Funds - Medicaid $104.0 million
Cost Sharing - Small Employers $0.7 million
Cost Sharing - Enrollees $68.0 million
New Revenue - Fair Share Assessment $60.4 million
Total Revenue $316.6 million
COVER ALL PENNSYLVANIANSEnrollment Projections
The health care premium and administrative costs of Cover All Pennsylvanians will total approximately $302.2 million in 2007-08. These costs will be covered by a variety of revenue sources, including existing state funds currently used for the Adult Basic program, federal Medicaid matching funds, enrollee and small employer cost-sharing, and a 3 percent Fair Share Assessment levied on the payrolls of businesses that do not offer health care coverage to their employees.
��
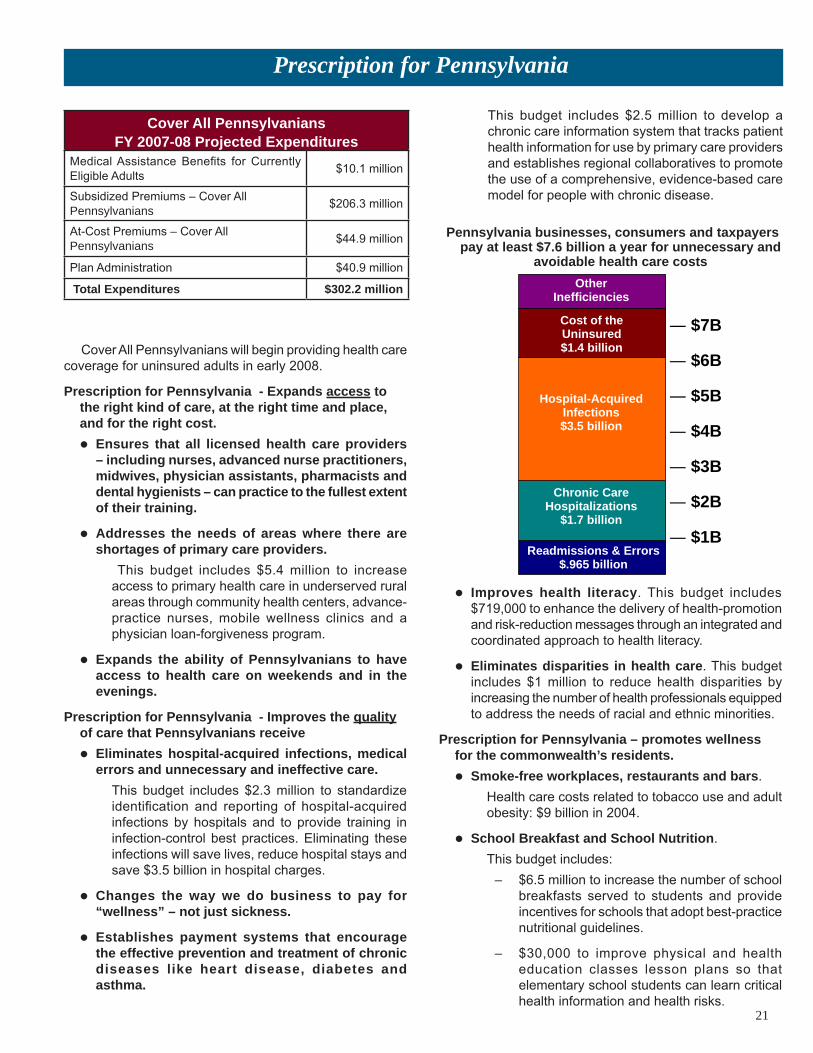
Cover All PennsylvaniansFY 2007-08 Projected Expenditures
Medical Assistance Benefits for Currently Eligible Adults $10.1 million
Subsidized Premiums – Cover All Pennsylvanians $206.3 million
At-Cost Premiums – Cover All Pennsylvanians $44.9 million
Plan Administration $40.9 million
Total Expenditures $302.2 million
Prescription for Pennsylvania
Cover All Pennsylvanians will begin providing health care coverage for uninsured adults in early 2008.
Prescription for Pennsylvania - Expands access to the right kind of care, at the right time and place, and for the right cost.
• Ensures that all licensed health care providers – including nurses, advanced nurse practitioners, midwives, physician assistants, pharmacists and dental hygienists – can practice to the fullest extent of their training.
• Addresses the needs of areas where there are shortages of primary care providers.
This budget includes $5.4 million to increase access to primary health care in underserved rural areas through community health centers, advance-practice nurses, mobile wellness clinics and a physician loan-forgiveness program.
• Expands the ability of Pennsylvanians to have access to health care on weekends and in the evenings.
Prescription for Pennsylvania - Improves the quality of care that Pennsylvanians receive
• Eliminates hospital-acquired infections, medical errors and unnecessary and ineffective care.
This budget includes $2.3 million to standardize identification and reporting of hospital-acquired infections by hospitals and to provide training in infection-control best practices. Eliminating these infections will save lives, reduce hospital stays and save $3.5 billion in hospital charges.
• Changes the way we do business to pay for “wellness” – not just sickness.
• Establishes payment systems that encourage the effective prevention and treatment of chronic diseases like heart disease, diabetes and asthma.
This budget includes $2.5 million to develop a chronic care information system that tracks patient health information for use by primary care providers and establishes regional collaboratives to promote the use of a comprehensive, evidence-based care model for people with chronic disease.
― $7B
― $6B
― $5B
― $4B
― $3B
― $2B
― $1B
OtherInefficiencies
Cost of theUninsured$1.4 billion
Hospital-AcquiredInfections$3.5 billion
Chronic CareHospitalizations
$1.7 billion
Readmissions & Errors$.965 billion
Pennsylvania businesses, consumers and taxpayers pay at least $7.6 billion a year for unnecessary and
avoidable health care costs
• Improves health literacy. This budget includes $719,000 to enhance the delivery of health-promotion and risk-reduction messages through an integrated and coordinated approach to health literacy.
• Eliminates disparities in health care. This budget includes $1 million to reduce health disparities by increasing the number of health professionals equipped to address the needs of racial and ethnic minorities.
Prescription for Pennsylvania – promotes wellness for the commonwealth’s residents.
• Smoke-free workplaces, restaurants and bars.Health care costs related to tobacco use and adult obesity: $9 billion in 2004.
• School Breakfast and School Nutrition.This budget includes:
$6.5 million to increase the number of school breakfasts served to students and provide incentives for schools that adopt best-practice nutritional guidelines.
$30,000 to improve physical and health education classes lesson plans so that elementary school students can learn critical health information and health risks.
–
–

��
3) State and federal funds should be prudently managed and leveraged, and individual assets should be optimized to ensure that the commonwealth is able to meet the future needs of Pennsylvania’s aging population and continue to support people with disabilities to maintain their independence and dignity.
To prepare to meet this challenge, this budget includes a net increase of $17.2 million in state funds to expand the continuum of long-term living options and build a management infrastructure to support a high-quality long-term living system. The total cost will be partially offset by a reduction in nursing home funding because these additional options will reduce the number of people who choose to reside in nursing homes.
Making the Appropriate Options Available for Long Term LivingContinuing the investment in home and-community based
services is essential, and this budget provides $12.7 million in state funds to serve:
• An additional 2,200 individuals over age 60
• 1,000 persons with disabilities under age 60 in Medicaid waiver programs.
These programs provide necessary services to allow people who are eligible for a nursing home to remain in their homes or a community-based setting rather than moving to a nursing home.
Nursing Home TransitionSince January 2004, the Nursing Home Transition
program in Pennsylvania has helped more than 600 people regain their independence. The Nursing Home Transition program reduces unnecessary stays in nursing homes by ensuring that nursing home residents and their families or caregivers are fully informed and have ready access to home and community-based services.
This budget includes $3.8 million in state funds to build upon the current, successful Nursing Home Transition program by continuing to fund long-term living counseling and transition support services for individuals who are able to be served safely and appropriately in a home or community-based setting.
Services for Pennsylvania Seniors and Persons with Disabilities Pennsylvania has the third oldest population of any state,
and the fastest growing segment of this population is over age 85. According to a recent analysis, Pennsylvania is currently experiencing the kinds of demographic changes that other states will not experience for another 10 to 15 years. The demand for services is expected to continue to grow over the next several years until the 85+ cohort stabilizes in 2011. In addition, an estimated 162,000 adult Pennsylvanians under the age of 60 need some level of long-term living support. As a result, the commonwealth must build a robust continuum of medical and non-medical long-term living services to meet the needs of the growing 85+ population and younger people with disabilities.
Long Term LivingThe Commonwealth has a long tradition of providing a broad range of services and programs for its older residents, including a state pharmaceutical assistance program and, when necessary, long-term living services to provide needed supports. This budget provides for necessary changes in both programs to better address the needs of Pennsylvania’s growing elderly population and persons with disabilities.
The commonwealth’s plan to address its changing demographic trends and consumer preferences is based on three key principles:
1) Consumers should have a choice of where they receive their care and support services, and these services should meet the highest quality standards.
2) The long-term living system should be balanced so both institutional and home and community-based services are accessible and available, with the goal of achieving a balance of 50 percent institutional care to 50 percent home and community-based care over the next five years.

��`
Helping Pennsylvanians Plan for the Future This budget provides $1.5 million in state funds to
implement a comprehensive public education and information campaign to help Pennsylvanians make informed decisions about their long-term care needs.
The Long-Term Care Partnership program is a public-private partnership between states and private insurance companies that encourages people to buy long-term care insurance. The 2007-08 budget includes funds to begin a Long-Term Care Partnership program for Pennsylvania, which will encourage Pennsylvanians to buy long-term care insurance so they can pay for long-term care without impoverishing themselves or relying on the public system to pay for their services.
Building a Balanced Continuum of ServicesThis budget includes:
• $3.7 million for the development of domiciliary care homes – a homelike living arrangement in the community for adults age 18 and older who need assistance with activities of daily living; Living Independently for Elders or LIFE programs – all-inclusive care programs for those eligible for both Medicare and Medical Assistance; and other residential options in support of the commonwealth’s goals of providing balanced long-term care.
• $400,000 in additional resources to provide housing and to strengthen the home modification program for those who need these long-term living services.
• $4.7 million to strategically encourage the appropriate distribution of nursing home beds while developing alternative service delivery options to meet the diverse long-term living needs of Pennsylvania citizens.
Improving Access to Needed ServicesCurrently Pennsylvania has two aging and disability
resource center pilot sites - the Allegheny and Cumberland Links. These are ‘one-stop centers’ intended to make it easier for people to access the long-term living system. Consistent with the commonwealth’s rebalancing goals, the 2007-08 budget includes $1.5 million in state funds to create a network of agencies in another Link site, expanding upon this pilot for those seeking long-term living services.
Increasing Efficiency and IntegrityThis budget provides:
• $433,000 to establish a centralized quality management structure that coordinates activities across the commonwealth’s Medicaid waiver programs.
• $1 million in state funds to implement an automated tool that simplifies the process for assessing and planning to meet the consumer’s needs and speeds the connection to appropriate services.
Long Term Living
• $325,000 to improve data analytic capacity to allow more efficient program analysis and performance tracking.
Building Capacity at the State and Local LevelsThis budget includes $3.0 million in state funds for
education to help all employees working in the system perform efficiently in the changing long-term living environment.
Coordination and Strategic AlignmentPennsylvania’s long-term living system has been
operated in a bifurcated manner by both the Department of Public Welfare and the Department of Aging. At times the overlapping responsibilities have presented each agency with fiscal and operational challenges. The establishment of the Long Term Living Council and the appointment of an executive director to coordinate activities among the departments has been an important first step in addressing this management challenge.
This budget proposes to build upon that success by further strengthening coordination between the Department of Public Welfare and the Department of Aging, through the creation of a joint office charged with oversight of the fiscal, policy and program operations of the long-term living system for the elderly and for adults over age 18 with physical disabilities. This plan represents a strategic and focused effort to address the changing long-term living needs and preferences of Pennsylvania residents by creating a long-term living system based on the principle of consumer choice that is balanced and uses resources efficiently.
This budget reaffirms the Commonwealth’s commitment to care for all Pennsylvanians and to ensure that the elderly, people with disabilities and low-income families will have access to health care and other critical services.

��
Caring for All PennsylvaniansThe Commonwealth faces many challenges in the coming year. The federal government continues to reduce its support for programs for the most needy, the cost of health care continues to increase and the number of people seeking help from public-assistance programs continues to rise. In spite of this growing challenge, this budget continues to adhere to the same principles concerning its public assistance programs that Governor Rendell set forth two years ago:
· No one currently receiving services in Pennsylvania will lose eligibility;· Children will not experience any reduction in services; and· Pennsylvania will provide coverage for the growing number of vulnerable individuals and families
who require our assistance.
Protecting Pennsylvania’s Most Vulnerable CitizensTo meet these continued commitments, this budget provides an increase of $568 million in resources to expand care
for Pennsylvanians in need in 2007-08, representing a 6.2 percent increase from the 2006-07. This additional funding will provide a broad array of health and human services to more than 3 million Pennsylvania residents in 2007-08.
Welfare to WorkThe Department of Public Welfare has made significant
progress in meeting new federal work participation rates for the Temporary Assistance for Needy Families (TANF) program. Pennsylvania achieved a 48.9 percent work participation rate last November.
November’s result marked Pennsylvania’s highest work participation level since the federal TANF program was
The Commonwealth Provides Vital Services to More than 3 Million PeoplePROGRAM People Served
2006-07People Served
2007-08
Medical Assistance 1,905,529 1,969,770TANF and General Assistance 264,407 259,205Child Welfare System 286,847 290,625Child Care 221,186 221,585Mental Retardation and Autism Services 45,965 49,485Children’s Health Insurance Program 158,711 174,531Uninsured Adults* 52,406 147,939PACE Plus Medicare (average enrollments) 325,735 357,725
*2006-07 AdultBasic; 2007-08 includes Cover All Pennsylvanians
enacted in 1996, and was more than triple the rate achieved in 2005-06.
As a result of Pennsylvania’s strong focus on employment and training, over 10,000 individuals receiving cash assistance are working each month while the others engage in job preparation and job search, vocational educational training and work experience programs.
Medical Assistance Recipients by Category and Cost2007-08
0%
10%
20%
30%
40%
50%
60%
70%
80%
90%
100%
Number and Percent of People perCategory
Amount Spent per Category
266,939
14% $4,219,220
32%395,39120%
$4,420,85733%
1,205,27261%
$3,644,95627%
102,168 5% $1,090,969 8%
Elderly
Disabled
Families
Chronically Ill Adults
(Dollar Amounts in Thousands)
Seniors and People with Disabilities Use 65% of Medical Assistance
Resources
Medical Assistance Recipients by Category and Cost 2007-08
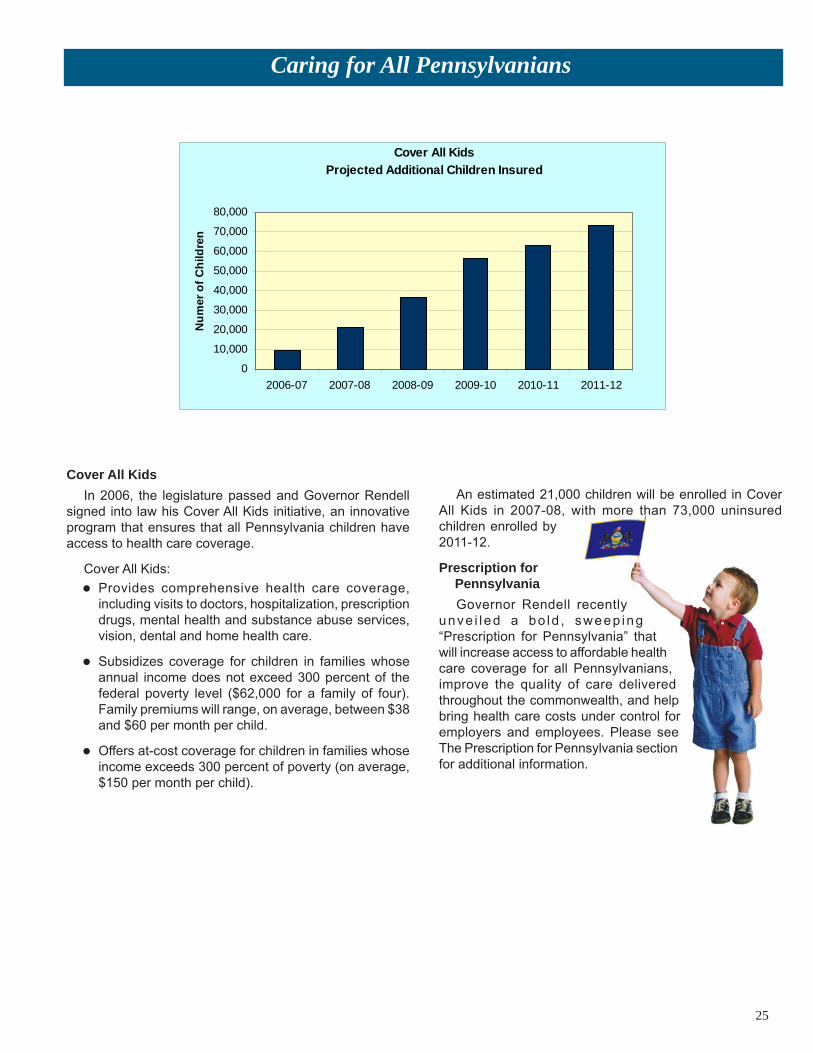
��
Cover All KidsIn 2006, the legislature passed and Governor Rendell
signed into law his Cover All Kids initiative, an innovative program that ensures that all Pennsylvania children have access to health care coverage.
Cover All Kids:
• Provides comprehensive health care coverage, including visits to doctors, hospitalization, prescription drugs, mental health and substance abuse services, vision, dental and home health care.
• Subsidizes coverage for children in families whose annual income does not exceed 300 percent of the federal poverty level ($62,000 for a family of four). Family premiums will range, on average, between $38 and $60 per month per child.
• Offers at-cost coverage for children in families whose income exceeds 300 percent of poverty (on average, $150 per month per child).
Caring for All Pennsylvanians
Cover All KidsProjected Additional Children Insured
0
10,000
20,000
30,000
40,000
50,000
60,000
70,000
80,000
2006-07 2007-08 2008-09 2009-10 2010-11 2011-12
Nu
mer
of
Ch
ildre
n
An estimated 21,000 children will be enrolled in Cover All Kids in 2007-08, with more than 73,000 uninsured children enrolled by 2011-12.
Prescription for PennsylvaniaGovernor Rendell recently
unve i led a bo ld , sweep ing “Prescription for Pennsylvania” that will increase access to affordable health care coverage for all Pennsylvanians, improve the quality of care delivered throughout the commonwealth, and help bring health care costs under control for employers and employees. Please see The Prescription for Pennsylvania section for additional information.

��
PACE Plus MedicareThe federal Medicare Part D prescription drug plan was
implemented in 2006, creating new challenges for older Pennsylvanians attempting to find affordable drug coverage. Governor Rendell responded to this challenge by asking the General Assembly to create and pass legislation establishing PACE Plus Medicare, which enhances the commonwealth’s PACE and PACENET programs to provide, along with the new Medicare Part D prescription benefit, seamless pharmaceutical coverage to help Pennsylvania seniors. Since Governor Rendell took office the number of seniors served by PACE has increased.
The Nurse Family Partnership is a proven approach to supporting first-time, at-risk parents and promoting their children’s healthy development. This budget includes $587,000 and expands the number of families participating in the Nurse Family Partnership program. As a result, 184 additional families, or a total of 4,400 at-risk families, will receive services in 2007-08.
Infants, toddlers and pre-schoolers who are experiencing developmental delays participate in the Early Intervention program, which will serve nearly 4,300 additional children in 2007-08. Program services are intended to minimize developmental delay and the need for special education and related services and to assist families in meeting the special needs of their children. The 2007-08 budget includes an additional $45.4 million for early intervention services in 2007-08.
Protecting Children and Preserving FamiliesThe commonwealth is continuing to build on past
successes to increase the availability of prevention and in-home services for at-risk children and families and reduce the need for out-of-home placements. Pennsylvania continues its commitment to connecting children who need homes with loving families who want to adopt them.
The 2007-08 budget includes a $7.6 million increase to allow more children to be adopted and to continue to provide financial assistance to those who have already been adopted, for a total state investment of $88.1 million.
Expanding Services for Individuals with Special NeedsThis budget continues to support independence for
people with mental retardation and mental health disabilities. The proposed budget recommends:
• An additional $18.9 million to serve an additional 200 individuals with mental illness in the community for a total of 200,500 individuals served in 2007-08.
• $500,000 to provide respite care services for 2,000 children with emotional disturbances and their families.
• An additional $29.3 million to provide home and community-based services for 3,428 additional individuals, including 800 young people leaving the special education system, and ensure the quality of services for people with mental retardation. In 2007-08 45,634 individuals will be served in the community.
• An additional $2.3 million to support the needs of 100 Pennsylvanians living with autism and to continue developing a statewide model of excellence.
Caring for All Pennsylvanians
In 2007-08, the average number of Pennsylvania seniors covered by PACE, PACENET or PACE Plus will rise to 357,725, an increase of 10 percent. This is a significant increase in enrollment since the the end of 2002 when 218,900 Pennsylvania seniors were being served. This budget includes $276.4 million in state funds to continue these successful programs.
Expanding the Availability of Quality Early Childhood ServicesIn 2007-08, the commonwealth will expand its commitment
to vulnerable children and their families by expanding high-quality child and family services.
This budget includes:
• $29.8 million initiative to maintain Keystone STARS quality early learning experiences for 176,000 children and assure that more than 220,000 low-income working families, Temporary Assistance for Needy Families (TANF) recipients, and former TANF families who are now fully employed continue to have monthly access to quality school-readiness services through the child care system.

��
Improving Program Efficiency The largest component of the commonwealth’s public
health and human services expenditures is the Medical Assistance program. In 2007-08, the Medical Assistance program is expected to provide health and long-term care services to more than 1.9 million Pennsylvanians.
This budget proposes initiatives that will:
• Save a combined $194.5 million in state funds to achieve even greater cost efficiencies for the commonwealth and a better return on the dollars Pennsylvania invests in Medical Assistance and other human service programs. These initiatives include changes to managed care contracts and to hospital, pharmacy and nursing home payment structures. These savings are in addition to $337.6 million in cost containment in 2005-06 and 2006-07.
Encouraging Healthy LifestylesOver the course of the last several years, the
commonwealth has taken a leadership role in implementing pay-for-performance contracts in the Medical Assistance program that promote strong program results. Strengthening managed care contracts to focus on better health for consumers and to generate long-term benefits for the Medical Assistance program is a key component of improving the Medical Assistance program.
Caring for All Pennsylvanians
• $4.6 million to make adjustments to some of the medical assistance fees that focus on preventive interventions by physicians and to increase the maximum reimbursement level for selective inpatient services.
• The commonwealth will also provide for a new benefit in the Medical Assistance program directed at aggressively treating childhood obesity.
The commonwealth remains committed to providing quality medical care for low-income Pennsylvanians. It will continue to take a leadership role in identifying innovative ways to manage the Medical Assistance program as effectively and efficiently as possible, support the health care industry in Pennsylvania, and encourage all stakeholders to develop and pursue healthy lifestyles.
Preserving the Safety NetThis budget reaffirms the commonwealth’s commitment
to preserve the safety net for Pennsylvania’s most vulnerable citizens and ensure that the elderly, people with disabilities and low-income families will have access to health care and other critical services. These investments are also made possible by the cumulative impact of Medical Assistance efficiency initiatives instituted over the past four years, which have freed up resources for an array of health and human services so that Pennsylvania can better meet its responsibilities to children, adults and families in need.
This budget provides $11.7 million to support additional initiatives that emphasize prevention, including:
• $7.1 million to expand incentive payments to both fee-for-service and managed care contractors for implementing, measuring and documenting new initiatives that encourage medical providers in their networks to take specific steps to engage consumers in managing their diseases.

��
Public Safety – A Commonwealth PriorityOne of government’s core responsibilities is protecting its citizens. Public safety in the commonwealth helps to determine the quality of residents’ lives and the character of their communities. Governor Rendell has implemented an aggressive and broad-based public safety agenda that will make Pennsylvania and its residents safer.
The 2007-08 budget includes a number of public safety initiatives that safeguard Pennsylvania residents. First, to fight crime and protect our communities, Pennsylvania is funding the highest number of state police troopers in its history. Second, Pennsylvania is ensuring that offenders are housed in a manner that is safe for both offenders and those who work in correctional facilities. Third, Pennsylvania is providing critical resources that will make it less likely that offenders will victimize anyone else and ultimately return to prison. This comprehensive approach will mean safer communities, less crime and fewer victims.
A Record Number of State Police Troopers and More Local Police Officers To Fight Crime in Pennsylvania’s Communities
Governor Rendell’s emphasis on public safety starts with the recognition of the critical role of the Pennsylvania State Police and local police in promoting public safety. Under Governor Rendell’s leadership, the number of state troopers has reached its highest level ever. By September 2008 there will be 4,660 troopers serving Pennsylvanians. The 2007-08 budget also contains $10 million for the second year of the Police On Patrol program, which provides funding to twenty cities and municipalities throughout Pennsylvania to hire approximately 200 additional police officers to fight crime. There are more law enforcement personnel than ever on the job in Pennsylvania to keep communities safe, patrol the commonwealth’s interstates, investigate firearm related violence and drug crimes, combat terrorism and ensure that sex offenders comply with their registration requirements under Pennsylvania’s Megan’s Law.
The Department of Corrections is Expanding Capacity to Maintain its Nationally Recognized Safety Standards and to Accommodate the Growing Prison Population
The Commonwealth is increasing its capacity to incarcerate offenders while at the same time continuing its efforts to address the underlying causes of criminal behavior, improve public safety and reduce victimization.
Budget highlights include:
• Corrections/Probation and Parole. The Department of Corrections will add modular units at three of its institutions, which will add a total of 450 new beds to those facilities by August 2007. The budget also provides funding for the construction of additional housing units in four institutions, which will add more than 800 beds by June 2008. Effective July 1, 2007, the Department of Corrections will reopen SCI Pittsburgh, which will house an additional 750 inmates and capacity for as many as 1,500 inmates.
Pennsylvania Has a Four-Part Approach to Ensuring That Released Offenders Stay Out of Prison
Unless Pennsylvania can reduce the likelihood that released inmates will commit new crimes, the commonwealth will have to spend even more resources to construct additional correctional facilities. Accordingly, Pennsylvania has established a four-part approach to ensuring that released offenders stay out of prison by addressing addiction issues. The four components are:
1) Providing treatment to those who can safely be served in the community
This budget provides $2.2 million in additional funding for the Drug and Alcohol Restrictive Intermediate Punishment (RIP) program. This additional funding will increase the number of eligible participants served by this program from 1,615 to 1,870.
Department of Corrections Inmate Population
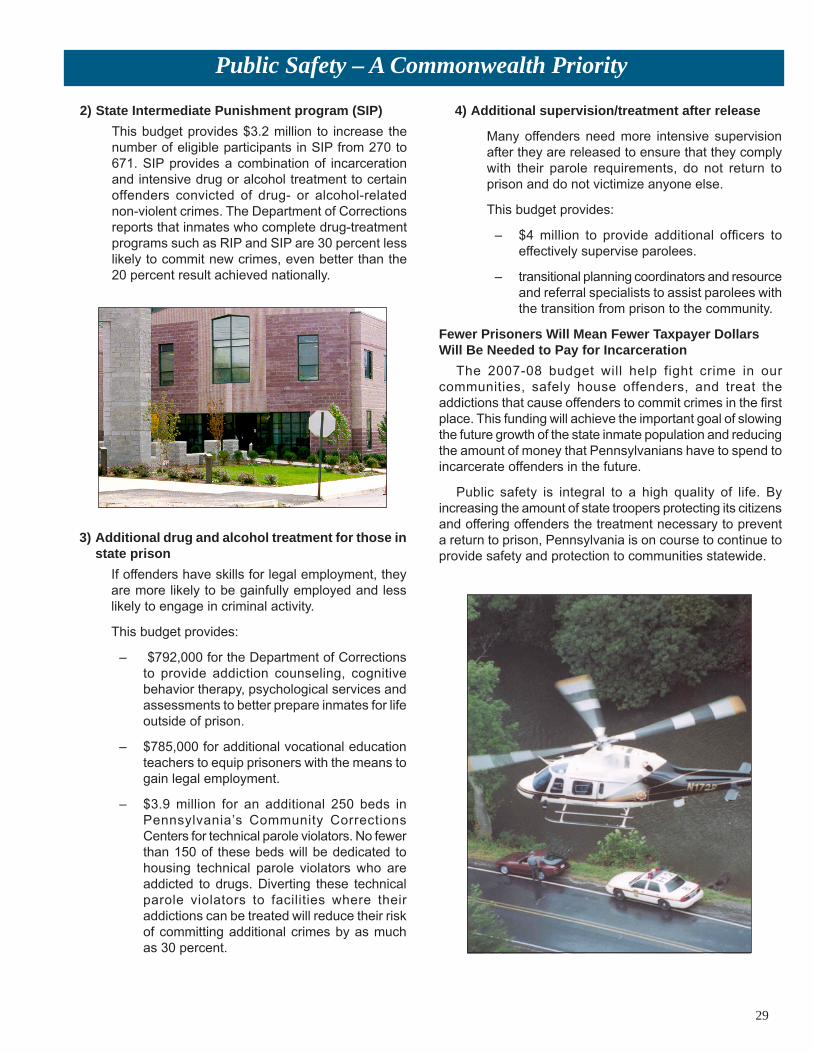
��
2) State Intermediate Punishment program (SIP)This budget provides $3.2 million to increase the number of eligible participants in SIP from 270 to 671. SIP provides a combination of incarceration and intensive drug or alcohol treatment to certain offenders convicted of drug- or alcohol-related non-violent crimes. The Department of Corrections reports that inmates who complete drug-treatment programs such as RIP and SIP are 30 percent less likely to commit new crimes, even better than the 20 percent result achieved nationally.
4) Additional supervision/treatment after release
Many offenders need more intensive supervision after they are released to ensure that they comply with their parole requirements, do not return to prison and do not victimize anyone else.
This budget provides:
$4 million to provide additional officers to effectively supervise parolees.
transitional planning coordinators and resource and referral specialists to assist parolees with the transition from prison to the community.
Fewer Prisoners Will Mean Fewer Taxpayer Dollars Will Be Needed to Pay for Incarceration
The 2007-08 budget will help fight crime in our communities, safely house offenders, and treat the addictions that cause offenders to commit crimes in the first place. This funding will achieve the important goal of slowing the future growth of the state inmate population and reducing the amount of money that Pennsylvanians have to spend to incarcerate offenders in the future.
Public safety is integral to a high quality of life. By increasing the amount of state troopers protecting its citizens and offering offenders the treatment necessary to prevent a return to prison, Pennsylvania is on course to continue to provide safety and protection to communities statewide.
–
–
Public Safety – A Commonwealth Priority
3) Additional drug and alcohol treatment for those in state prison
If offenders have skills for legal employment, they are more likely to be gainfully employed and less likely to engage in criminal activity.
This budget provides:
$792,000 for the Department of Corrections to provide addiction counseling, cognitive behavior therapy, psychological services and assessments to better prepare inmates for life outside of prison.
$785,000 for additional vocational education teachers to equip prisoners with the means to gain legal employment.
$3.9 million for an additional 250 beds in Pennsylvania’s Community Corrections Centers for technical parole violators. No fewer than 150 of these beds will be dedicated to housing technical parole violators who are addicted to drugs. Diverting these technical parole violators to facilities where their addictions can be treated will reduce their risk of committing additional crimes by as much as 30 percent.
–
–
–

�0
Emergency Preparedness
• Pandemic Preparedness. This budget includes $14 million to procure antiviral medications and allow the commonwealth to move towards meeting federal guidelines on antiviral medicine as part of the national pandemic preparedness strategy. The commonwealth has made significant strides in developing preparedness activities and has conducted more than 100 outreach sessions on pandemic planning across the state.
Complementing the commonwealth’s public safety initiatives involving law enforcement and corrections is the commonwealth’s emergency preparedness effort, which embraces an all-hazards approach to defend the safety of the commonwealth’s citizenry. Pennsylvania’s all-hazards emergency preparedness approach has three major components: Prevention, Protection and Response/Recovery.
PreventionPennsylvania’s prevention strategies are focused on
improving the commonwealth’s abilities to stop emergency situations from occurring and reduce the impact if a natural disaster does occur.
• Information Sharing. State Police Pennsylvania Criminal Intelligence Center will become a “Fusion Center” designed to better share information among the commonwealth’s public safety partners on multiple types of threats. Through increased sharing and integration of information, the commonwealth will be better informed of potential terrorism threats and will be better able to guard against attacks to infrastructure and assets located in the commonwealth.
Responding quickly and effectively to flooding and other emergencies requires an immediate access to accurate information. The Pennsylvania Map project is an integral part of the commonwealth’s effort to use geographic information systems to more effectively plan for and respond to emergency events. This budget includes $4 million to continue the data and digital imagery work necessary to bring this critical tool into the hands of first responders and state and local officials.
The commonwealth must also become more prepared for naturally occurring disasters and will focus on flood mitigation, food safety and pandemic planning in 2007-08.
• Flood Mitigation. $1.2 million has been budgeted for future flood mitigation projects and $1.3 million has been budgeted for flood control and flood-plain management plans. The 2007-08 budget charges the Department of Environment Protection, working with the Department of Community and Economic Development, the Pennsylvania Emergency Management Agency and the Department of Conservation and Natural Resources, to develop an overall strategy to address the commonwealth’s flood mitigation efforts.
• Food Safety. The Department of Agriculture will lead a team of state agencies to review the commonwealth’s food safety programs and policies across the commonwealth. This team will work closely with federal and local governments, private industry and higher education to develop a strategy that will work to improve the safety of Pennsylvania’s food supply.
ProtectionThe second component of emergency preparedness is
protection. The inevitability of emergencies, despite the best level of prevention, requires an effective emergency plan to provide protection when disaster occurs.
• Infrastructure Protection. In 2006, the Pennsylvania Office of Homeland Security (OHS) initiated the Commonwealth Critical Infrastructure Protection program. Through this program, which complements the National Infrastructure Protection program, OHS is working with private industry, higher education and other government entities to identify and address vulnerabilities in critical infrastructure.
Response and RecoveryTo respond to inevitable emergencies, a diversified
network of county emergency management agencies, emergency medical services, paid and volunteer fire fighters and fire police, state and local law enforcement and numerous state agencies are available. If the situation warrants, the Pennsylvania National Guard also stands ready.
• Volunteer Company Grants program. The 2007-08 budget provides $25 million in funding to continue the program.

��
Making Government Work SmarterWhen he took office in January 2003, Governor Rendell pledged to cut the cost of government and change the way commonwealth government works. In four years, by focusing on transforming the commonwealth’s business practices, this administration has kept the Governor’s pledge and generated recurring annual savings totaling more than $1 billion.
In addition to generating recurring cost savings, every day Governor Rendell’s initiatives provide government services to the taxpayers of Pennsylvania more efficiently and effectively. Expanding the use of the Internet has made it easier and less expensive for Pennsylvanians to renew their driver’s licenses and vehicle registrations, file their taxes and receive tax refunds, and made it less costly to provide benefits to Pennsylvanians in need, with much greater ability on the part of the commonwealth to detect and prevent fraud and abuse. Increasing operational efficiencies, changing the commonwealth’s purchasing habits, and controlling ongoing operating costs have made hundreds of millions of dollars available for necessary investment in education programs and programs that assist Pennsylvania’s most vulnerable residents.
Over the next four years, Governor Rendell has asked his Cabinet to find ways to cut another $500 million from the cost of government. The commonwealth will seek to generate additional savings by encouraging agencies to share services such as document scanning, production-level printing and information technology expertise. The Department of General Services will apply strategic sourcing to the purchase of additional goods and services and to new or renewed supplier contract negotiations.
Controlling Costs and Increasing EfficienciesWhen Governor Rendell took office he was determined to
reduce the administrative cost of operating state government. By implementing initiatives designed to generate savings
across the commonwealth – eliminating unused phone lines, consolidating warehouses, reducing the size of the fleet, and managing the employee complement – the administration has been able to reduce agency operating budgets by an average of 2 percent through 2007-08. This reduction over a five-year period is even more impressive when considering that contractually mandated salary costs and necessary spending for benefits grew over the same period of time. Some significant cost-reduction efforts over the last four years have included:
• Reducing pharmacy-related costs at the Department of Public Welfare by $86 million through the implementation of a preferred drug list and renegotiation of pharmacy reimbursement agreements.
• Saving more than $180 million on goods and services purchased by the commonwealth through the Department of General Services’ Strategic Sourcing initiative.
• Managing the size of the vehicle fleet and increasing the mileage life of fleet vehicles to yield one-time savings of more than $33 million and recurring annual savings of nearly $7 million.
• Using energy-efficient materials in construction projects through the Guaranteed Energy Savings Contracts program to offset construction costs has saved the commonwealth approximately $2 million in energy costs.
$25
$341
$1,000
$0
$200
$400
$600
$800
$1,000
$1,200
FY2004-05 FY2005-06 FY2006-07
(in
mil
lio
ns)
Recurring Savings fromManagement and Productivity Initiatives

��
• As part of the commonwealth’s efforts to hold inmates financially accountable for their actions, the Department of Corrections may collect up to 50 percent of an inmate’s account balance and monthly income toward court-ordered restitution, fees, fines and costs. Through this program, the commonwealth receives approximately $3 million a year, offsetting various institutional administrative costs.
• Consolidating programs and operations and moving to more efficient locations have yielded savings of almost $15 million a year at the Department of Public Welfare and the Department of Corrections.
Ongoing Operational CostsThe Office of Management and Productivity is examining
a number of areas in which the commonwealth expends significant funds on day-to-day operational costs, including mail, production-level printing, cell phones, call-center staffing, and office printers. Initiatives to reduce costs in these areas are expected to generate $20 million in annual savings.
• Size of GovernmentThe 2007-08 budget reduces the commonwealth’s authorized complement by an additional 708 positions with no layoffs, furloughs or cutbacks in government services. Complement additions to several agencies in 2007-08 will ensure successful implementation of the Governor’s new initiatives while still achieving a net reduction of 2,811 positions since Governor Rendell took office.
• Buying SmarterThe Department of General Services will continue its strategic sourcing initiatives through the next generation of new and renewed material and service contracts. These efforts will save the commonwealth an additional $60 million to $100 million over the next four years.
• FleetThe Department of General Services and the Office of Management and Productivity will seek to reduce overall fuel consumption and explore the use of alternative fuels. These initiatives are expected to save another $2 million to $3 million a year.
Taking Advantage of TechnologyTechnology improvements have helped the commonwealth
save millions of dollars on printing, postage and labor that were required by outdated, paper-based processes. Some examples include:
• Issuing child support payments electronically instead of by paper check, thereby saving the state more than $2 million a year in printing costs.
Making Government Work Smarter• Producing newsletters and promotional materials
online instead of on paper, which has saved the Department of Environmental Protection $240,000 a year since 2004-05.
• Increasing the number of unemployment compensation claims filed online by 7 percent since 2003, which has saved the Department of Labor and Industry more than $200,000 a year. The administration will seek to further leverage its investments in technology to increase efficiencies and provide more timely services to Pennsylvania taxpayers such as bringing vital records online, managing health records electronically, and upgrading major applications at the Department of Labor and Industry.
In addition, the Office of Information Technology will re-evaluate how the commonwealth purchases technology infrastructure and provides agencies with technology support services. Agencies should see an increased level of service and lower technology infrastructure costs once the commonwealth redesigns the provisioning of technology services. While still in an early stage of development, these efforts could yield millions of dollars of savings in technology-associated costs over the next four years.
Generating New RevenuesIn addition to controlling the cost of government, over the
past four years Governor Rendell’s administration has also focused on increasing state revenues.
• Lottery Revenues
During the past four years, the Pennsylvania Lottery significantly increased its annual revenues. By developing new games, expanding traditional game opportunities, and increasing the number of retailers, the Pennsylvania Lottery has been able to exceed the prior administration’s net revenue projections for 2006-07 by $193 million. A renewed focus on retailer recruiting has increased the number of Pennsylvania Lottery retailers from 6,900 in 2003 to 8,500 today – a 23 percent gain.
• Liquor Sales Revenues
The Pennsylvania Liquor Control Board’s consumer-oriented initiatives continue to generate significant new revenues. The Sunday sales program now includes 159 stores that generated gross revenues of $52 million. Since 2005-06 the board has opened 20 “One Stop Shops” – liquor stores located in grocery stores – across the commonwealth. These stores are complemented by seven new strategically placed outlet stores designed to attract customers who may have previously purchased out-of-state, along with more than 70 Premium Collection facilities that provide customers with the broader wine selections they have been seeking for years. The board has also launched a full-service e-commerce web site at www.pawineandspirits.com and purchases through the website generated $1.3 million in tax revenue last year.

��
• In 2004, even before state-provided property tax relief had gone into effect, Pennsylvania ranked 24th best of all the states in annual per capita property taxes. The commonwealth had a better ranking than neighboring states New Jersey, New York and Maryland.
Building a Stronger PennsylvaniaThe tax changes in this budget will improve our
commonwealth’s competitive standing and the well-being of our residents. These adjustments will make it possible for Pennsylvania to:
• Provide hundreds of millions of dollars in additional property tax relief.
• Bring down the cost of health care for employers and employees.
• Level the playing field for Pennsylvania companies by increasing tax fairness among Pennsylvania’s businesses.
• Meet the urgent transportation needs of Pennsylvania’s employers and workers.
• Bring many new jobs to our state by giving Pennsylvania a leadership role in the Renewable Energy Economy.
The Governor’s 2007-08 budget continues to improve Pennsylvania’s business tax competitiveness by continuing the phase-out of the Capital Stock and Franchise Tax, reducing the tax rate by another mill and thereby generating an additional $215 million in savings to Pennsylvania businesses in 2007-08. Nearly $2.2 billion in cumulative business tax cuts will be realized by the end of 2007-08.
Along with the multi-year tax reductions, an unprecedented effort to streamline the way state government does business has also benefited taxpayers. Today, state government is leaner and more efficient than ever – with $1 billion in savings realized through smarter government operations.
Governor Rendell recognizes that Pennsylvania must continue to modernize its tax structure to make it more competitive with other states while still enabling vital investments in critical services needed by Pennsylvania’s citizens.
Pennsylvania is Moving in the Right DirectionThe multi-billion-dollar tax cuts of the last four years have
been targeted to the areas where they will be most effective in improving the commonwealth’s competitiveness, creating jobs and helping families.
By virtually any measure, the level of taxes in Pennsylvania is in line with – and in many cases is better than – the tax climate in neighboring and competitor states, as may be seen by the following:
• Pennsylvania’s Personal Income Tax is the 2nd lowest of all states with a Personal Income Tax.
• The non-partisan, business-funded Tax Foundation rates the commonwealth’s business tax climate as more favorable than all of our neighboring states except Delaware, and Pennsylvania’s ranking has moved up six places (to 22nd) since 2003.
• In 2005, Pennsylvania ranked 22nd best in the nation in annual per-capita taxes – just $3.48 above the national average of $2,190. The commonwealth’s per capita tax burden is lower than that of Delaware, New Jersey, New York, Maryland and West Virginia.
• Pennsylvania ranked 32nd best of all the states in 2005 in total taxes as a percent of personal income – better than West Virginia, Delaware, New York and Ohio.
Over the last four years, the commonwealth has enacted $2.5 billion of tax relief – including $1.2 billion in business tax cuts and $393 million in savings for Pennsylvania families. Even before factoring in the next phase of the ongoing, multi-year phase-out of the Capital Stock and Franchise Tax, businesses will save $776 million dollars in business taxes in 2007-08 based on tax cuts already enacted during the Rendell administration.
Pennsylvania’s Tax Structure

��
National Growth in General Fund BudgetsAll State Average Increase: 7.0%
4.5%Georgia9.4%Missouri-8.8%Oregon4.8%Montana9.4%Massachusetts-5.4%Louisiana4.9%Ohio9.5%Oklahoma
1.5%Vermont5.8%Pennsylvania11.8%Arizona
-3.9%New Mexico5.1%Colorado10.1%West Virginia
-1.4%Texas5.2%Wisconsin10.2%Alabama0.0%Minnesota5.2%Iowa10.6%North Carolina0.4%Washington5.7%Idaho11.7%New Jersey
1.6%South Dakota5.9%Tennessee12.2%Delaware1.6%Maine6.0%North Dakota14.3%Nevada1.9%Indiana6.1%Arkansas14.4%Maryland2.0%Connecticut7.3%Kansas15.4%Virginia2.1%Michigan7.9%Florida16.0%Hawaii2.3%New Hampshire8.7%Mississippi16.6%Wyoming3.7%Kentucky9.1%Nebraska17.0%Utah3.9%Rhode Island9.2%California20.1%South Carolina4.3%Illinois9.4%New York27.9%Alaska
Source: National Association of State Budget Officers
Budget Growth in Perspective
Across all 50 states, 26 states enacted budgets in 2006-07 that exceeded Pennsylvania’s 5.8 percent rate of growth.The average spending increase for all states is 7.0 percent this year compared to the year before. The increased spending proposed for 2007-08 in Pennsylvania’s budget is only a 3.6 percent increase over the current year.
The 2007-08 General Fund budget is $27.3 billion, an increase of $948 million or 3.6 percent over 2006-07. The proposed budget increases spending on the Departments of Education, Public Welfare, Corrections and Probation & Parole by $1.1 billion, or 5.1 percent, from 2006-07. The remainder of the General Fund budget decreases by $162 million.
Growth in 2007-08
National Growth in General Fund Budgets
$20
$24
$28
Bill
ion
s
2006-07 2007-08
$1.1 billionincrease in
DPW,Education,Corrections
and Probationand Parole
All other spending decreases by $162 million
2006-07 All-State Average Increase: 7.0%Federal Changes Total Impact from
FY 2002-03 to FY 2006-07Additional
Impact 2007-08IGT Phase-Out -$513.3 M -$109.1 MFMAP Reduction -$27.3 M -$45.4 MOne-Time Enhanced FMAP -$336.4 M –One-Time Flexible Grant -$418.0 M –Medicare Part D “Clawback” -$338.5 M –Federal Block Grant Cuts -$57.7 M -$8.3 MSpecial Education (IDEA Part B) -$99.2 M -$8.2 MEarly Intervention -$73.5 M -$42.0 MChild Protection Services -$72.8 M -$38.0 MChild Care Services -$49.0 M -$68.4 MTANF Reauthorization -$38.0 M –Medical Assistance Citizenship -$3.0 M –Mandatory Eligibility/Utilization – -$351.9MMandatory Annualization of Caseload – -$16.9 MChild Support Matching Funds Reduction – -$7.5 MRevenue Loss due to Federal Legislation (reduces CNI revenue)
– -$12.4 M
Reduction in Title VI State Assessments – -$9.6 M
Grand Total -$2,026.7 M -$717.7 M

��
Pennsylvania faces constant pressure from federal funding cuts. From 2002-03 through 2006-07, the federal government cut more than $2 billion in funding for Pennsylvania, forcing the state to make up for federal cuts with state funds. The alternative would have been to make deep cuts in funding for specific human service programs like nursing home care and protective services for abused and neglected children.
Impact of Federal Funding Cuts
Pennsylvania has absorbed $2 billion of Federal cutbacks, underfunded programs and unfunded Federal mandates over the past four years, and now the commonwealth will have an additional $717.7 million in federal cuts to absorb in 2007-08. This is on top of the $325 million 2007-08 “clawback” payment the federal government is requiring from Pennsylvania to help pay for the new Medicare Part D federal program.
Federal funding is declining in a number of areas. Most significantly, the phase out of the Intergovernmental Transfer (IGT) has reduced an important funding stream for supporting nursing home care for the elderly. Since
2002-03 Pennsylvania has absorbed a total of $622 million in reduced annual IGT funds.
Block grant funding is another area where there has been erosion since 2002-03, with $66 million less in federal funding in 2007-08 than in 2002-03.
Meanwhile Pennsylvania continues to absorb growing costs that are mandated by the federal government for special education and early intervention. If Federal IDEA funds were provided at the promised level of 40 percent, Pennsylvania would receive an additional $484 million for special education on an annual basis.
Federal Changes Total Impact fromFY 2002-03 to FY 2006-07
AdditionalImpact 2007-08
IGT Phase-Out -$513.3 M -$109.1 MFMAP Reduction -$27.3 M -$45.4 MOne-Time Enhanced FMAP -$336.4 M –One-Time Flexible Grant -$418.0 M –Medicare Part D “Clawback” -$338.5 M –Federal Block Grant Cuts -$57.7 M -$8.3 MSpecial Education (IDEA Part B) -$99.2 M -$8.2 MEarly Intervention -$73.5 M -$42.0 MChild Protection Services -$72.8 M -$38.0 MChild Care Services -$49.0 M -$68.4 MTANF Reauthorization -$38.0 M –Medical Assistance Citizenship -$3.0 M –Mandatory Eligibility/Utilization – -$351.9MMandatory Annualization of Caseload – -$16.9 MChild Support Matching Funds Reduction – -$7.5 MRevenue Loss due to Federal Legislation (reduces CNI revenue)
– -$12.4 M
Reduction in Title VI State Assessments – -$9.6 M
Grand Total -$2,026.7 M -$717.7 M
Loss of Federal Funding2002-03 through 2007-08

��
Actual Estimated Estimated Collections Collections CollectionsDollars in Millions 2005-06 2006-07 2007-08
Personal Income Tax $ 9,524.1 $ 10,030.0 $ 10,502.9
Sales and Use Tax 1 $ 8,334.2 $ 8,545.7 $ 9,636.1
Corporate Net Income Tax $ 2,301.9 $ 2,476.9 $ 2,542.0
Capital Stock and Franchise Tax* $ 1,080.9 $ 923.6 $ 734.1
Gross Receipts Tax $ 1,150.9 $ 1,216.9 $ 1,244.1
Cigarette Tax & Other Tobacco Products2 $ 792.1 $ 778.0 $ 843.7
Other Taxes $ 2,186.0 $ 2,252.2 $ 2,296.8
Non-Tax Revenues $ 484.2 $ 642.9 $ 592.7
Total $ 25,854.3 $ 26,866.2 $ 28,392.4
Difference from prior year $ 1,545.8 $ 1,011.9 $ 1,526.2 Percentage difference 6.4% 3.9% 5.7%
* Effective with tax year 2004, the Capital Stock and Franchise Tax was reduced by a quarter mill from 7.24 mills to 6.99 mills. The rate was reduced an additional 1 mill on January 1, 2005. The FY 2006-07 enacted budget accelerated the rate reduction by an additional one-tenth of a mill in tax year 2006 by reducing the rate by 1.1 mills to 4.89 mills on January 1, 2006. Effective January 1, 2007 the rate was further reduced by an additional 1 mill bringing the rate down to 3.89 mills for 2007. Thereafter, the rate declines by one mill per year until the tax is eliminated in 2011.
1 Governor’s FY 2007-08 Budget proposes to increase the Sales and Use Tax Rate from 6 percent to 7 percent with a portion of the proposed increase to be used to provide additional relief from local Property Taxes.
2 Governor’s FY 2007-08 Budget proposes to increase the Cigarette Tax by the equivalent of 10 cents per pack of cigarettes to $1.45 per pack and to impose a new tax on other tobacco products of 36 cents per ounce on smokeless and loose tobacco, and the equivalent of 36 cents per 10 sticks of cigars and cigarillos.
2007-08 General Fund revenues
Improvement, Design — $371State Police — $499
Other — $222
Local Subsidy — $211
Licensing & Safety — $144Debt Service — $24
Total Outgo ............... $3,317Ending Balance ........ 22 TOTAL ........ $3,339
2007-08 Motor license Fund
Total Income ............. $3,268Beginning Balance.... 71 TOTAL ........ $3,339
Liquid Fuels Tax — $1,275
New Highway & Bridge Program Revenues — $965
Licenses and Fees — $893
Other — $135
(Dollars in Millions)
INCOME
PA Revenue Sources
Maintenance — $881
OUTGO(Dollars in Millions)
New Highway & Bridge Program — $965
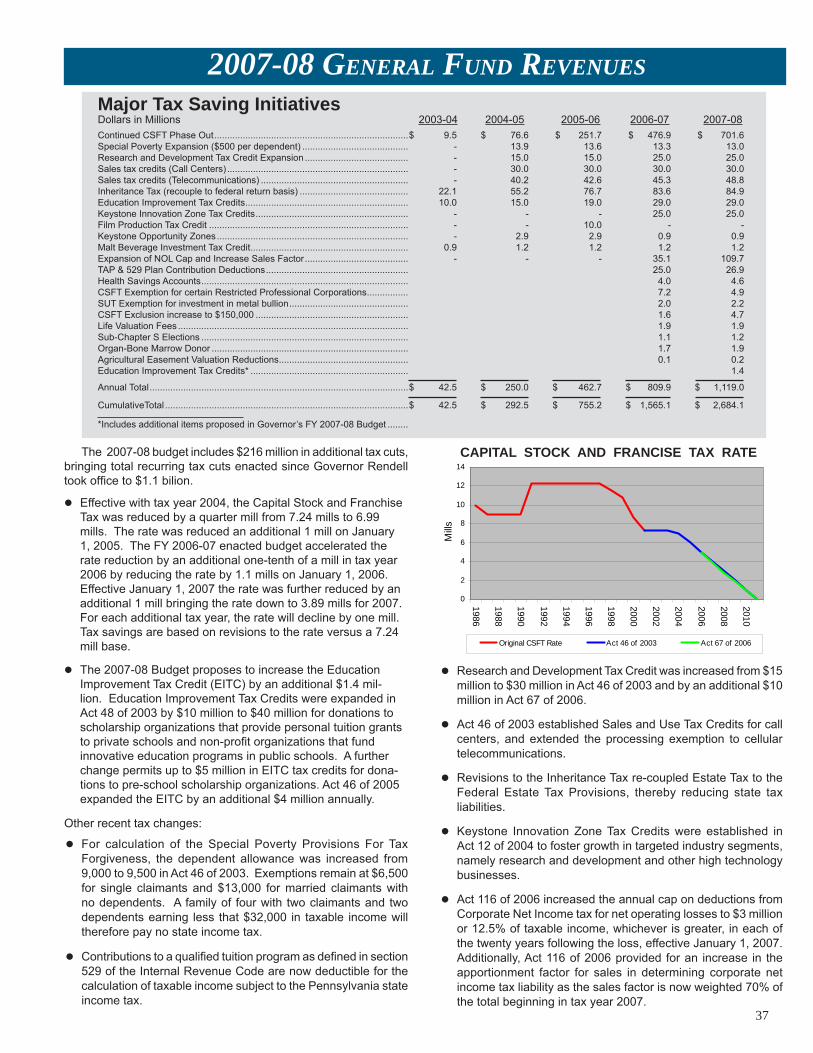
��
2007-08 General Fund revenuesMajor Tax Saving Initiatives Dollars in Millions 2003-04 2004-05 2005-06 2006-07 2007-08 Continued CSFT Phase Out ...........................................................................$ 9.5 $ 76.6 $ 251.7 $ 476.9 $ 701.6 Special Poverty Expansion ($500 per dependent) ......................................... - 13.9 13.6 13.3 13.0 Research and Development Tax Credit Expansion ........................................ - 15.0 15.0 25.0 25.0 Sales tax credits (Call Centers) ...................................................................... - 30.0 30.0 30.0 30.0 Sales tax credits (Telecommunications) ......................................................... - 40.2 42.6 45.3 48.8 Inheritance Tax (recouple to federal return basis) .......................................... 22.1 55.2 76.7 83.6 84.9 Education Improvement Tax Credits ............................................................... 10.0 15.0 19.0 29.0 29.0 Keystone Innovation Zone Tax Credits ........................................................... - - - 25.0 25.0 Film Production Tax Credit ............................................................................. - - 10.0 - - Keystone Opportunity Zones .......................................................................... - 2.9 2.9 0.9 0.9 Malt Beverage Investment Tax Credit ............................................................. 0.9 1.2 1.2 1.2 1.2 Expansion of NOL Cap and Increase Sales Factor ........................................ - - - 35.1 109.7 TAP & 529 Plan Contribution Deductions ....................................................... 25.0 26.9 Health Savings Accounts ................................................................................ 4.0 4.6 CSFT Exemption for certain Restricted Professional Corporations ................ 7.2 4.9 SUT Exemption for investment in metal bullion .............................................. 2.0 2.2 CSFT Exclusion increase to $150,000 ........................................................... 1.6 4.7 Life Valuation Fees ......................................................................................... 1.9 1.9 Sub-Chapter S Elections ................................................................................ 1.1 1.2 Organ-Bone Marrow Donor ............................................................................ 1.7 1.9 Agricultural Easement Valuation Reductions .................................................. 0.1 0.2 Education Improvement Tax Credits* ............................................................. 1.4 Annual Total ....................................................................................................$ 42.5 $ 250.0 $ 462.7 $ 809.9 $ 1,119.0 CumulativeTotal ..............................................................................................$ 42.5 $ 292.5 $ 755.2 $ 1,565.1 $ 2,684.1 *Includes additional items proposed in Governor’s FY 2007-08 Budget ........
The 2007-08 budget includes $216 million in additional tax cuts, bringing total recurring tax cuts enacted since Governor Rendell took office to $1.1 bilion.
• Effective with tax year 2004, the Capital Stock and Franchise Tax was reduced by a quarter mill from 7.24 mills to 6.99 mills. The rate was reduced an additional 1 mill on January 1, 2005. The FY 2006-07 enacted budget accelerated the rate reduction by an additional one-tenth of a mill in tax year 2006 by reducing the rate by 1.1 mills on January 1, 2006. Effective January 1, 2007 the rate was further reduced by an additional 1 mill bringing the rate down to 3.89 mills for 2007. For each additional tax year, the rate will decline by one mill. Tax savings are based on revisions to the rate versus a 7.24 mill base.
•
The 2007-08 Budget proposes to increase the Education Improvement Tax Credit (EITC) by an additional $1.4 mil-lion. Education Improvement Tax Credits were expanded in Act 48 of 2003 by $10 million to $40 million for donations to scholarship organizations that provide personal tuition grants to private schools and non-profit organizations that fund innovative education programs in public schools. A further change permits up to $5 million in EITC tax credits for dona-tions to pre-school scholarship organizations. Act 46 of 2005 expanded the EITC by an additional $4 million annually.
Other recent tax changes:
•
For calculation of the Special Poverty Provisions For Tax Forgiveness, the dependent allowance was increased from 9,000 to 9,500 in Act 46 of 2003. Exemptions remain at $6,500 for single claimants and $13,000 for married claimants with no dependents. A family of four with two claimants and two dependents earning less that $32,000 in taxable income will therefore pay no state income tax.
•
Contributions to a qualified tuition program as defined in section 529 of the Internal Revenue Code are now deductible for the calculation of taxable income subject to the Pennsylvania state income tax.
• Research and Development Tax Credit was increased from $15 million to $30 million in Act 46 of 2003 and by an additional $10 million in Act 67 of 2006.
• Act 46 of 2003 established Sales and Use Tax Credits for call centers, and extended the processing exemption to cellular telecommunications.
• Revisions to the Inheritance Tax re-coupled Estate Tax to the Federal Estate Tax Provisions, thereby reducing state tax liabilities.
• Keystone Innovation Zone Tax Credits were established in Act 12 of 2004 to foster growth in targeted industry segments, namely research and development and other high technology businesses.
• Act 116 of 2006 increased the annual cap on deductions from Corporate Net Income tax for net operating losses to $3 million or 12.5% of taxable income, whichever is greater, in each of the twenty years following the loss, effective January 1, 2007. Additionally, Act 116 of 2006 provided for an increase in the apportionment factor for sales in determining corporate net income tax liability as the sales factor is now weighted 70% of the total beginning in tax year 2007.
CAPITAL STOCK AND FRANCISE TAX RATE
0
2
4
6
8
10
12
14
1986
1988
1990
1992
1994
1996
1998
2000
2002
2004
2006
2008
2010
Mill
s
Original CSFT Rate Act 46 of 2003 Act 67 of 2006
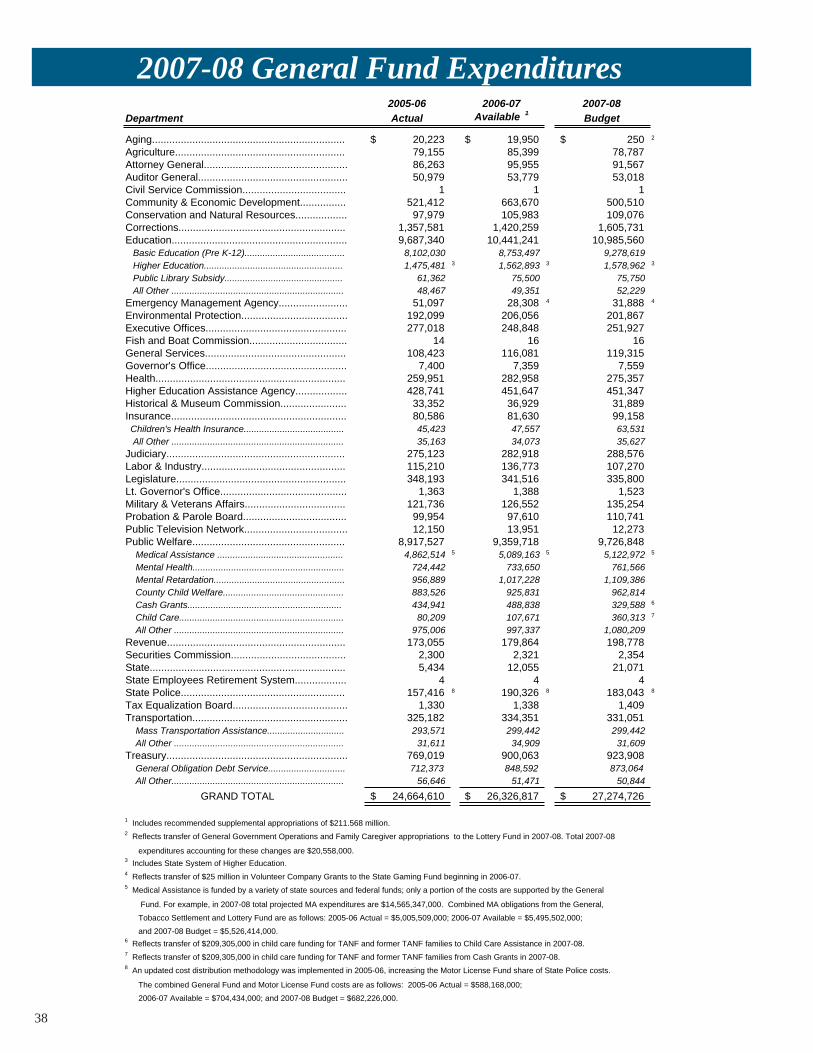
��
2007-08 General Fund Expenditures2005-06 2006-07 2007-08
Department Actual Available 1Budget
Aging................................................................... 20,223$ 19,950$ 250$ 2
Agriculture........................................................... 79,155 85,399 78,787Attorney General.................................................. 86,263 95,955 91,567Auditor General.................................................... 50,979 53,779 53,018Civil Service Commission.................................... 1 1 1Community & Economic Development................ 521,412 663,670 500,510Conservation and Natural Resources.................. 97,979 105,983 109,076Corrections.......................................................... 1,357,581 1,420,259 1,605,731Education............................................................. 9,687,340 10,441,241 10,985,560 Basic Education (Pre K-12)....................................... 8,102,030 8,753,497 9,278,619 Higher Education...................................................... 1,475,481 3 1,562,893 3 1,578,962 3
Public Library Subsidy.............................................. 61,362 75,500 75,750 All Other ................................................................... 48,467 49,351 52,229 Emergency Management Agency........................ 51,097 28,308 4 31,888 4
Environmental Protection..................................... 192,099 206,056 201,867Executive Offices................................................. 277,018 248,848 251,927Fish and Boat Commission.................................. 14 16 16General Services................................................. 108,423 116,081 119,315Governor's Office................................................. 7,400 7,359 7,559Health.................................................................. 259,951 282,958 275,357Higher Education Assistance Agency.................. 428,741 451,647 451,347Historical & Museum Commission....................... 33,352 36,929 31,889Insurance............................................................. 80,586 81,630 99,158 Children's Health Insurance....................................... 45,423 47,557 63,531 All Other ................................................................... 35,163 34,073 35,627 Judiciary.............................................................. 275,123 282,918 288,576Labor & Industry.................................................. 115,210 136,773 107,270Legislature........................................................... 348,193 341,516 335,800Lt. Governor's Office............................................ 1,363 1,388 1,523Military & Veterans Affairs................................... 121,736 126,552 135,254Probation & Parole Board.................................... 99,954 97,610 110,741Public Television Network.................................... 12,150 13,951 12,273Public Welfare..................................................... 8,917,527 9,359,718 9,726,848 Medical Assistance ................................................. 4,862,514 5 5,089,163 5 5,122,972 5
Mental Health........................................................... 724,442 733,650 761,566 Mental Retardation................................................... 956,889 1,017,228 1,109,386 County Child Welfare............................................... 883,526 925,831 962,814 Cash Grants............................................................ 434,941 488,838 329,588 6
Child Care................................................................ 80,209 107,671 360,313 7
All Other .................................................................. 975,006 997,337 1,080,209 Revenue.............................................................. 173,055 179,864 198,778Securities Commission........................................ 2,300 2,321 2,354State.................................................................... 5,434 12,055 21,071State Employees Retirement System.................. 4 4 4State Police......................................................... 157,416 8 190,326 8 183,043 8
Tax Equalization Board........................................ 1,330 1,338 1,409Transportation...................................................... 325,182 334,351 331,051 Mass Transportation Assistance.............................. 293,571 299,442 299,442 All Other .................................................................. 31,611 34,909 31,609 Treasury............................................................... 769,019 900,063 923,908 General Obligation Debt Service.............................. 712,373 848,592 873,064 All Other................................................................... 56,646 51,471 50,844
GRAND TOTAL 24,664,610$ 26,326,817$ 27,274,726$
1 Includes recommended supplemental appropriations of $211.568 million.2 Reflects transfer of General Government Operations and Family Caregiver appropriations to the Lottery Fund in 2007-08. Total 2007-08
expenditures accounting for these changes are $20,558,000.3 Includes State System of Higher Education.4 Reflects transfer of $25 million in Volunteer Company Grants to the State Gaming Fund beginning in 2006-07.5 Medical Assistance is funded by a variety of state sources and federal funds; only a portion of the costs are supported by the General
Fund. For example, in 2007-08 total projected MA expenditures are $14,565,347,000. Combined MA obligations from the General,
Tobacco Settlement and Lottery Fund are as follows: 2005-06 Actual = $5,005,509,000; 2006-07 Available = $5,495,502,000;
and 2007-08 Budget = $5,526,414,000.6 Reflects transfer of $209,305,000 in child care funding for TANF and former TANF families to Child Care Assistance in 2007-08.7 Reflects transfer of $209,305,000 in child care funding for TANF and former TANF families from Cash Grants in 2007-08.8 An updated cost distribution methodology was implemented in 2005-06, increasing the Motor License Fund share of State Police costs.
The combined General Fund and Motor License Fund costs are as follows: 2005-06 Actual = $588,168,000;
2006-07 Available = $704,434,000; and 2007-08 Budget = $682,226,000.
2007-08 GENERAL FUND EXPENDITURES
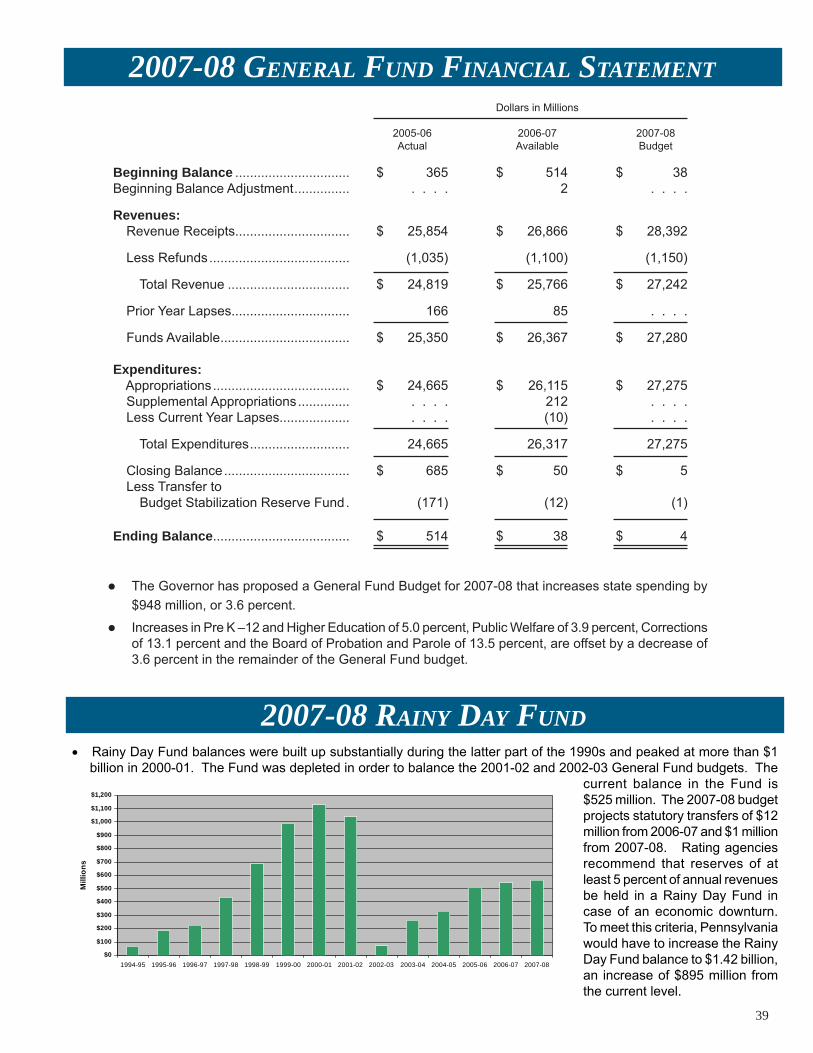
��
2007-08 General Fund Financial stateMent
The Governor has proposed a General Fund Budget for 2007-08 that increases state spending by $948 million, or 3.6 percent.
Increases in Pre K –12 and Higher Education of 5.0 percent, Public Welfare of 3.9 percent, Corrections of 13.1 percent and the Board of Probation and Parole of 13.5 percent, are offset by a decrease of 3.6 percent in the remainder of the General Fund budget.
• Rainy Day Fund balances were built up substantially during the latter part of the 1990s and peaked at more than $1 billion in 2000-01. The Fund was depleted in order to balance the 2001-02 and 2002-03 General Fund budgets. The
current balance in the Fund is $525 million. The 2007-08 budget projects statutory transfers of $12 million from 2006-07 and $1 million from 2007-08. Rating agencies recommend that reserves of at least 5 percent of annual revenues be held in a Rainy Day Fund in case of an economic downturn. To meet this criteria, Pennsylvania would have to increase the Rainy Day Fund balance to $1.42 billion, an increase of $895 million from the current level.
2007-08 rainy day Fund
Beginning Balance ............................... $ 365 $ 514 $ 38Beginning Balance Adjustment ............... . . . . 2 . . . .
Revenues: Revenue Receipts............................... $ 25,854 $ 26,866 $ 28,392 Less Refunds ...................................... (1,035) (1,100) (1,150) Total Revenue ................................. $ 24,819 $ 25,766 $ 27,242 Prior Year Lapses................................ 166 85 . . . . Funds Available ................................... $ 25,350 $ 26,367 $ 27,280 Expenditures: Appropriations ..................................... $ 24,665 $ 26,115 $ 27,275 Supplemental Appropriations .............. . . . . 212 . . . . Less Current Year Lapses................... . . . . (10) . . . . Total Expenditures ........................... 24,665 26,317 27,275 Closing Balance .................................. $ 685 $ 50 $ 5 Less Transfer to Budget Stabilization Reserve Fund . (171) (12) (1) Ending Balance..................................... $ 514 $ 38 $ 4
Dollars in Millions
2005-06 2006-07 2007-08 Actual Available Budget
$0
$100
$200
$300
$400
$500
$600
$700
$800
$900
$1,000
$1,100
$1,200
1994-95 1995-96 1996-97 1997-98 1998-99 1999-00 2000-01 2001-02 2002-03 2003-04 2004-05 2005-06 2006-07 2007-08
Mill
ion
s

�0
129,000130,000131,000132,000133,000134,000135,000136,000
Aug
02
Dec
02
Apr
03
Aug
03
Dec
03
Apr
04
Aug
04
Dec
04
Apr
05
Aug
05
Dec
05
Apr
06
Aug
06
Dec
06
Economic forecasts are a key ingredient in constructing the budget’s revenue forecasts and they also help the govern-ment project likely levels of demand for many public goods and services.
Recent Economic TrendsThe expansion of the national economy has been fairly steady since 2002, despite repeated external shocks that have occurred in the post-recession period. The economy has managed to grow at an average annual rate of 2.9 per-cent since the end of the recession in 2001, though growth is expected to be lower in the coming year.
Although large corporations continued to shed jobs, posi-tive overall job growth in the broader economy returned in 2004 and has continued during 2005 and 2006. Job growth in 2004 added approximately 2.0 million jobs, and employment levels grew even faster in 2005 as ap-proximately 2.6 million jobs were added during that year. But job growth slowed a bit in 2006 as only approximately 1.8 million jobs were added in the past year. The U.S. unemployment rate currently stands at 4.5 per-cent, down from its nine-year high of 6.3 percent in June 2003. The drop in the unemployment rate has occurred over the past three years as more than 6.4 million jobs have been added to the economy, with growth in employ-ment exceeding growth in the labor force.
The recent slowdown in the housing market has yet to fully ripple through the economy in terms of jobs, wages and income and consumer expenditures.
However, the slowdown in this principal driver of the U.S. economy has been substantial in 2006. It is estimated that the housing recession has sliced an estimated 1.2 percent from overall economic growth in the latter part of 2006, its biggest decline in 25 years. New housing starts plunged all year, down 13 percent for 2006 and there has been a drop in home demand and home prices have weakened. Yet surprisingly, consumer spending has not been adversely impacted during the fourth quarter of 2006.
Business investment has been rising for the past three years as firms replenish capital assets neglected from 2001 through the end of 2003. Billions of dollars are being spent by businesses on new factories, offices, equipment and software in an effort to expand and compete globally.
In recent months, the pace of this investment has been ac-celerating as investments in new structures surged 22.2 percent in the second quarter of 2006, the strongest quar-terly increase in 12 years. Overall, business investment is estimated to have increased approximately 7.5 percent in 2006, the highest level of growth since 2000.
Productivity gains from 2001 to 2006 have driven the busi-ness sector side of the current economic expansion, with a 3.1 percent average annual rate of growth in productivity. This surge has exceeded any productivity growth since the 1960s.
However, since recently peaking in 2002, productivity has grown at a slower rate and that slowdown has meant lower real GDP growth.
The Forecast is for Slower Economic GrowthThe economic ouTlook for 2007-08
0%
1%
2%
3%
4%
5%
2000 2001 2002 2003 2004 2005 2006 2007 2008 2009 2010 2011Projected
U.S. EMPLOYMENT GROWTHNon-Agricultural
(Jobs in Thousands)
Rapidly rising energy costs, rising labor costs, and increas-es in health care costs combined with a weak dollar pushed inflation to 3.4 percent in 2005. More recently, preliminary data from the U.S. Labor Department indicates that for all of 2006, inflation averaged 2.5 percent, the slowest rate of growth in three years.
REAL GROSS DOMESTIC PRODUCTAnnual Growth
PRODUCTIVITY GAINSAnnual Growth
Projected
0%
1%
2%
3%
4%
5%
2000 2001 2002 2003 2004 2005 2006 2007 2008 2009 2010 2011
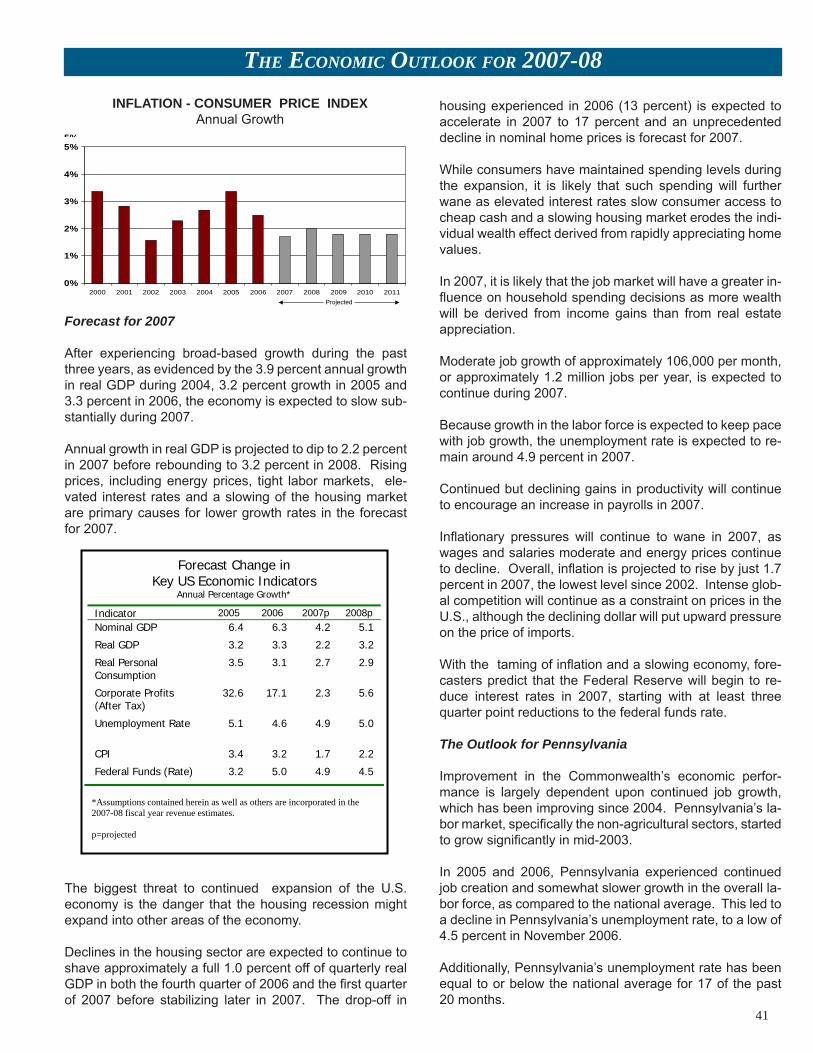
��
Projected
0%
1%
2%
3%
4%
5%
2000 2001 2002 2003 2004 2005 2006 2007 2008 2009 2010 2011
Projected
0%
1%
2%
3%
4%
5%
2000 2001 2002 2003 2004 2005 2006 2007 2008 2009 2010 2011
The Forecast is for Moderate Economic Growththe econoMic outlook For 2007-08
The biggest threat to continued expansion of the U.S. economy is the danger that the housing recession might expand into other areas of the economy.
Declines in the housing sector are expected to continue to shave approximately a full 1.0 percent off of quarterly real GDP in both the fourth quarter of 2006 and the first quarter of 2007 before stabilizing later in 2007. The drop-off in
housing experienced in 2006 (13 percent) is expected to accelerate in 2007 to 17 percent and an unprecedented decline in nominal home prices is forecast for 2007.
While consumers have maintained spending levels during the expansion, it is likely that such spending will further wane as elevated interest rates slow consumer access to cheap cash and a slowing housing market erodes the indi-vidual wealth effect derived from rapidly appreciating home values.
In 2007, it is likely that the job market will have a greater in-fluence on household spending decisions as more wealth will be derived from income gains than from real estate appreciation.
Moderate job growth of approximately 106,000 per month, or approximately 1.2 million jobs per year, is expected to continue during 2007.
Because growth in the labor force is expected to keep pace with job growth, the unemployment rate is expected to re-main around 4.9 percent in 2007.
Continued but declining gains in productivity will continue to encourage an increase in payrolls in 2007.
Inflationary pressures will continue to wane in 2007, as wages and salaries moderate and energy prices continue to decline. Overall, inflation is projected to rise by just 1.7 percent in 2007, the lowest level since 2002. Intense glob-al competition will continue as a constraint on prices in the U.S., although the declining dollar will put upward pressure on the price of imports.
With the taming of inflation and a slowing economy, fore-casters predict that the Federal Reserve will begin to re-duce interest rates in 2007, starting with at least three quarter point reductions to the federal funds rate.
The Outlook for Pennsylvania
Improvement in the Commonwealth’s economic perfor-mance is largely dependent upon continued job growth, which has been improving since 2004. Pennsylvania’s la-bor market, specifically the non-agricultural sectors, started to grow significantly in mid-2003.
In 2005 and 2006, Pennsylvania experienced continued job creation and somewhat slower growth in the overall la-bor force, as compared to the national average. This led to a decline in Pennsylvania’s unemployment rate, to a low of 4.5 percent in November 2006.
Additionally, Pennsylvania’s unemployment rate has been equal to or below the national average for 17 of the past 20 months.
INFLATION - CONSUMER PRICE INDEXAnnual Growth
Forecast Change in Key US Economic Indicators
Annual Percentage Growth*
Indicator 2005 2006 2007p 2008p Nominal GDP 6.4 6.3 4.2 5.1
Real GDP 3.2 3.3 2.2 3.2
Real Personal Consumption
3.5 3.1 2.7 2.9
Corporate Profits (After Tax)
32.6 17.1 2.3 5.6
Unemployment Rate (Rate)
5.1 4.6 4.9 5.0
CPI 3.4 3.2 1.7 2.2
Federal Funds (Rate) 3.2 5.0 4.9 4.5
*Assumptions contained herein as well as others are incorporated in the 2007-08 fiscal year revenue estimates.
p=projected
Forecast for 2007
After experiencing broad-based growth during the past three years, as evidenced by the 3.9 percent annual growth in real GDP during 2004, 3.2 percent growth in 2005 and 3.3 percent in 2006, the economy is expected to slow sub-stantially during 2007.
Annual growth in real GDP is projected to dip to 2.2 percent in 2007 before rebounding to 3.2 percent in 2008. Rising prices, including energy prices, tight labor markets, ele-vated interest rates and a slowing of the housing market are primary causes for lower growth rates in the forecast for 2007.

��
5,600,000
5,650,000
5,700,000
5,750,000
5,800,000
Jul02
Nov02
Mar03
Jul03
Nov03
Mar04
Jul04
Nov04
Mar05
Jul05
Nov05
Mar06
Jul06
Nov06
To date, the Pennsylvania economy has generated more than 153,900 new jobs in the past four years. By Novem-ber 2006, total non-farm jobs reached a record high of 5.779 million.
Annual employment growth in Pennsylvania is forecast at around 0.9 percent through 2008, while longer term job growth through 2011 is forecast to be 0.7 percent.
Further, the state’s unemployment rate is projected to re-main moderate at 4.9 percent from 2007 through 2009, or just above the national average.
Pennsylvania employment sectors experiencing significant job growth since 2000 include leisure and hospitality, the business and professional services sectors and the health care industry.
The service sector has added over 600,000 new jobs since 2000. This employment sector is also increasing as a per-cent of total of employment, up from 32.9 percent in 2000 to 44 percent as of 2005.
Steady Rise in Pennsylvania Jobs(Non-Agriculture)
Growth in health care, business services and tourism em-ployment and recent above-average overall job growth in Pennsylvania during 2004 through 2006 are projected to result in moderate growth of real personal income dur-ing calendar years 2007 and 2008 with more accelerated growth forecast for the period of 2009 through 2011.
Export growth has been key to the resurgence of the Com-monwealth’s economy as the state was ninth in the U.S. during 2005 in the area of exports to foreign countries.
Pennsylvania’s year-over-year growth of 20 percent from 2004 export levels was double the national rate. Pennsylvania is also succeeding in attracting high-value-added industries such as electronics, pharmaceuticals and computer services. This continued diversification of the state’s economy, combined with improvements in the business climate, are projected to support a moderate eco-nomic expansion.
Num
ber o
f Job
sthe econoMic outlook For 2007-08
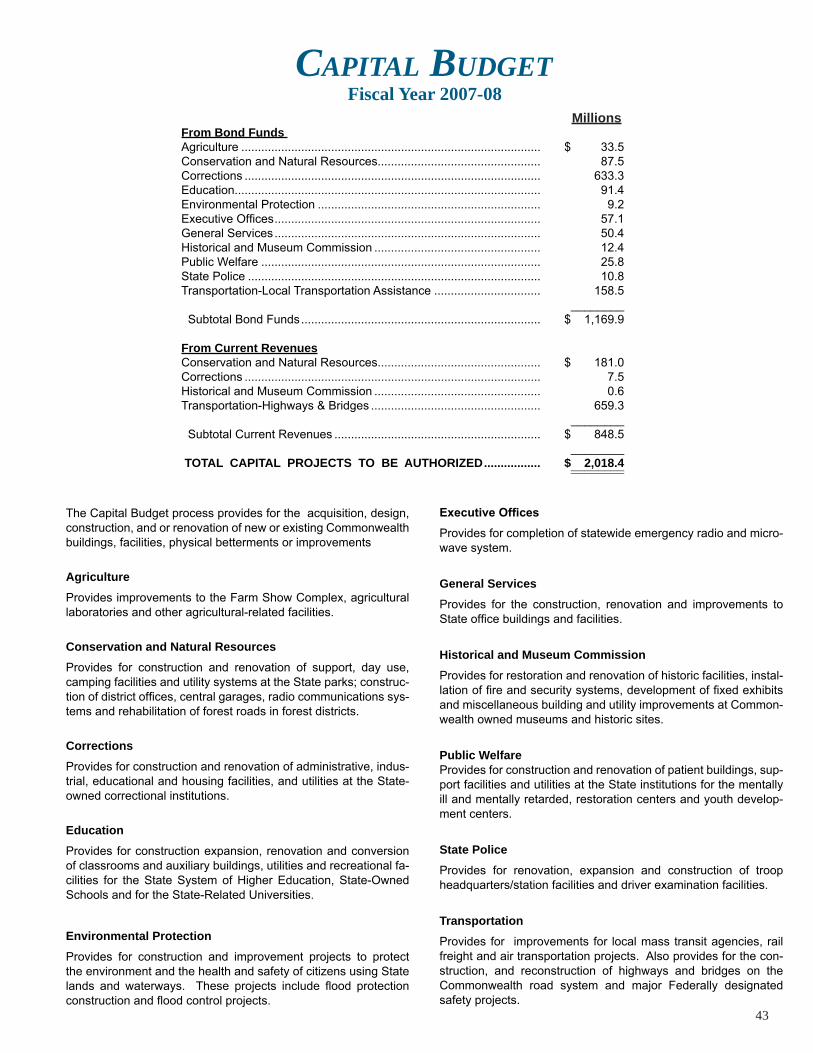
��
From Bond Funds Agriculture .......................................................................................... $ 33.5 Conservation and Natural Resources................................................. 87.5Corrections ......................................................................................... 633.3 Education............................................................................................ 91.4 Environmental Protection ................................................................... 9.2 Executive Offices ................................................................................ 57.1General Services ................................................................................ 50.4Historical and Museum Commission .................................................. 12.4Public Welfare .................................................................................... 25.8State Police ........................................................................................ 10.8Transportation-Local Transportation Assistance ................................ 158.5 ________ Subtotal Bond Funds ........................................................................ $ 1,169.9
From Current RevenuesConservation and Natural Resources................................................. $ 181.0Corrections ......................................................................................... 7.5Historical and Museum Commission .................................................. 0.6 Transportation-Highways & Bridges ................................................... 659.3 ________ Subtotal Current Revenues .............................................................. $ 848.5 ________ TOTAL CAPITAL PROJECTS TO BE AUTHORIZED ................. $ 2,018.4 ________ ________
Fiscal Year 2007-08capital BudGet
The Capital Budget process provides for the acquisition, design, construction, and or renovation of new or existing Commonwealth buildings, facilities, physical betterments or improvements
AgricultureProvides improvements to the Farm Show Complex, agricultural laboratories and other agricultural-related facilities.
Conservation and Natural ResourcesProvides for construction and renovation of support, day use, camping facilities and utility systems at the State parks; construc-tion of district offices, central garages, radio communications sys-tems and rehabilitation of forest roads in forest districts.
CorrectionsProvides for construction and renovation of administrative, indus-trial, educational and housing facilities, and utilities at the State-owned correctional institutions.
EducationProvides for construction expansion, renovation and conversion of classrooms and auxiliary buildings, utilities and recreational fa-cilities for the State System of Higher Education, State-Owned Schools and for the State-Related Universities.
Environmental ProtectionProvides for construction and improvement projects to protect the environment and the health and safety of citizens using State lands and waterways. These projects include flood protection construction and flood control projects.
Executive OfficesProvides for completion of statewide emergency radio and micro-wave system.
General ServicesProvides for the construction, renovation and improvements to State office buildings and facilities.
Historical and Museum CommissionProvides for restoration and renovation of historic facilities, instal-lation of fire and security systems, development of fixed exhibits and miscellaneous building and utility improvements at Common-wealth owned museums and historic sites.
Public WelfareProvides for construction and renovation of patient buildings, sup-port facilities and utilities at the State institutions for the mentally ill and mentally retarded, restoration centers and youth develop-ment centers.
State PoliceProvides for renovation, expansion and construction of troop headquarters/station facilities and driver examination facilities.
TransportationProvides for improvements for local mass transit agencies, rail freight and air transportation projects. Also provides for the con-struction, and reconstruction of highways and bridges on the Commonwealth road system and major Federally designated safety projects.
Millions