tobacco economic of indonesia: poor households’ spending ... · email address:...
TRANSCRIPT

Working Paper in Economics and BusinessVolume III No.2/2013
Tobacco Economic of Indonesia: Poor Households’ Spending Pattern, TaxRegressivity and Economic Wide Impact of Tax Simplification
Rus’an NasrudinLedi Trialdi
Djoni HartonoAbdillah Ahsan
March 2013
Department of EconomicsFaculty of Economics, University of Indonesia
Working Paper in Economics and BusinessChief Editor: Suahasil NazaraEditors: Djoni Hartono, Beta Y. Gitaharie, Femmy Roeslan, Riatu M. QibthiyyahSetting: Rus’an Nasrudin
Copyright c©2013, Department of EconomicsDepartment of Economics Building 2nd FloorDepokWest Java, Indonesia 16424Telp. 021-78886252Email: [email protected]: http://econ.fe.ui.ac.id/workingpage

Contents
Contents 3
List of Tables 4
List of Figures 5
1 Introduction 11.1 Background . . . . . . . . . . . . . . . . . . . . . . . . . . . . . . . . . . . . . . . . 11.2 Objectives of Study . . . . . . . . . . . . . . . . . . . . . . . . . . . . . . . . . . . 2
2 Literature Review 32.1 Spending Pattern of Smoking and Non-Smoking Family . . . . . . . . . . . . . . . 32.2 Tax Burden Regressivity . . . . . . . . . . . . . . . . . . . . . . . . . . . . . . . . . 32.3 Economic Impacts of Simplification of Cigarette Taxation . . . . . . . . . . . . . . 4
3 Methodology 53.1 Household Comparison . . . . . . . . . . . . . . . . . . . . . . . . . . . . . . . . . . 5
3.1.1 Performing T-test . . . . . . . . . . . . . . . . . . . . . . . . . . . . . . . . 53.1.2 The Determinants of Indviduals Smoking Decision . . . . . . . . . . . . . . 6
3.2 Regressivity Analysis . . . . . . . . . . . . . . . . . . . . . . . . . . . . . . . . . . . 63.2.1 Measuring Tax Burden Over Income Groups . . . . . . . . . . . . . . . . . 63.2.2 Change in Regressivity from Tax Inrease . . . . . . . . . . . . . . . . . . . . 7
3.3 Economic Wide Impact Analysis of Simplification of Cigarette Taxation . . . . . . 7
4 Result and Analysis 84.1 Household Comparison Analysis . . . . . . . . . . . . . . . . . . . . . . . . . . . . 8
4.1.1 Descriptive Analysis & T-test Analysis . . . . . . . . . . . . . . . . . . . . . 84.1.2 The Determinants of Individuals Smoking Decision . . . . . . . . . . . . . . 10
4.2 Regressivity Analysis . . . . . . . . . . . . . . . . . . . . . . . . . . . . . . . . . . . 124.2.1 IFLS Data . . . . . . . . . . . . . . . . . . . . . . . . . . . . . . . . . . . . 124.2.2 Average Tax Burden of Cigarette Excise Tax over Income Group . . . . . . 14
4.3 Economic Impact of Simplification of Cigarette Taxation . . . . . . . . . . . . . . . 17
5 Concluding Remarks 23
6 References 23

List of Tables
1 Scenarios in the CGE model . . . . . . . . . . . . . . . . . . . . . . . . . . . . . . . 92 Consumption Priority of Household Group with and without Smoker in Indonesia,
2010 (in percentage and value) . . . . . . . . . . . . . . . . . . . . . . . . . . . . . 93 Consumption Priority of Poor Household Group with and without Smoker in In-
donesia, 2010 (in percentage and value) . . . . . . . . . . . . . . . . . . . . . . . . 114 Impacts of Cigarette Spending on Households Spending Pattern in Indonesia, 2010
(in Percentage and Point Percentage) . . . . . . . . . . . . . . . . . . . . . . . . . . 115 Impacts of Cigarette Spending on Poor Households Spending Pattern in Indonesia,
2010 (in Percentage and Point Percentage) . . . . . . . . . . . . . . . . . . . . . . . 126 Mean Comparison of Portion of Expenditures between Poor Households with and
without Smoker Using T-Test . . . . . . . . . . . . . . . . . . . . . . . . . . . . . . 137 The Distribution of Sample over Brand in Each Taxation Class(%) . . . . . . . . . 158 Cigarette Expenditure as Proportion of Earning per Month by Decile . . . . . . . . 159 Summary of Excise Tax Regressivity Using IFLS (Average Measures) . . . . . . . . 1610 The Impact of Each Scenario on Macro Indicators (%) . . . . . . . . . . . . . . . . 1911 The Impact of Each Scenario on Sectoral Output(%) . . . . . . . . . . . . . . . . . 1912 The Impact of Each Scenario on Sectoral Employment(%) . . . . . . . . . . . . . . 22

List of Figures
1 Logistic Regression on Determinants of Individuals Decision to Smoke . . . . . . . 132 Odds Ratio of Logistic Regression on Determinants of Individuals Decision to Smoke 14

Tobacco Economic of Indonesia: Poor Households’ Spending Pattern, TaxRegressivity and Economic Wide Impact of Cigarette Excise Tax
SimplificationI
Rus’an Nasrudina, Ledi Trialdib, Djoni Hartonoc, Abdillah Ahsand
aDepartment of Economics, Faculty of Economics, University of IndonesiabDepartment of Economics, Faculty of Economics, University of Indonesia
cGraduate Program in Economics, Faculty of Economics, University of IndonesiadThe Demographic Institute, Faculty of Economics, University of Indonesia
Abstract
Policy to reduce cigarette consumption is needed because of the harm to both smokers and thesurrounding healthy. In narrow sense, the harm of cigarette consumption for poor householdsneeds to be taken into account into policy consideration as it expected to sacrifies essentialspending for the poor. In general, any policy related to any influental sector in the economy,including tobacco sector, needs an economic wide impact consideration. This study aims to justifythe policy on three grounds: analysis on poor household with smoker in terms of their spendingpattern, an assessment of the cigarette excise tax burden’s regressivity and and economic wideimpact analysis of a cigarette excise tax simplification. This study find that there is tendency oflower spending on essential good (health and food) of poor household with smoker than withoutsmoker. Secondly, indeed, the tax burden of Indonesia’s excise tax is regressive so that it putburden more to the poor than the richer. Lastly, a cigarette tax increase will reduce nationaloutput with considerably small impact but moderately increase government revenue to boost theeconomy through infrastructure spending as the optimum opt.
JEL Classifications: I18, D58
Keywords: Cigarette, Consumption Pattern, Excise Tax, Regressivity, Computable GeneralEquilibrium
1. Introduction
1.1. Background
There are always at least two rationales be-hind the idea of cigarette taxation increase:to increase government revenue and to reduce
IThis paper is part of SEATCA Initiative on To-bacco Tax (SITT) Indonesia funded by Bill and MelindaGates Foundation.
Email address: [email protected]
(Rus’an Nasrudin)
consumption of cigarette. Policy to reducecigarette consumption is needed because ofthe harm that smoking does to both smok-ers health and that of others. Moreover, interms of welfare of poor households in par-ticular, there is also a potential loss for themdue to shift in spending from essential expen-ditures such as education, health, and foods tocigarette consumption. If the shift is evident,it is likely not only smoking behavior that willpersist in the future, but also the poor eco-
1

Nasrudin et al./Tobacco Economic of Indonesia: ... 2
nomic condition of the households.
In order to increase government revenue andto reduce consumption of cigarette at the sametime, information about price elasticity of de-mand for cigarette is very important. Therehave been many studies investigating it, butthe results are quite similar. Demand forcigarette has been found to be price inelas-tic. For Indonesia, studies from Bird (1999),Marks (2003), and Djutaharta et al. (2005),for instance, revealed that the price elasticityof demand for cigarette in Indonesia was rang-ing from -0.29 to -0.67, meaning that 10 per-cent increase in cigarette price would reduce itsconsumption by 2.9 to 6.7 percent. With theinelastic nature of the demand, economic the-ory suggests that the tax increase in cigarettewill increase revenue generated by government,since the increase in price from higher taxa-tion will outsrip the reduction in consumption.However, with the same nature of elasticity, italso implies that consumption can only be sig-nificantly affected if the tax is also increasedsignificantly.
Significant tax increase may be increasinglyimportant particularly in concern of the poorhouseholds who consume cigarette at present.When the higher tax can only cut back theirconsumption but not able to make them quitsmoking, two different costs might arise. Thefirst cost may result from the higher tax burdenborn by the poor from consuming cigarette.It is related to the regresssivity nature of theexcise tax. Indeed, the regressivity naturemay still need to be checked although manyeconomists already tend to agree with the con-clusion due to the similarity of the excise taxwith any other types of consumption tax. How-ever, the more important observation needed isto identify the regressivity of the tax after itsrate is increased, rather than when the rate isas it is now. As will be discussed further inanother subsection below, increasing the taxrate may further increase the burden of thepoor, thus called regressive, or otherwise, it
may reduce the burden. When the former hap-pens, failure in making the poor quit smok-ing through higher tax would cost them evenhigher.
The second cost may arise from the shiftin the poors priority of spending because ofthe cigarette consumption as mentioned earlier.When the higher tax cannot induce the poor toquit smoking, they will probably maintain theirspending behavior. Therefore, in the future, ifthe shift from some essential spendings is re-ally evident in the poor households spendingpattern, the behavior may sustain their poorsocial and economic condition as well as theirsmoking behavior.
At last, although significant tax increasemight be needed, particulary to salvage thepoor, its wider impact to the economy alsoneeds to be elaborated. The tax increase mayharm, not only the poor who smokes, but alsothe farmers, the labors, and the producers oftobacco and may be the economy as a wholedue to the potential reduction in demand ofthe products. Higher revenue generated fromthe taxation increase may also not happen asexpected, may be because of the complexity ofthe excise tax structure and other tax admin-istration problems.
Despite the fact that many careful consid-erations are required before implementing thepolicy, from the law perspective, room to in-crease tax rate of tobacco product in Indonesiastill opens. The current rate is still below thethreshold allowed by the law, which is up to55 per cent of retail price. In 2009, for to-bacco product, on average total excise rate is42,7 percent and total tax rate is 51,1 percent.The figures are nearly twice those in India andRussia but lower than in Egypt (Ministry ofFinance, 2012).
1.2. Objectives of Study
From the backgrounds presented previously,this study is aimed at evaluating certain as-pects of cigarette taxation in Indonesia. More

Nasrudin et al./Tobacco Economic of Indonesia: ... 3
specifically, the study is trying to answer thefollowing research questions:
1. Is there any significant difference betweenpoor households with and without smokersin terms of their spending on such essen-tial expenditures as education and health?With the current spending pattern, does itaffect the persistence of smoking behaviorin the poor households in the future?
2. Are the current cigarette taxes (i.e. ex-cise tax and value-added tax) regressive?When the excise tax is increased, how doesit affect the demand for cigarette and theregressivity of the taxation?
3. What are the impacts of the increase inexcise tax for cigarette on the economy re-garding government revenue, employment,and household income?
2. Literature Review
2.1. Spending Pattern of Smoking and Non-Smoking Family
Ahsan and Tobing (2008, p.28) revealed thespending structure of the poorest householdwith smokers from 2003 to 2005. Compared toother expenditures, spending for cigarettes inthis group of household was around 12 percentof their total spending. Similar informationcan also be obtained in Barbara S. et al. (2008,p.9), but for data in 2005 and with smallernumber of expenditure category. Moreover, thestudy of Ahsan and Tobing (2008) also esti-mated the impact of household smoking sta-tus to their essential expenditures, namely ex-penditure of sources of protein, expenditure foreducation, and expenditure for health. The es-timation was using log-linear regression withsmoking status of the household representedby a dummy variable. The results show thatsmoking family tends to spend less for educa-tion and health compared to non-smoking fam-ily, but they spend more for expenditure ofsources of protein.
Similar to the study of Ahsan and Tobingabove, Terblanche (2012) attempted to find sig-nificant difference in spending behavior fromsmoking and non-smoking families in SouthAfrica. She used a rather simple method us-ing a parametric T-test. The results seem toreplicate condition in Indonesia, in that smok-ing family again tends to spend less for edu-cation and health compared to non-smokingfamily. However, further estimation was alsoconducted in the study to find determinantsthat affect people’s decision to smoke in SouthAfrica. From the estimation, Terblance foundthat less spending on education by the smok-ing family would imply to lower level of edu-cation attained by the family’s next generationand thus prolong the smoking behavior of thefamily in the future. The estimation from theprevious studies above has not yet observedthe possible different pattern between smok-ing and non-smoking family among the poor-est group. Ahsan and Tobing (2008) only ob-served that households with different incomelevel might have different patern of spending,while Terblanche (2012) did not touch thismatter at all.
2.2. Tax Burden Regressivity
One particular tax system is considered re-gressive if the tax payments increase less pro-portionately with income (Stiglitz 2000, p.159).It suggests that lower income people will haveto bear more tax burden in their income rel-ative to those who have higher income, thusthey are unfairly treated by the tax system.
Excise tax for cigarette naturally has the re-gressive nature of taxation. As all other typesof tax that tax consumption, it becomes regres-sive since the propensity to consume tends todecrease as income rises (Tamaoka 1994, p.57).The regressivity of consumption tax is also ev-ident whatever the time horizon (Chernick &Reschovsky 2000, p.60). No matter when thetax is implemented, the regressivity nature willstill persist. Moreover, since the prevalence ofsmoking is higher among the poor, cigarettes

Nasrudin et al./Tobacco Economic of Indonesia: ... 4
are disproportionately consumed more by thepoor. Removing the regressivity of the excisetax is hardly done, particularly when govern-ment only targets excise tax and ignores theother kinds of consumption tax. Some advo-cates of high cigarette taxes, while acknowledg-ing their regressivity, however, suggesting thatincreasing cigarette taxation may result in pro-gressive tax. It means, after the tax increase,poorer people will bear a lower tax burden rel-ative to their income.
Borren and Sutton (1992) and Townsend(1987) evaluated the overall increase incigarette taxation in the United Kingdom. Inso doing, their works put strong emphasis onestimating the cigarette demand for differentsocial class based on a log-linear single equationmodel. Since the increase in cigarette taxationwould affect number of cigarette consumptionthrough the price channel, the estimated de-mand function would provide the necessary in-formation about the price-elasticity of demand.While Borren and Sutton (1992) with the ex-tended data set did not find evidence of increas-ing price-elasticity by social class (from thehighest to the lowest class), the former workof Townsend (1987) found the opposite. Asa consequence, the two studies came up withdifferent suggestion. Borren and Sutton sug-gested that increasing the levy on cigaretteswas a regressive policy, whereas Townsend sug-gested the opposite due to her observation thatthe lower social classes were more sensitive toprice changes.
Warner (2000), Evans and Farrelly (1998),and Townsend again with Roderick and Cooper(1994), as summarized in Remler (2004), havemaintained the proposition of Townsend (1987)that indeed, the poor are more price responsiveand thus a tax increase may not be regressive.Remler (2004) himself, supported the idea andliterally evaluated the effects of higher cigarettetaxes on three types of smokers (i.e. smokerswho quit, who does not quit, and who cut back)utilizing three alternative methods of assessing
tax burden, namely the accounting measure,the traditional welfare-based measure, and thetime-inconsistent welfare based measure.
As has been summarized by Barber S. et al.(2008), some studies have also been conductedto estimate the demand function of cigarette inIndonesia. For instance, Bird (1999), with anerror correction model using annual aggregatedata from 1970 to 1994; De Beyer and Yurekly(2000), with a log linear model using time se-ries data from 1980 to 1995; Djutaharta et al.(2005), with the similar log linear model butusing annual data from 1970 to 2001 and alsomonthly data from 1996 to 2001; and Marks(2003), with a series of model that take into ac-count population growth, income growth, andsubstitution between cigarette products usingaggregate data from 1999 to 2002. From thosestudies, the price elasticities of demand forcigarette in Indonesia were ranging from -0.29to -0.67.
Nevertheless, the price elasticity numbersfrom all studies above are obtained for aggre-gate numbers. The estimation of price elastic-ity of demand for different social class in In-donesia could not be observed up until a studyconducted by Ahsan and Tobing (2008). Intheir study, social class was divided into incomequintiles; with quintile I to quintile V repre-sented the lowest to the highest income group.The price elasticities resulted from their condi-tional cigarette demand estimation varied from-0.06 (quintile II) to -0.41 (quintile IV). The re-sult seems to suggest that there was no clearindication of the increasing price sensitivity forthe poorer income people in Indonesia.
2.3. Economic Impacts of Simplification ofCigarette Taxation
Tobacco product is believed to be stronglyrelated to other sectors in the economy so thatany tax increase might create wide impact tothe economy. Three important indicators re-lated to this shock include unemployment, gov-ernment revenue and tobacco sector itself.

Nasrudin et al./Tobacco Economic of Indonesia: ... 5
Some previous studies have tried to mea-sure the impact of particular variable in re-sponse to tobacco tax changes. Walbeek (2010)presented a model that predicts changes incigarette consumption and excise revenue inresponse to excise tax changes, and demon-strated that, if the industry has market power,the consequences from increases in specifictaxes are easier to control than those from in-creases in ad valorem taxes. Djutaharta et al.(2005) focused on the impacts of tax rate in-crease on government revenue income and priceelasticities using stochastic model. The studyfound that an increase in the tax level of 10,50 and 100 percent would increase total taxrevenue by 9, 43 and 82 percent respectively.Ahsan and Wiyono (2007) combined the resultof elasticities from Djutaharta et. al (2005)and I-O based model to estimate the impactof 100 percent tax increase on the output, em-ployment and income.
Unfortunately, there is limited attempt fromthe studies above to measure and explain thewide impact of simplification of tobacco prod-uct structure to the economy. This study isaimed to fill the void by providing alternativeapproach using a computable general equilib-rium approach that decompose the standardsectors of the 24-social accounting matrix datato meet the structure of current excise tax oftobacco product layers in Indonesia in order tomeet the objective.
3. Methodology
3.1. Household Comparison
3.1.1. Performing T-test
The main question raised in this sectionis whether there is statistically significanceof the difference in socio-economic expendi-tures between two types of poor householdsin the economy: households with and with-out smokers. Therefore, we design a T-testhypothesis testing for expenditure of ith com-ponent of household expenditure, where i ∈
{education, health}, as:
H0 : µNSi = µSi (1)
H1 : µNSi 6= µSi (2)
Where µi is the average spending of poorhouseholds for particular commodity i.
Both descriptive and t-test analysis inthis study utilize data from National Socio-Economic Survey (Susenas) 2010. Sample ofthe Susenas data is households that spread overall provinces in Indonesia.
Since the study mainly concerns on spendingbehavior of poor households, the first thing todo is to identify the poor households from thesample. The identification is made by employ-ing distric and city poverty line 2010 of theNational Bureau of Statistics (BPS) Indone-sia. However, slight adjustment is needed be-fore we can use the BPS poverty line since theBPS uses it to identify poor individuals ratherthan poor households. In so doing, monthlyper capita expenditure of each household is es-timated, and then the result is compared withthe individual poverty line. When the monthlyper capita expenditure of one particular house-hold is below the poverty line of its correspond-ing district or city, thus the household is cate-gorized as poor.
The identification of poor households us-ing the method above is expected to be moreaccurate and representative than using theWorld Bank poverty standard, the BPS na-tional or provincial poverty line (instead of dis-trict/city), or the simple family decile method(by monthly average expenditure) which setsthe first two or three quantiles as poor house-holds. The main advantage of using the dis-trict/city poverty line is its ability to capturemore variety of standards of living in each dis-trict/city in Indonesia.
Total 293,715 samples of households in Suse-nas 2010 represent around 61.8 million house-holds that spread over 33 provinces in Indone-sia. From the poor identification of householdconducted in this study, there are more than

Nasrudin et al./Tobacco Economic of Indonesia: ... 6
five million poor households or 23.2 millionpoor individuals represented by Susenas sam-ple. With estimated number of poor people inIndonesia in 2010, according to BPS, was 31.9million or 13.3 percent of total Indonesia popu-lation, the poor individual samples in Susenasrepresent more than 70 percent of poor peo-ple or almost 10 percent of total population inIndonesia.
After obtaining poor household samples,the next step is to separate households withand without smoker. It can be identifiedfrom monthly expenditure of cigarette datain the Susenas. When the figure is non-zero(zero), the respective household has (has no)smoker. From this classification, poor house-hold samples are now distributed, though notequally, with around 56 per cent (or represent-ing 2.8 million poor households) classified aspoor households with smoker and the remain-ing 44 per cent (or representing 2.2 millionpoor households) as poor households with nosmoker.
Finally, to perform both descriptive and t-test analysis on poor households spending be-havior, monthly spending of such poor house-holds with and with no smoker on education,health, and other expenditures in Susenas areutilized. From total 32 groups of monthly ex-penditure of households in Susenas, this studyhas regrouped the expenditure into 11 groupsonly to simplify the analysis. The descriptionof the eleven expenditure categories can be ob-served in Appendix 1.
3.1.2. The Determinants of Indviduals Smok-ing Decision
The subsequent analysis is to ask, if it is sig-nificance of the difference, should poor house-hold with smoker tend to have new familymember to become a smoker too. To answerthis question we regress a discrete choice model
of:
P (S)j = α+ θ1educindj + θ2agej
+θ3sexj + θ4marstatj
+θ5workj + θ6loc+ θ7earn(3)
P (S)j is the decision being smoker (S=1) or isnot as smoker (S=0) and each of respective in-dependence variable represent the socio-socio-economic profile of the individual. For this re-gression we will employ IFLS data.
3.2. Regressivity Analysis
3.2.1. Measuring Tax Burden Over IncomeGroups
There are three definitions of tax burden inthe literature: accounting, welfare-based will-ingness to pay and welfare-based time incon-sistent. This study uses the the accountingdefinition of the tax burden and implementsthe formula to Indonesian Family Life Survey(IFLS) 2007 data. The IFLS data providesdata set that supports for calculating the excisetax paid by individuals. It asks and records in-dividual’s quantity, total expenditure and typeof cigarette consumed. For ith-quantile of in-come group and n individuals in each quintile,we define average tax rate (ATR) or the taxburden for each quintile as:
ATRi =
∑nj=1
Tj
Yj
n(4)
Tj is the amount of the excise tax paid by indi-vidual j and Yj is her income. In IFLS data weuse individual earnings as proxy if income. Tjis composite tax and consists of unit tax andad-valorem tax. Assuming that individual con-sumes only single cigarette type, we thereforedefine Tj as:
Tj = sQj + aEj (5)
s is the specific tax rate of cigarette per stick,a is the ad-valorem tax rate of cigarette and Qj
and Ej are sticks consumed and total expendi-ture of cigarette of individual j respectively.

Nasrudin et al./Tobacco Economic of Indonesia: ... 7
3.2.2. Change in Regressivity from Tax Inrease
More importantly, the analysis of regressiv-ity should be followed by observing tax increaseand its impact on the structure of the tax bur-den among income groups. In order to performthe analysis we need to estimate the consump-tion response from price change and real in-come change due to increase of tax. The esti-mation of own-price and income elasticities willbe performed using single equation model usedby Lee et al. (2004) on the cigarette consump-tion in Taiwan:
lnqit = α0 + β1lnpit + β2lnincit + uit (6)
Where q is weekly average number of stickconsumed, p is real1 imputed price (total ex-penditure/sticks consumed) in a week and incis average weekly income. Subscript i =1, .., 1855 and t = 1997, 2000, 2007 are indexesfor individual respondents and wave(year) ofthe IFLS respectively. We implement theestimation to IFLS2(1997), IFLS3(2000) andIFLS4(2007) data. Thus, we expect the thatβ1 < 0 and β2 > 0 assuming that cigarette is anormal good.
3.3. Economic Wide Impact Analysis of Sim-plification of Cigarette Taxation
Computable General Equilibrium (CGE)model is employed to analyze the wide-impactof simplification of cigarette taxation on gov-ernment revenue, employment and tobacco sec-tor. A CGE model is a system of non-linearsimultaneous equations that represents the be-havior of all economic agents and market clear-ing condition of goods and services in the econ-omy. Those equations can be grouped into fivemain blocks, hence:
1. Production block: Equations in this blockrepresent the behavior of producers andthe structure of production activities.
1We use corresponding Consumer Price Indices(CPI) to deflate the imputed price for each year.
2. Consumption block: Equations in thisblock represent the consumption behaviorof households and other institutions.
3. Export-import block: Equations in thisblock represent the decision to export orimport goods and services.
4. Investment block: Equations in this blockrepresent the decision to conduct invest-ment and the demand of goods and ser-vices that will be utilized in the formationof new capital.
5. Market-clearing block: Equations in thisblock represent market-clearing conditionin the labor market, commodity marketand balance of payment.
We used Indonesian Social Accounting Ma-trix (SAM) as the main database for our CGEmodel. SAM is a double entry of traditionaleconomic accounting, shaped partition matrix2
that records all economic transactions betweenagents, particularly among the sectors in theproduction block, institutions blocks (includ-ing households, firms and government), and inthe sectors of production factors (Pyatt andRound, 1979; Sadoulet and de Janvry, 1995;Hartono and Resosudarmo, 1998). SAM is agood database for CGE model because of tworeasons. First, SAM summarizes all economictransactions in the economy for a single pe-riod of time. Thus, SAM provides a compre-hensive overview of countrys or regions econ-omy. Second, SAM records the socio-economicstructures of an economy. Therefore, SAM isalso able to picture income distribution andpoverty.
In this study, we modified Indonesian SAMthat is published by Central Bureau Statisticsof Indonesia in 2008. There are two main differ-ences between published Indonesian SAM andour modified Indonesian SAM. First, we disag-gregated classification of sectors by introduc-ing four tobacco sub-sectors, namely machine
2The definition of partition matrix can be seen inSearle, S. R. 1982: Matrix Algebra Useful for Statistics.John Wiley and Sons. New York.
Nasrudin et al./Tobacco Economic of Indonesia: ... 8
made cigarette (SKM), medium-large hand-rolled kreteks (SKTMB), small hand-rolledkreteks (SKTK), and other tobacco products.Second, we aggregated groups of householdfrom 8 (eight) classifications into one classifica-tion. We did not use the original eight classifi-cations of household since we did not have in-formation about the expenditure of each house-hold group on tobacco products.
We conducted 8 (eight) scenarios in orderto capture policy options that can be imple-mented by the Government of Indonesia (GOI).In those scenarios, we assume that the Govern-ment of Indonesia implements uniform excisetax in each cigarette sub-sector3. Currently,the excise tax rates on cigarette product varybased on the type of product/sector, total pro-duction, and the range of retail price. Conse-quently, government income will increase, andthe GOI has some options to use the extra in-come. The GOI can use the money to paytheir debt or keep it as saving. Furthermore,the GOI can also increase their expenditure oninfrastructure, public sector, or even increasetransfer payment to the households. Otherpossibilities are the combination between sce-narios. For instance, the GOI can spend half oftheir extra income on public sector and use therest of the extra income to increase transferpayment. Table 1 shows eight scenarios thatare used in this study.
4. Result and Analysis
4.1. Household Comparison Analysis
4.1.1. Descriptive Analysis & T-test Analysis
Smoking behavior is hard to cease due tothe addictive substance in cigarettes. From the2010 Demographic Institute FEUI (LD-FEUI)
3Technically, we set the excise tax rate at the high-est rate in each cigarette sub-sector. The excise taxrate for machine made cigarette (SKM), medium-largehand-rolled kreteks (SKTMB), and and small hand-rolled kreteks (SKTK) are Rp. 365 per piece, Rp. 255per piece, and Rp. 100 per piece respectively.
survey to individual smokers in Central Javaand East Java, smokers buy, on average, 12sticks of cigarette (or for most cigarette prod-ucts it is equivalent to one pack of cigarette)every day. The survey also reveals that morethan 60 per cent of the total samples buy 12and even more sticks of cigarette per day. Thebehavior seems to be not different whether thesmoker is poor. From the same survey, it showsthat while the poor smokers buy 10 sticks ofcigarette per day, on average, the non-poorsmokers buy at least 12 sticks per day. Theinelastic nature of the price elasticity of de-mand for cigarette (as has been summarizedfrom many studies by Barber S., et al. in 2008)further indicates that as long as the increasedprice is still affordable, smokers will continuesmoking. The smokers may also still substi-tute the cheaper cigarette product for the moreexpensive one, even if it results in more riskfor their health. Another negative impact fromsmoking behavior may arise when it affects con-sumption pattern of a household. The smokinghousehold may sacrifice their spending on moreessential expenditures such as basic foods, ed-ucation, and health to preserve their smokingbehavior.
In Table 2, we can observe the consump-tion priority of group of households in Indone-sia with and without smoker. The percent-age number of each expenditure category is ob-tained by dividing sum of the expenditure cat-egory with sum of total expenditure from allhouseholds within each group. The table showsthat although cigarette spending is relativelysmall, it is comparable to the amount spentfor basic food and sources of protein (meat,fish, egg, and milk) and even higher than thatfor vegetable and fruit. The different prior-ity between smoking and non-smoking house-hold groups only appears in the four lowest ex-penditure categories. Unlike the non-smokinghouseholds, smoking households tend to priori-tize clothing to health spending and basic foodto sources of protein.

Nasrudin et al./Tobacco Economic of Indonesia: ... 9
Table 1: Scenarios in the CGE model
Scenarios Definition
SIM 1 The GOI impose uniform excise tax in each cigarette sub-sector and use the extra government incometo pay their debt.
SIM 2 The GOI impose uniform excise tax in each cigarette sub-sector and keep the extra government incomeas saving.
SIM 3 The GOI impose uniform excise tax in each cigarette sub-sector and use the extra government incometo increase their expenditure on infrastructure (construction sector).
SIM 4 The GOI impose uniform excise tax in each cigarette sub-sector and use the extra government incometo increase their expenditure on public sector.
SIM 5 The GOI impose uniform excise tax in each cigarette sub-sector and use the extra government incometo increase transfer payment to the households.
SIM 6 The GOI impose uniform excise tax in each cigarette sub-sector and spend half of their extra income oninfrastructure (construction sector) and use the rest of the extra income to increase transfer payment.
SIM 7 The GOI impose uniform excise tax in each cigarette sub-sector and spend half of their extra incomeon public sector and use the rest of the extra income to increase transfer payment.
SIM 8 The GOI impose uniform excise tax in each cigarette sub-sector and spend half of their extra incomeon public sector and spend the rest of the extra income on infrastructure (construction sector).
Table 2: Consumption Priority of Household Group with and without Smoker in Indonesia, 2010(in percentage and value)
Expenditure Group of smoking households Group of non smoking householdsRp % Rp %
1 Housing 410,416 32,46 487,678 35,562 Other non food 193,479 15,3 211,343 15,373 Education 142,607 11,29 198,198 14,414 Transportation 120,532 9,53 124,403 9,035 Other food and drink 82664 6,53 84,669 6,156 Clothing 72,649 5,75 70,385 5,17 Health 66542 5,27 83183 6,068 Basic food 50,207 3,97 40,306 2,939 Meat, fish, egg, milk 46621 3,68 44,621 3,25
10 Cigarette 44,525 3,52 0 -11 Vegetable and fruit 33,763 2,67 31,942 2,32
Total food excl, cigarette 213,254 16,87 201,537 14,66Total non food 1,006,224 79,61 1,175,190 85,34
Source: Susenas 2010, processed
Nasrudin et al./Tobacco Economic of Indonesia: ... 10
Consumption priority of poor householdscan be observed from Table 3. As the tablereveals, poor households, either with or with-out smoker, put less priority on education andhealth spending. While they put basic foodas their almost highest priority, the amountspent for education and health is just compa-rable to their cigarette spending. Moreover,cigarette spending in poor households is ap-parently higher than spending for sources ofprotein and vegetable and fruit. Comparedto the poor household group without smoker,poor household group with smoker also spendfor clothing higher than for education, and forsources of protein higher than for vegetable andfruit.
Despite the fact that consumption prioritybetween groups of households (with and with-out smoker), entirely or just the poor ones,is relatively similar, smoking behavior may re-ally sacrifice some households essential expen-ditures. In order to find such impact, we mayagain use the portion of each expenditure cate-gory to total expenditure. However, since nowwe are concerned on the individual behaviorof households, the percentage number of eachexpenditure category is obtained by averagingthe monthly expenditure proportion of all in-dividual households.
From Table 4, the general pattern in Indone-sia shows that smoking behavior tends to sacri-fice households spending on such non-food ex-penditures as housing, other non food, educa-tion, and health. Portions of such expendituresin smoking households, on average, are rela-tively lower than those in non-smoking house-holds.
The impact is even bigger for poor house-holds. As can be seen in Table 5, poor smok-ing households in general spend less than poornon-smoking households in both food (with-out cigarette) and non-food expenditure cat-egories. Spending for cigarette not only sacri-fices spending on housing, other non food, andhealth, but also on basic food, other food and
drink, and vegetable and fruit.The finding above is further confirmed by
the resulting two samples T-test. By compar-ing the portion mean of each expenditure cate-gory in smoking and non-smoking households,the result (presented in Table 6) shows thatonly portion of education spending that is sta-tistically insignificant. Therefore, even thoughfrom the figure before the average portion ofeducation spending by poor smoking house-holds is bigger, statistically it has no difference.
4.1.2. The Determinants of Individuals Smok-ing Decision
Although smoking behavior statistically hasno significant impact on education spendingfor poor households, attention still needs tobe paid. As has been shown in Table 3, poorhouseholds allocation for education is relativelylow and even comparable with the amountspent for buying cigarette. With small alloca-tion for education, children in poor householdswith smoker are more likely to attain lower edu-cation level. The condition may result in an in-creased probability of them smoking when theygrow up.
The negative correlation between educationlevel attainment and smoking probability ofindividual has been tested by Ahsan and To-bing (2008) and Terblance (2012). Using lo-gistic regression method, this study also triesto find the correlation. The IEFLS data 2007has been used in the regression. As dependentvariable we used smoke variable, the dummyshowing the individuals decision to smoke ornot, with 1 and 0 indicate decision to smokeand not smoke respectively. As the indepen-dent variables, we chose education level at-tainment (educind2007), age (age2007), gen-der (sex2007), marriage status (marstat2007),working status (work2007), resident location(loc2007), and individual earning per month(earn2007).
From the logistic test, as can be seen in Fig-ure 1, education level attainment, age, gender,and marriage status are statistically significant

Nasrudin et al./Tobacco Economic of Indonesia: ... 11
Table 3: Consumption Priority of Poor Household Group with and without Smoker in Indonesia,2010 (in percentage and value)
Expenditure Group of smoking households Group of non smoking householdsRp % Rp %
1 Housing 155,860 32.78 143,126 36.542 Basic food 51,251 10.8 43,075 113 Other non food 48,843 10.28 40,111 10.244 Other food and drink 37,589 7.9 34,302 8.755 Transportation 34,053 7.15 26,718 6.826 Clothing 29,009 6.09 23,659 6.047 Education 28,077 5.9 23,959 6.128 Health 26,518 5.57 21,584 5.519 Cigarette 23,479 4.93 - -
10 Meat, fish, egg, milk 20,982 4.41 16,085 4.111 Vegetable and fruit 20,326 4.27 19,086 4.87
Total food excl. cigarette 130,148 27.34 112,549 28.75Total non food 322,359 67.72 279,156 71.25
Source: Susenas 2010, processed
Table 4: Impacts of Cigarette Spending on Households Spending Pattern in Indonesia, 2010 (inPercentage and Point Percentage)
Expenditure Smoking Household Non Smoking Household Difference
1 Housing 34.3 38.71 -4.412 Other non food 10.48 10.81 -0.333 Education 7.38 8.06 -0.684 Transportation 9.39 8.54 0.855 Other food and drink 8.81 9.72 -0.916 Clothing 5.3 4.81 0.497 Health 4.1 4.69 -0.598 Basic Food 6.66 6.21 0.459 Meat, fish and egg 4.56 4.32 0.24
10 Cigarette 5.12 0 5.1211 Vegetable and fruit 3.9 4.12 -0.22
Total food excl. cigarette 23.93 24.37 -0.44Total non food 70.94 75.63 -4.69
Source: Susenas 2010, processed

Nasrudin et al./Tobacco Economic of Indonesia: ... 12
Table 5: Impacts of Cigarette Spending on Poor Households Spending Pattern in Indonesia, 2010(in Percentage and Point Percentage)
Smoking Non Smoking DifferenceExpenditure Household (%) Household (%)
1 Housing 33.79 38.11 -4.322 Basic food 12.21 12.61 -0.403 Other non food 9.81 10.01 -0.204 Other food and drink 8.77 10.09 -1.325 Transportation 6.16 5.44 0.726 Cigarette 5.43 0 5.437 Education 5.04 4.88 0.168 Clothing 4.87 4.28 0.599 Vegetable and fruit 4.8 5.64 -0.84
10 Health 4.61 4.78 -0.1711 Meat, fish and egg 4.52 4.18 0.34
Total food excl. cigarette 30.29 32.52 -2.23Total non food 64.28 67.48 -3.20
Source: Susenas 2010, processed
in affecting individuals decision to smoke ornot. With the signs of coefficient found, wecan interpret that probability of individual forsmoking is higher with lower education attain-ment and lower age and if the individual is maleand has or had married. The other variables inthe model, which are working status (workingor not working), resident location (rural or ur-ban), and individual earning, statistically haveno significant effect on individuals smoking de-cision. The odd ratio number of 0.89 (cer-tainly less than 1) found for education variablein the same table, further indicates that indi-vidual who attains a certain level of educationwill have less probability to smoke, that is 0.89times, than individual whose education attain-ment is one level lower.
Therefore, the logistic regression test con-ducted in this study also confirms the nega-tive correlation between education level attain-ment and individuals decision to smoke as hasbeen found by Ahsan and Tobing (2008) andTerblance (2012). As a result, a vicious cyclefrom the smoking behavior in poor householdsis most likely to continue unless certain actionis made to encourage the current smokers inthose poor households to quit smoking.
4.2. Regressivity Analysis
This section attempts to answer the firstquestion of this study, whether the current ex-cise tax on cigarette regresive or not. The firstpart of this section will describe the distribu-tion of cigarette taxation with respect to brand,class of excise tax and income group. Then itfollowed by analysis of the result computing theregressivity of tax burden over income groupusing IFLS data.
4.2.1. IFLS Data
The Indonesia Family Life Survey is a con-tinuing longitudinal socioeconomic and healthsurvey. It is based on a sample of householdsrepresenting about 83% of the Indonesian pop-ulation living in 13 of the nation’s 26 provincesin 1993. The survey collects data on individualrespondents, their families, their households,the communities in which they live, and thehealth and education facilities they use. Inthis study, we use IFLS4 or the wave of theyear 2007 because of the avaibility of key vari-ables for computing tax burden.4 In particular,
4IFLS4 was a collaborative effort of RAND, the Cen-ter for Population and Policy Studies (CPPS) of the

Nasrudin et al./Tobacco Economic of Indonesia: ... 13
Table 6: Mean Comparison of Portion of Expenditures between Poor Households with and withoutSmoker Using T-Test
Expenditure T-test Sign
1 Basic food significant -2 Meat, fish and egg significant +3 Vegetable and fruit significant -4 Other food and drink significant -5 Housing significant -6 Health significant -7 Education not significant 08 Transportation significant +9 Clothing significant +
10 Other non food significant -Total food excl. cigarette significant -Total nn food significant -
Source: Susenas 2010, processed. (+) means smoking HHs allocate spending more than non-smoking HHs. (-) meanssmoking HHs allocate spending less than non-smoking HHs.
Figure 1: Logistic Regression on Determinants of Individuals Decision to Smoke
the section ”3B-Smoking” of the data publica-tion has questions on smoking behaviour thatincludes amount spent, number of stick, andtype of cigarette smoked. This is only found inwave 2007 and not in earlier wave, so that itprovides possibility to extract the Indonesia’scigarette tax burden and furthermore to ana-lyze its regressivity in IFLS4.
The sample size extracted for the analysisconsists of 4095 individuals that have non-zerospending on tobacco product. The ages arevarying between 15-83 years old. Among theseindividuals, 74% are the head of the householdand the remaining are family members.
To compute the tax burden in the IFLS, we
University of Gadjah Mada and Survey METRE.
pair the cigarette’s excise tax and the type ofcigarette consumed by individual sample alongwith the complexity of the tariff structure. Thecomplexity of Indonesias excise tax is reflectedby not only the two types of the specific andad-valorem tax within the tax paid, but alsothe rates are further classified by types of to-bacco product and the scale of producers. In2007, refers to Ministry of Finance ’s Minis-terial Decree Number 118/PMK.04/2006, thead-valorem tax has eight class of tariff rangingfrom 4% to 40% based on combination of typesof tobacco product and producers scale. As forthe specific tax, it has three rates: Rp3, Rp5and Rp7 per stick, again based on combina-tion of type of tobacco product and producersscale. The sample that we are using consists of

Nasrudin et al./Tobacco Economic of Indonesia: ... 14
Figure 2: Odds Ratio of Logistic Regression on Determinants of Individuals Decision to Smoke
10 brands and then distributed into 4 class ofexcise tax: SKM I, SKM II, SPM I and SKT I5.Table 7 describes the pair and its shares basedon number of respondents for each class of taxtariff. It is clear that SKM1 and SKT1 havemore various brand than the two other classes.Gudang Garam Surya and Djarum 76 Kretekare the brands with highest proportion of con-sumers in SKM1 and in SKT1 respectively.
In general, consumption tax that is measuredby ATR concept, is regressive as the consump-tion is also regressive. This is because the richtend to save and invest more of their incomethan the poor or the poor spend more of theirincome on consumption. This presumption isconfirmed using IFLS4 on the share of con-sumption among deciles. Table 8 shows thatthe poorest idividuals in the first decile con-sume thirty times than individuals in the tenthdecile.
4.2.2. Average Tax Burden of Cigarette ExciseTax over Income Group
To compute the tax burden for each indi-vidual in the sample, we implement equation
5SKM stands for Sigaret Kretek Mesin, it is ma-chine produced non-filter cigarette. SPM stands forSigaret Putih Mesin, it is machine produced with fil-ter cigarette. SKT stands for Sigaret Kretek Tangan, itis hand made and non-filter cigarette. The producersscale are classified into groups, where I refers to pro-duction more than 2 billion sticks per year, II refers toproduction more than 500 million sticks and less than orequal to 2 billion sticks per year, III refers to productionless than 500 million sticks per year.
1 to IFLS4 data. First we compute the im-puted price (expenditure/sticks) of cigaretteconsumed by each decile to show wheter theprice effect makes the regressivity pattern. Thesecond column of Table 5 shows the result.It is shown that indeed the second decile hasthe lowest price rather than the first decileas expected. However, there is no clear pat-tern of increasing of imputed price over decilesas in general case. On the other hand, thesticks clearly justifies the increasing patternover deciles, where the first decile consumesonly half than the tenth decile in average.
In 2007 there are two types of tax levied tocigarette, the specific tax and the ad-valoremtax. We compute the specific tax as the ratetimes the number stick consumed and the ad-valorem tax as the rate times the total expen-diture in a month. The estimated value arepresented in sixth and seventh column of Table9. It is increasing over deciles and arguably itis caused by increasing pattern of consumptionlevel (sticks) rather than price. This can beshown as the comparisons between the first andtenth decile in terms of specific, ad-valorem andtotal tax expenditure show exactly the samefigure as the sticks, the first decile consumesonly half than the tenth decile in average. TheTax BurdenThis study has two queries regarding the re-gressivity of cigarette tax in Indonesia: thestatic figure of the tax regressivity and theresulted figure of the tax regressivity if therewould be a tax increase. The 9th column of Ta-

Nasrudin et al./Tobacco Economic of Indonesia: ... 15
Table 7: The Distribution of Sample over Brand in Each Taxation Class(%)
No Brand SKM1 SKM2 SPM1 SKT1
1 Gudang Garam Merah - - - 172 Gudang Garam Surya 38 - - -3 Gudang Garam Internas 15 - - -4 Sampoerna A Mild 24 - - -5 Sampoerna Hijau - - - 246 Djarum Super 24 - - -7 Djarum 76 Kretek - - - 328 Bentoel Filter - 100 - -9 Marlboro - - 100 -
10 Dji Sam Soe - - - 28
Total 100 100 100 100
Note: The % is computed by share of individual to total number of respondents (4,095 individuals).
Table 8: Cigarette Expenditure as Proportionof Earning per Month by Decile
Decile Average Min. Max.
1 0.31 0.012 6.402 0.08 0.006 0.303 0.05 0.002 0.454 0.04 0.003 0.125 0.03 0.002 0.106 0.03 0.002 0.107 0.02 0.002 0.438 0.02 0.001 0.229 0.02 0.000 0.98
10 0.01 0.000 0.28
ble 9 shows the static figure of computation ofATR based on equation (1). It is conclusive torecord that the tax stucture is regressive. TheATR for lowest income group is 25 times higherthan the highest income group and the pat-tern are precisely declining from the lowest tohighest income groups. The static figure tellsus that the existing (2007) cigarette tax bur-den puts more burden for lowest income thanhigher incomes.
The previous analysis tells us that at level,the tax burden is increasing over income group.However, if we measure it using ATR concept,in which we put the weight of relative income,the tendency of increasing pattern is no longermaintained, indeed the tax burden is regres-sive. This situation can be interpreted as fol-lows, the richer have higher level of cigarette
consumptions. However, the proportion of thetotal expenditure of cigarette consumption rel-ative to their income is smaller than the poorerincome group.
Secondly, the research question being ad-dressed in this paper is the dynamic effect ofany tax increase based on equation (3). Specif-ically we want to know the values of β1 for eachincome group. To obtain the result we estimateequation 3 using PLS based on Chow-test. Thelast two column of Table 9 shows the econo-metric result. It explains the effect of any fu-ture increase of tax to the regressivity. Borrenand Sutton (1992) and Towsend (1987) suggestthat if we do not find decreasing price elasticity(from lower to higher income group), any fur-ther increase of tax is a regressive policy. The11th column of Table 9 shows no tendency ofdecreasing price elasticy, thus we might drawthe same conclusion, any tax cigarette tax in-crease in Indonesia is a regressive policy.
In addition, if we look at the price and in-come elasticities obtained from the estimationof equation (3), both shows inelastic demandof price and income. The most sensitive groupwith respect to change in consumption is themiddle income groups (i.e. 5th, 6th, and 9th
deciles). Whereas, the poorest (1st decile) andthe richest (10th decile) only have sensitivityabout a third smaller than these group. Thisimplies that for any positive income shock will

Nasrudin et al./Tobacco Economic of Indonesia: ... 16
Tab
le9:
Su
mm
ary
ofE
xcise
Tax
Regressiv
ityU
sing
IFL
S(A
verageM
easures)
Deciles
Price
Stick
sE
xp
enditu
reof
cigarette
Month
lyin
com
eSp
ecific
tax
Ad-va
lorem
tax
Tax
Exp
enditu
reT
ax
Burd
enP
riceIn
com
e(R
p)
(Rp/m
onth
)(R
p)
(Rp)
(Rp)
(Rp)
(%of
inco
me)
elasticity
elasticity
1616
919,0
85
102,3
45
247
6,0
31
6,2
78
10.6
3-0
.15
0.0
82
553
10
21,5
01
257,0
15
290
7,2
41
7,5
31
3.0
0-0
.16
0.1
73
571
10
20,1
83
385,7
64
271
6,8
43
7,1
14
1.8
6-0
.24
0.2
54
638
11
24,2
27
515,2
23
307
8,4
21
8,7
28
1.7
0-0
.20
0.2
05
595
10
22,8
50
626,0
85
290
7,8
31
8,1
20
1.3
0-0
.24
0.2
96
612
12
25,9
94
787,2
76
330
9,0
20
9,3
49
1.1
9-0
.28
0.3
27
648
14
28,4
37
962,9
28
383
9,4
55
9,8
39
1.0
2-0
.26
0.2
98
629
13
27,5
30
1,2
18,6
10
361
9,6
32
9,9
93
0.8
3-0
.28
0.2
79
672
17
36,9
72
1,6
83,2
11
460
12,7
27
13,1
87
0.8
0-0
.21
0.2
910
670
18
38,7
48
4,2
40,5
29
495
13,6
41
14,1
36
0.4
2-0
.13
0.1
0

Nasrudin et al./Tobacco Economic of Indonesia: ... 17
be responded heavily by the middle incomegroups.
4.3. Economic Impact of Simplification ofCigarette Taxation
As we previously mentioned in the introduc-tion, the main objective of the study is to eval-uate certain aspects of cigarette taxation inIndonesia. The first aspect that we observedis the cigarette tax regressivity. We alreadyshowed that the cigarette excise tax in Indone-sia is regressive in Section 4.1. It means thatthe policy to increase the cigarette tax may re-sult higher cost on poor households relative torich households. Moreover, the addictivenessof nicotine may force poor households to re-duce their spending on non-cigarette products.Thus, the policy to increase the cigarette taxcan harm the poor instead of helping them.However, in macro and economy wide impactperspective, we might collect some opposite im-pacts (gain) of tax increase policy.
In this section we present a CGE model’s cal-culation to capture the economy-wide impactsof a tax increase (a simplification) to take intoaccount overal impacts in addition to distribu-tive consideration in the regressivity analysisand poor household spending comparison anal-ysis.
As we mentioned in the previous s, we em-ploy CGE model in order to estimate the im-pact of the simplification of cigarette taxa-tion. Our CGE model is based on IndonesianSAM which provides a comprehensive overviewof Indonesian economy and records Indonesiansocio-economic structures. Thus, the linkagesacross economic agent, production factors andsectors have been taken into account in the cal-culation. In this study, we emphasize our anal-ysis on three macroeconomic indicators, sec-toral output and sectoral employment. Allscenarios represent the policy option that canbe implemented by the government in orderto utilize extra income from simplification ofcigarette taxation. Therefore, all scenarios arecomparable one to another.
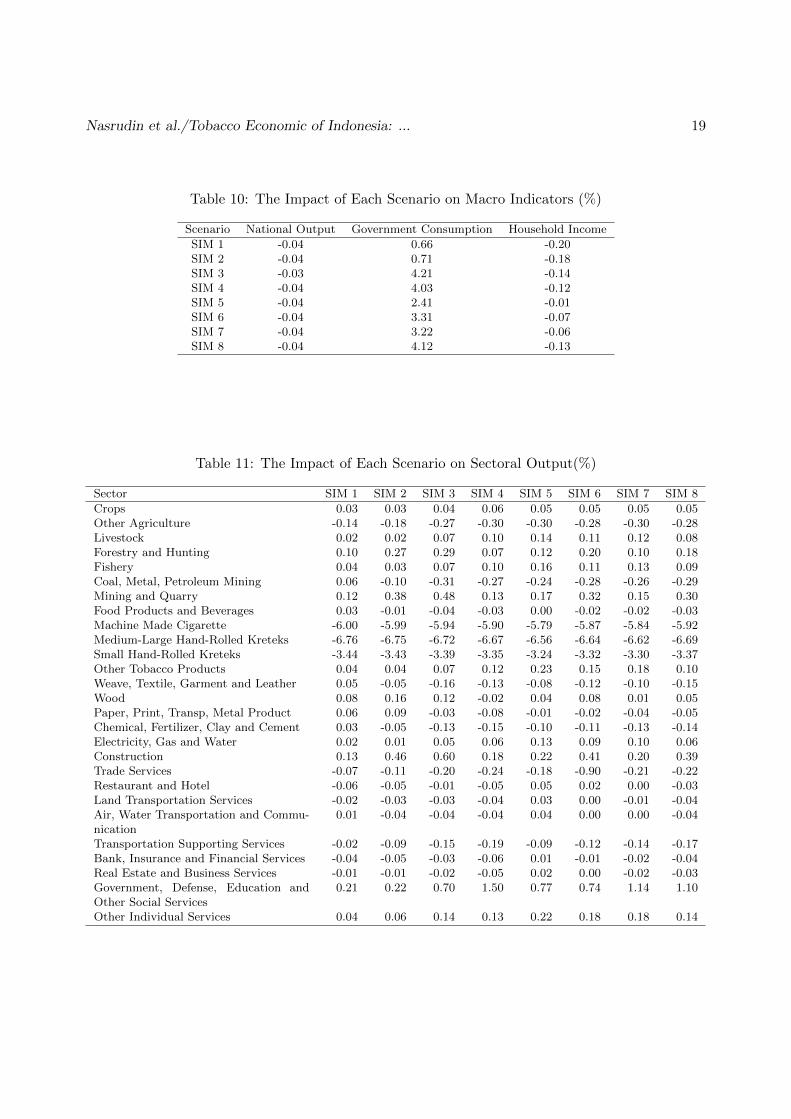
In general, simplification of cigarette taxa-tion has a negative impact on national out-put. However, the impact is relatively smallin magnitude. Simplification of cigarette taxa-tion (which is followed by eight alternatives inorder to utilize the extra income) is expected tolower national output by minus 0.034 percentto minus 0.045 percent. SIM 1 has the largestnegative impact on national output as muchas minus 0.045 percent. If the GOI use theextra income to pay their debt to other coun-try, the government will lose an opportunity tooptimize the utilization of the extra income inthe domestic economy. However, we did nottake into account the impact of debt paymenton temporal structure of Indonesian nationalbudget. Indeed, debt payment in period t willreduce the burden of Indonesian national bud-get in period t+1. In this case, the GOI willhave more flexibility to restructure their na-tional budget in period t+1. In the first sce-nario (SIM 1), we only assumed that the GOIreceive higher government income. Then, theGOI transfer the extra income abroad as debtpayment. Therefore, SIM 1 is similar with theidea of ”doing nothing” policy. The GOI canalso keep the extra income as saving (SIM 2).This scenario will result negative impact on na-tional output approximately minus 0.038 per-cent.
Alternatively, the GOI can use the extraincome to finance higher government expen-diture. In the scenarios, we introduce threepossibilities that are quite common, namelyhigher expenditure on infrastructure, publicsector and transfer payment. Among thosethree options, higher expenditure on infras-tructure (SIM 3) has a relatively better impact.National output is expected to drop by minus0.034 percent. The negative impact is even thesmallest relative to other seven scenarios. Thelast three scenarios (SIM 6, SIM 7 and SIM 8)represent mixed policies. Table 10 shows thatno mixed policies can surpass the impact ofSIM 3. Furthermore, spending half of the ex-

Nasrudin et al./Tobacco Economic of Indonesia: ... 18
tra income on infrastructure and use the restof the extra income to increase transfer pay-ment (SIM 6) is relatively better than othertwo mixed scenarios.
Even though the simplification of cigarettetaxation has a negative impact on national out-put, government consumption is expected toincrease as the government receives more in-come. SIM 3 results the largest positive impacton government consumption, whereas SIM 1has the smallest positive impact. Governmentconsumption is expected to increase by 4.2 per-cent if the GOI implement uniform excise taxin each cigarette sub-sector and spend the ex-tra income on infrastructure. SIM 4 also has arelatively large positive impact on governmentconsumption as much as 4.0 percent. Increas-ing the transfer payment (SIM 5) is estimatedto lower positive impact on government con-sumption relative to SIM 3 and SIM 4. How-ever, the magnitude is still substantially largerthan the policy option to keep the extra in-come as saving or to send it abroad. Amongthe mixed scenarios, SIM 8 has relatively largerpositive impact on government consumption.The impact is even the second largest impacton government consumption after SIM 3.
Table 10 also suggests that simplification ofcigarette taxation is expected to drop house-hold income. Without transfer payment pol-icy, the negative impact on household incomeis larger than -0.13 percent. For instance, SIM3 (which is preferable in the previous analy-sis) results 0.14 percent drop in household in-come. Furthermore, if the GOI implement uni-form cigarette excise tax and transfer the ex-tra income abroad as debt payment, householdincome decrease up to 0.2 percent lower thanthe baseline. It is the largest negative impactrelative to other seven scenarios. In contrast,SIM 5 almost has no impact on household in-come. The impact of SIM 5 is extremely smallin magnitude as much as -0.006 percent.
To sum up, all scenarios have negative im-pacts both on national output and household
income. Meanwhile, government consumptionis expected to increase in all scenarios. SIM1 is less preferable than other seven scenariosbecause it has the largest negative impact onboth national output and household income.The first scenario also has the smallest posi-tive impact on government consumption. SIM3 seems to be superior in terms of its impact onnational output and government consumption.However, SIM 3 has a relatively large negativeimpact on household income. In order to lowerthe impact on household income, the GOI canimplement mixed policy between infrastructurespending and transfer payment through SIM 6.SIM 6 has 0.0006 percent larger negative im-pact on national output, 0.89 percent smallerpositive impact on government consumption,and 0.063 percent smaller negative impact onhousehold income relative to SIM 3. Moreover,if the GOI focus more on the impact on house-hold income, SIM 5 can be chosen. It has thesmallest negative (even almost zero) impact onhousehold income, and its negative impact onnational output is 0.0012 percent larger thanrelative to SIM 3.
The combination between lower householdincome and the higher price of cigarette prod-ucts due to the simplification of cigarette tax-ation may hurt the poor households. Unfortu-nately, the model is not able to show the impacton household income across group of house-holds due to data limitation. Nevertheless, theCGE results show that the impact of the sim-plification of cigarette taxation on householdincome is small in magnitude. Furthermore,the negative impacts is expected to be muchlower if the GOI use the extra income to financehigher government expenditure (even thoughthe positive impact of higher government ex-penditure will not fully compensate the neg-ative impact). Thus, we can argue that theimpact of the simplification of cigarette taxa-tion on poor households is indeed negative butnot severe.
Another important result that we obtained
Nasrudin et al./Tobacco Economic of Indonesia: ... 19
Table 10: The Impact of Each Scenario on Macro Indicators (%)
Scenario National Output Government Consumption Household Income
SIM 1 -0.04 0.66 -0.20SIM 2 -0.04 0.71 -0.18SIM 3 -0.03 4.21 -0.14SIM 4 -0.04 4.03 -0.12SIM 5 -0.04 2.41 -0.01SIM 6 -0.04 3.31 -0.07SIM 7 -0.04 3.22 -0.06SIM 8 -0.04 4.12 -0.13
Table 11: The Impact of Each Scenario on Sectoral Output(%)
Sector SIM 1 SIM 2 SIM 3 SIM 4 SIM 5 SIM 6 SIM 7 SIM 8
Crops 0.03 0.03 0.04 0.06 0.05 0.05 0.05 0.05Other Agriculture -0.14 -0.18 -0.27 -0.30 -0.30 -0.28 -0.30 -0.28Livestock 0.02 0.02 0.07 0.10 0.14 0.11 0.12 0.08Forestry and Hunting 0.10 0.27 0.29 0.07 0.12 0.20 0.10 0.18Fishery 0.04 0.03 0.07 0.10 0.16 0.11 0.13 0.09Coal, Metal, Petroleum Mining 0.06 -0.10 -0.31 -0.27 -0.24 -0.28 -0.26 -0.29Mining and Quarry 0.12 0.38 0.48 0.13 0.17 0.32 0.15 0.30Food Products and Beverages 0.03 -0.01 -0.04 -0.03 0.00 -0.02 -0.02 -0.03Machine Made Cigarette -6.00 -5.99 -5.94 -5.90 -5.79 -5.87 -5.84 -5.92Medium-Large Hand-Rolled Kreteks -6.76 -6.75 -6.72 -6.67 -6.56 -6.64 -6.62 -6.69Small Hand-Rolled Kreteks -3.44 -3.43 -3.39 -3.35 -3.24 -3.32 -3.30 -3.37Other Tobacco Products 0.04 0.04 0.07 0.12 0.23 0.15 0.18 0.10Weave, Textile, Garment and Leather 0.05 -0.05 -0.16 -0.13 -0.08 -0.12 -0.10 -0.15Wood 0.08 0.16 0.12 -0.02 0.04 0.08 0.01 0.05Paper, Print, Transp, Metal Product 0.06 0.09 -0.03 -0.08 -0.01 -0.02 -0.04 -0.05Chemical, Fertilizer, Clay and Cement 0.03 -0.05 -0.13 -0.15 -0.10 -0.11 -0.13 -0.14Electricity, Gas and Water 0.02 0.01 0.05 0.06 0.13 0.09 0.10 0.06Construction 0.13 0.46 0.60 0.18 0.22 0.41 0.20 0.39Trade Services -0.07 -0.11 -0.20 -0.24 -0.18 -0.90 -0.21 -0.22Restaurant and Hotel -0.06 -0.05 -0.01 -0.05 0.05 0.02 0.00 -0.03Land Transportation Services -0.02 -0.03 -0.03 -0.04 0.03 0.00 -0.01 -0.04Air, Water Transportation and Commu-nication
0.01 -0.04 -0.04 -0.04 0.04 0.00 0.00 -0.04
Transportation Supporting Services -0.02 -0.09 -0.15 -0.19 -0.09 -0.12 -0.14 -0.17Bank, Insurance and Financial Services -0.04 -0.05 -0.03 -0.06 0.01 -0.01 -0.02 -0.04Real Estate and Business Services -0.01 -0.01 -0.02 -0.05 0.02 0.00 -0.02 -0.03Government, Defense, Education andOther Social Services
0.21 0.22 0.70 1.50 0.77 0.74 1.14 1.10
Other Individual Services 0.04 0.06 0.14 0.13 0.22 0.18 0.18 0.14

Nasrudin et al./Tobacco Economic of Indonesia: ... 20
from CGE model is the impact on sectoral out-put. It is one of the advantages of CGE modelin which we can show the economic wide im-pact. The results show not only the impact ontobacco sector but also other sectors by consid-ering the linkages between sectors. Generally,Medium-Large Hand-Rolled Kreteks sector ex-periences the largest negative impact in all sce-narios relative to other cigarette sub-sectors. Itis also the largest negative impact among allsectors that are observed. Output of Medium-Large Hand-Rolled Kreteks sector is expectedto decrease in the range of -6.56 percent to -6.76percent. The second largest negative impact isexperienced by Machine Made Cigarette sec-tor. This sector output decrease in all scenar-ios by between -5.79 percent and -6.0 percent.Small Hand-Rolled Kreteks sector experiencesthe smallest negative impact among the threecigarette sub-sectors. However, it is substan-tially large in magnitude if we compare withother non-cigarette sectors. The simplificationof cigarette tax is expected to decrease the out-put of Small Hand-Rolled Kreteks sector by be-tween -3.24 percent and -3.44 percent.
Mining and quarry sector, most agricul-ture sectors (except ”other agriculture” sec-tor), construction sector, public services sec-tor, and other individual services sector are ex-pected to receive positive impact in all scenar-ios. Similarly, other tobacco product sector isexpected to experience positive impact in al-most all scenarios with the percentage changebetween 0.04-0.23 percent. In contrast, sixother sectors (other agriculture sector, electric-ity, gas and water sector, trade services sector,bank, insurance and financial services sector,real estate and business services sector, andtransportation supporting sector) experiencenegative impact in all scenarios. Three manu-facturing sectors (food products and beveragessector; weave, textile, garment and leather sec-tor; and chemical, fertilizer, clay and cementsector) and coal, metal, petroleum mining sec-tor are expected to receive negative impact in
almost all scenarios other than SIM 1.
Table 11 shows the detailed estimated im-pact of simplification of cigarette tax on sec-toral output. SIM 1 is expected to increaseall agriculture sectors (except other agriculturesector) and mining sectors. Manufacturing sec-tors (other than cigarette sub-sectors) will alsobenefit from the policy under the first scenario.Services sectors are mostly experiencing dis-advantage due to the SIM 1 implementation.If the GOI choose to keep the extra incomeas saving (SIM 2), all sectors that are pre-viously experiencing negative impacts (underSIM 1) are expected to experience even worsenegative impact. Five sectors (coal, metal andpetroleum mining sector; food products andbeverages sector; weave, textile, garment andleather sector; chemical, fertilizer, clay andcement sector; air, water transportation andcommunication sector) are expected to expe-rience negative impacts. Those five sectorspreviously gain positive impacts under SIM 1.Interestingly, other sectors that are not men-tioned above experience positive impacts evenlarger than under SIM 1.
The comparison between SIM 1 and SIM 2can also be applied for SIM 2 and SIM 3. Ifthe GOI implements SIM 3, some sectors thatare previously experiencing negative impactsunder SIM 2 are expected to experience evenworse negative impact. Two sectors (other to-bacco products sector and paper, print, transp,metal products sector) that are previously ex-periencing positive impacts under SIM 2 areexpected to experience negative impacts. Fur-thermore, sectors other than mentioned abovegain larger positive impact under SIM 3 rela-tive to SIM 2. The question that may arise:Why some sectors can benefit and some othernot? The first argument is the composition oflabor across sectors. If the GOI spends moremoney on a particular sector, the sector will de-mand more labor. These will change the equi-librium wage in the labor market. More laborwill move to other sectors that are relatively

Nasrudin et al./Tobacco Economic of Indonesia: ... 21
more attractive (in terms of wage). Since weassume that the total number of labor in theeconomy is fixed, some less attractive sectorswill have fewer labors. Consequently, thoseless attractive sectors will experience negativegrowth on their output. The second argumentis the linkage between a sector and cigarettesub-sectors. Other agriculture sector experi-ences a negative impact in all scenarios becausethis sector has a strong linkage (especially for-ward linkage) with cigarette sub-sector. Themost important inputs for cigarette sub-sectorare tobacco and clove. Both products are pro-duced by other agriculture sector.
SIM 4 has relatively similar results to SIM3. The impacts of both scenarios across sectorhave a completely identical pattern. Indeed,government, defense, education, and other so-cial services sector receive the highest positiveimpact as much as 1.50 percent. SIM 5 alsohas an almost similar impact to SIM 4 exceptfor wood products sector, restaurant and ho-tel sector, and land transportation services sec-tor. In terms of the percentage change, the im-pacts are quite moderate across sectors. How-ever, three cigarette sub-sectors experience thesmallest negative impact under SIM 5 relativeto other scenarios. Moreover, other tobaccosector also experiences the largest positive im-pact. SIM 6 has an almost similar impact withSIM 3. The main differences are only on landtransportation services sector, real estate andbusiness services sector, and restaurant and ho-tel sector. Those three sectors are almost un-affected under SIM 6 since the impacts are re-ally small in magnitude. The last two scenarios(SIM 7 and SIM 8) have a completely similarimpact in terms of its pattern across sectorsand also the percentage changes.
Table 12 shows the estimated impact of sim-plification of cigarette tax on sectoral employ-ment. In general, the impacts of simplifica-tion of cigarette tax on sectoral employmentare almost similar both in pattern and magni-tude with the impacts on sectoral output. We
identify that only one sector (electricity, gasand water sector) that experience a completelydifferent impact and five sectors that experi-ence minor differences. The simplification ofcigarette tax is expected to increase the totaloutput of electricity, gas and water sector anddecrease its employment. Why the outputs ofthe sector still increase even though its employ-ment decrease? In order to find the answer, weshould consider the character of the sector andthe magnitude of the impacts. Electricity, gasand water sector is one of the capital intensivesectors in the economy. The proportion of sec-tors expenditure on capital to total primary in-put is 87 percent. Moreover, the impact of thescenario on the sectors employment is only lessthan 0.27 percent. Thus, electricity, gas andwater sector still experience an increase in out-put. The same argument can also be applied toexplain why other tobacco products sector ex-periences negative impact on its employmentbut positive impact on its output under SIM3. Four other sectors that experience the samepattern are air, water transportation and com-munication sector (under SIM 5, SIM 6, andSIM 7); bank, insurance and financial servicessector (under SIM 5); real estate and businessservices sector (under SIM 5 and SIM 6); andother individual sector (under SIM 4).
In the downstream sector of the tobacco sec-tors, two sectors will experience negative im-pact, namely other agriculture sector and elec-tricity, gas and water sector. Employment inagriculture sector is expected to drop by -0.14percent under the first scenario. It is under-standable since two main intermediate inputfor tobacco sector, tobacco and clove, are in-cluded in other agriculture sector. The nega-tive impact is even much larger in other sevenscenarios. The main argument behind this isthe interaction across sector in the economydue to higher government saving and highergovernment spending. However, the impact isreally small in magnitude ranging from -0.14to -0.29 percent. The similar pattern is also

Nasrudin et al./Tobacco Economic of Indonesia: ... 22
Table 12: The Impact of Each Scenario on Sectoral Employment(%)
Sector SIM 1 SIM 2 SIM 3 SIM 4 SIM 5 SIM 6 SIM 7 SIM 8
Crops 0.03 0.03 0.04 0.06 0.04 0.04 0.05 0.05Other Agriculture -0.14 -0.18 -0.27 -0.31 -0.31 -0.29 -0.31 -0.29Livestock 0.02 0.03 0.07 0.08 0.12 0.09 0.10 0.08Forestry and Hunting 0.10 0.27 0.28 0.05 0.09 0.18 0.07 0.16Fishery 0.03 0.03 0.06 0.08 0.12 0.09 0.10 0.07Coal, Metal, Petroleum Mining 0.05 -0.11 -0.34 -0.33 -0.27 -0.31 -0.30 -0.34Mining and Quarry 0.12 0.37 0.47 0.13 0.17 0.32 0.15 0.30Food Products and Beverages 0.03 -0.04 -0.11 -0.11 -0.05 -0.08 -0.08 -0.11Machine Made Cigarette -6.00 -6.03 -6.04 -6.00 -5.85 -5.94 -5.92 -6.02Medium-Large Hand-Rolled Kreteks -6.76 -6.78 -6.76 -6.73 -6.60 -6.68 -6.66 -6.75Small Hand-Rolled Kreteks -3.45 -3.46 -3.44 -3.41 -3.27 -3.36 -3.34 -3.43Other Tobacco Products 0.04 0.00 -0.01 0.03 0.18 0.08 0.10 0.01Weave, Textile, Garment and Leather 0.04 -0.09 -0.24 -0.22 -0.13 -0.19 -0.17 -0.23Wood 0.08 0.12 0.05 -0.07 0.00 0.03 -0.03 -0.01Paper, Print, Transp, Metal Product 0.06 0.05 -0.12 -0.19 -0.08 -0.10 -0.14 -0.15Chemical, Fertilizer, Clay and Cement 0.02 -0.10 -0.25 -0.31 -0.20 -0.22 -0.26 -0.28Electricity, Gas and Water -0.02 -0.06 -0.18 -0.36 -0.10 -0.14 -0.23 -0.27Construction 0.12 0.41 0.49 0.08 0.16 0.33 0.12 0.29Trade Services -0.07 -0.10 -0.20 -0.27 -0.19 -0.20 -0.23 -0.23Restaurant and Hotel -0.05 -0.05 -0.02 -0.11 0.02 0.00 -0.05 -0.07Land Transportation Services -0.02 -0.05 -0.06 -0.07 0.01 -0.03 -0.03 -0.07Air, Water Transportation and Commu-nication
0.00 -0.07 -0.18 -0.31 -0.10 -0.14 -0.21 -0.24
Transportation Supporting Services -0.02 -0.10 -0.19 -0.27 -0.14 -0.16 -0.20 -0.23Bank, Insurance and Financial Services -0.07 -0.07 -0.18 -0.40 -0.17 -0.17 -0.28 -0.29Real Estate and Business Services -0.04 -0.04 -0.17 -0.39 -0.16 -0.16 -0.27 -0.28Government, Defense, Education andOther Social Services
0.19 0.20 0.64 1.36 0.70 0.67 1.03 1.00
Other Individual Services 0.03 0.04 0.07 -0.01 0.14 0.10 0.06 0.03

Nasrudin et al./Tobacco Economic of Indonesia: ... 23
applicable for electricity, gas and water sector.In the upstream sector of the tobacco sectors,employment in restaurant and hotel sector isexpected to decrease by between -0.02 to -0.36percent.
5. Concluding Remarks
This paper has three main objectives relatedto cigarette excise taxation in Indonesia. Thefirst is to test the difference of poor household’sspending with and without smoker. The sec-ond objective is to test the validity of regressivetax burden of cigarette excise taxation. Thefirst objective is related to second objective interms of consequences of increasing cigarettetax to poor households in terms of essentialspendings. If the tax burden is regressive, itmeans that any tax increase will put more bur-den to the poorer and considering the natureof addictive substance of cigarette, the poorerwill tend to sacrifies essential spendings such ashealth and education. However, tobacco prod-uct is more likely depend on many sectors aswell as other sectors depend on cigarette sector.Therefore, the third objective is to capture allmacro effect of an increase of cigarette excisetax and it include total output, employment,government consumption and sectoral impacts.We complete the analysis using a CGE modelbased on decomposed Indonesian’s SAM sec-tors using cigarette sectors.
Regarding the first queries, this paper findsthe statistically significant of the difference(lower) between household with and withoutsmokers on their essential spending includ-ing basic food and health, but not educa-tion. This finding magnifies the negative im-pacts of cigarette tax increase policy. Tax in-crease is not only puts more burden to them,but also harms their essential spendings. Thesecond queries find that the current Indone-sian cigarette excise tax is regressive and anyincrease of cigarette tax is a regressive pol-icy. The welfare consequences for poor smok-ers is clear, any increase in taxation will put
more burden on poorer people rather than thericher. Lastly, the computable general equi-librium models the scenarios of cigarette ex-cise tax increase shows a not severe decreaseof national output, sectoral output and house-hold income and employment. In addition, itgives government higher consumption depend-ing the way additional revenue from tax in-crease is allocated. The alloacation of infras-tructure sector has the highest impacts on gov-ernment spending.
To sump up, the findings of this paper sug-gest two important policy recommendations.In order to implement excise tax increase pol-icy, the government needs to address seriouslythe distibutive policy such that the poorer in-come group obtain enough compensation tomaintain their essential spending that harmedby the policy. This action, also in same re-sult can be obatined by making a specific andtargetted (i.e. incentives policy) to make thepoorer with smokers to quit. Secondly, on themacro ground, measured by government con-sumption and household income, it is betterfor the government to spend additional rev-enue from cigarette tax increase on infrastuc-ture (construction sector).
6. References
[1] Ahsan, A., Wiyono, N., and Setyonaluri, D. Il-licit Cigarettes in Indonesia. Demographic Insti-tute FEUI & Duke-SEATCA; 2010
[2] Ahsan, A. and Tobing, M.H.L. Study of the Im-pact of Tobacco Consumption Among the Poor inIndonesia. Demographic Institute FEUI; 2008
[3] Ahsan , A. and Wiyono, N. An Analysis of theImpact of Higher Cigarette Prices on Employmentin Indonesia. SEATCA; December 2007
[4] Barbara S. et al. Tobacco Economics in Indone-sia. Paris: International Union Against Tubercolo-sis and Lung Decease; 2008
[5] Borren, P. and Sutton, M. Are Increases inCigarette Taxation Pregressive? Health Eco-nomics, Vol. 1; 1992, pp. 245-253
[6] Chernick, H. and Reschovsky, A. Yes! Consump-tion Taxes Are Regressive. Challenge, Vol. 43,No.5; September/October 2000, pp. 60-91
[7] Djutaharta, T. et al. Aggregate Analysis of the Im-pact of Cigarette Tax Rate Increase on Tobacco

Nasrudin et al./Tobacco Economic of Indonesia: ... 24
Consumption and Government Revenue: the Caseof Indonesia. Health, Nutrition and Population(HNP): Economics of Tobacco Control Paper, No.25; January 2005
[8] Hartono, D., Resosudarmo, B.P., Eksistensi ma-triks pengganda dan dekomposisi matriks peng-ganda Pyatt dan Round dari sistem neraca sosialekonomi. Ekonomi dan Keuangan Indonesia 46 (4),473496, 1998
[9] Lee, Jie-Min, et al. The effect of cigarette price in-crease on the cigarette consumption in Taiwan: ev-idence from the National Health Interview Surveyson cigarette consumption, BMC Public Health,4(61); 2004
[10] Pyatt, G. and Round, J., Accounting and fixedprice multipliers in a social accounting matrixframework. Economic Journal 89: 850873, 1979
[11] Remler, D.K. Poor Smokers, Poor Quitters, andCigarette Tax Regressivity. American Journal ofPublic Health, Vol.94, No.2; February 2004, pp.225-229
[12] Sadoulet, E., de Janvry, A., Quantitative Devel-opment Policy Analysis. Johns Hopkins UniversityPress, Baltimore, 1995
[13] Stiglitz, J. Economics of the Public Sector. 3rd ed.New York, NY: W.W. Norton & Co; 2000
[14] Tamaoka, M. The Regressivity of a Value AddedTax: Tax Credit Method and Subtraction Methoda Japanese Case. Fiscal Studies, Vol. 15, No.2; May1994
[15] Terblanche, T. The Opportunity Cost of Tobaccoin South Africa. University of Cape Town: Unpub-lished; 2012
[16] Townsend, J. Cigarette Tax, Economic Welfareand Social Class Patterns of Smoking. AppliedEconomics, Vol. 19; pp. 355-365, 1987