tobii test specifications accuracy and precision test method
DESCRIPTION
Tobii Test Specifications Accuracy and Precision Test MethodTRANSCRIPT

Tobii® Technology
Accuracy and precision test method for remote eye trackers
Test Specification Version: 2.1.1February 7, 2011
TestSpecification
www.tobii.com

TestSpecification
2

Accuracy and precision test method
3
Test specification
Accuracy and precision test method for remote eye trackers
Abstract
This document describes a test method for the measurement of accuracy and precision of remote eye trackers. The method is extensive as it takes a variety of likely user scenarios into consideration. The test conditions include ideal measurement conditions, large gaze angles, different illumination levels and head positions in the track box. Precision is also measured on artificial eyes in order to differentiate between system noise and expected precision on human eyes, with human artifacts included. Accuracy and precision are calculated from stable eye tracking data with high trackability; which is verified in real-time. Both metrics are presented based on monocular (dominant eye) and binocular data. Along with the method, an open source software tool is provided to simplify the tests, developed especially for accuracy and precision measurements. The software is free for anyone to use.
Document release 1.1, May 2012Test Specification Version: 2.1.1, February 7, 2011
Tobii Technology AB reserves the right to change the content of this manual without prior notice. Changes due totypographical errors, innacuracies or modifications in programs and/or equipment might be implemented at any time. Please check the Tobii web site www.tobii.com for updated versions of this document.
All rights reserved.
© Tobii Technology AB

TestSpecification
4

Accuracy and precision test method
5
Contents1. Background 6
1.1. Accuracy and Precision 6
2. Method requirements 7
3. Methodology 7
3.1. Accuracy metrics 7
3.2. Precision metrics 8
3.2.1. Precision Calculation 9
3.2.2. SDPrecision calculation 9
3.3. Participant and environmental factors 10
3.3.1. Participant properties 10
3.3.1.1. Participant selection procedure 11
3.3.2. Illumination 11
3.3.3. Stimuli properties 11
3.3.4. Calibration 12
3.3.5. Head position 12
3.4. Experimental design 12
3.4.1. Stimuli 12
3.4.2. Test measurements 12
3.4.2.1. Accuracy and precision under ideal conditions 13
3.4.2.2. Accuracy and precision at large gaze angles 13
3.4.2.3. Accuracy and precision at varying illumination 13
3.4.2.4. Accuracy and precision with varying head positions 14
3.4.2.5. Summary 15
3.4.2.6. Artificial eye precision 15
3.4.3. Test lab 16
3.4.3.1. Environment 16
3.4.3.2. Equipment 17
3.4.3.3. Setup 17
3.4.3.4. Accuracy and precision test tool 17
3.4.4. Test procedure 18
3.4.4.1. Calibration 18
3.4.4.2. Data collection and validation 18
3.5. Data analysis 19
4. Discussion 19
4.1. Conclusion 20
5. References 20
Appendix 1 - Accuracy calculations 21
Appendix 2 - Precision calculations 23
Appendix 3 - SD Precision calculations 24
Appendix 4 - Stimuli positioning calculations 25

TestSpecification
6
1. Background
In the last decade important leaps in technology have allowed remote eye trackers to become increasingly powerful, accurate and unobtrusive. As a result, they have become a popular tool among behavioral and eye movement researchers. When remote eye trackers started to appear on the market, manufacturers looked for ways and attributes that could be used to describe and compare their performance. However, this process was done independently by each manufacturer and no standards have yet been established. Consequently, the technical specifications for eye tracker products are often not comparable, with each manufacturer providing a value that describes a specific attribute without clearly defining it, or stating the methodology used to measure it. Two recent studies performed by Zhang and Hornof (2010) and Johnson et al. (2007) illustrate this problem. In both cases the authors investigated the spatial errors (accuracy and precision) of the gaze data of two commonly used eye trackers, and found discrepancies between their measured values and the ones reported in the specifications.
In order to facilitate the interpretation of the specifications, as well as to provide an objective way to adequately compare different systems, it is important that the same method be used and each metric be clearly described; i.e. the tests must follow the same protocol, use participants drawn from similar populations (or alternatively use standardized artificial eyes), perform measurements in the same environmental conditions, and must analyze data in a standard and consistent way. The objective of this document is to suggest and describe a method to measure the accuracy and precision of remote eye trackers1, and to provide an open source software tool (Accuracy Test Tool2) to collect the gaze data and perform the metrics calculations.
When using this method it is strongly recommended to use the Accuracy Test Tool in order to ensure consistency between tests. However, as long as the stimuli are the same and all calculations and validations are performed according to the specifications, the measurements can also be performed with other gaze collecting software.
1.1. Accuracy and Precision
Among the different metrics describing an eye tracker’s performance, tracking robustness, accuracy and precision are the ones most affected by variations of the subject and environment properties. During data collection, these three metrics account for most of the gaze data errors and are used as indicators of the eye tracker data validity (Hornof and Halverson, 20023). A system with good accuracy and precision will provide more valid data as it is able to truthfully describe the location of a person’s gaze on a screen. Accuracy is defined as the average difference between the real stimuli position and the measured gaze position (figures
1 This is the current method employed to measure the accuracy and precision of Tobii Eye Trackers.2 To acquire a copy of the software please contact Tobii Support.3 Hornof and Halverson (2002) refer to accuracy and precision as the eye tracker’s systematic and variable error respectively.
1 and 2) (Holmqvist et al., 2011). Precision is defined as the ability of the eye tracker to reliably reproduce the same gaze point measurement, i.e. it measures the variation of the recorded data via the Root Mean Square (RMS) of successive samples (Holmqvist et al., 2011). In the proposed methodology, accuracy and precision are measured under different conditions in order to accommodate a wide range of possible user scenarios.
Figure 1. Illustrates the typical behavior of accuracy and precision. Accuracy is presented as the average offset between the point where the person is looking (the dark circles) and the gaze points measured by the eye tracker (the red Xs). Precision measurements show an eye tracker’s ability to reliably reproduce a gaze point measurement (the spread between the red Xs) and are calculated using the Root Mean Square (RMS) of successive samples.
x
α°
Figure 2. Accuracy and precision are measured in terms of gaze angles. In this figure the dashed red line represents the subject’s actual gaze direction, whereas the full line represents the gaze point measured by the eye tracker. The gaze angle is expressed as the deviation in degrees between the two lines, with the point of origin determined by the position of the eye.
The required level of accuracy and precision depends on the nature of the eye tracking study. Small uncertainties, for instance, can be critical when analyzing gaze data in reading studies or studies with a small stimulus (Zhang and Hornof, 2010).

Accuracy and precision test method
7
Tracking robustness measures the percentage of individuals in the population whose eyes can be tracked (i.e. can be relied on to provide valid gaze data) by an eye tracker. This metric is strongly dependent on the subjects’ physical characteristics such as sight correction, ethnicity and droopy eyelids. In order to optimize the test conditions and standardize the sample population, tracking robustness is not included in the current method. A method to measure tracking robustness will be specified and tested in a separate document.
2. Method requirements
The aim of this document is to present a methodology to measure, compare and report remote eye tracker specifications. In order to ensure that this objective is accomplished the following requirements were first established:
• Repeatable When replicated, the tests must produce the same results.
• Objective All metrics and measures must be specified so that regardless of test leader and analyzer, the tests will produce the same results.
• Comprehensive The test method must be comprehensive, and include a wide range of attributes related to the eye tracker performance in terms of accuracy and precision).
• Universal The measures and metrics are to be relevant and applicable to most eye trackers on the market (remote eye trackers).
• Relevant All metrics should represent relevant user scenarios and illustrate how changes in environ-ment, varying head positions, and stimuli place-ment affect accuracy and precision.
• Independent All measurements are separated from each other in order to attain independent metrics. Each metric is consequently solely depend-ent on the changed variable for the specific test (e.g. accuracy under ideal conditions and accuracy at large gaze angles are measured in different tests).
• Non-filtered data The eye tracking data must be pure raw data from the SDK, without any kind of filter. Only when measuring filter effects on artificial preci-sion shall a filter be used.
3. Methodology
3.1. Accuracy metrics
Accuracy is calculated separately for the dominant eye and as a mean value from the two eyes in each sample. The two metrics are in this document referred to as monocular and binocular data (table 1). Taking the averages from the left and right eye (binocular tracking) is shown to give less error than measuring each eye separately (Cui and Hondzinski, 2005). For monocular accuracy, the data from the dominant eye of the participant is used for calculations of accuracy and precision. The dominant eye of the participant is determined by asking the participant to hold a sheet of paper with a 3 x 3 cm hole in it with outstretched arms, and to look through the hole at a specific target. After this, the participant is told
Accuracy metric Description Motive
Monocular Accuracy Accuracy based on one eye for each participant
To illustrate the performance with only one eye
Binocular Accuracy Accuracy as the arithmetic mean value from the two eyes
The accuracy as perceived in most user situations
Accuracy tests Description Motive
Accuracy at ideal conditions Accuracy under ideal conditions The baseline measurement to be compared to all other test results
Accuracy at large gaze angles (25 and 30 degrees)
Accuracy at extreme gaze angles To illustrate how extreme gaze angles affect accuracy
Accuracy at varying illumination(four illumination steps and one inversion foreground/background)
Accuracy at varying illumination To illustrate how light conditions affect accuracy
Accuracy at varying head positions (Throughout the entire track box)
Accuracy with effects from head movements
To illustrate how head movements affect accuracy
Table 2. Accuracy tests. This table describes the different accuracy test categories along with their motive. Both accuracy metrics are measured for all described tests.
Table 1. Accuracy metrics. This table describes the two accuracy metrics (variables) extracted from the test data, along with the motive describing why they are to be measured.

TestSpecification
8
to keep the piece of paper in the same position and to close one of the eyes, and then to switch eyes. The eye that is able to maintain the target in sight when the other is closed is the dominant one. The test is repeated for verification.
Opinions vary on whether using the dominant eye as the single source of gaze data will yield less accuracy or precision errors (when compared to binocular data). In fact some researchers advocate the opposite (Cui and Hondzinski, 2005). Regardless of this discussion, it is of great importance to be consistent in choosing which eye is to be used for monocular tracking throughout all tests. Both metrics are obtained from all tests (table 1 and 2). The tests and their motive are described in table 2. The test conditions are based upon factors affecting accuracy and precision (section 3.3).
Accuracy is calculated as the mean offset in millimeters and thereafter gaze angles based on the distance between the eye and the eye tracker. Complete calculations are provided in Appendix 1 - Accuracy calculations.
3.2. Precision metricsIn this test method, precision is measured both on
artificial eyes as well as human eyes in order to differentiate between the noise inherent in the system and the additional precision factors caused by human eye movements and individual physiological properties. For human eye precision measurements, there are three aspects included in the metric, which all affect the attained value (figure 3).
Figure 3. Factors affecting human eye measured precision. The three factors are all included in the measured precision value on humans. The top two variables are measures of human eye movement, whereas the system inherent noise is a variable only dependent on the noise within the system (the eye tracker).
The three factors mentioned earlier are described below:
• Microsaccades: Small eye movements that move the gaze back to the target after a drift. Microsaccades can be as large as 1° and last for 0.3 seconds (Hol-mqvist et al., 2011).
• Tremor: Periodic, wave-like motion of the eyes with a typical frequency of ~90 Hz and amplitude of 20” (Martinez-Conde et al., 2004).
• Drift & System inherent noise: Drifts occur simultaneously with tremor and are slow motions of the eye (Martinez-Conde et al., 2004). System inherent noise is the precision of the system itself. This is subsequently measured in precision tests on artificial eyes, section 3.4.2.6 (Holmqvist et al., 2011).
In a precision measurement on artificial eyes, there is only one factor that affects the results: the system inherent noise (assuming the artificial eyes are of optimal design and remain completely still). Therefore, it is important to measure precision on both human eyes and artificial eyes to describe the system performance as a whole. All precision metrics are described in table 3, along with the motive describing why they are measured.
One source of error when measuring precision is the possibility to include flicker in the data. Flicker (figure 4) induces large deviating samples caused by faulty glint detection or incorrect pupil edge adjustment. These errors are related to tracking robustness and are usually detected in recordings where the eye tracker struggles to find the eyes. Precision is the variation in the data during stable tracking. To avoid extreme flicker being included in the precision measurements, validation requirements examine collected data as a part of the test procedure (section 3.3). Human eye precision is consequently measured in all accuracy tests, calculated from the same data used for accuracy (table 4). The tests are based upon the factors affecting accuracy and precision in section 3.4.4.
Table 3. Precision metrics. The table presents all types of precision along with description of each metric and motives specifying why they are measured.
Precision metrics Description Motive
Artificial monocular Precision Precision with stationary artificial eye To measure pure system precision without human physiology artifacts
Artifical binocular Precision Precision with stationary artificial eyes To measure pure system precision without human physiology artifacts, as a mean value from two eyes
Monocular Human Precision Precision when using only one eye To measure precision that also includes human eye movement artifacts
Binocular Human Precision Precision as a mean value from the two eyes
To measure precision that also includes human eye movement artifacts
Standard deviation Human Precision (SD Precision)
Precision calculated as SD for both eyes (same as RMS normalized by the mean)
A precision metric that is less dependent on sample frequency – for a more comparable measure between eye trackers

Accuracy and precision test method
9
Figure 4. Flicker. A phenomenon that may appear at low trackability, induced by faulty glint detection or incorrect pupil edge adjustment. The red mark is the measured gaze and the point the target stimuli (“blue” light dot).
3.2.1. Precision Calculation
Precision is defined as the ability of the eye tracker to reliably reproduce a measurement, i.e. a measure of variance in the recorded data (see figure 5). It is calculated via the Root Mean Square (RMS) of successive samples (Holmqvist et al., 2011) which is commonly used when calculating eye tracking system’s precision.
Figure 5. Noise (Precision). At stable tracking, the measured gaze point differs little from the previous samples. This is consequently what is measured when testing precision.
Precision is calculated via the Root Mean Square from the successive data points [in degrees of visual angle θi between successive (x1,y1) to (xi+1, yi+1) samples], both for each eye individually and as a mean from the two (see formula 1).
RMS = 1 2
1
12
22 2
n nii
nnθ
θ θ θ
=∑ =
+ + + (1)
Where θ is the visual angle in degrees and n is the number of samples in the dataset. Using the successive visual angle means the angular difference between sample 1 and sample 2 etc (figure 6). Precision is calculated for each eye individually and as a mean of both eyes. The complete calculations are presented in Appendix 2 - Precision calculations.
ϴ1
ϴ3
ϴ 2
Figure 6. Illustration of precision measured from RMS of sample to sample difference (the angular difference from one sample to the next). The difference from one sample to the next is subsequently used to calculate precision via the RMS formula.
3.2.2. SDPrecision calculation
Another option to describe the variation in the data is to measure the standard deviation of the data set, equivalent to the RMS normalized by the mean (Holmqvist et al., 2011). This way of measuring precision is in this document referred to as SDPrecision and is used as a reference to the official precision measure. SDPrecision is only calculated on binocular data. The metric is calculated as the standard
Precision tests Description Motive Metrics
Precision under ideal conditions
Precision at ideal conditions The baseline measurement to be compared to all other test results
Monocular human precision, binocular human precision, SD Precision
Precision at large gaze angles(25 and 30 degrees)
Precision at large gaze angles
To illustrate precision deviations due to large gaze angles
Monocular human precision, binocular human precision
Precision at varying illumination (four illumination steps and one inversion foreground/background)
Precision at varying lightning conditions
To illustrate how light conditions affect precision
Monocular human precision, binocular human precision
Precision at varying head positions (throughout the entire track box)
Precision with effects from head movements
Since precision varies due to focus and number of pixels covering the eye
Monocular human precision, binocular human precision
Artificial precision test Artificial eye precision To illustrate precision without human artifacts
Artificial monocular precision, artificial binocular precision
Table 4. Precision tests. The table presents all precision tests along with their motives and what metrics are to be measured in each test.

TestSpecification
10
deviation of the data set, equivalent to using the RMS normalized by the mean (Holmqvist et al., 2011). Precision based on standard deviation is normally less dependent on frame rate as it is based on deviations from the mean in a data set (Figure 7).
Figure 7. Illustration of SDPrecision. This metric describes the deviation from the mean value for all samples. It can be calculated in two ways; either by RMS normalized by the mean, or by the standard deviation of the data set.
3.3. Participant and environmental factors
Parameters mainly affecting the performance of an eye tracker are the system as a whole; comprising both the hardware properties and the firmware. However, apart from those variables, there are many parameters affecting accuracy and precision. They are described in the following section.
The accuracy error varies considerably across participants and experimental conditions (Hornof and Halverson, 2010). Accuracy is dependent on participant properties (see section 3.3.1), illumination in the test environment (see section 3.3.2), stimuli properties (see section 3.3.3), calibration quality (see section 3.3.4) and the eyes’ position in the track box (see section 3.3.5). To what extent these variables affect accuracy depends on the eye tracker: which is one of the reasons why an extensive test method is required in order to illustrate the performance of a specific eye tracker.
Figure 8. Track box. The track box is the volume in which the eye tracker is able to track the eyes. Thus, the subject is able to move the head freely and still remain trackable as long as the eyes are still within the box.
3.3.1. Participant properties
Figure 9. Participant properties affecting accuracy. The factors affecting accuracy and precision are presented, as well as what specific properties each factor refers to.
The retinal reflection properties refer to whether the person is preferably tracked via bright pupil or dark pupil techniques. There is a large variation in retinal response between individuals (Nguyen et al., 2002). The main finding in this study was that the pupil intensity correlates with pupil size, with large pupil sizes producing high intensity values but also showing a larger variation among individuals. This supports the idea that even though pupil size has a strong effect on bright pupil response, it is not the only factor involved. In the same study Nguyen et al. tried to determine whether ethnicity could also account for part of the differential response of individuals, however due to the small sample size no strong effects were observed. Regardless of these results, it is clear that people of different ethnicities have different ocular anatomy (Richard et al., 2003) and responses to dark and brigh pupil tracking (Nguyen et al., 2002).
Another study on bright pupil responses found variations due to gaze positions in the vertical axis (Agustin et al., 2006). As this characteristic is highly individual and different eye tracking systems may handle different physiological properties differently, the group of participants for the accuracy and precision tests must contain a large variation in retinal reflection properties. When locking an eye tracker in a specific mode it is obvious that bright pupil tracking produces lower precision errors (table 5), especially for the RMS calculations (section 3.2.1). This data is collected from a precision measurement under ideal conditions. When performing the precision tests, the participants must be balanced so that 50% of the group are “dark pupil trackers” and 50 % are “bright pupil trackers”.
Table 5. Comparison of bright and dark pupil tracking effects on precision. The table presents precision values for dark and bright pupil tracking, both in terms of the regular precision metric and SDPrecision. The result is based on a precision measurement under ideal conditions using a Tobii T60 XL eye tracker, with results parsed in each mode. All 20 participants were measured with both techniques.
Binocular precision Precision SD Precision
Tobii T60 XLBP 0.12 0.2
DP 0.23 0.22

Accuracy and precision test method
11
Pupil occlusion includes effects caused by the pupil being covered by the eyelids, and things such as droopy eyelids and mascara. Such idiosyncrasies usually result in a decrease in tracking robustness and are therefore not included in the accuracy test series. Fixation ability refers to how well a person is able to fixate on a specific point with both eyes. There are slight differences between the fixation coordinates provided by the left and right eye, and in some individuals this difference can be quite large; a condition known as having a “lazy eye”. People with a lazy eye are consequently not included as participants.
To obtain stable data and repeatable tests, all participant property variables must be kept constant in order to ensure that they do not affect the result. As a consequence of this and the fact that tracking robustness is not to be included in the accuracy measures, only people with good tracking properties are used in the accuracy and precision tests. Subsequently, people with sight correction, droopy eye lids or poor fixation abilities are rejected from participation.
3.3.1.1. Participant selection procedure
The selection process when identifying suitable test subjects for the testing was done in two steps: First, the caracteristics of their eyes were evaluated, and secondly, their ability to be successfully eye tracked.
The initial test population (Tobii AB) was about 200 individuals. From this population 90 individuals who had “adequate eyes” for testing were selected. Individuals with adequate eyes had to fulfill the following criteria:
• Not need to use any type of prescriptive eye ware (glasses or lenses).
• Not have droopy eye lids or a very narrow eye shape.
• Not suffer from strabismus or lazy eye conditions.
• Not previously had eye surgery
• Not have any damage or known defects on any of the eyes.
This selection step was/is performed to ensure that tracking robustness effects are limited as much as possible when doing the accuracy and precision calculations.
From this group of test participants, about 40 individuals were selected based on the following criteria:
• Calibration validation: all participants must have valid data from all 9 calibration points and receive calibra-tion feedback indicating good accuracy and precision.
• Good accuracy: the data from all participants must have an average accuracy < 0.8° under ideal condi-tions.
• Good precision: the data from all participants must
have an average precision of < 0.5° under ideal con-ditions.
This selection step was/is performed to better evaluate the performance of the system in optimal conditions with the best participants, i.e. to get the ideal system performance. During the test of the system, an additional criteria is introduced:
• Validation criteria of the metrics tool during testing: each stimuli point shown should have data from > 80% of the samples, accuracy should not exceed 5° and precision should not exceed 1,5°.
3.3.2. Illumination
The illumination properties in the test lab are to be considered another parameter affecting accuracy (Zhu et al., 2002). Both accuracy and precision are dependent on the illumination because of pupil dilation and tracking technique (bright or dark pupil). Therefore, the illumination in the test room is kept stable during the tests and is only manipulated in the illumination-dependent test. Placement of the light sources remains consistent throughout all tests, and only the light intensity is manipulated to different levels. In order to avoid reflections from shiny lampshades, soft box illuminators are preferably used as light sources in the test room.
Figure 11. Illumination parameters that affect accuracy. The figure illustrates the three illumination factors that may impact the accuracy and precision values.
3.3.3. Stimuli properties
The luminance of the stimuli on the screen affects accuracy in a similar way as the illumination in the room: a very bright screen results in strong light being directed straight at the pupils - causing the pupils to reduce in size. Because of this, the luminance caused by the stimuli is kept stable throughout the test session except for when the influence of luminance is tested.
The placement of the stimuli affects accuracy in several ways; a large gaze angle normally impairs accuracy. Similarly, the position of the stimuli in relation to the calibration points has an impact as well. Large stimuli may affect general accuracy as the participant does not have a specific point to focus on. However, during development of this test method, accuracy values regarding small (6 pixels) and large points (36 pixels) with a marked center point were compared, and no differences in accuracy or precision were observed.

TestSpecification
12
Figure 10. Stimuli parameters that affect accuracy and precision. The figure illustrates the three stimuli factors that may impact the accuracy and precision values.
3.3.4. Calibration
The accuracy result of a test also depends on the calibration setup and the number of calibration points used. Firstly, it is important to makes sure that enough data is obtained at all calibration points. In general, the more calibration points, the better the accuracy. The accuracy will also be better the more similar the conditions in the test are to the calibration conditions. Therefore, the conditions during calibration are the same as those for accuracy under ideal conditions. Since there is no recalibration afterwards, the effects of changing conditions will be captured in the results for all other manipulations. Another calibration issue related to accuracy is the placement of calibration points in relation to the points used in the tests. The quality of the calibration also varies between individuals and from one point in time to another.
Figure 12. Calibration properties affecting accuracy. The figure illustrates the three calibration factors that may impact the accuracy and precision values. Variation referes to the variability between different individual calibration sessions.
3.3.5. Head position
One important factor that highly affects accuracy is the position of the subject’s head in the track box (Fujimura et al., 2002). One general rule is that the closer to the center of the box (and the calibration position) a person is, the better the accuracy becomes. The effect is generally speaking larger along the Z-axis than it is along the X-axis and Y-axis (figure 13), but this depends on the properties of the eye tracker.
Figure 13. Coordinate system for the eye tracker and the participant position.
3.4. Experimental design
3.4.1. Stimuli
The stimulus area is based on a regular 3x3 point pattern ratio corresponding to the ratio of the screen, with the topmost corner points at the gaze angle limit (figure 15). The points are white circles on a black background, with a diameter of 36 pixels. The points have a centered black dot to focus on (figure 14). The positions of the nine points are calculated from the gaze angles (figure 15) as described in Appendix 4 - Stimuli positioning calculations.
Figure 14. Stimulus point. The point is designed with a center dot to focus on. The total diameter of the stimulus point is 36 pixels.
α°
Figure 15. Stimuli positioning determination. The placement of the stimuli on the screen is determined based on gaze angles. For ideal conditions the top left and right points are placed on the specified angle; marked α in the figure.
The stimulus positions are calculated from the distance to the center of the box, and the screen size and resolution (according to the calculation in Appendix 4 - Stimuli positioning calculations). They are therefore consistent, regardless of head movements during the tests. This ensures that the placement of the points are kept consistant for different eye trackers, in terms of gaze angle on the screen. The ratio of the total stimuli size depends on the screen ratio, but the number of points is always nine.
3.4.2. Test measurements
Accuracy and precision values measured on human eyes are based on stimulus points on a screen. The participants are asked to focus their gaze on each of the points in a test trial. Each point is presented for 2 seconds and the points are presented in a random order. The target points are used in order to calculate accuracy, as a reference point in relation to the measured gaze point. Precision is measured from the same data for each point individually. There is a short break between each test trial for the test leader to change conditions and for the participant to rest her/his eyes. All tests are performed with a chinrest, as it – to some extent – has a positive impact on precision (Holmqvist et al., 2011).
zx
y

Accuracy and precision test method
13
3.4.2.1. Accuracy and precision under ideal conditions
Accuracy and precision under ideal conditions are measured under the most advantageous eye tracking conditions. This means that the setup is prepared so that the eye tracker can perform optimally. The ideal accuracy and precision values are used as reference points for all subsequent tests where the recording conditions are manipulated. It is also to be considered a “best scenario” performance; a measure of how well the eye tracker performs under ideal conditions. In a real-world eye tracking study, ideal accuracy is unattainable, unless one uses a chinrest and very carefully controlled stimuli on the screen. Accuracy at ideal conditions is only measured within a gaze angle of 20° (figure 16). During the test, the subject’s eyes are positioned in the middle of the track box, with the head placed on a chinrest.
Calibration
9 points default calibration (all over the screen). Eye position in the center of the track box, head on a chinrest White points on black background 300 lux
Test trial
Stimuli: 9 points (3x3), aspect ratio White on black backgroundAll points within 20° gaze angle
Eye placement: Center of the track box
Illumination: 300 lux (soft box illumination sources)
Environment: Lab
Chinrest: Yes
Figure 16. All stimulus points in the accuracy under ideal conditions test (Tobii T60 XL).The top left and right points are placed at a gaze angle of 20 degrees. The stimuli ratio corresponds to the screen resolution. The same stimuli are also used for the head position variation tests, as well as for the illumination dependent tests (barring the white background test).
3.4.2.2. Accuracy and precision at large gaze angles
Accuracy and precision at large gaze angles are measured at gaze angles of 25°, 30° and 35° or as wide as the screen allows (figure 17). The stimuli placement is based on the ideal dimensions (3x3 points, aspect ratio), but using only upper corner points at the specific angle, illustrating the
performance at said angle. This stands in contrast to accuracy and precision under ideal conditions, where seven of the nine points are placed within 20°, and only two on the exact gaze angle. The subject’s eyes are situated in the center of the track box, the head remains fixed upon a chinrest. The calculations to retrieve the positions are performed in the same way as for accuracy under ideal conditions. For accuracy at large gaze angles, the points are presented twice in order to obtain a sufficient amount of data. The subject may turn the head slightly towards the point in order to avoid too much stress on the eye muscles. Calibration
Use previous if performed in sequence (same conditions as for accuracy under ideal conditions)
Test trial
Stimuli: 2 points, aspect ratio (figure 16 White on black background Varying gaze angles (25°, 30°, etc)
Eye placement: Center of the track box
Illumination: 300 lux (soft box illumination sources)
Environment: Lab
Chinrest: Yes
Figure 17. Stimuli for accuracy at large gaze angles, using a Tobii T60 XL. The large gaze angle tests are based on 5 degree gaze angle increases from the ideal stimuli. For the T60 XL with a 24” screen, this implies 25 and 30 degrees, as the figure illustrates.
3.4.2.3. Accuracy and precision at varying il-lumination
Accuracy and precision at varying illumination illustrates the effects of lighting conditions. It is measured at the center of the track box, with the subject’s head fixed on a chinrest. The stimuli placement is the same as for accuracy under ideal conditions. With respect to trial 2, it is not necessary to remeasure if the accuracy under ideal conditions test has already been performed by the same test participant (as they are identical). Also included in the accuracy at varying illumination tests is the white background test (figure 18), where the stimuli colors are inversed to demonstrate how the luminance of the screen affects accuracy and precision.

TestSpecification
14
The four illumination levels were chosen to reflect the different light conditions of most indoor work environments: 1 lux corresponds to a dark room test setup were the eye tracker screen is the only light source; 300 lux represents the general ambient light levels in offices, classrooms, laboratories and public areas; 600 lux represents a work station with one target4 light over the work area; and 1000 lux corresponds to a workstation setup that involves multiple target lights or a brightly illuminated room (Swedish Work Environment Authority www.arbetsmiljoverket.se; Illuminating Engineering Society www.ies.org). Calibration
Use previous if performed in sequence (same conditions as for accuracy under ideal conditions)
Test trial
Stimuli: 9 points (3x3), aspect ratioStimuli color according to table 3.All points within 20° gaze angle.
Eye placement: Center of the track box
Illumination: Manipulated according to table 6.
Environment: Lab
Chinrest: Yes
5 A light source that is pointing to a specific location of the work area (direct lighting).
Figure 18. White background stimuli, using a Tobii T60 XL monitor. The stimulus colors are inverted, creating the brightest stimuli possible. The positions of the points are the same as before, within a 20° gaze angle.
3.4.2.4. Accuracy and precision with varying head positions
Accuracy and precision with varying head positions is measured at varying positions throughout the tracking box. The test participant’s head is placed upon a chinrest and kept still, and the eye tracker is moved to the specified positions. Each dimension is measured separately (figure 19). The measurements are performed at intervals of 5 cm, regardless of the size of the track box for the eye tracker. Along the Z-axis (distance from eye tracker), measurements are performed at 5 cm intervals, starting at the first applicable distance of 5 cm (table 9). X- and Y-axis measurements are performed at the center of the box in Z. In these data collections, the eye tracker
Test Trial 1 Trial 2 Trial 3 Trial 4 Trial 5
Illumination Darkness(1 lux)
Normal(300 lux)
High (600 lux)
Extreme(1000 lux)
Normal (300 lux)
Screen background Black Black Black Black White
Foregroundcolor(points)
White White White White Black
Table 6. Test trials in the accuracy at varying illumination tests. The table describes the test trial conditions in terms of illumination and stimulus properties. Trial 2 yields the same results as the ideal conditions test.
Y axis
Z axis
Y axis
X axis
A. B.
Figure 19. Head positions within X-, Y- and Z-axis. Figure B shows how, within each test, the position of the subject is moved along the X-axis and Y-axis, away from the center of the track box. For these tests, all recordings are performed at the center of the track box along the Z-axis. Figure A illustrates the transposition along the Z-axis, in which the first test is performed close to the eye tracker, and the distance is increased by 5 cm for each subsequent test. If one of the distances coincides with that of the test under ideal conditions, this test trial may be skipped as the data has already been retrieved.

Accuracy and precision test method
15
is moved 5 cm at a time from the center of the box (Figure 18). The result is consequently divided in tables or diagrams for the X-, Y- and Z-axis separately. The stimulus is kept in the same position as in the Ideal conditions measurements.
Calibration
Use previous if performed in sequence (same conditions as for accuracy under ideal conditions)
Test trial
Stimuli: 9 points (3x3), aspect ratio White on black background All points within 20° gaze angle.
Eye placement: Manipulated according to Figure 18.
Illumination: 300 lux (soft box illumination source).
Environment: Lab
Chinrest: Yes
Head box accuracy along the X-axis is also measured with monocular tracking. This is done in order to illustrate the track box size when accepting tracking from only one eye within the X-axis. The validation requirements for monocular tracking are the same as before, but applicable to the tracked eye within the head box. Monocular tracking is, as mentioned previously, based on the dominant eye of the participant, but in the case where only one eye is positioned in the track box, the visible eye is used for monocular tracking.
3.4.2.5. Summary
In conclusion, there is one test examining the extension of each of the mentioned affecting factors (table 7). This way, the effect of each of the factors will be apparent in the test result for each test. Ultimately, 20 people participate in all accuracy and precision tests in order for the participant properties to remain. As mentioned before, half of the subjects in the test group perform best via dark pupil tracking, whereas the other half perform best via bright pupil tracking.
3.4.2.6. Artificial eye precision
Artificial eye precision is measured in the middle of the track box as well as at varying distances from the eye tracker to illustrate distance-dependent precision effects. As artificial eyes function consistently within all levels of illumination, the measurement is performed exclusively at 300 lux. The measurements on artificial eyes are performed in the same lab as the accuracy and precision tests. The eyes are placed at the center of the box pointing straight towards the screen, approximately 7 cm apart. Artificial eye precision is measured on each eye individually and as a mean value from the two eyes. As there is no dominant eye for artificial eyes, the mean value of the two monocular data sets is used for monocular precision. The measurements are performed without any calibration and the recordings are the same as for human measurements with nine intervals of recordings, each being one second long. Systems that do not obtain gaze data without calibration are calibrated on a human before performing measurements on the artificial eyes.
The performance of dark and bright pupil eye tracking methods is affected by variations in the structure of the human eye. For example, the eyes of Hispanic and Caucasian individuals have a good bright pupil response, however this method has proven to be less suitable when eye tracking Asians, for whom the dark pupil method provides better trackability. Likewise, the type of synthetic eyes that work optimally in bright pupil mode require different structural properties than the ones optimally tracked by the dark pupil technique. Therefore eye tracking systems with both bright and dark pupil technology should be tested twice, using each mode separately. A similar argument arises when the objective of the tests is to compare the performance of two different eye trackers. Due to differences in the development of eye tracking software and hardware it is common that different eye trackers perform optimally with different types of artificial eyes. Thus to perform an objective comparison it is important to find eyes that work equally well with both systems. Figures 20 and 21 show the dark pupil tracking synthetic eyes developed by Tobii to measure the precision performance of Tobii Eye Trackers in dark pupil mode.
Table 7. Manipulated variables in each of the accuracy/precision tests. The table describes the different test categories and which variables are manipulated for each of them.
VariablesIdeal conditions
Large gaze angles
Varying illumination
Stimulibackground
Varying head positions
20 Participants (Same test group for all tests)
Eye color Mixed Mixed Mixed Mixed Mixed
Sight correction
None None None None None
Age (years) 20 - 50 20 - 50 20 - 50 20 - 50 20 - 50
Calibration 9-point default
9-point default
9-point default
9-point default
9-point default
Gaze angle ≤20° 25°, 30°, 35° ≤20° ≤20° ≤20°
Illumination 300 lux 300 lux Manipulated 300 lux 300 lux
Stimuli (Foreground/ background color)
White/Black White/Black White/Black Black/White White/Black
Eye placement in box Center of box Center of box Center of box Center of box Manipulated

TestSpecification
16
Figure 20. Shows a photo of the dark pupil eyes. The figure presents the synthetic eyes in their physical appearance
Figure 21. Example of a design of artificial dark pupil eyes. The figure describes the technical design of the dark pupil eyes used in the precisionmeasurements.
These synthetic eyes can be ordered at cost price; contact Tobii support for more information. Tobii is also currently developing synthetic eyes that can be used to measure the bright pupil tracking precision.
For eye trackers that supply a noise reduction filter, the measurements are performed with and without the filter enabled. The positions of the eyes used in the test are the same as when testing varying head positions with actual participants. Subsequently, the artificial eye precision tests result in the eight basic measurements when the eyes are positioned in the center of the track box, i.e. with or without filtering, monocular or binocular data and for combinations of this with dark or bright pupil tracking. The measurements also provides monocular and binocular values for tracking at various distances.
3.4.3. Test lab
3.4.3.1. Environment
In order to correctly perform the accuracy and precision tests, a controlled lab is crucial to avoid environmental effects from skewing the results. Vibrations and surrounding distractions on the test participants may carry a great impact on the outcome of the test, and must therefore be eliminated. To avoid these kinds of discrepancies, the lab must be isolated from disturbing activity and the setup on the table must be positioned steadily. Light conditions have the greatest effect on test results, and as such must be carefully controlled. Firstly, the light intensity must be measured to correspond with the level prescribed in the specific test. The light intensity is measured with a lux meter. The lux meter is placed at five different positions/directions in order to ensure that the light conditions are even across the room. The five positions are as follows: one reading is taken directly in front
Figure 22. shows an illustration of a sample test environment. The eye tracker is placed on a X-Y table (detail, top right), with the test subject behind the chin rest. The room is illuminated by four soft boxes: two are placed on each side of the participant, one behind the eye tracker, and the forth one is placed behind the participant facing the eye tracker. The fourth soft box is not shown in the illustration.

Accuracy and precision test method
17
of the eye tracker, directed towards the test participant; another is taken at the position where the eyes are to be placed, with measurements taken straight towards the eye tracking device, to the right, to the left, and upwards. In addition, it is imperative to avoid any light reflections in the room and that all light sources give a wide spread across the room (it is recommended to use soft boxes). The light sources must not be angled towards the eye tracker nor towards the participant in order to avoid disturbing the test subject. When adjusting the light intensity in between test trials, the lights should be dimmed to achieve the correct light intensity. A further prerequisite for an adequate testing environment is that the test room remain isolated from sunlight and other uncontrolled light sources. Since one of the test conditions requires darkness, the test room must be isolated and, if possible, completely darkened for this test trial. If there are windows in the room, these must be covered so that all light sources are controlled exclusively by the test leader. Figure 21 shows an illustration of the Tobii test lab environment.
3.4.3.2. Equipment
There are a few tools needed in the tests. Firstly, an eye tracker and computer are required to conduct the tests. In addition, a light meter is needed (figure 23) in order to ensure the correct light intensity for each of the tests.
Figure 23. light meter. A light meter is required in order to determine the illumination in the test lab.
A chinrest is also necessary to fixate the head positions (figure 24).
Figure 24. Chinrest. A chinrest is required in all tests to ensure the eye positions remain constant throughout the test series.
In order to perform the track box accuracy tests, an X-Y table (figure 25) is required to easily move the eye tracker to the precise positions in the head position tests.
Figure 25. X-Y table. The X-Y table is designed to simplify the transition of head positions in the track box by moving the eye tracker to specific positions. The table is also vertically adjustable in order to accommodate all specified positions.
3.4.3.3. Setup
Eye trackers with attached screens are generally measured in their existing setup. When starting up the tests, it is important to make sure that the screen is perpendicular to the table, pointed straight towards the participant.
Eye trackers without a connected screen are to be set up with the screen recommended for the unit. When doing so, it is desirable to attain a setup as similar to screen-connected eye trackers as possible. This ensures that the results are comparable between eye trackers, regardless of whether the unit is equipped with an attached screen or not. Consequently, the eye tracker should be placed directly under the screen, at the middle of the screen along the X-axis. The distance along the Y-axis from the eye tracker to the screen should be minimized as much as possible. In terms of Z-axis direction, the eye tracker should be placed close to the screen, which can prove difficult for some eye trackers, depending on hardware properties and setup fixtures. For all eye trackers, the setup properties are specified in the test tool along with other hardware information in order to attain the correct accuracy and precision data. Lastly, a final important precaution regarding reliability is to measure all participants on the very same unit and firmware to avoid possible sources of error.
3.4.3.4. Accuracy and precision test tool
The accuracy and precision test tool is a software application developed specifically to perform accuracy and precision measurements. The tool collects gaze data, produces stimuli based on the hardware properties of the specific eye tracker, and performs accuracy and precision calculations. In addition, the validation of the gaze data is performed in real-time directly after each recording, and unaccepted points are remeasured until approved (up to three times). The test tool contains several settings for analysis and validation as well as for the test design at large, and gives the test leader the information needed for each test trial (lighting, head position, etc.) in real-time. After a test is performed, the result can be examined in the application or exported to text documents.
TestSpecification
18
3.4.4. Test procedure
3.4.4.1. Calibration
One calibration for each person is performed at the start of the test series. The calibration consists of 9 points, covering the whole screen. The background/foreground color is the same as for the following tests; consisting of white points on a black background. However, the points may be animated depending on the default settings of the eye tracker. The calibration is performed at the center of the track box with the participant using a chinrest (i.e. the same conditions as for accuracy under ideal conditions). In the calibration, the points are animated, starting from a normal size before shrinking, and data is collected while the point is at minimal size.
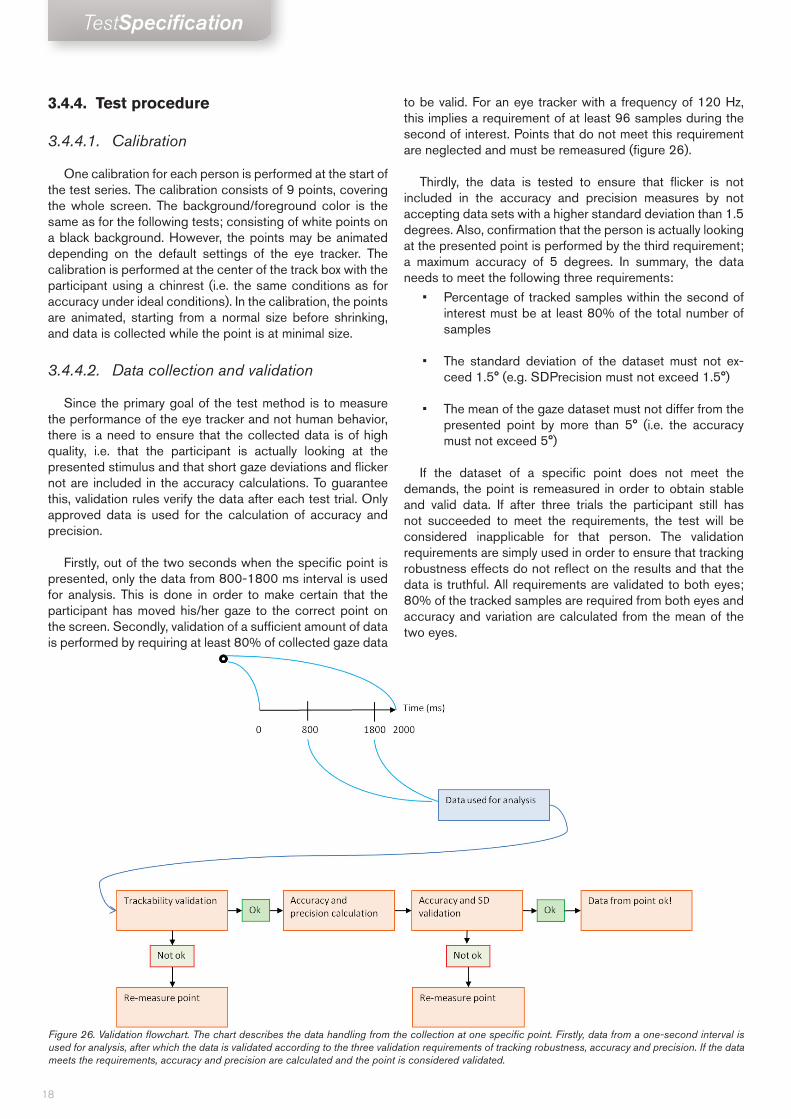
3.4.4.2. Data collection and validation
Since the primary goal of the test method is to measure the performance of the eye tracker and not human behavior, there is a need to ensure that the collected data is of high quality, i.e. that the participant is actually looking at the presented stimulus and that short gaze deviations and flicker not are included in the accuracy calculations. To guarantee this, validation rules verify the data after each test trial. Only approved data is used for the calculation of accuracy and precision.
Firstly, out of the two seconds when the specific point is presented, only the data from 800-1800 ms interval is used for analysis. This is done in order to make certain that the participant has moved his/her gaze to the correct point on the screen. Secondly, validation of a sufficient amount of data is performed by requiring at least 80% of collected gaze data
to be valid. For an eye tracker with a frequency of 120 Hz, this implies a requirement of at least 96 samples during the second of interest. Points that do not meet this requirement are neglected and must be remeasured (figure 26).
Thirdly, the data is tested to ensure that flicker is not included in the accuracy and precision measures by not accepting data sets with a higher standard deviation than 1.5 degrees. Also, confirmation that the person is actually looking at the presented point is performed by the third requirement; a maximum accuracy of 5 degrees. In summary, the data needs to meet the following three requirements:
• Percentage of tracked samples within the second of interest must be at least 80% of the total number of samples
• The standard deviation of the dataset must not ex-ceed 1.5° (e.g. SDPrecision must not exceed 1.5°)
• The mean of the gaze dataset must not differ from the presented point by more than 5° (i.e. the accuracy must not exceed 5°)
If the dataset of a specific point does not meet the demands, the point is remeasured in order to obtain stable and valid data. If after three trials the participant still has not succeeded to meet the requirements, the test will be considered inapplicable for that person. The validation requirements are simply used in order to ensure that tracking robustness effects do not reflect on the results and that the data is truthful. All requirements are validated to both eyes; 80% of the tracked samples are required from both eyes and accuracy and variation are calculated from the mean of the two eyes.
Figure 26. Validation flowchart. The chart describes the data handling from the collection at one specific point. Firstly, data from a one-second interval is used for analysis, after which the data is validated according to the three validation requirements of tracking robustness, accuracy and precision. If the data meets the requirements, accuracy and precision are calculated and the point is considered validated.

Accuracy and precision test method
19
In the accuracy test tool, all rejected points can be remeasured up to three times. However, some of the conditions in the more variable tests (specifically, the accuracy and precision at varying illumination tests, as well as in the track box tests) may be too difficult for the eye tracker to handle. Consequently, if one or more data points are not accepted for calculation, all data from that test trial and participant is rejected and no accuracy and precision is calculated. If more than three of the total 20 participants are rejected, the eye tracker is considered unable to track in the specific condition. In conclusion, seventeen people who all meet the requirements in all points are required in order for accuracy and precision to be presented for the specific test.
3.5. Data analysis
Accuracy and precision values for each test are calculated by using the mean of all points for each person and subsequently the mean of all participants in each test. The accuracy and precision metrics are calculated from every test and are presented individually. The result is presented in tables, with means and standard deviations from all metrics for both monocular and binocular data. The distribution among the participants is further illustrated in histograms. For head position accuracy and precision, the result is preferably presented in tables and diagrams describing the performance along the X-, Y- and Z-axes separately.
4. Discussion
This methodology has been developed in response to the lack of standards regarding the measurement and presentation of technical specifications of remote eye trackers. Presently, manufacturers provide very little information on how the specifications are defined and measured, making it difficult to objectively evaluate the eye tracker’s performance and rendering comparisons between different systems inconsistent. The aim of this document is to provide a set of standard procedures to measure, compare and report remote eye tracker specifications. In order to accomplish this objective, the process was designed to: ensure that the tests can be replicated (i.e. no matter who conducts the tests, they shall measure the same eye tracker attributes and reach the same results), as well as to see to it that the metrics and tests represent valid user scenarios that can be applied to most remote eye trackers. In the next paragraphs, a few test design issues will be discussed in order to underpin the validity of this methodology.
Eye movements during data collection affect the precision outcome (described in section 3.3). Due to the faster sample rate, high speed systems are less affected by eye movements and may display better precision than systems with a lower frame rate. For example, if a fixation is unstable during a measurement, a 30 Hz eye tracker will display a poorer precision than a 300 Hz eye tracker as it will record larger displacement of the eyes. To ensure that our methodology can be applied to eye trackers with different sample rates, the data needs to be collected during a single fixation for a one second period (1000 ms), and both the RMS and
SDPrecision are calculated. However, single fixations may still include small eye movements such as microsaccades, tremor and drift (Martinez-Conde et al., 2004; Martinez Conde et al., 2006; Blignaut and Beelders, 2009), thus the tests include precision measurements using artificial eyes in addition to the tests conducted on human subjects. Using this method, it is possible to isolate the system and human errors (i.e. RMS precision, SD precision and artificial eye precision) and create a methodology that describes the precision of the system as a whole. These specifications can then be used to compare the performance of different eye trackers.
In our methodology the sample population is restricted to “suitable eye tracking individuals”, individuals with lenses, glasses and poor trackability are excluded from the tests. This restriction has two important consequences: the first one is that external, optical effects from lenses and glasses will not affect the outcome and cause large individual variations; secondly, it enables us to measure accuracy and precision more independently from tracking robustness. The inclusion of individuals exhibiting poor trackability leads to larger individual variation and data loss, causing the results of the tests to be heavily dependent on the composition of the sample populations, which in turn could make the comparison between different tests invalid or difficult. By choosing to restrict the sample population to “suitable eye tracking individuals”, it is ensured that there is minimum data loss during the measurements and that the composition of the population is more uniform, resulting in an easier to replicate method that produces comparable results between tests.
During the eye tracker calibration process the user is instructed to fixate on nine specific locations on the screen. The system then uses the subject’s gaze direction and the calibration point location to estimate the error and correct the gaze data mapping. Thus, for each calibration point the eye tracker “knows” the subject’s gaze direction. However, inside the areas located in between calibration points the gaze data mapping is dependent solely on the algorithm used to estimate the corrected gaze direction. As a result, these areas may potentially exhibit higher accuracy errors than the areas around the calibration points. A potential source of error that is not accounted for in this method is the effect of different screen sizes on the relative position between the calibration points and measurement points. The calibration is performed by presenting nine fixation points on a 3 x 3 full-screen grid; whereas the nine measurement points are displayed in a 3 x 3 ratio grid that is kept at a constant size irrespective of the screen size (refer to section 3.4.1). As a result, the relative distance between the calibration points and the measurement points will be different in different screen sizes. This problem can be solved by adjusting the calibration size area to match the area covered by the measurement. However, since many eye trackers do not allow such a change, and in order to avoid larger measurement differences that could be introduced by merely selectively adopting this correction, the default calibration for each eye tracking system is kept the same as the calibration procedure used in this method.

TestSpecification
20
4.1. Conclusion
This document presents a suitable methodology to test and compare the performance of different remote eye tracking systems. It outlines a series of extensive tests that identify and control for external parameters that illustrate the accuracy and precision of the system under different usage scenarios (e.g. subjects position in the track box, environmental light levels, and large gaze angles). And it provides detailed descriptions of the different measurements procedures and metrics used, to ensure that all tests can be replicated and easily interpreted.
To ease the process of data gathering and parsing, an open source software tool (Accuracy Test Tool) that collects the gaze data and performs the metrics calculations has also been introduced.
It is our hope that the development of a detailed specification methodology will allow an eye tracker user to understand the advantages and limitations of a particular eye tracking system, and to provide that user with a valid framework for comparison. This information can then in turn be utilized to design more effective and valid eye tracking experiments that are adequate to the system’s accuracy and precision performance.
5. References
Agustin, J.S., Villanueva, A., Cabeza, R. (2005) Pupil brightness variation as a function of gaze direction. Eye Tracking Research and Applications Symposium (ETRA, 2005), page 49.
Blignaut, P., Beelders, T. (2009) The effect of fixational eye movements on fixation identification with a dispersion-based fixation detection algorithm. Journal of eye movement research, 2 (5):4, pages 1-14.
Cui, Y., Hondzinski, J. (2005) Gaze tracking accuracy in humans: Two eyes are better than one. Neuroscience Letters 396, pages 257-262.
Holmqvist, K., Nyström, M., Andersson, R., Jarodzka, J., van de Weijer, J.(2011) Eye tracking data and dependent variables.
Hornof, A. J., Halverson, T., (2002) Cleaning up systematic error in eye tracking data by using required fixation locations. Behavior research method, Instruments and computers, Vol 34 (4), pages 592-604.
Johnson, J. S., Liu, L., Thomas G., Spencer, J. P. (2007) Calibration algorithm for eyetracking with unrestricted head movement. Behavior research methods, 39(1), pages 123-132.
Martinez-Conde S., Macknik, S. L., Hubel, D. H., (2004). The role of fixational eye movements in visual perception. Nature Reviews NeuroScience, Vol 5, pages 229-240.
Martinez-Conde S., Macknik, S. L., Troncoso, X. G., Dyar, D. A. (2006) Microsaccades Counteract Visual Fading during fixation. Neuron, Vol 49, Issue 6, page 929.
Nguyen, K., Wagner, C., Koons, D., Flickner, M. (2002) Differences in the infrared bright pupil responses of human eyes. Eye Tracking Research and Applications Symposium (ETRA 2002), pages 133-138.
Rayner, K., (1998) Eye movements in reading and information processing: 20 years of research. Psychological bulletin, Vol 124, No 3, pages 372-422.
Recarte, M. A., Nunes, L. M., (2000) Effects of verbal and spatial-imaginary tasks on eye fixations during driving. Journal of experimental psychology, Vol 6, No 1, pages 31-43.
Richard, C. B., Wico, L. W., Deepak, E. P. (2003) Racial and ethnic differences in ocular anatomy. International Opthalmology Clinics, Vol 43, 4, pages 9-25.
Zhang, Y., Hornof, A. J. (2010) Improvements to the accuracy of eye tracking data based on probable fixations. Department of CIS Technical Report 2010-04, University of Oregon http://ix.cs.uoregon.edu/~hornof/downloads/BRMIC_2010_submitted.pdf.
Zhu, Z. Fujimura, K., Ji, Q. (2002) Real-time eye detection and tracking under various light conditions. Proceedings of the 2002 symposium on Eye tracking research and applications, pages 139-144.

Accuracy and precision test method
21
Appendix 1 - Accuracy calculations

TestSpecification
22

Accuracy and precision test method
23
Appendix 2 - Precision calculations

TestSpecification
24
Appendix 3 - SD Precision calcula-tions

Accuracy and precision test method
25
Appendix 4 - Stimuli positioning cal-culations
Calculation to locate the point positions is performed as follows:
The distance l in millimeters between the center if the eye tracker’s sensor and the stimuli point with a gaze angle α is calculated as follows:
α°
Eye
METl
d
MET
l = d ∗ tan(α)
d is the theoretical distance between the tracked pair of eyes (center of track box) and the center of the eye tracker’s sensor (MET) given in millimeters and α is the gaze angle (<20° for ideal accuracy).
The corner positions of the 9 x 9 point stimuli are calculated using the ratio of the active display of the monitor used (r), taking into consideration the eye tracker offset.
w
h Active display
w is the width and h is the height of the active display of the screen in pixels.
r = wh
To calculate the positions of the stimuli points in pixels the following calculations have to be made:
b
a
f
l
MET
f is the offset between the center of the eye tracker’s sensor (MET) and the lower edge of the active display of the screen.
2arb ∗=
l2 = b2 + ( f + a )2
l2 = r *a2 + ( f + a )2
2
From the equation above, a needs to be extracted as it will be used in the calculations needed to specify the position of the gaze points in pixels below.
The size of a pixel in millimeters (p) for the screen used in the testing must be known to calculate the stimuli positions. This information can be calculated by knowing the width and height of the screen as well as the resolution used, but can sometimes also be found in the technical specifications for the monitor.
Origo in the coordinate system of the active display is defined as the top left corner of the display.
X positions:
x1= 2w -
2ar ∗
p
x2= 2w
x3= 2w +
2ar ∗
p
Y positions:
y1=h -2w
y2= h +2
a∗ p
-2
20∗ p
y3= h -
20p

TestSpecification
26

Accuracy and precision test method
27

www.tobii.com
© Tobii®. Illustrations and specifications do not necessarily apply to products and services offered in each local market. Technical specifications are subject to change without prior notice. All other trademarks are the property of their respective owners.
SWEDEN/GloBAlTobii Technology ABKarlsrovägen 2DBox 743S-182 17 Danderyd Sweden+46 8 663 69 90 Phone+46 8 30 14 00 [email protected]
CENTrAl EuroPETobii Technology GmbHNiedenau 45D-60325 Frankfurt am MainGermany+49 69 24 75 03 40 Phone+49 69 24 75 03 429 [email protected]
NorTh AMEriCATobii Technology, Inc.510 N. Washington StreetSuite 200 - Falls Church, VA 22046 - USA+1-703-738-1300 Phone+1-888-898-6244 Phone+1-703-738-1313 [email protected]
JAPANTobii Technology, Ltd.3-4-13 Takanawa, Minato-kuTokyo 108-0074Japan+81-3-5793-3316 Phone+81-3-5793-3317 [email protected]
ChiNATobii Electronics Technology Suzhou Co., LtdNo. 678, Fengting AvenueLand Industrial ParkWeiting, SuzhouPost code: 215122China+86 13585980539 [email protected]
SWEDEN/GloBAl +46 8 522 950 10 [email protected] hours: 9 am - 5 pm(Central European Time, GMT+1)
GErMANY+49 69 2475 034-27 [email protected] hours: 9 am - 5 pm(Central European Time, GMT+1)
NorTh AMEriCA+1 703 738 1320 [email protected] hours: 8 am - 5 pm(US Eastern Standard Time, GMT-6)
JAPAN+81-3-5793-3316 [email protected] hours: 9 am - 5.30 pm(GMT+9)
Tobii Support contact:
www.tobii.com