tobin's portfolio selection in macroeconomicsgrasselli/oberwolfach2014.pdf · 2014-05-07 ·...
TRANSCRIPT

Tobin’sportfolio
selection inmacroeco-nomics
M. R. Grasselli
Introduction
SFC models
The UltimateModel
Conclusions
Tobin’s portfolio selection in macroeconomics
M. R. Grasselli
Mathematics and Statistics - McMaster Universityand Fields Institute for Research in Mathematical Sciences
Oberwolfach, May 07, 2014

Tobin’sportfolio
selection inmacroeco-nomics
M. R. Grasselli
Introduction
SFC models
The UltimateModel
Conclusions
James Tobin’s contributions to economics
Tobin received the 1981 Nobel Memorial Prize “for hisanalysis of financial markets and their relations toexpenditure decisions, employment, production andprices”.
Well-known contributions included: foundations of modernportfolio theory (with Markowitz), in particular theSeparation Theorem (1958), life-cycle model ofconsumption, Tobit estimator, Tobin’s q, Tobin’s tax, . . .
Key forgotten contribution: financial intermediation,portfolio balances, flow of funds models and the creditchannel.

Tobin’sportfolio
selection inmacroeco-nomics
M. R. Grasselli
Introduction
SFC models
The UltimateModel
Conclusions
Tobin 1969: A General Equilibrium Approach toMonetary Theory
Specification of (i) a menu of assets, (ii) the factors thatdetermine the demands and supplies of the various assets,and (iii) the manner in which asset prices and interestrates clear these interrelated markets.
Spending decisions are independent from portfoliodecisions.
Each asset i has a rate of return ri and each sector j has anet demand fij for asset i .
Adding up constraint: for each rate of return rk ,
n∑i=1
∂fij∂rk
= 0.
Paper proceeds to analyze several special cases:money-capital, money-treasuries-capital, bank depositsand loans.

Tobin’sportfolio
selection inmacroeco-nomics
M. R. Grasselli
Introduction
SFC models
Goodwin model
Keen model
The UltimateModel
Conclusions
Stock-Flow Consistent models
Stock-flow consistent models emerged in the last decadeas a common language for many heterodox schools ofthought in economics.
They consider both real and monetary factorssimultaneously.
Specify the balance sheet and transactions betweensectors.
Accommodate a number of behavioural assumptions in away that is consistent with the underlying accountingstructure.
Reject silly (and mathematically unsound!) hypothesessuch as the RARE individual (representative agent withrational expectations).
See Godley and Lavoie (2007) for the full framework.

Tobin’sportfolio
selection inmacroeco-nomics
M. R. Grasselli
Introduction
SFC models
Goodwin model
Keen model
The UltimateModel
Conclusions
Balance Sheets
Balance Sheet HouseholdsFirms
Banks Central Bank Government Sum
current capital
Cash +Hh +Hb −H 0
Deposits +Mh +Mf −M 0
Loans −L +L 0
Bills +Bh +Bb +Bc −B 0
Equities +pf Ef + pbEb −pf Ef −pbEb 0
Advances −A +A 0
Capital +pK pK
Sum (net worth) Vh 0 Vf Vb 0 −B pK
Table: Balance sheet in an example of a general SFC model.

Tobin’sportfolio
selection inmacroeco-nomics
M. R. Grasselli
Introduction
SFC models
Goodwin model
Keen model
The UltimateModel
Conclusions
Transactions
TransactionsHouseholds
FirmsBanks Central Bank Government Sum
current capital
Consumption −pCh +pC −pCb 0
Investment +pI −pI 0
Gov spending +pG −pG 0
Acct memo [GDP] [pY ]
Wages +W −W 0
Taxes −Th −Tf +T 0
Interest on deposits +rM .Mh +rM .Mf −rM .M 0
Interest on loans −rL.L +rL.L 0
Interest on bills +rB .Bh +rB .Bb +rB .Bc −rB .B 0
Profits +Πd + Πb −Π +Πu −Πb −Πc +Πc 0
Sum Sh 0 Sf − pI Sb 0 Sg 0
Table: Transactions in an example of a general SFC model.

Tobin’sportfolio
selection inmacroeco-nomics
M. R. Grasselli
Introduction
SFC models
Goodwin model
Keen model
The UltimateModel
Conclusions
Flow of Funds
Flow of FundsHouseholds
FirmsBanks Central Bank Government Sum
current capital
Cash +Hh +Hb −H 0
Deposits +Mh +Mf −M 0
Loans −L +L 0
Bills +Bh +Bb +Bc −B 0
Equities +pf Ef + pbEb −pf Ef −pbEb 0
Advances −A +A 0
Capital +pI pI
Sum Sh 0 Sf Sb 0 Sg pI
Change in Net Worth (Sh + pf Ef + pbEb) (Sf − pf Ef + pK − pδK ) (Sb − pbEb) Sg pK + pK
Table: Flow of funds in an example of a general SFC model.

Tobin’sportfolio
selection inmacroeco-nomics
M. R. Grasselli
Introduction
SFC models
Goodwin model
Keen model
The UltimateModel
Conclusions
Goodwin Model - SFC matrix
Balance Sheet HouseholdsFirms
Sum
current capital
Capital +pK pK
Sum (net worth) 0 0 Vf pK
Transactions
Consumption −pC +pC 0
Investment +pI −pI 0
Acct memo [GDP] [pY ]
Wages +W −W 0
Profits −Π +Πu 0
Sum 0 0 0 0
Flow of Funds
Capital +pI pI
Sum 0 0 Πu pI
Change in Net Worth 0 pI + pK − pδK pK + pK
Table: SFC table for the Goodwin model.

Tobin’sportfolio
selection inmacroeco-nomics
M. R. Grasselli
Introduction
SFC models
Goodwin model
Keen model
The UltimateModel
Conclusions
Goodwin Model - Differential equations
Define
ω =w`
pY=
w
pa(wage share)
λ =`
N=
Y
aN(employment rate)
It then follows that
ω
ω=
w
w− p
p− a
a= Φ(λ, i , ie) − i − α
λ
λ=
1 − ω
ν− α− β − δ
In the original model, all quantities were real (i.e dividedby p), which is equivalent to setting i = ie = 0.

Tobin’sportfolio
selection inmacroeco-nomics
M. R. Grasselli
Introduction
SFC models
Goodwin model
Keen model
The UltimateModel
Conclusions
Example 1: Goodwin model
0.7 0.75 0.8 0.85 0.9 0.95 10.88
0.9
0.92
0.94
0.96
0.98
1
ω
λw
0 = 0.8, λ
0 = 0.9

Tobin’sportfolio
selection inmacroeco-nomics
M. R. Grasselli
Introduction
SFC models
Goodwin model
Keen model
The UltimateModel
Conclusions
Testing Goodwin on OECD countries
Figure: Harvie (2000)

Tobin’sportfolio
selection inmacroeco-nomics
M. R. Grasselli
Introduction
SFC models
Goodwin model
Keen model
The UltimateModel
Conclusions
Correcting Harvie
Figure: Grasselli and Maheshwari (2014, in progress)

Tobin’sportfolio
selection inmacroeco-nomics
M. R. Grasselli
Introduction
SFC models
Goodwin model
Keen model
The UltimateModel
Conclusions
SFC table for Keen (1995) model
Balance Sheet HouseholdsFirms
Banks Sum
current capital
Deposits +D −D 0
Loans −L +L 0
Capital +pK pK
Sum (net worth) Vh 0 Vf 0 pK
Transactions
Consumption −pC +pC 0
Investment +pI −pI 0
Acct memo [GDP] [pY ]
Wages +W −W 0
Interest on deposits +rD −rD 0
Interest on loans −rL +rL 0
Profits −Π +Πu 0
Sum Sh 0 Sf − pI 0 0
Flow of Funds
Deposits +D −D 0
Loans −L +L 0
Capital +pI pI
Sum Sh 0 Πu 0 pI
Change in Net Worth Sh (Sf + pK − pδK ) pK + pK
Table: SFC table for the Keen model.

Tobin’sportfolio
selection inmacroeco-nomics
M. R. Grasselli
Introduction
SFC models
Goodwin model
Keen model
The UltimateModel
Conclusions
Keen model - Investment function
Assume now that new investment is given by
K = κ(1 − ω − rd)Y − δK
where κ(·) is a nonlinear increasing function of profitsπ = 1 − ω − rd .
This leads to external financing through debt evolvingaccording to
D = κ(1 − ω − rd)Y − (1 − ω − rd)Y

Tobin’sportfolio
selection inmacroeco-nomics
M. R. Grasselli
Introduction
SFC models
Goodwin model
Keen model
The UltimateModel
Conclusions
Keen model - Differential Equations
Denote the debt ratio in the economy by d = D/Y , the modelcan now be described by the following system
ω = ω [Φ(λ) − α]
λ = λ
[κ(1 − ω − rd)
ν− α− β − δ
](1)
d = d
[r − κ(1 − ω − rd)
ν+ δ
]+ κ(1 − ω − rd) − (1 − ω)

Tobin’sportfolio
selection inmacroeco-nomics
M. R. Grasselli
Introduction
SFC models
Goodwin model
Keen model
The UltimateModel
Conclusions
Example 2: convergence to the good equilibrium ina Keen model
0.7
0.75
0.8
0.85
0.9
0.95
1
λ
ωλYd
0
1
2
3
4
5
6
7
8x 10
7
Y
0
0.2
0.4
0.6
0.8
1
1.2
1.4
1.6
1.8
2
d
0 50 100 150 200 250 300
0.7
0.8
0.9
1
1.1
1.2
1.3
time
ω
ω0 = 0.75, λ
0 = 0.75, d
0 = 0.1, Y
0 = 100
d
λ
ω
Y
Figure: Grasselli and Costa Lima (2012)
Tobin’sportfolio
selection inmacroeco-nomics
M. R. Grasselli
Introduction
SFC models
Goodwin model
Keen model
The UltimateModel
Conclusions
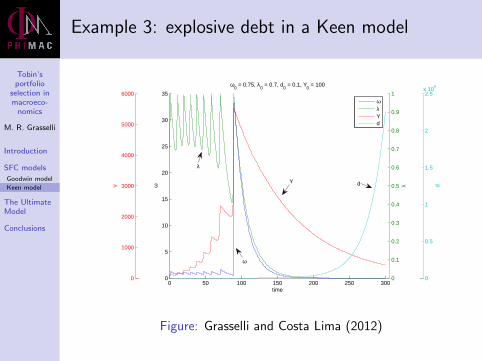
Example 3: explosive debt in a Keen model
0
0.1
0.2
0.3
0.4
0.5
0.6
0.7
0.8
0.9
1
λ
0
1000
2000
3000
4000
5000
6000
Y
0
0.5
1
1.5
2
2.5x 10
6
d
0 50 100 150 200 250 3000
5
10
15
20
25
30
35
time
ω
ω0 = 0.75, λ
0 = 0.7, d
0 = 0.1, Y
0 = 100
ωλYd
λ
Y d
ω
Figure: Grasselli and Costa Lima (2012)

Tobin’sportfolio
selection inmacroeco-nomics
M. R. Grasselli
Introduction
SFC models
Goodwin model
Keen model
The UltimateModel
Conclusions
Basin of convergence for Keen model
0.5
1
1.5
0.40.5
0.60.7
0.80.9
11.1
0
2
4
6
8
10
ωλ
d
Figure: Grasselli and Costa Lima (2012)

Tobin’sportfolio
selection inmacroeco-nomics
M. R. Grasselli
Introduction
SFC models
Goodwin model
Keen model
The UltimateModel
Conclusions
Extensions
Costa Lima and Nguyen (2014) add random productivityto the Goodwin model and prove the existence ofstochastic orbits for the generalized Lotka-Volterra system.
Costa Lima, Grasselli, Wang and Wu (2014) show thatgovernment spending and taxation can prevent the badequilibrium with infinite debt and zero employment.
Choi and Grasselli (2014, in progress) characterize theGreat Moderation in the U.S. as a Shilnikov bifurcation forthe Keen model.

Tobin’sportfolio
selection inmacroeco-nomics
M. R. Grasselli
Introduction
SFC models
The UltimateModel
Inventories
Equities
Conclusions
Shortcomings of Goodwin and Keen models
No independent specification of consumption (andtherefore savings) for households:
C = W , Sh = 0 (Goodwin)
C = (1 − κ(π))Y , Sh = D = Πu − I (Keen)
Full capacity utilization.
Everything that is produced is sold.
No active market for equities.
Skott (1989) uses prices as an accommodating variable inthe short run.
Chiarella, Flaschel and Franke (2005) propose a dynamicsfor inventory and expected sales.
Grasselli and Nguyen (2014) provide a synthesis, includingequities and Tobin’s portfolio choices.

Tobin’sportfolio
selection inmacroeco-nomics
M. R. Grasselli
Introduction
SFC models
The UltimateModel
Inventories
Equities
Conclusions
Inventory dynamics
Denoting demand by Yd , expected sales by Ye andcapacity utilization by u = Y /Ymax we obtain the system
ωe =ωe [Φ(λ) − α + (1 − ηp)γ(1 −mωe)]
λ =λ [geye + gdyd − ηv − α− β]
de =de[− geye − gdyd + ηv + γ(1 −mωe) + r
]+
[κ(πe) + ηu(u − u)
u− (1 − ωe)yd
]ye =ye(α + β − ηd − geye − gdyd + ηv ) + ηdyd
u =u
[geye + gdyd − ηv −
κ(πe) + ηu(u − u)
ν+ δ
],
of which the previous model is a special case.

Tobin’sportfolio
selection inmacroeco-nomics
M. R. Grasselli
Introduction
SFC models
The UltimateModel
Inventories
Equities
Conclusions
Firm decisions
Suppose now that firms finance new investment by issuingequities E at price pe as well as new loans.
Assuming that undistributed profits take the form sf Π fora constant sf , the amount needed to be raised externallyfor new investment is pIk − sf Π, according to theproportions
D = νD [pIk − sf Π]
pe E = νE [pIk − sf Π],
with νD + νE = 1.
Here both Ik and νE can be functions of Tobin’s q = peEpK .

Tobin’sportfolio
selection inmacroeco-nomics
M. R. Grasselli
Introduction
SFC models
The UltimateModel
Inventories
Equities
Conclusions
Household decisions
On the other hand, the budget constraint for households is
W + (1 − sf )Π + rD = pC + D + pe E ,
whereas their portfolio allocation is
peE = fe(r ee )Xh
D = 1 − fe(r ee )Xh,
where
r ee =(1 − sf )Π
peE+ πee
πee = βπe
(pepe
− πee
)This leads to an extended system with two more equationsfor e/e and πee .

Tobin’sportfolio
selection inmacroeco-nomics
M. R. Grasselli
Introduction
SFC models
The UltimateModel
Conclusions
Concluding remarks
Macroeconomics is too important to be left tomacroeconomists.
Since Keynes’s death it has developed in two radicallydifferent approaches:
1 The dominant one has the appearance of mathematicalrigour (the SMD theorems notwithstanding), but is basedon implausible assumptions, has poor fit to data in general,and is disastrously wrong during crises. Finance plays anegligible role
2 The heterodox approach is grounded in history andinstitutional understanding, takes empirical work muchmore seriously, but is generally averse to mathematics.Finance plays a major role.
It’s clear which approach should be embraced bymathematical finance.