today: quizz 8 friday: glm review monday: exam 2
TRANSCRIPT

Today: Quizz 8
Friday: GLM review
Monday: Exam 2

Part IVThe General Linear Model
Multiple Explanatory Variables
Chapter 14 ANCOVA
1 categorical, 1 continuous

Analysis of covariance: 1 categorical 1 continuous
2 different analysis:1. comparison of 2 regression slopes
Ch 14.1
2. Statistical control for a continuous variable within an ANOVA design
Ch 14.2
ANCOVA

Part IVThe General Linear Model
Multiple Explanatory Variables
Chapter 14.1 ANCOVA
Comparison of slopes

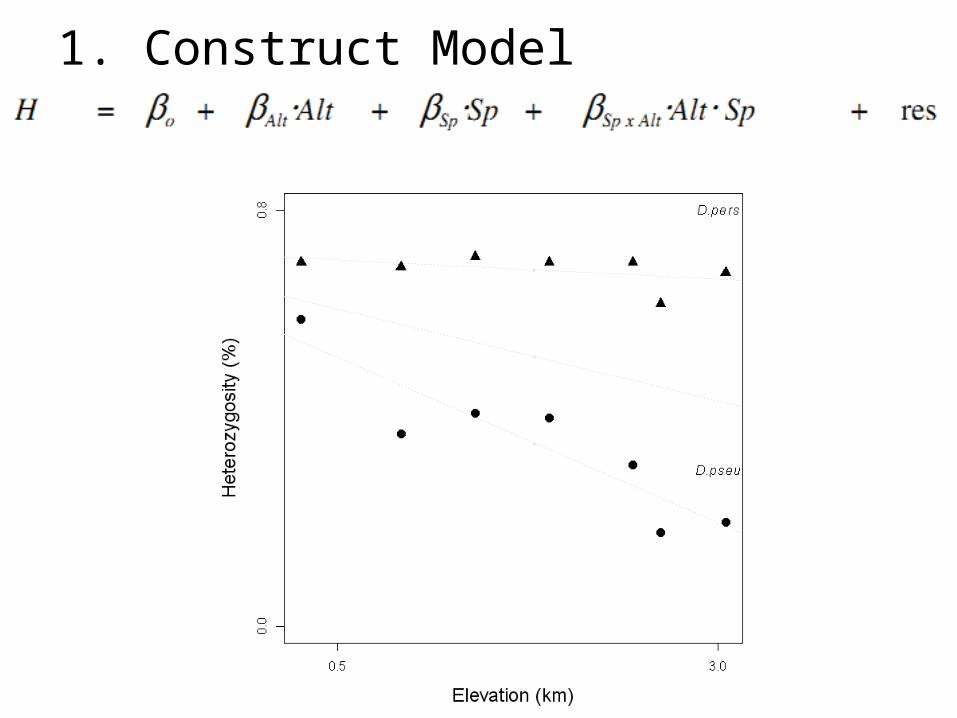
Heterozygosity (H) of fruit flies from Yosemite Park, Dobzhansky’s investigations
H is a measure of genetic variability
Altitude = harsh environment
Does genetic variability decrease at higher altitudes, due to stronger selection in extreme environments?
GLM | ANCOVA
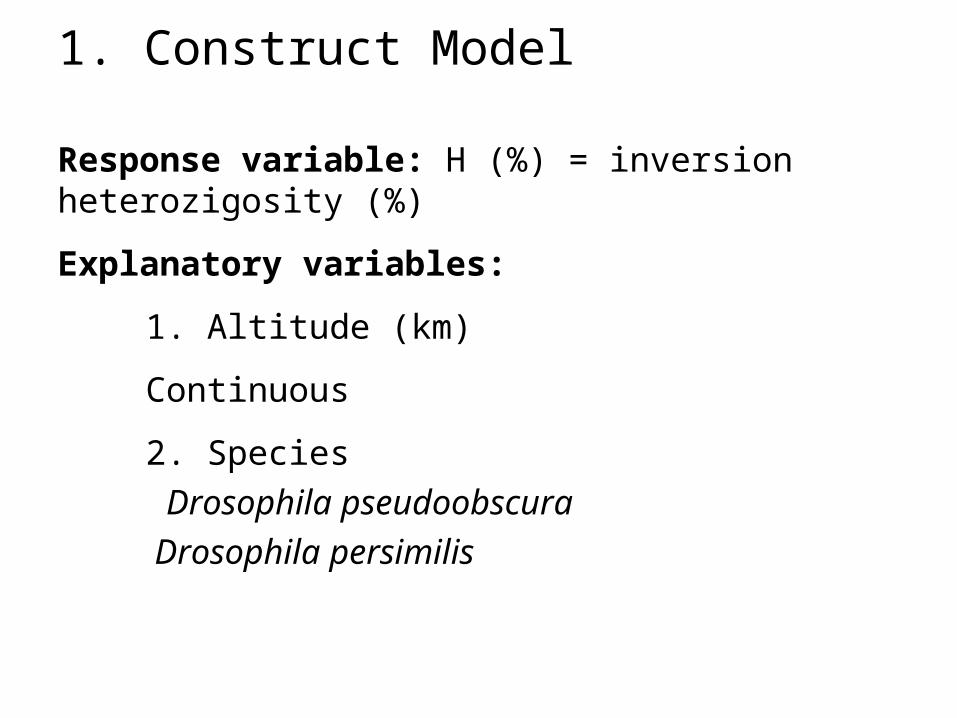
1. Construct Model
Response variable: H (%) = inversion heterozigosity (%)
Explanatory variables:
1. Altitude (km)
Continuous
2. Species Drosophila pseudoobscura Drosophila persimilis
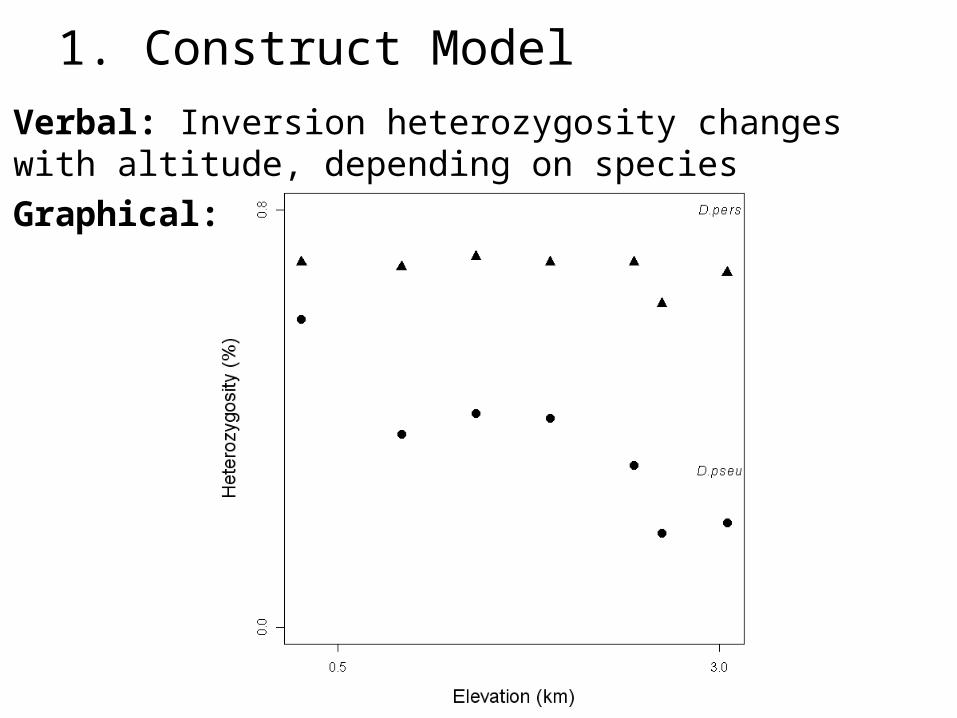
Verbal: Inversion heterozygosity changes with altitude, depending on speciesGraphical:
1. Construct Model
1. Construct Model
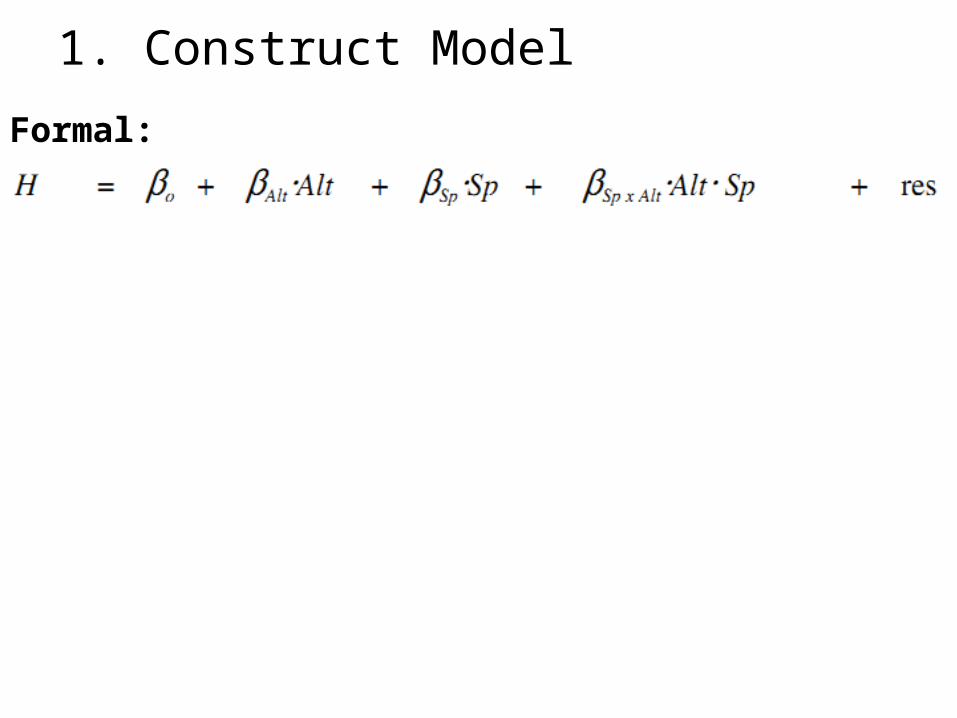
Formal:
1. Construct Model

2. Execute analysis
Data in model format
lm1 <- lm(H~Alt+Sp+Alt*Sp, data=dros)
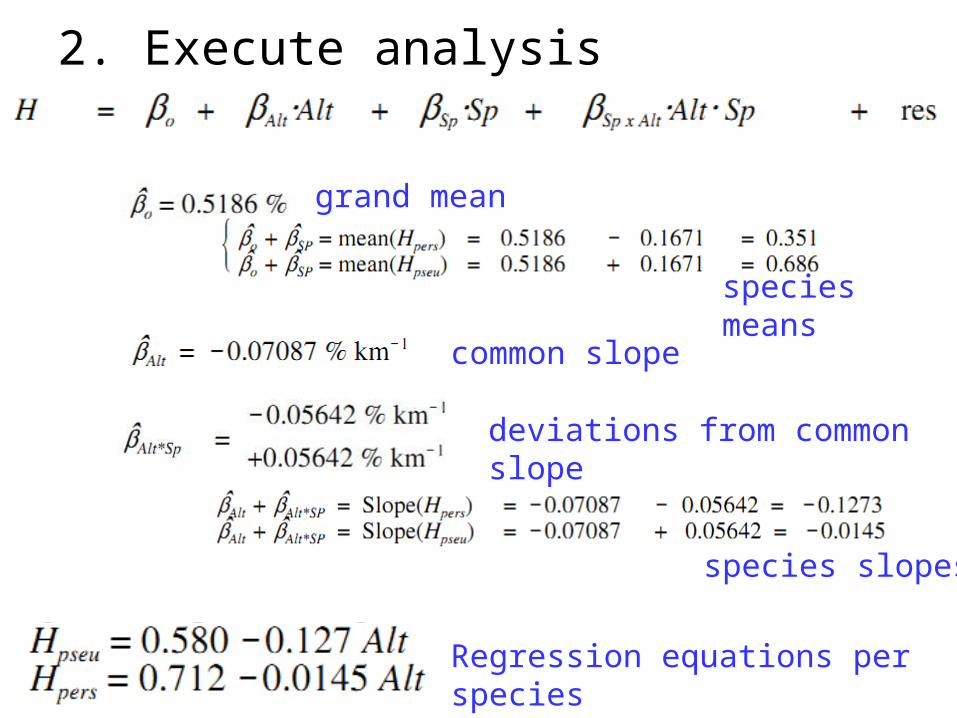
2. Execute analysis
grand mean
species means
common slope
deviations from common slope
species slopes
Regression equations per species
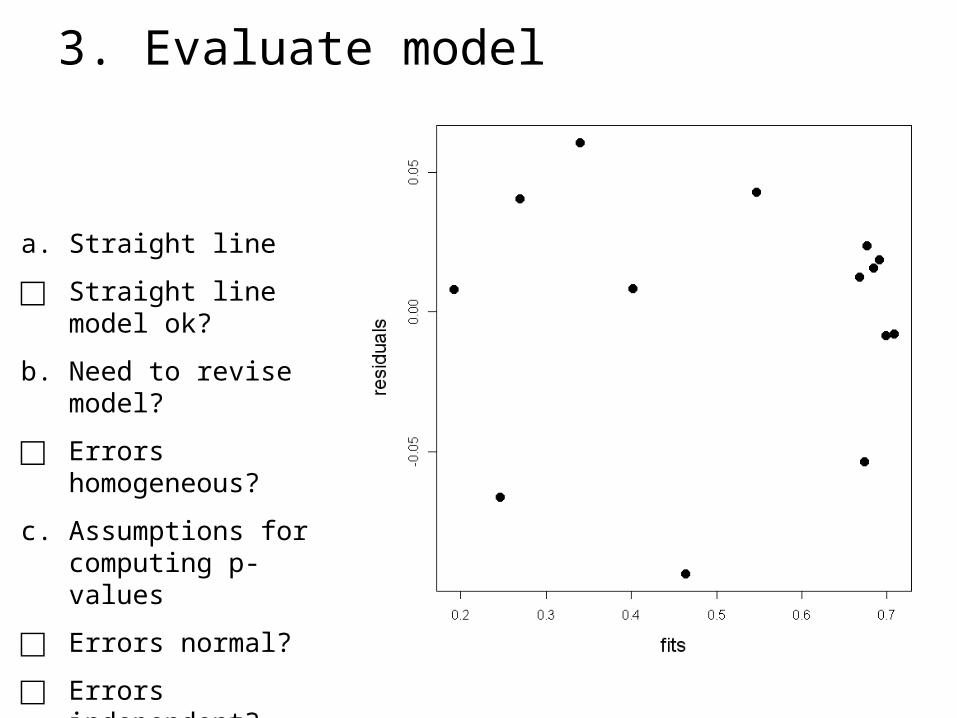
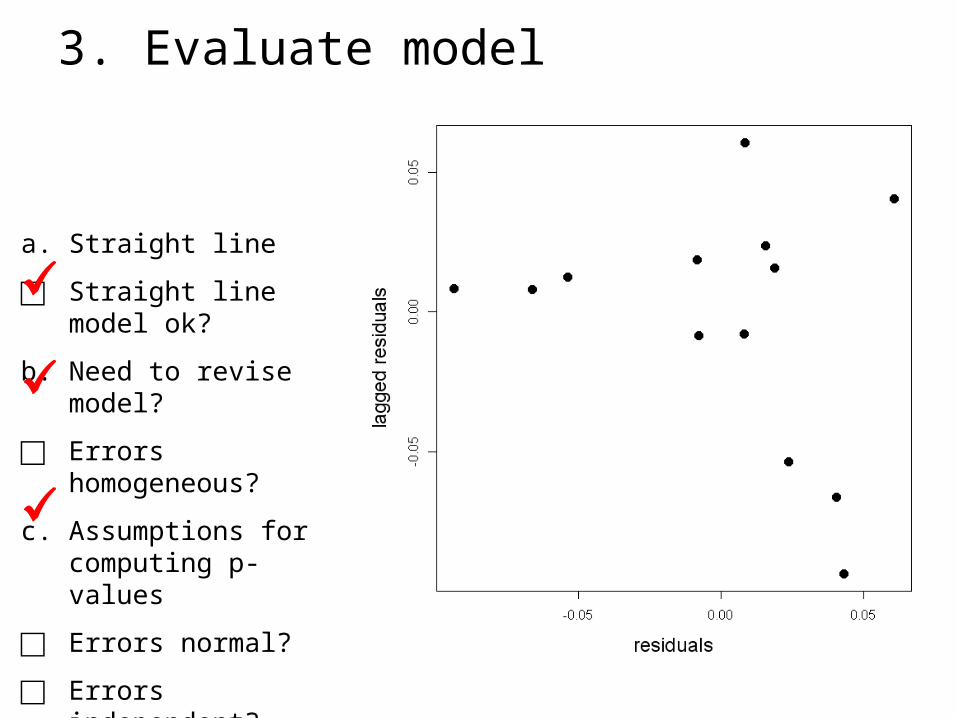
3. Evaluate model
a. Straight line
□ Straight line model ok?
b. Need to revise model?
□ Errors homogeneous?
c. Assumptions for computing p-values
□ Errors normal?
□ Errors independent?
a. Straight line
□ Straight line model ok?
b. Need to revise model?
□ Errors homogeneous?
c. Assumptions for computing p-values
□ Errors normal?
□ Errors independent?
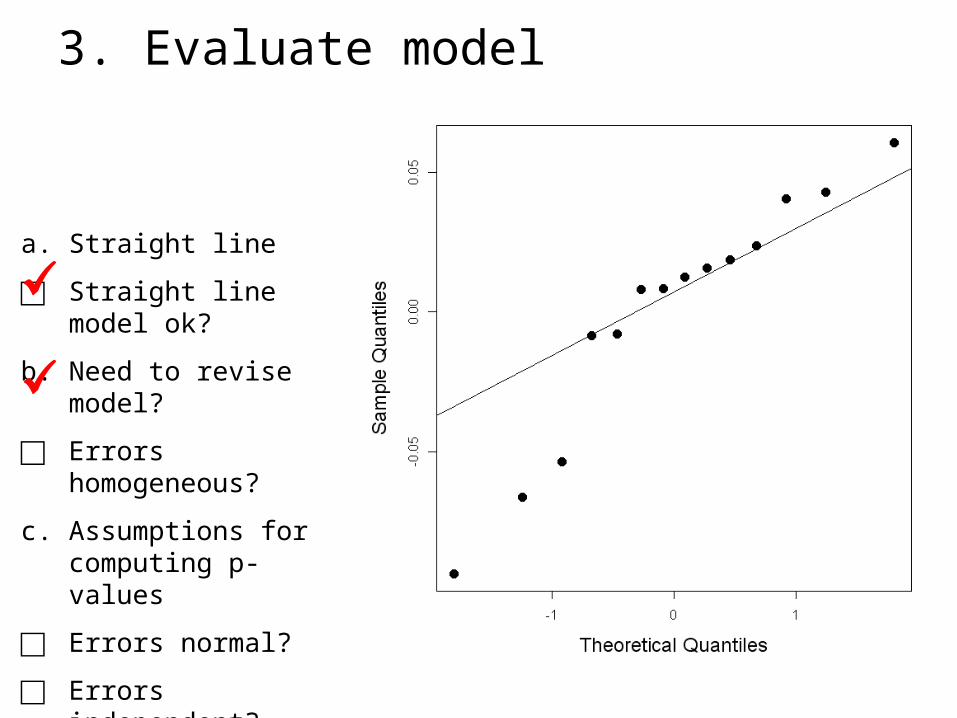
3. Evaluate model
3. Evaluate model
a. Straight line
□ Straight line model ok?
b. Need to revise model?
□ Errors homogeneous?
c. Assumptions for computing p-values
□ Errors normal?
□ Errors independent?

4. State the population and whether the sample is representative.
Not enough information about how flies were collected
All measurements that could have been obtained on this collection of flies, given the procedural statement

5. Decide on mode of inference. Is hypothesis testing appropriate?
6. State HA / Ho pair, test statistic, distribution, tolerance for Type I error.
Interaction Term:
Are the gradients in heterozigosity equal between species?
Is there variance due to the interaction term?

State HA / Ho pair, test statistic, distribution, tolerance for Type I error.
Species Term:
Does the mean heterozigosity for D. persimilis differ from that of D. pseudoobscura?

State HA / Ho pair, test statistic, distribution, tolerance for Type I error.
Altitude Term:
Is the slope less than zero?
More specific hypotheses?

6. State HA / Ho pair, test statistic, distribution, tolerance for Type I error.
Test Statistic
Distribution of test statitstic
Tolerance for Type I error
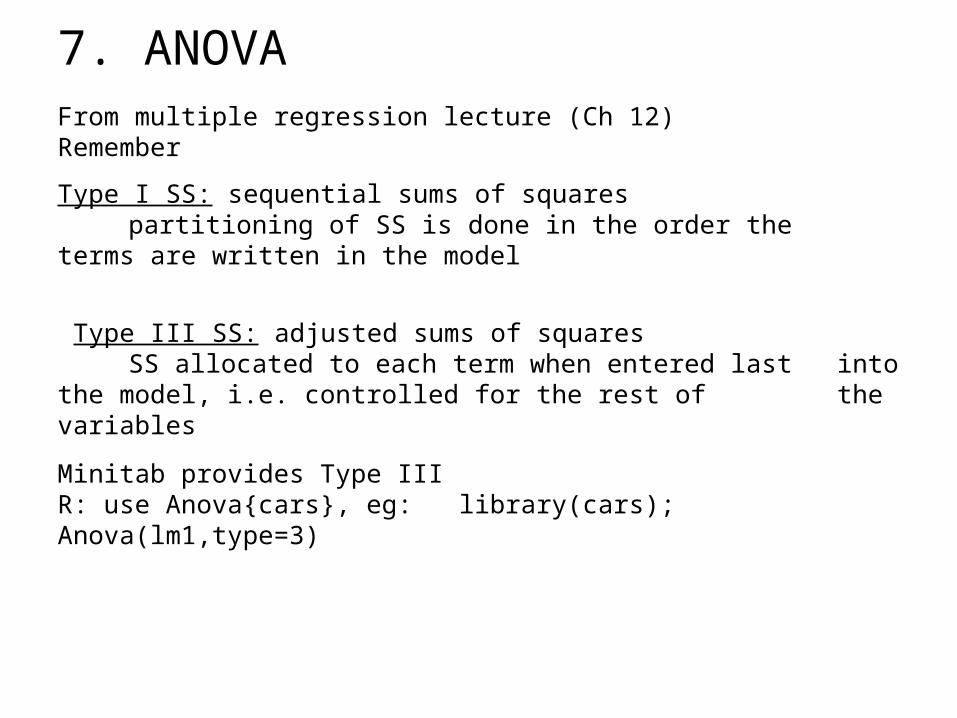
7. ANOVAFrom multiple regression lecture (Ch 12)Remember
Type I SS: sequential sums of squarespartitioning of SS is done in the order the
terms are written in the model
Type III SS: adjusted sums of squaresSS allocated to each term when entered last
into the model, i.e. controlled for the rest of the variables
Minitab provides Type IIIR: use Anova{cars}, eg: library(cars); Anova(lm1,type=3)
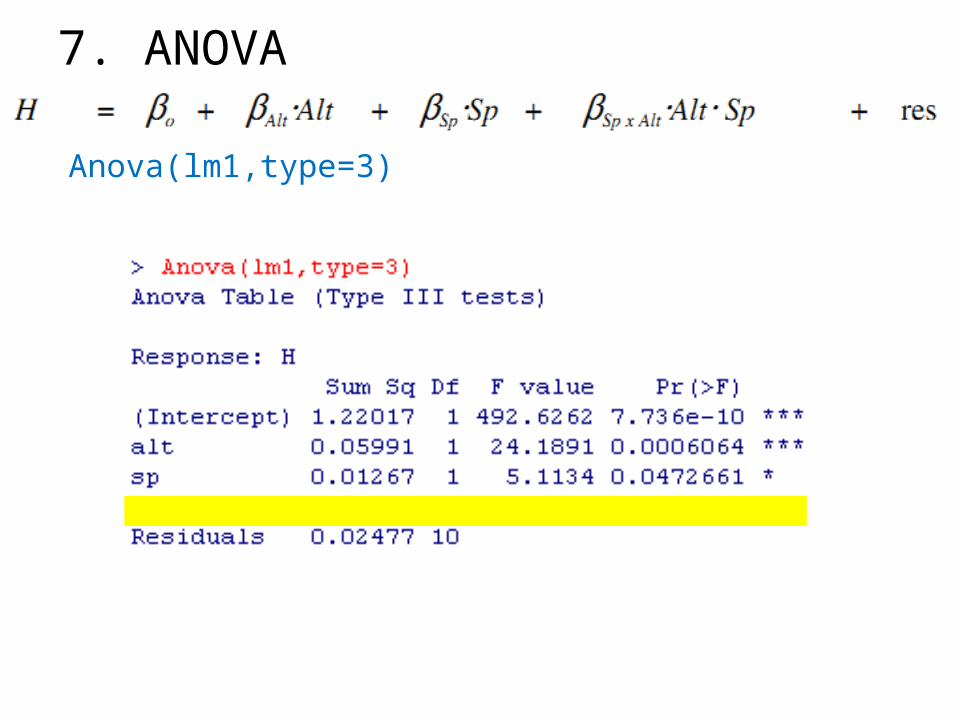
7. ANOVA
Anova(lm1,type=3)

8. Decide whether to recompute p-valueAssumptions met, skip step
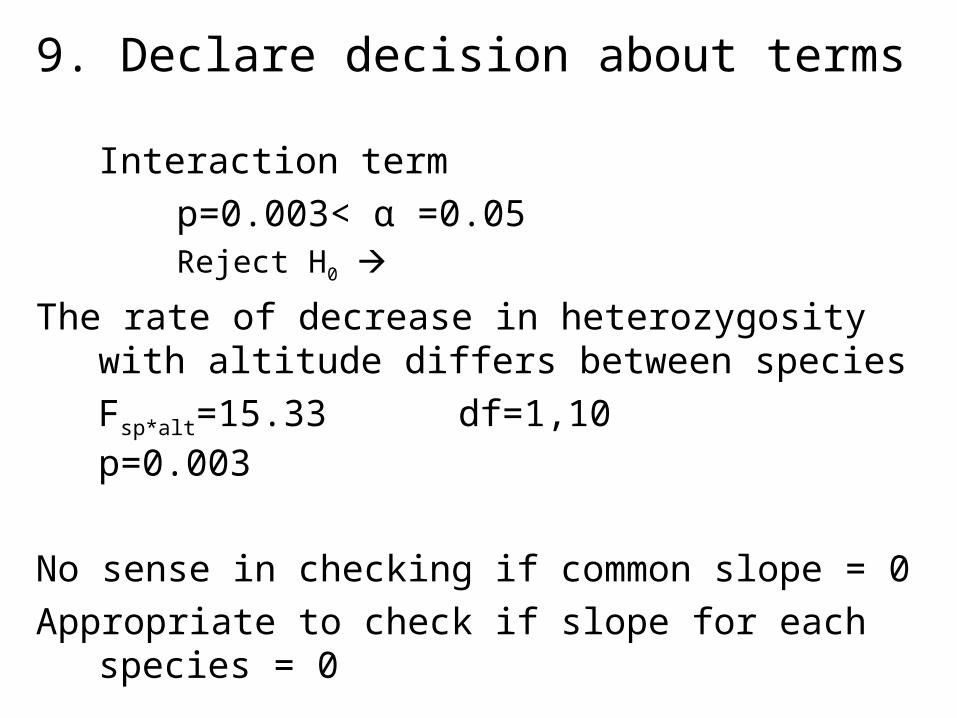
9. Declare decision about terms
Interaction term p=0.003< α =0.05Reject H0
The rate of decrease in heterozygosity with altitude differs between species
Fsp*alt=15.33 df=1,10 p=0.003
No sense in checking if common slope = 0Appropriate to check if slope for each species = 0

10. Report and interpret parameters of biological interest
Let’s examine species separately
D. persimilis
H = 0.58 – 0.127 Alt
D. pseudoobscura
No Δ with Altmean(Hpseu) = 68.6 %

Part IVThe General Linear Model
Multiple Explanatory Variables
Chapter 14.2 ANCOVA
Statistical control
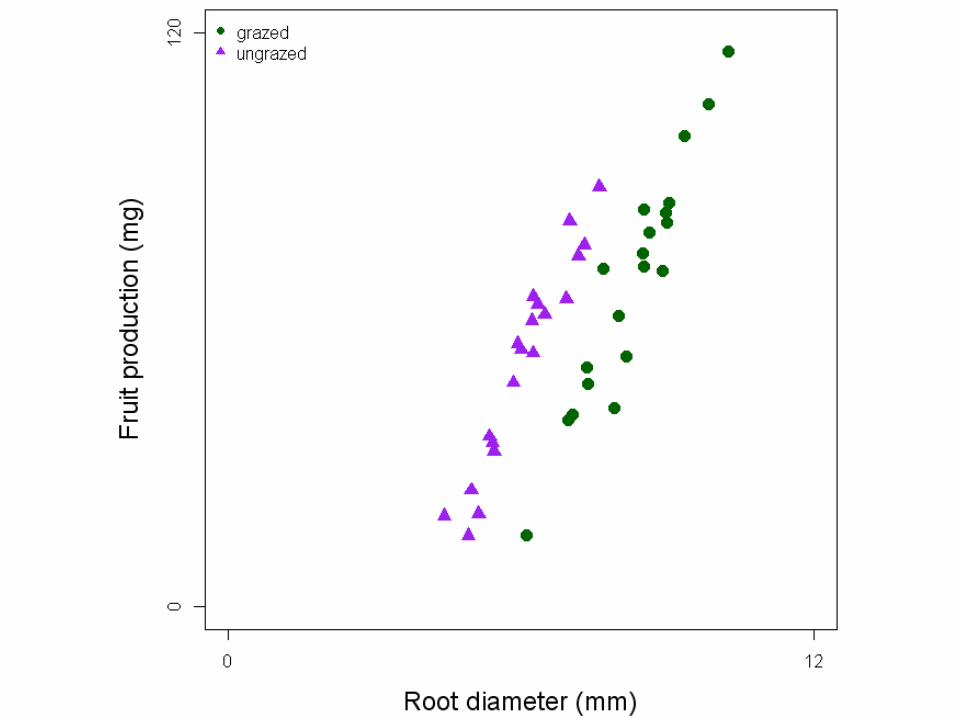
Crawley 1993
Response variable: Fruit production (mg)
Explanatory variables:
1. Plant size (root diameter)
2. Grazed? Yes OR No
We are interested in the effect of grazing on fruit production, controlled for the effect of plant size
GLM | ANCOVA