today was a good day: the daily life of software developers · pre-print ieee transactions on...
TRANSCRIPT

Zurich Open Repository andArchiveUniversity of ZurichMain LibraryStrickhofstrasse 39CH-8057 Zurichwww.zora.uzh.ch
Year: 2019
Today was a Good Day: The Daily Life of Software Developers
Meyer, André <javascript:contributorCitation( ’Meyer, André’ );>; Barr, Earl T<javascript:contributorCitation( ’Barr, Earl T’ );>; Bird, Christian <javascript:contributorCitation(
’Bird, Christian’ );>; Zimmermann, Thomas <javascript:contributorCitation( ’Zimmermann, Thomas’);>
Abstract: What is a good workday for a software developer? What is a typical workday? We seek to an-swer these two questions to learn how to make good days typical. Concretely, answering these questionswill help to optimize development processes and select tools that increase job satisfaction and productiv-ity. Our work adds to a large body of research on how software developers spend their time. We reportthe results from 5971 responses of professional developers at Microsoft, who reflected about what madetheir workdays good and typical, and self-reported about how they spent their time on various activitiesat work. We developed conceptual frameworks to help define and characterize developer workdays fromtwo new perspectives: good and typical. Our analysis confirms some findings in previous work, includingthe fact that developers actually spend little time on development and developers’ aversion for meetingsand interruptions. It also discovered new findings, such as that only 1.7% of survey responses mentionedemails as a reason for a bad workday, and that meetings and interruptions are only unproductive duringdevelopment phases; during phases of planning, specification and release, they are common and construc-tive. One key finding is the importance of agency, developers’ control over their workday and whetherit goes as planned or is disrupted by external factors. We present actionable recommendations for re-searchers and managers to prioritize process and tool improvements that make good workdays typical.For instance, in light of our finding on the importance of agency, we recommend that, where possible,managers empower developers to choose their tools and tasks.
DOI: https://doi.org/10.1109/TSE.2019.2904957
Posted at the Zurich Open Repository and Archive, University of ZurichZORA URL: https://doi.org/10.5167/uzh-170375Journal ArticleAccepted Version
Originally published at:Meyer, André; Barr, Earl T; Bird, Christian; Zimmermann, Thomas (2019). Today was a Good Day:The Daily Life of Software Developers. IEEE transactions on software engineering:Epub ahead of print.DOI: https://doi.org/10.1109/TSE.2019.2904957

PRE-PRINTIEEE TRANSACTIONS ON SOFTWARE ENGINEERING 1
Today was a Good Day:The Daily Life of Software Developers
Andre N. Meyer, Earl T. Barr, Christian Bird, Member, IEEE, and Thomas Zimmermann, Member, IEEE
Abstract—What is a good workday for a software developer? What is a typical workday? We seek to answer these two questions to learnhow to make good days typical. Concretely, answering these questions will help to optimize development processes and select tools thatincrease job satisfaction and productivity. Our work adds to a large body of research on how software developers spend their time. Wereport the results from 5971 responses of professional developers at Microsoft, who reflected about what made their workdays good andtypical, and self-reported about how they spent their time on various activities at work. We developed conceptual frameworks to helpdefine and characterize developer workdays from two new perspectives: good and typical. Our analysis confirms some findings inprevious work, including the fact that developers actually spend little time on development and developers’ aversion for meetings andinterruptions. It also discovered new findings, such as that only 1.7% of survey responses mentioned emails as a reason for a badworkday, and that meetings and interruptions are only unproductive during development phases; during phases of planning, specificationand release, they are common and constructive. One key finding is the importance of agency, developers’ control over their workday andwhether it goes as planned or is disrupted by external factors. We present actionable recommendations for researchers and managers toprioritize process and tool improvements that make good workdays typical. For instance, in light of our finding on the importance ofagency, we recommend that, where possible, managers empower developers to choose their tools and tasks.
Index Terms—Software Developer Workdays, Productivity, Job Satisfaction, Good Workdays, Typical Workdays, Quantified Workplace.
F
1 INTRODUCTION
Satisfied developers are more productive and write bettercode [1], [2], [3], [4]. Good workdays increase developerjob satisfaction [5]. Understanding what differentiates goodworkdays from other days, especially atypical days, willhelp us make good days typical. This work seeks just thisunderstanding. Understanding typical and atypical work-days will enable us to establish a baseline for comparisonwith other developer workdays and make more informeddecisions about process improvements.
Development is a multistage process with complicatedinteractions across the stages. These interactions mean thatwe cannot consider each stage in isolation, but need considerthe process as a whole. We need a holistic understanding ofhow software developers spend their time at work. Withouta holistic understanding, one might think that developers,because they “develop”, spend most of their time writingcode. However, developers spend surprisingly little timewith coding, 9% to 61% depending on the study [6], [7], [8],[9], [10], [11], [12]. Instead, they spend most of their timecollecting the information they need to fulfill developmenttasks through meetings, reading documentation or websearches, helping co-workers, and fulfilling administrativeduties. The conventional wisdom is that email is a bigsource of distraction and frustration. We show that, to thecontrary, email activity has little effect on a workday’sperceived goodness (Section 5.1). Hence, focusing just onone development activity can miss important opportunitiesfor productivity improvements.
• A.N. Meyer is with the Department of Informatics, University of Zurich.E-mail: [email protected].
• E. Barr is with the University College London. E-mail: [email protected].• C. Bird and T. Zimmermann are with Microsoft Research. E-mail:
[email protected], [email protected].
Manuscript submitted August 8, 2018. Revised February 11, 2019. AcceptedMarch 8, 2019.
We have therefore set out to better understand how tomake good days typical to increase developer job satisfactionand productivity. Since a review of existing research revealedno work that attempted to define or quantify what a goodand typical developer workday is, we studied developers’workdays from these two new perspectives 1. We conducteda large-scale survey at Microsoft and asked professionalsoftware developers whether they consider their previousworkday to be good and typical, and related their answersand reflections to their self-reports of the time spent ondifferent activities at work. From now on, when we describegood and typical developer workdays, we refer to developers’self-reports; we discuss the validity of this method inSection 4.3. We received 5971 responses from professionalsoftware developers across a four month period. From theseresponses, we developed two conceptual frameworks tocharacterize developers’ good and typical workdays. Whenwe quantitatively analyzed the collected data, we found thattwo main activities compete for developers’ attention andtime at work: their main coding tasks and collaborativeactivities. On workdays that developers consider good(60.6%) and typical (64.2%), they manage to find a balancebetween these two activities. This highlights the importanceof agency, one of our key findings that describes developers’ability to control their workdays, and how much they arerandomized by external factors such as unplanned bugs,inefficient meetings, infrastructure issues.
Our work provides researchers and practitioners witha holistic perspective on factors that influence developers’workdays, job satisfaction and productivity. In the paper,we discuss five main recommendations for managers tomake good workdays typical. Overall, it is important to
1. We intentionally do not list our own definitions of good and typicalworkdays since one aim of this work is to understand the characteristicsof these workdays, and how developers assess and define them.
PRE-PRINTIEEE TRANSACTIONS ON SOFTWARE ENGINEERING 2
remove and reduce obstacles that block developers fromcreating value and making progress. Our findings confirmand extend recent related work (e.g. [9], [13], [14]), includingthat the most important impediments that require attentionare inefficient meetings, constant interruptions, unstableand slow systems and tools, and administrative workloads.Conversely, some factors believed anecdotally to be a prob-lem, such as email, in fact have little effect on how goodor typical a workday is perceived to be. Since we foundevidence that meetings and interruptions are not bad overallas their impact depends on the project phase, we concludethat they do not have to be minimized at all times. Forinstance, we can better support the scheduling of meetingsand help find more optimal slots depending on the projectphase or current workday type. Also, improving developers’perceptions of the importance and value of collaborativework can reduce their aversion against activities that taketime away from coding. For example, managers can includedevelopers’ contributions to other teams or (open-source)projects when they evaluate them in performance reviews.Finally, giving developers enough control over how theymanage their work time is important to foster job satisfactionat work. This can, for instance, be achieved by allowingflexibility in selecting appropriate work hours, locations ofwork, and tasks to work on.
The main contributions of this paper are:• Two conceptual frameworks that characterize develop-
ers’ workdays from two new perspectives: what makesdevelopers consider workdays good and typical.
• Results from 5971 self-reports from professional softwaredevelopers about how they spend their time at work. Thenumber of responses is an order of magnitude biggerthan previous work and allows us to replicate resultsfrom previous work at scale, and to uncover nuances andmisconceptions in developers’ work.
• Quantitative evidence identifying factors that impactgood and typical workdays for software developers andthe relationships between these factors, workday types,and time per activity.
• Recommendations that help researchers and practitionersto prioritize process and tool improvements that makegood workdays typical.
2 RESEARCH QUESTIONS
Our research is guided by the following main researchquestion: What is a good and typical workday for devel-opers? We formulated subquestions to approach the mainresearch question from different perspectives. First, we wantto find out qualitatively what factors impact what developersconsider as good and typical in a workday:
[RQ1] What factors influence good and typical developerworkdays and how do they interrelate?
While much related work has looked into how muchtime developers spend on various work activities (Section 3),we want to investigate how developers spend their timedifferently on days they consider good and typical:
[RQ2] How do developers spend their time on a goodand typical workday?
The large dataset of 5971 survey responses allows us tocompare the time a developer spends on different activities
with other developers. We want to group developers withsimilar workdays together and use other responses from thesurvey to describe and characterize these groups as workdaytypes:
[RQ3] What are the different types of workdays andwhich ones are more often good and typical?
As described in the related work section, developersspend a lot of time at work in development unrelatedactivities, such as meetings and interruptions. We want tofurther investigate the impact of these collaborative aspectson good and typical workdays.
[RQ4] How does collaboration impact good and typicalworkdays?
3 RELATED WORK
Guaranteeing software is written on time, with high qualityand within the budget is challenging [15]. Hence, researchersand practitioners are working both on improving the waycode is written, e.g. by improving tools and programminglanguages, but also on how people write the software, e.g.their motivation, skills, and work environments. The workwe discuss below gives insights into how developers spendtheir time at work, factors that influence their work, andhow different work habits correlate to job satisfaction andproductivity.
3.1 Developer WorkdaysRecent work on how developers spend their time has focusedon what developers do in the IDE, their execution of testcases, usage of refactoring features, and time spent on un-derstanding code versus actually editing code [16], [17], [18],[19]. Other work has investigated developer workdays moreholistically, looking at how they spend their time overall ondifferent activities, and through various means: observationsand interviews [6], [7], [8], [9], [10], [11], self-reportingdiaries [6], and tracking computer usage [10], [12]. Thesestudies commonly found that developers spend surprisinglylittle time working on their main coding tasks, and that thetimes reported on development and other activities variesgreatly. For example, in 1994, Perry and colleagues found thatdevelopers spend about 50% of their time writing code [6]while, in 2011, Goncalves et al. found that it is only about 9%,with the rest being spent collaborating (45%) and informationseeking (32%) [7]. Recently, Astromskis et al. reported thehighest fraction of time spent coding (61%) compared toother activities [12].
There could be many reasons for these differing results.One reason could be differences in how the studied compa-nies and teams organize their work, in how their productsare built and in the type and complexity of software theydevelop. The shift to agile development might further explainwhy newer studies report higher time spent in collaborativeactivities. The exact definition of what accounts a codingactivity and the method of capturing the data is anotherpossible explanation. Observation and diary studies aretypically shorter, as they require more time from studyparticipants and have a higher risk of influencing them [20].Or, the timing of the study captured a time when developerswere extraordinarily busy (e.g. before a deadline), wrappingup a project, or for some other reason.

PRE-PRINTIEEE TRANSACTIONS ON SOFTWARE ENGINEERING 3
In our work, we further explore this challenging space ofunderstanding developers’ workdays using self-reporting atscale and by including two new perspectives of workdays:whether they are good and typical. A number of findingsfrom previous work (e.g. very little coding time, costlyinterruptions, inefficiency of emails) rest on small samples,usually on the order of 10-20 participants, from observational,diary and tracking studies. We validate and replicate thesefindings at scale, transmuting them into solid findings. Thescale of our dataset also provides the resolution to enableuncovering nuances and misconceptions in what makesdevelopers’ workdays positive and productive.
3.2 Factors that Impact Workdays
A vast body of research exists on factors that influence de-velopers’ workdays and what effect they have on developerproductivity (e.g. efficiency at work, output, quality) and well-being (e.g. anxiety, stress level). For example, interruptions,one of the most prominent factors influencing developers’work, have been shown to lead to a higher error rate,slower task resumption, higher anxiety and overall lowertask performance [14], [21], [22], [23]. Emails were shown toextend workdays [24] and be a source of stress, especiallywith higher amounts of emails received [25] and longer timespent with emails [26].
What is often left out from research about factors influ-encing workdays are human aspects, such as developers’job satisfaction and happiness. Job satisfaction is a devel-oper’s attitude towards the general fulfillment of his/herexpectations, wishes and needs from the work that he/sheis performing. One important factor that influences jobsatisfaction is the sum of good and bad workdays, whichwe define as the degree to which a developer is happy abouthis/her immediate work situation on the granularity of asingle day. The developer’s affective states, such as sub-jective well-being, feelings, emotions and mood, all impactthe assessment of a good or bad workday. Positive affectivestates are proxies of happiness and were previously shown tohave a positive effect on developers’ problem solving skillsand productivity [1], [2], [4], [27]. Similarly, aspects of the jobthat motivate developers or tasks that bring them enjoymentwere also shown to lead to higher job satisfaction and produc-tivity [28], [29]. Self-reported satisfaction levels of knowledgeworkers [30], and more specifically, self-reported affectivestates of software developers [3], have further been shownto be strongly correlated with productivity and efficiency.Similarly, developers’ moods have been shown to influencedevelopers’ performance on performing programming tasks,such as debugging [31]. However, it is unclear how these andother factors influencing developers’ workdays affect theirassessment of whether a workday is good or bad. Ideally, wewould use this knowledge to increase the number of good,positive workdays and reduce the negative ones.
Previous psychological research connected positive emo-tions with good workdays [4] and satisfaction [32]. Whenstudying the relationship between positive emotions andwell-being, hope was found to be a mediator [33], [34].Positive emotions at work were further shown to increaseworkers’ openness to new experiences [35], to broaden theirattention and thinking [34], [36], and to increase their level ofvigor and dedication [34], yielding higher work engagement
and better outcomes. Sheldon et al. have further shownthat on good days, students feel they have higher levelsof autonomy and competence, which also results in betteroutcomes [5].
One goal of the reported study is to learn how developersassess good workdays and what factors influence theirassessment. Amongst other results, we found that on goodworkdays, developers succeed at balancing developmentand collaborative work, and feel having spent their timeefficiently and worked on something of value (Section 5.1).
There is also research indicating that good and typicalworkdays are related. For example, knowledge workerswere shown to be more satisfied when performing routinework [37], [38]. Contrarily, a literature review on whatmotivates developers at work, conducted by Beecham et al.,found that the variety of work (differences in skills neededand tasks to work on) are an important source of motivationat work [28]. Similarly, recent work by Graziotin et al. foundthat one of the main sources of unhappiness are repetitiveand mundane tasks [13]. In this paper, we also investigatethe factors that make developers perceive their workdays astypical (Section 5.2), and explore the relationship betweengood and typical workdays (Section 6).
4 STUDY DESIGN
To answer our research questions, we studied professionalsoftware developers at Microsoft. Microsoft employs overthirty thousand developers around the globe with more thana dozen development centers worldwide. The teams followa broad variety of software development processes, developsoftware for several platforms, develop both applicationsand services, and target private consumers and enterprisecustomers.
4.1 Survey Development Using Preliminary InterviewsTo study developer workdays in a subsequent survey, weneeded a taxonomy of activities they pursue. We startedwith the taxonomy of activities by LaToza et al. [16] in theirstudy of developer work habits. To validate and potentiallyenrich this taxonomy, we contacted a random sample ofdevelopers at various levels of seniority across many teamsand scheduled half an hour to interview them about theiractivities at work, conducting ten interviews in total. In eachinterview, we first asked the developer to self-report anddescribe all of the activities that they engaged in during theprevious workday, including the type of activity, the reasonsfor the activity, the time spent in the activity, and what time ofday the activity occurred. We encouraged them to use email,calendars, diaries etc. as these act as “cues” [39] and havebeen shown to reduce interview and survey measurementerror [40], [41], [42], [43], [44]. We then asked interviewparticipants to list additional activities that they engage in,regardless of frequency or duration.
After gaining the approval of Microsoft’s internal privacyand ethics board, we conducted interviews with developersuntil the data saturation point was reached [45]. That is, oncenew interviews yield no additional information, furtherinterviews will yield only marginal (if any) value [46].The set of activities saturated after seven interviews, butwe conducted ten to increase our confidence that we hadcaptured all relevant activities. Once we had collected all of
PRE-PRINTIEEE TRANSACTIONS ON SOFTWARE ENGINEERING 4
the activities, two of the authors grouped them into activitycategories using a card sorting approach [47].
4.2 Final Survey Design and ParticipantsTo increase our understanding of developers’ workdays andwhat makes them good and typical, we broadly deployed asurvey to developers at Microsoft. We followed Kitchenhamand Pfleeger’s guidelines for surveys in software engineer-ing [48] and based the questions on our insights from theinterviews. Our survey comprised four main sections: (1) Wefirst asked about demographics, including team, seniority, anddevelopment experience. (2) Next we presented respondentsa list of activities (those we developed in the interviews)and asked them to indicate how much time they spent in eachactivity on their previous workday. We allowed respondentsto write in additional activities if they had an activity thatwas not covered by our taxonomy. (3) Third, we asked ifthe previous workday was a typical day or not and if theyconsidered it to be a good day. In both cases, we asked themto explain why as an open response. (4) Finally, we asked anumber of additional questions about their day, includinghow many times they were interrupted, and how manyimpromptu meetings occurred. In an effort to minimize thetime required to complete the survey and avoid participantfatigue, only a random subset of the questions in the fourthcategory were shown to each respondent. In total, eachquestion in the fourth category was answered by a random10% subset of respondents. Our goal for the survey was totake only five to ten minutes to complete. After the study wascompleted, the online survey tool indicated that the mediantime to complete the survey was just over seven minutes.
First, Microsoft’s ethics and privacy board reviewedour survey. To pilot the survey and identify any potentialproblems, we then sent the survey to 800 developers over thecourse of one week with an additional question asking if anyaspect of the survey was difficult or confusing and solicitinggeneral feedback. After examining the responses, we madesmall wording changes for clarity and also confirmed thatour activity list was complete. Since the changes were veryminor, we also included the pilot responses in our analysis.In an effort to make our study replicable, we provide the fullsurvey in the supplementary material 2.
We then sent out 37,792 invitations to complete thesurvey by sending approximately 500 invitations on a dailybasis over the course of roughly 4 months. Developerswere selected randomly with replacement, meaning that itwas possible that a developer would receive the surveymultiple times over the course of the study (though nevermore than once on a given day). Each developer receiveda personalized invitation via email that explained whowe were and the purpose of the survey. To encouragehonest responses and improve participation rate, surveyresponses were anonymous. In the invitation email andsurvey description, we explicitly stated that participation isvoluntary, the survey is completely anonymous, all questionsare optional, and that only aggregated and no individual datawill be shared with collaborators at Microsoft. Participantscould also contact us in case they had any questions orconcerns. Even though the survey was anonymous, 43.8%of respondents choose to reveal their identity. Among them,
2. Supplementary material: https://doi.org/10.5281/zenodo.1319812
only 6.6% responded twice and none repeated more thanonce. In Section 8, we discuss potential threats of this studydesign choice. We analyzed the responses in the unit of aworkday, not a developer.
We used a one sample continuous outcome confidenceinterval power analysis to determine our required samplesize [49]. To achieve a confidence level of 95% for a 5%confidence interval, the power analysis indicated that weneeded 385 responses. Since we were not sure ahead of timethe exact ways that we would be partitioning and comparingthe responses, we aimed for ten times that amount. Intotal, we sent 37,792 survey invitations and received 5,971responses. This is a response rate of 15.5%, which is in linewith response rates reported by other surveys in softwareengineering literature [50]. From the 5,971 responses wecollected in the survey, 59.1% of the developers stated theyare junior and 40.5% senior developers. 0.4% or 26 did notspecify their seniority level. Respondents reported an averageof 10.0 years (±7.48, ranging from 0.5 to 44) of experienceworking in software development.
4.3 The Validity of Self-Reported Data
Collecting time-use data can be achieved through variousmethods, including observations, automated tracking, andself-reporting. We decided to ask developers for self-reports,for the following reasons: self-reports (1) scale better thanobservations to have a representative sample, (2) they collecta more holistic view compared to using time trackingsoftware that misses time away from the computer (whichwas shown to be on average about half of a workday fordevelopers [10]), and (3) since we investigate developers’individual perceptions of good and typical workdays, itmakes sense to compare those perceptions with their ownestimations of how they spend time. Further, self-reporteddata is also common in large-scale time-use surveys, such asthe American Time Use Survey [51]. However, self-reportson behaviors and time spent are profoundly influenced bythe question wording, format and context, and can, thus,be unreliable [44]. To overcome these risks, we carefully de-signed the self-report questions based on recommendationsfrom related work, especially Schwarz et al. [44], [52], andwe test-run our questions first with ten interviewees beforerunning the actual survey study.
We intentionally asked respondents to self-report aboutthe activities of the previous workday instead of askingmore generally. This was a conscious methodological designdecision based on the following reasons. First, the previousday is recent, thereby increasing recollection accuracy. Thisholds true even if the self-report is about the Friday theweek before in case respondents answer on a Monday.According to Tourangeau et al., by far the best-attested factabout autobiographical memory is that the longer the intervalbetween the time of the event and the time of the interviewor survey, the less likely that a person will remember it [39].Second, a day is a short period of time to recall, and a largebody of research on surveying and recollection has foundthat when the reference period is long, respondents tendto use heuristics and estimation of frequencies rather thanconcrete occurrences [44], [52], [53], [54]. This can decreasevalidity, as Menon found that “to the extent that behavioralfrequencies are reported based on inferential heuristics, they

PRE-PRINTIEEE TRANSACTIONS ON SOFTWARE ENGINEERING 5
are judgements and are subjective” [52]. Being asked howmany times one went out to eat last week, most peoplewill likely count concrete instances, whereas if the referenceperiod is last year, they will almost certainly estimate basedon heuristics. Lastly, even if a respondent does recountconcrete events, larger reference periods can fall prey toa phenomenon known as “telescoping” whereby a notableevent is remembered as occurring more recently than itactually did [55], [56]. By using the period of a single day,events are less likely to cross a “night boundary” and beattributed to the wrong day [54].
We encouraged participants in the interviews and surveyto use their email clients, calendars, task lists, diaries etc. as“cues” [39] to improve their recall of their previous workdayand reduce measurement errors [40], [41], [42], [43], [44].Finally, we asked respondents to self-report the times spentin minutes rather than hours so that they were forced to recallthe events in more detail, as the unit of time in response hasshown to have an impact on recollection accuracy [44], [57].
5 CONCEPTUAL FRAMEWORKS
In this section, we answer RQ1 and present the results frominvestigating survey respondents’ self-reports of what madetheir previous workday good and typical. We organizedthe factors influencing developers’ workdays as conceptualframeworks and describe them using representative quotesand examples.
5.1 Developers’ Good WorkdaysTo identify factors that influence what a good workday is todevelopers, how they relate to each other, and how importanteach factor is, we asked survey respondents the followingquestion: “Would you consider yesterday a good day? Whyor why not?”.
5.1.1 Data AnalysisWe coded the responses to the question to a binary ratingof either good or not good. Due to the formulation of thequestion, not good workdays could either refer to an averageor a bad workday. From now on, we describe not goodworkdays as bad for better readibility. 5013 participantsanswered the question; 60.6% (N=3039) stated their previousworkday was good and 39.4% (N=1974) stated it was bad.
We qualitatively analyzed the cleaned responses fromparticipants who provided an explanation for what madetheir workdays good or bad (21.1% did not provide anexplanation). We developed a coding strategy, applyingOpen Coding, Axial Coding, and Selective Coding as definedby Corbin and Strauss’ Grounded Theory, as follows [58] 3.The first author Open Coded the entire set of 4005 responseson what made participants’ previous workday good or bad,using a quote-by-quote strategy where multiple categoriescould be assigned to each quote. Responses that could notdistinctively be mapped to a category were discussed withthe other authors. Before starting the first Axial and SelectiveCoding iteration, the authors familiarized themselves with
3. Since we applied all components of Straussian’s Grounded Theoryapproach in our analysis but the outcome of this analysis was aconceptual framework instead of a theory, the most accurate descriptionof our analysis is that we used Grounded Theory as a “methodologicalrationale” [59] or “a la carte” [60].
the categories that resulted from the Open Coding step, bylooking at 10-30 representative responses (i.e. quotes) percategory and the number of responses that the first authorOpen Coded to each category. We then discussed the rela-tionships between these categories in the team (usually withthree or all four authors present). This included drawing outthe factors and their relationships on a whiteboard, which wecollected as memos. During that process, we heavily reliedon the quotes and regularly consulted them for additionalcontext and details about the identified relationships. Theprocess was iterative, meaning that whenever the Axial andSelective Coding steps resulted in updates to the OpenCoding categories, the first author re-coded participants’responses, and we did another iteration of Axial and Selectivecoding. After five iterations, we used the memos, factors thatresulted from the Axial Coding and high-level factors (thatresulted from the Selective Coding) to create a conceptualframework to characterize developers’ good workdays.
5.1.2 Conceptual Framework
From applying our coding strategy, we identified 11 factorsimpacting developers’ assessment of a good workday. Weorganized these factors into three high-level factors, (1) valuecreation, (2) efficient use of time, and (3) sentiment. The firsttwo high-level factors were fairly obvious since respondentsusually described good workdays when they consideredtheir work as meaningful and/or did not waste their timeon meaningless activities. A few important factors, however,did not fit into these two high-level factors. They are relatedto respondents’ personal feelings and perceptions of theiroverall work, which we grouped as the third high-levelfactor. Initially, we thought that quality is another importantfactor, since some respondents described good workdays asdays they improved the quality of the software or did notbreak something. However, we realized that these statementson quality were very rare (0.3% of responses) and thatrespondents described them as one form of working onsomething of value.
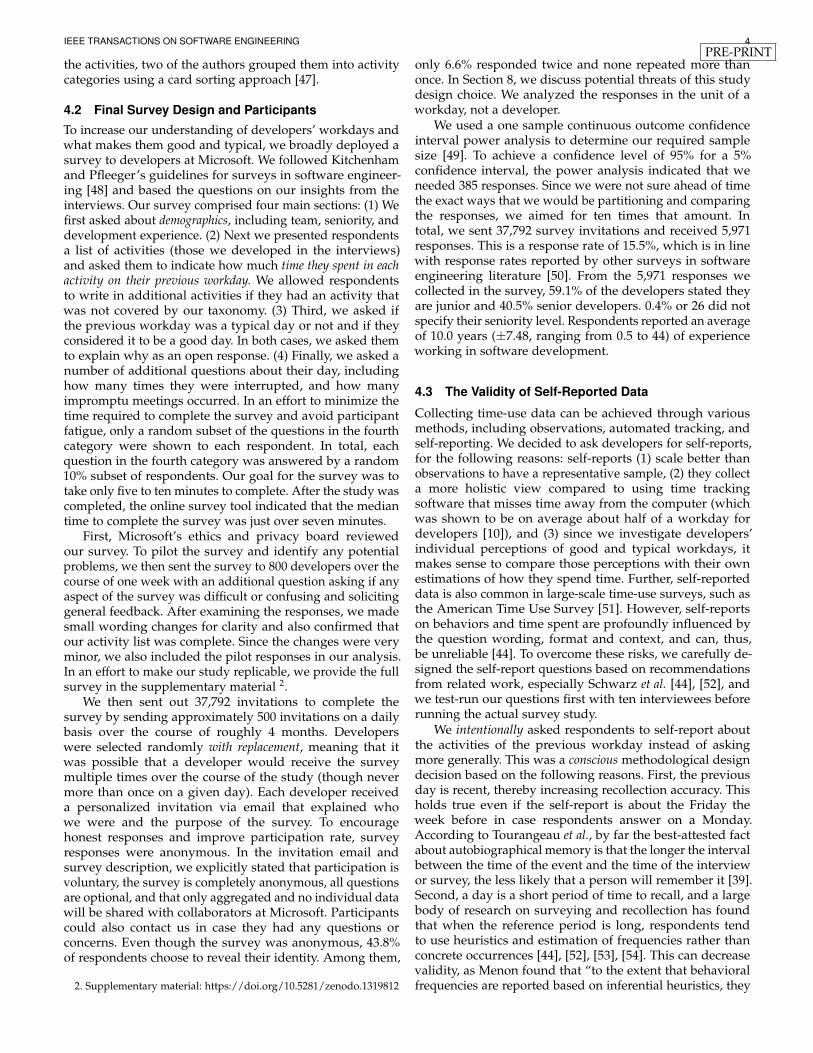
In Figure 1, we visualize the conceptual framework forgood workdays. Each of the 11 factors (light gray) influencesone of the three high-level factors (dark gray), and theyin turn influence whether developers perceive a workdayas good. The numbers in parentheses are counts for thenumber of responses that we categorized into each high-levelfactor (total N=4005). Since the identified factors are basedon responses to an open question, the reported numbersand percentages in this section should only serve to give afeeling about how prevalent each factor is in respondents’assessment of good workdays, rather than exact measures(reality might be higher).
Now, we provide representative examples and quotesto describe the factors and explain how we derived theconceptual framework based on survey responses.
VALUE CREATION. To decide whether their workday wasgood, respondents most often evaluated if they were effectiveand if they created something of value (68.0%, N=2725 ofthe 4005 responses to the question). Creating value, however,means different things to developers. In 35.6% (N=1425) ofthe responses, developers considered their workday goodwhen they managed to produce some form of outcome oraccomplishment. Participants typically described a good
PRE-PRINTIEEE TRANSACTIONS ON SOFTWARE ENGINEERING 6
Value Creation(2725)
Perception(372)
Efficient Use of Time(2164)
Making
Progress
Learning
New
Things
Helping
Others
Constructive
Discussions
Meaningful
Work
Working
in Code Ability
to Work
Focused
Meeting
Expect-
ations
Time
Pressure
& StressProductivity Overtime
Good or Bad
Workday
Fig. 1. Conceptual framework for good workdays. The 3 high-level factorsare visualized as square layers; outer layers influence the inner layers.
workday being one when they make a lot of progress on orcomplete their main tasks (similar to previous work [4]):
“Made some good progress, [the] project is coming together, checkedin some tests.” - S105 [good]
Many responses (13.8%, N=553) mentioned that devel-opers feel good about their workday when they can spendparts of it working in code, rather than on other activities,such as meetings, interruptions, or administrative tasks. For6.4% of all responses (N=257), creating value was describedas working on something developers deem important andmeaningful enough to spend their time on. This could betasks that let the project progress, process improvements thatmake the team more efficient, improving the quality of theproduct, or a feature that they consider valuable for endusers:
“I was able to help influence a decision that I thought wasimportant.” - S1658 [good]
While meetings were often not considered a good useof their time (as discussed in more detail in Section 5.1.2),189 responses (4.7%) described a good workday to be whendevelopers participated in good, constructive discussions,when important decisions on the project were made, or whenconnections could be made that are valuable in the future:
“Meetings were productive, and we made some new connectionswith partners that seem promising. I also had a good chat with aformer manager/mentor.” - S483 [good]
Workdays where developers learned something newor that increased their understanding of the project orcodebase were also considered good, as 4.7% (N=188) ofthe responses described learning a valuable investment intothe developers’ or project’s future. Similarly, days whendevelopers could help a co-worker to learn something newor unblock someone from a problem they are stuck with wasgenerally considered positive and rewarding (4.7%, N=188).However, spending too much time helping others reducesthe time they can spend on making progress on their owntasks:
“I spent too much time helping team members and not enough onmy scheduled tasks.” - S1880 [bad]
EFFICIENT USE OF TIME. A second high-level factor forconsidering what a good workday is, is how efficientlydevelopers manage to spend their time (54.0%, N=2164).A developer’s workday can be organized in various ways,and there are numerous external and personal aspects thatcompete with each other for the developer’s attention andtime. This impacts whether a workday goes as expected
and influences the developer’s ability to focus on the maincoding tasks. Respondents mentioned that changes to theirplanned work or deviations from their usual workday areoften negatively perceived. Especially, unexpected, urgentissues in a deployed system puts pressure on developers toresolve them quickly (11.6%, N=464):
“Started off with a live-site issue (still unresolved), then went toa [different] live-site issue (still unresolved), then I actually got afew minutes to work on the [main] task.” - S3158 [bad]
Interruptions from co-workers and distractions such asbackground noise in open-plan offices were described in13.8% (N=552) of the responses to negatively influencedevelopers’ ability to focus or work as planned:
“Too many interruptions/context switches. I need a continuousblock of time to be really productive as a coder, but I find I getdistracted/interrupted more than I’d like.” - S1066 [bad]
Similarly, long meetings or meetings spreading over thewhole day, with very little time in-between to work focused,were another regularly mentioned reason (12.2%, N=491).
10.3% (N=411) of the remaining responses mentionedfurther reasons for bad workdays that were not numerousenough to be coded into a new category. This includes timelost due to infrastructure issues, outdated documentation,spending too much time to figure out how something worksand being blocked or waiting for others (similar to [13]).Unlike what one might expect from previous work [24], [25],[26], emails were surprisingly only rarely mentioned as areason for not being a good workday (1.7%, N=69).
PERCEPTION. 9.3% (N=372) of all responses about goodworkdays were related to developers’ positive or negativeperceptions of their overall work; their productivity, timepressure, and working hours. For example, in 4.7% (N=187)of the responses developers mentioned that they felt pro-ductive or unproductive on a particular workday, and notspecifying what factors contributed to their feeling.
“Yes, I was productive and felt good about what I’d done.” - S322[good]
In 102 (2.5%) responses, developers considered workdaysto be better when they had a good balance of handlingstress. This includes not trying to meet a tight deadline andnot having a too high time pressure:
“Considering we are not [on] a tight deadline, working in a relaxedfashion and coding were quite enjoyable.” - S1654 [good]
Time pressure was recently also shown as a major cause ofunhappiness of developers [13]. 2.2% (N=87) of the responsesdescribed workdays requiring to work overtime as bad.Reasons for what causes overtime work are tight deadlinesand having full task lists.
In Section 7, we make recommendations about how toleverage these results to make good workdays typical.
5.2 Developers’ Typical Workdays
To learn how different factors impact developers’ assessmentof typical workdays, we asked survey respondents thefollowing question: “Was yesterday typical?”. To answerthe question, they could either select yes or no. Respondentswho picked no were asked to provide a reason for theirassessment in a free-form textbox.

PRE-PRINTIEEE TRANSACTIONS ON SOFTWARE ENGINEERING 7
5.2.1 Data Analysis
5876 participants responded to the question; 64.2% (N=3770)considered their workday as typical and 35.8% (N=2106)as atypical. 2008 of these 2106 participants (95.3%) then ex-plained what made their workdays atypical. To qualitativelyanalyze these factors and their relationships, we used thesame coding strategy that we described in Section 5.1.1 tocharacterize good workdays.
5.2.2 Conceptual Framework
Here, we describe how we developed the conceptual frame-work that characterizes typical workdays. As respondentswere very vocal about meetings and interruptions to describemain reasons for atypical workdays, we initially thought thata key component for the assessment is whether the developerhas control over the factor. However, from our discussionsand after coding all responses, we realized that the keycomponent is the match between a developer’s expectationof how a workday will be and how it actually was in reality.Externally influenced factors are just one factor to influencethis match. If the mismatch is large, developers consider theworkday atypical. Also, we initially thought that the resulting7 high-level factors that we identified through our Axialand Selective Coding all directly influence the assessmentof typical workdays. However, we noticed that they alsoinfluence each other: The current project phase impacts thedistribution over the different workday types. The workdaytype and subsequent factors (external, tasks, location andpersonal) in turn influence the developer’s expectation ofhow much time is spent in activities. We noticed that it wasusually not the activity itself that impacted the assessment,but whether the developer spent more, less or about the sameamount of time on it than usual and what the developerexpects. The relationships between the layers (i.e. factors)were discovered through extensive discussions in the wholeteam during the Axial Coding steps, where we discussed thecategories that resulted from the Open Coding process inrelation with the representative quotes from each category.
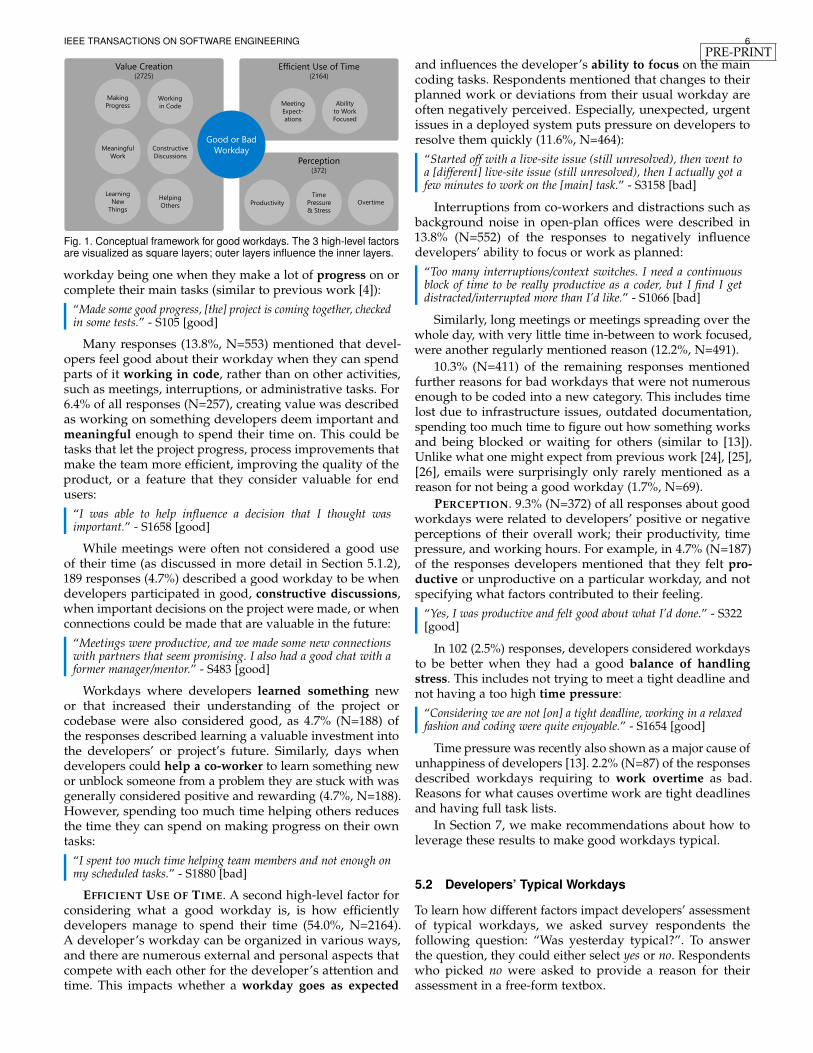
In Figure 2 we visualize the conceptual framework,including the 7 high-level factors as gray layers. The differentgray shades show how each layer influences the innerlayers above. The counts in parentheses denote the numberof participants whose response we coded into the factor(total N=2008). We explain the conceptual framework, byproviding representative examples and quotes to describethe factors.
PROJECT PHASE. In 28.6% (N=575) of the responses,developers assessed their previous workday as atypical,providing the current project phase as the reason. In agilesoftware development, an iteration usually starts with a plan-ning and specification phase, is followed by a developmentor quality/stabilization phase, and then finalized with therelease phase. Respondents, however, often perceived theirworkdays as atypical when the phase was not development(22.3%, N=448). Since non-development phases occur lessfrequently, are usually shorter, and often let developers codeless than in development phases, they are perceived atypical:
“We are in the planning phase now and each day is different: Thereis a lot more focus on evaluations, specs, meetings during thisphase. This would significantly differ from our workday duringcoding milestones.” - S2243
Project Phase (575)
Type of Workday (83)
Main Work Tasks (145) Personal (43)
Location (116)External (678)
Time Spent on Activities (1040)
≈Typical or Atypical
Workday
Expectation
Reality
Fig. 2. Conceptual framework characterizing typical workdays. The mainfactors are visualized as layers; the outer layers influence all inner layers.
These non-development phases are perceived as “slower”,which is why developers spend more time on activitiesthat usually fall short during development phases, suchas training, evaluating frameworks, writing documentation,or working on low-priority tasks.
Since developers often describe meetings and interrup-tions as unproductive, prior work concluded that they arebad overall [9], [14], [21], [22], [23], [61]. We are refining theseearlier findings with our results that suggest the impact ofmeetings and interruptions on productivity depends on theproject phase. Respondents described that during phases ofspecification, planning and releases, they are common, butconstructive:
“In planning stage, not development stage. Spent way more timein meetings than normal, but they were productive meetings.” -S1762
As some teams at the studied organization do not employseparate teams dedicated to operations, developers also haveto take part in a servicing phase, usually for about one weekevery couple of weeks. During that week, they are on-callfor urgent and unexpected issues, which respondents oftenalso regarded as atypical:
“I am currently on-call as [an] incident manager. It was typicalfor on-call rotation, but that happens only once every 12 weeks.” -S2447
While many respondents described the current phase tobe atypical, few mentioned that the amount of time theyspent on certain activities was unusual for the phase they arecurrently in. For example, spending an unusual high amountof time with coding during a planning phase felt atypical.
TYPE OF WORKDAY. The workday type is another factorthat influences whether a developer considers a workday astypical. While this factor is not as prominent as the projectphase that influences it, the workday type was emphasizedin 4.1% (N=83) of the responses. Certain teams or individualsorganize their work into days where they mainly focuson a single activity, such as coding, bug-fixing, planningor training. During these days, developers avoid pursuingactivities that distract them from their main activity, such asemails or meetings. Specific days where the team would notschedule any meetings were mentioned most prominently:

PRE-PRINTIEEE TRANSACTIONS ON SOFTWARE ENGINEERING 8
“We’re not allowed to schedule meetings on Thursdays.” - S419“On Mondays I have a late night coding night.” - S159
These well-appreciated “no-meeting days” were oftenscheduled during development phases to allow developersto focus primarily on making progress on their coding tasks.
EXTERNAL. In 33.8% (N=678) of the responses, devel-opers mentioned external factors they have little controlover to contribute to an atypical workday, as they oftendivert developers from making progress on their main taskstowards other responsibilities. Among these, meetings weremost often mentioned (20.5%, N=411), especially when theyare unplanned, very long or concerning an unusual topic:
“I had literally no meetings and spent the entire day refactoringlegacy code. That is unusual.” - S2394
Lack of knowledge, e.g. when having to work on a task inan unfamiliar codebase or with a new framework, is anotherfactor that can make workdays atypical (3.9%, N=78), asdevelopers have to stop working on their tasks and spendtime learning or attending trainings about a topic:
“I was working in a very unfamiliar system; so I spent a lot of timestruggling with how to do basic things like building. Normally, Iwork in a system that I’m familiar with.” - S1490
Fixing infrastructure problems or performing mainte-nance (e.g. internet issues, installing updates) were describedas the reason for an atypical workday by 3.9% (N=78) of theresponses:
“Hardware maintenance/setup is not part of my typical responsi-bilities. I don’t think that I am typically randomized to this extent.”- S1306
Similar to our finding on what makes a good workday,emails were only rarely mentioned as a reason for an atypicalworkday (1.4%, N=28). Finally, respondents mentioned otherfactors that make their work more fragmented and divertthem away from their main work tasks, including longor topic unrelated interruptions (3.6%, N=72), and beingblocked on a task and having to wait for others (0.5%, N=11).
LOCATION. As developers typically work at the organi-zation’s location on-campus, any other location they workon is often considered atypical (5.8%, N=116):
“I worked from home and was able to make much better progressthan normal.” - S4679
When developers are not working in their usual location,they either work from home, at a client’s or partner’s office,or they are traveling to their team’s remote location in case itis distributed. Working from home was uniformly describedas a well-appreciated opportunity to get tasks done withminimal interruptions, as it is one way to regain some controlover the external factors that can randomize a workday.
MAIN WORK TASKS. 7.2% (N=145) of responses men-tioned the task itself impacts whether they consider work-days typical. This is the case for unusual tasks, such aspreparing for a demo or presentation, very easy tasks, suchas routine work, or very challenging tasks:
“I am not normally prepping for a presentation.” - S1554
As most development teams at the studied organizationplan work by assigning work items in Scrum meetings,unplanned and urgent tasks are another reason for side-tracking developers:
“No, there was a high priority issue. Normally I would try to spenda little bit more time coding.” - S5057
These unplanned tasks impact developers’ workload andcan make it harder to meet deadlines, which often results inlonger than usual workdays:
“16 hour work days are insane, a big chunk of time was spenttroubleshooting a sideways deployment to [product].” - S5309
PERSONAL. Few of the responses (2.1%, N=43) usedpersonal factors to explain what made a workday atypical.The only personal reasons that were mentioned are healthrelated, e.g. feeling sick or having a doctor’s appointment.After identifying the importance of personal factors for theframework about good workdays, we more closely inspectedresponses describing typical and atyipcal workdays fromthat perspective. No respondent described personal factorssuch as mood, sleep quality or the ability to focus as factorsthat impact typical workdays.
This surprised us, since previous work identified thatthese more personal factors can impact the workday orga-nization, focus and productivity of knowledge workers [1],[13], [23], [62], and thus, presumably, also their assessmentof a typical or atypical workday. As respondents did re-veal personal factors when characterizing good and badworkdays, and as we ensured respondents anonymity (seeSection 4.2), reasons for the lack of personal details in thisquestion might be that the survey setting did not promptthem explicitly enough to reflect about personal factors orthe other identified factors are more prevalent and have abigger influence on their assessment of a typical workday.
TIME SPENT ON ACTIVITIES. Finally, the high-levelfactors described above influence how much time developersspend on different activities. For example, during the devel-opment phase, developers typically spend more time writingcode, days with many unplanned meetings reduce the timespent on main coding tasks, and unplanned urgent taskscould force a developer to work overtime. We categorizedall cases where 51.8% (N=1040) of the responses containeddescriptions of spending more or less time than usual ona certain activity and visualized the top 5 in Table 1. Onatypical workdays, respondents mostly reported spendingmore than usual time in meetings and debugging or fixingbugs.
5.3 Interrelationship Between Good and Typical Days
In our analysis of related work, we found an interconnectionbetween job satisfaction, goodness, routine, typicality andproductivity. First, we developed conceptual frameworks tobetter understand these factors in isolation. Now, we describeour main qualitative observations on the interrelationship be-tween good and typical workdays, and present quantitativeresults in Section 6.
One key finding is the importance of control, i.e. develop-ers’ ability to control their workday and whether it goes asplanned/expected or is disrupted by external factors, such asunplanned bugs, inefficient meetings, or infrastructure issues.While our findings replicate some results from previouswork, they help to better understand nuances in developers’work and sort out misconceptions. For example, when welooked more closely at why developers are very vocalabout meetings and interruptions being one of the main

PRE-PRINTIEEE TRANSACTIONS ON SOFTWARE ENGINEERING 9
TABLE 1Top 5 activities where respondents reported spending more or less thanusual time in on atypical workdays. Percentages are based on all 2008
responses to the question.
Activity Category More than Usual Less than UsualMeetings 10.2% (N=205) 5.8% (N=116)Debugging/Fixing Bugs 6.5% (N=131) 1.3% (N=27)Coding 3.9% (N=78) 5.1% (N=102)Planning/Specification 1.6% (N=33) 0.2% (N=5)Learning/Tutoring 1.5% (N=30) 0.1% (N=3)
detriments to unproductive work, we found that during non-development phases, they are better accepted and moreproductive. Another insight from studying factors thatinfluence good and typical workdays was that the timespent on email (as opposed to email content) are rarelythe reason for bad or atypical workdays. Finally, developersdescribed personal factors only very rarely as reasons fortheir assessment. This might suggest that developers arenot very aware of how their private lives, health and moodimpact their work, or they chose not disclose these factorssince they are too personal.
6 QUANTITATIVE ANALYSIS
We provide a quantitative analysis of the relationship be-tween good and typical workdays, by comparing them withthe time spent in activities (RQ2), with workday types (RQ3),and with collaborative activities (RQ4). Each analysis reusesthe same binary ratings for good and typical workdays thatwere used to develop the conceptual frameworks.
6.1 Correlation Between Typical and Good WorkdaysFirst, we created a contingency table (see Table 3) to inves-tigate the correlation between good and typical workdays.A Fisher’s exact test shows strong statistical significance(p=0.00001324, 95% confidence interval). This means thatalthough typical and atypical workdays are both more likelyto be considered good than bad, the percentage of typicalworkdays that were considered good (62.9%, good typicaldays over all typical days) is higher than the percentageof atypical workdays that were considered good (56.7%,good atypical days over all atypical days) to a statisticallysignificant degree. Similarly, from studying emotions devel-opers express when writing and commenting issue reports,Murgia et al. found that surprise, which could be moreoften experienced on atypical workdays, is associated withnegative events [63].
6.2 Time Spent on Activities at WorkPrevious research on how developers spend their timeat work did not consider whether developers think theywere good and typical, or whether they were an unusualrepresentation of work [6], [7], [8], [9], [10]. Hence, optimizingprocesses and tools without this knowledge is risky, sincewe might draw wrong conclusions and optimize for bad oratypical workdays. For example, from previous studies wecould get the impression that reducing the email workloadof developers is of very high importance. However, ourstudy showed that while developers spend time with emails,they do not consider them an important factor that makesworkdays bad or atypical. Hence, to answer RQ2 we askedparticipants to self-report the time they spent on various
activities at work and related them to their assessments ofgood and typical workdays.
Data Analysis. In the survey, respondents filled out atable with the minutes spent in predefined activity categories.They also had the option to add other activity categories incase they were missing. For the quantitative analysis, weonly used responses where the total time spent was greaterthan zero and smaller than 24 hours. We then calculatedthe mean and relative time spent per activity category forall respondents, for respondents who reported they had atypical or atypical workday, and respondents who reportedthey had a good or bad workday.
Results. In Table 2, we visualize the mean number ofminutes and relative time (in percent) participants reportedhaving spent on each activity on their previous workday.Column 2 lists an average over all participants, whileColumns 3 and 4 consider typical and atypical workdays,and Column 5 and 6 consider good and bad workdays. Intotal, developers spent on average slightly more than 9 hoursat work on their previous workday. While this includes anaverage of 44 minutes non-work time spent at lunch andwith bio breaks, the time spent at work is nonetheless higherthan the often considered 8 hours for a regular workday(e.g. [64]). Since developers at the studied organization canfreely organize their work hours, this might be an indicationof developers working overtime, an observation that waspreviously made for German and Finnish workers who hadautonomy over their working time and worked overtime [65],[66]. Overall, the self-reported 9 hours spent at work is in linewith our previous work, where we found that developers’work activities span across 8.5 hours on average, identifiedthrough computer interaction time tracking [10].
Activities are grouped into Development-heavy,Collaboration-heavy and Other activities. A few activities couldbe grouped into multiple groups, e.g. pair programming andcode reviewing. Hence, we define a development-heavyactivity as an activity usually performed by the developeralone, and a collaboration-heavy as an activity that usuallyinvolves multiple people. Activities categorized as Other areusually not directly related to development tasks or workingwith other people.
Most of the time is spent with development-heavyactivities, such as reading or writing code (15%, 84 mins),debugging or fixing bugs (14%, 74 mins) and testing (8%, 41mins). Developers also spent time collaborating with other,including meetings (15%, 85 mins), emails (10%, 53 mins),and helping or mentoring others (5%, 26 mins).
Comparing quantitative self-reports on time spent onactivities across good and typical workdays confirms thepreviously established qualitative characteristics of good andtypical workdays (see Sections 5.1 and 5.2). Both, on goodand typical workdays, developers spend considerablymore time with development related activities. For example,the time spent with reading and writing code is 22 minuteshigher on typical (compared to atypical) workdays and 30minutes higher on good (compared to bad) workdays. Ontypical workdays, developers also spend slightly less time inmeetings, with planning or working on requirements, andwith learning or in trainings. And on good workdays, theyspend about half an hour less in collaborative activities, thanon bad workdays.

PRE-PRINTIEEE TRANSACTIONS ON SOFTWARE ENGINEERING 10
TABLE 2Mean and relative time spent on activities on developers’ previous workdays (WD). The left number in a cell indicates the average relative time spent
(in percent) and the right number in a cell the absolute average time spent (in minutes).
Activity CategoryAll Typical WD Atypical WD Good WD Bad WD
100% (N=5928) 64% (N=3750) 36% (N=2099) 61% (N=3028) 39% (N=1970)pct min pct min pct min pct min pct min
Development-Heavy ActivitiesCoding (reading or writing code and tests) 15% 84 17% 92 13% 70 18% 96 11% 66Bugfixing (debugging or fixing bugs) 14% 74 14% 77 12% 68 14% 75 13% 72Testing (running tests, performance/smoke testing) 8% 41 8% 44 7% 36 8% 43 7% 38Specification (working on/with requirements) 4% 20 3% 17 4% 25 4% 20 4% 20Reviewing code 5% 25 5% 26 4% 23 4% 24 5% 26Documentation 2% 9 1% 8 2% 10 2% 9 2% 8Collaboration-Heavy ActivitiesMeetings (planned and unplanned) 15% 85 15% 82 17% 90 14% 79 18% 95Email 10% 53 10% 54 10% 54 9% 52 10% 57Interruptions (impromptu sync-up meetings) 4% 24 4% 25 4% 22 4% 22 5% 28Helping (helping, managing or mentoring people) 5% 26 5% 27 5% 25 5% 26 5% 28Networking (maintaining relationships) 2% 10 2% 9 2% 12 2% 11 2% 10Other ActivitiesLearning (honing skills, continuous learning, trainings) 3% 17 3% 14 4% 22 3% 19 3% 16Administrative tasks 2% 12 2% 11 3% 14 2% 11 3% 15Breaks (bio break, lunch break) 8% 44 8% 44 8% 45 8% 44 8% 45Various (e.g. traveling, planning, infrastructure set-up) 3% 21 3% 17 5% 27 3% 19 4% 25Total 9.08 hours 9.12 hours 9.05 hours 9.17 hours 9.15 hours
TABLE 3Contingency table for the relationship between good and typical
workdays (WD). The left number in a cell indicates the percentage andthe right number in a cell the total number of responses.
Typical WD Atypical WD TotalGood WD 39.8% 1989 20.8% 1037 60.6% 3026Bad WD 23.5% 1175 15.9% 796 39.4% 1971Total 63.3% 3164 36.7% 1833 100% 4997
6.3 Workday Types
Looking at average relative time spent in activities for allresponses results in the impression that good/bad andtypical/atypical workdays are very similar overall. However,respondents described that not all workdays look the same,e.g. when they have no-meeting days, and that this type ofworkday often influences whether they consider a workdayas typical or atypical. Since we did not prompt them todiscuss workday types, only 4.1% (N=83) of respondentsmentioned it. To evaluate similarities and trends in develop-ers’ workdays and to answer RQ3, we reused our dataset (seeSection 6.2) to group responses together where respondentsreported spending their time at work with similar activities.We then used responses to other questions to characterizethese groups as workday types.
Data Analysis. To identify groups of developers withsimilar workdays, we run a cluster analysis following steps:
1) For the clustering, we used respondents’ self-reportsof the relative time spent in each activity category.The data cleaning process is the same as describedbefore in Section 6.2. To group the respondents, weused the Partitioning Around Medoids (PAM) clusteringalgorithm [67] in the pamk implementation from the fpcpackage4 in R. We varied the number of clusters (k)from one to twenty. The pamk function is a wrapperthat computes a clustering for each k in the specifiedrange and then returns the clustering with the optimumaverage silhouette. In our case, the optimal number ofclusters was k = 6.
2) To describe the inferred six clusters, we used responsesto other questions from the survey, including develop-
4. https://cran.r-project.org/web/packages/fpc
ers’ assessments of good and typical workdays, theirexperience (senior versus junior developer (as definedby the organization position) and number of years ofdevelopment experience) and their office environment(private versus open-plan office).
3) Finally, we used the cluster descriptions to developworkday types.
Results. In Table 4, we present the resulting six clusters,the amount of time developers in each cluster spend ondifferent activities, and additional factors to describe theclusters. Clusters 1 to 3 (C1-C3) are development heavyworkdays, while clusters 4 and 5 (C4-C5) include morecollaborative aspects. In the following, we describe theclusters as workday types and characterize them consideringthe factors mentioned above. We also name each workdaytype to make referencing them easier in the paper.
On a “Testing Day” (C1), developers overall spendconsiderably more time with testing compared to the otherdays. As testing often requires to also debug and fix code,they also spend more time with coding and debuggingcompared to other not development heavy days (C4-C6). On“Testing Days”, developers spend more time learning newthings than the other days. The majority of the developersin this cluster (in our sample, 71%) are junior developers,with 66% considering it a typical workday and 63% a goodworkday respectively. On a “Bugfixing Day” (C2) developersspend significantly more time debugging or fixing bugs(almost 3 hours on average). Similar to the “Testing Day”,mostly junior developers are experiencing this workday type(69%), and the developers in this cluster generally thoughtit was fairly typical (65%) and good (60%). A “Coding Day”(C3) is a workday where developers spend a lot of theirtime reading and writing code, on average about 2.3 hours,and is perceived as good by more developers than the otherworkdays (74%). This workday type has a higher chance tobe perceived as typical, with 72% considering their previouscoding day as typical. 65% of the developers in this clusterare juniors and most of the developers in this cluster donot sit in private offices (60%). The “Collaborating Day”(C4) entails spending more time on collaborative activities,

PRE-PRINTIEEE TRANSACTIONS ON SOFTWARE ENGINEERING 11
TABLE 4The six workday type clusters. Each column corresponds to a cluster and each row either to the time spent in activities or factors considered to
describe the clusters. The left number in a cell indicates the average relative time spent and the right number in a cell the average absolute time spent.
Cluster 1 Cluster 2 Cluster 3 Cluster 4 Cluster 5 Cluster 6Testing Day Bugfixing Day Coding Day Collaborating Day Meeting Day Various Day
24% (N=1451) 23% (N=1344) 22% (N=1319) 21% (N=1216) 8% (N=504) 2% (N=94)pct min pct min pct min pct min pct min pct min
Time Spent in ActivitiesDevelopment-Heavy ActivitiesCoding 11% 63 11% 61 37% 137 7% 37 6% 32 6% 35Bugfixing 11% 59 32% 170 10% 56 6% 31 4% 20 6% 36Testing 16% 87 7% 36 6% 35 2% 13 2% 11 4% 25Specification 4% 19 1% 6 2% 10 9% 47 3% 18 1% 4Reviewing code 5% 25 4% 23 4% 23 6% 33 3% 14 3% 19Documentation 3% 16 1% 4 1% 6 2% 9 1% 8 1% 3Collaboration-Heavy ActivitiesMeetings 12% 65 9% 50 9% 50 22% 121 46% 248 7% 41Email 8% 45 10% 52 8% 42 13% 73 12% 66 8% 44Interruptions 4% 24 4% 21 4% 19 6% 33 3% 19 3% 20Helping 4% 24 4% 21 4% 20 8% 44 5% 26 2% 14Networking 3% 14 1% 8 1% 7 2% 12 2% 12 1% 7Other ActivitiesLearning 7% 36 2% 10 2% 13 2% 11 2% 10 2% 9Administrative tasks 2% 12 2% 10 1% 7 4% 22 2% 11 2% 8Breaks 8% 44 9% 50 8% 43 8% 44 7% 37 7% 40Various 2% 19 3% 14 3% 14 3% 20 2% 15 47% 262Factors Describing the ClustersWorkday was good 63% 60% 74% 50% 48% 40%Workday was typical 66% 65% 72% 61% 50% 40%Works in a private office 46% 47% 40% 60% 57% 75%Is a junior developer 71% 69% 65% 41% 29% 56%Years of Experience 8.9 8.8 9.4 12.0 13.0 12.0Total time spent (in hrs) 9.2 8.9 9.0 9.1 9.0 9.4
especially in meetings, with emails and helping others, thanon development heavy days (C1-C3). Meetings, however,account only for about half the time than on a ‘MeetingDay”. This workday was only perceived as good by half therespondents (50%) and is experienced more often by senior(59%) than junior (41%) developers. On a “Meeting Day”(C5), developers spend on average more than 4 hours or 46%of their workday in meetings. The majority of developers inthis cluster are senior developers (71%). Also, time spent withemails is higher than on workdays with a bigger focus ondevelopment (C1-C3). Overall, developers who experiencea meeting workday, spend on average just about one and ahalf hours in development related activities. Only 50% of thedevelopers in this cluster perceived their previous “MeetingDay” as typical. As only 8.5% of the respondents (N=504)belong to this cluster, developers are less likely to experiencea meeting day. Finally, on a “Various Day” (C6), developersspend more than 4 hours with activities mapped to thecategory Various. This includes setting up the infrastructure,working in support, and on a deployment. With only 1.6%(N=94) respondents belonging into the cluster it is the rarestworkday type, the longest workday, and the workday thatwas most often considered as atypical and bad.
We make the following observations based on the results:
• The number of good workdays in each cluster confirmsagain that many developers feel more positive on work-days they can work alone and focus most of their time ondevelopment related activities.
• What developers consider a good workday also varieswith their seniority. Similarly, senior developers experiencemore atypical days than junior developers.
• Developers experience development heavy workdays (C1-C3) as more typical than the other workdays.
• Senior developers have more days that include collabora-
tion, such as meetings, planning and specification and areless likely to have development-heavy workdays (C1-C3).
• Overall, average workday lengths are very similar, differ-ing only up to half an hour.
• On average, respondents who experienced a developmentheavy workday (C1-C3) have about 3 years less develop-ment experience.
6.4 CollaborationPrevious work has described interruptions as one of thebiggest impediments to productive work [22], [23]. Also,meetings have been shown to account for a big chunk of adeveloper’s workday, but their usefulness and value is oftenquestioned [9]. Since most of the time developers spend indevelopment-unrelated activities is of a collaborative nature,we wanted to better understand how the two most frequentcollaborative aspects, meetings and interruptions, impactgood and typical workdays (RQ4). Note that we did notinclude the project phase in this analysis, as respondentswere not specificly asked to report it in the survey.
Data Analysis. To study how collaboration impactsdevelopers assessments of good and typical workdays, weselected 8 aspects related to interruptions and meetings. Foreach aspect, we asked a random 10% subset of respondentsto self-report the time needed, total number, or percentage.After cleaning the data and removing a few outliers (<1%per aspect), we correlated the aspect with respondents’assessments of good and typical workdays. To test whetherthere is a significant statistical difference between each, goodand typical workdays, and the aspect, we use non-parametricWilcoxon signed-rank tests (95% confidence interval). Wecorrected all p-values for multiple hypothesis testing, usingthe Benjamini-Hochberg correction [68]. In the results thatfollow, we describe the relationship as significant if the p-
PRE-PRINTIEEE TRANSACTIONS ON SOFTWARE ENGINEERING 12
value is less than 0.05. In these cases, we include the p-valueof the Wilcoxon test inline.
Results. The mean values for each aspect, presented forgood, typical and combined workdays, are shown in Table 5.We present some key observations:
(5a) Overall, developers had on average 4.66 interrup-tions on their past workday. Surprisingly, on typical work-days, the number of interruptions are significantly higherthan on atypical workdays (p < 0.001). There is also strongevidence (i.e. a significance correlation) that interruptionsare lower on good workdays (p < 0.001). Developers whoperceived their workday as good experienced about oneinterruption less than developers on a bad workday.
(5b) Previous work has found that developers typicallytake around 15 minutes to resume after an interruption [69].In our survey, respondents self-reported it took them onaverage less than ten minutes. Overall, the time needed toresume an interruption is similar, independent of whether itis perceived as good and typical.
(5c) The longest period developers could work on codewithout an interruption was 47.3 minutes, on average.On good (p < 0.001) and typical (p = 0.002) workdays,developers get significantly longer chunks of uninterruptedcoding time. On atypical and bad workdays, it is on averagearound 40 minutes.
(5d) Developers see meetings often as an inefficientuse of time. While the results presented above indicatedevelopers are preferring coding over meetings, they stillconsider the majority of meetings as useful, independentlyof whether it was a good and typical day. The percentage ofuseful meetings has a significant impact on if a workday isconsidered good (p = 0.035), but not on if it was typical. Onatypical workdays, meetings are generally seen as a bit morevaluable, probably because they are more irregular and lessroutine meetings.
(5e) Impromptu sync-up meetings are short interrup-tions from co-workers in the developers’ office to answer aquestion. Respondents experienced on average about twoimpromptu sync-up meetings on their previous workday.
(5f) Unplanned meetings are more formal and less ad-hoc than impromptu sync-ups, but are not stored as calendarappointments like planned meetings. Developers rarely haveunplanned meetings, overall less than one a day. On goodworkdays, the number of unplanned meetings is significantlylower than on bad days (p = 0.002).
(5g) When they do happen, unplanned meetings accountfor slightly more than a quarter hour on good and almosthalf an hour on bad workdays. On these bad workdays,unplanned meetings take significantly more time (p = 0.001).
(5h) Of the total time spent at work, developers spentaround 20% in (and preparing) meetings. On good andtypical workdays, the percentage of time spent in meetingsis slightly lower (only significant for good workdays, p =0.002). The highest percentage of time spent in meetings is ondays developers perceive as good and atypical, suggestingthat the unusual meetings (those that happen on atypicaldays) are often considered as constructive and valuable (seeSection 5.1.2).
7 MAKING GOOD DAYS TYPICAL
Our findings contribute new knowledge about factors thatimpact good and typical workdays and how developers’
TABLE 5How meetings and interruptions influence good and typical workdays.
Significant relationships between the aspect and good or typicalworkdays are visualized in bold (α<0.05).
Aspect Typ-ical
Atyp-ical
Good Bad Total
a) Number of Interruptions 4.80 4.43 4.30 5.24 4.66b) Minutes needed to resume workafter an interruption (in mins)
8.55 8.81 8.19 9.29 8.64
c) Longest period of uninterruptedcoding time (in mins)
50.3 42.4 52.9 39.3 47.3
d) Percentage of useful meetings 56.6% 61.7% 61.2% 54.8% 58.5%e) Number of impromptu sync-ups 2.15 2.30 2.15 2.50 2.20f) Number of unplanned meetings 0.61 0.63 0.51 0.84 0.62g) Total time spent in unplannedmeetings (in mins)
21.1 22.1 16.6 28.8 21.5
h) Percentage of total time spent inmeetings
17.7% 22.7% 18.4% 21.4% 19.5%
work differs on these days. In this section, we discuss howresearchers and managers can apply them to make gooddays typical and to improve developers’ productivity andjob satisfaction in the workplace.
7.1 Optimizing Developer WorkdaysOur results provide insights into factors that impact howdevelopers’ good and typical workdays are perceived andhow they define them. This allows individuals, team leadsand managers to prioritize and target actions that improveprocesses and tools, and ultimately productivity. For ex-ample, many developers are unhappy when they work onmundane or repetitive tasks [13]. On the contrary, timepressure and deadlines were found to be major causes forstress [37], [38] and unhappiness [13]. Our results suggestways to reduce these bad days and make good days typical(i.e. more routine). Generally, it is advisable to minimizeadministrative tasks and infrastructure issues, and reduceinterruptions and meetings. Developers gain back time theycan spend on their coding tasks and increase their job satisfac-tion. This is especially important for junior developers, whotend to spend most of their time with development-heavyactivities such as coding, testing and bugfixing. During thesetasks, they need to be able to focus for long chunks of time,without interruptions. Uninterrupted work might be easier toachieve in smaller offices shared with only a few colleagues,rather than the currently omnipresent open-plan offices.During phases or days that require a lot of collaboration,coordination and many meetings (e.g. planning, specificationand release phase), the team could move to an open-planoffice. To accommodate these changing needs for office space,teams could switch with another team that is working withreversed phases.
Our results further suggest ways to make atypical daysgood, e.g. by working from home on tasks that require alot of attention and focus, by scheduling no-meeting days,by planning to do little coding during planning phases,or by using slow times (e.g. project wrap-up) for side-projects. Working from home was previously shown toincrease knowledge worker job satisfaction, since it increasesflexibility of working at one’s own pace, allows planningactive working hours at times of higher focus and motivation,and in quieter work environments [70], [71], [72]. Dayson which meetings are grouped together allow teams tocollaborate, discuss and plan intensively, and days when nomeetings are scheduled allow teams to work more focused,

PRE-PRINTIEEE TRANSACTIONS ON SOFTWARE ENGINEERING 13
reducing context-switching and interruptions [73], [74].Common in these examples is that individuals and teamsorganize their work to be atypical on purpose, which madethese days more positive and productive. In our analysisof workday types (see Section 6.3), we found that seniordevelopers experience more atypical workdays than juniordevelopers. This is likely the case because they experiencemore “collaborating days” and “meeting days”, making itmore difficult to plan out and control one’s workday. Besidesthe beforementioned approaches on making meetings moreefficient, other research focused on approaches that reducethe amount of time senior developers need to spend withrandomization and helping out, leaving more time to workon their main coding tasks. This includes expert-findingsystems to interrupt fewer people with inquiries (e.g. [75],[76]), more efficiently exchanging knowledge and learnings(e.g. [77], [78]), increasing team awareness (e.g. [79], [80],[81]), and more efficiently dealing with emails (e.g. [82],[83]). Finally, spending more quality time on activities mostdescribed as good days (e.g. coding and learning) couldfurther make senior developers’ often randomized, atypicalworkdays good.
From our work, it remains unclear how much consistencyover days developers expect and how often they appreciatenon-routine atypical workdays. We could imagine thatoccasionally breaking the routine will also avoid boredomand will make work more exciting overall. However, theever-changing project phases and various activities pursuedat work might already be sufficient to avoid routine. Havingnow a better understanding of the factors that influencedevelopers’ assessments of good and typical workdays,future work could explore how the company culture, devel-opment processes, developers’ gender (e.g. GenderMag [84])and personas (e.g. Developers’ Productivity Perception Per-sonas [85]) influence how pronounced these factors are.For example, standardized questionnaires from psychologycould be leveraged to include perspectives on developers’personality (e.g. BFI-2 [86]), impulsivity (e.g. UPPS [87])or ability to self-control (Cognitive Absorption Scale [88]).Getting more insights into the distinctness of these factorscould help individuals, teams and managers to prioritizeimprovements at the workplace better.
7.2 Agency: Manage Competition for Attention & Time
Our results highlight that developers face a constant com-petition for attention and time between their main codingtasks (i.e. individual productivity) and collaborating withtheir team (i.e. team productivity). While they generallyunderstand the importance of team collaboration, not everydeveloper perceived it as an efficient and productive useof their time. Developers’ workdays are often disruptedby activities they have little control and autonomy over(e.g. meetings scattered over the day, interruptions fromco-workers asking for help). These disruptions fragmentdevelopers’ workdays, allowing them to only spend littletime focused on their coding tasks before switching tothe next topic [10], [61]. This increases frustration andtensions in the team. Thus, being able to freely controlhow to best organize one’s workday and whether it goesas planned/expected or is disrupted by external factorsis important. For example, allowing developers to “veto”
meeting requests can help avoid scattering meetings acrossthe workday that leave very little time to make progresin-between them. In Sociology, this notion is known asagency, and describes “the capacity of individuals to actindependently and to make their own free choices” [89]. Thefinding of the importance of agency is in line with previouswork in psychology, in which increased autonomy in a high-variety task led to increased satisfaction [90]. Similarly, astudy with students showed that higher levels of autonomyare related to higher well-being and better outcomes [5].Agency is related to the concept of daily job crafting, the self-induced changes that employees make in their job demandsand resources to meet and/or optimize their work goals [91].These changes can have positive impacts on motivation [92]and performance [91].
Previous work has suggested a plurality of approachesthat allow knowledge workers to better manage their ownworkdays and improve collaboration. This includes avoidinginterruptions from co-workers at inopportune moments [93],reducing distractions from communication channels [94], [95],having flexible work hours [96], improving the schedulingof meetings between timezones [97], [98], and makingdistributed meetings more efficient [99], [100]. Since theseexamples are founded in other knowledge work settings,future work could study how to adapt them to the softwareengineering domain and allow developers to better controland optimize their time.
Our work refines previous work that found developersconsider most meetings and interruptions as unproductive.We found that during non-development phases, they arecommon and (usually) productive. We should activelywork on reducing interruptions and meetings during thedevelopment phase (and on development-heavy days), andencourage them at times when collaboration is most crucial,such as phases of planning/specification, testing and release.Finally, we learnt that senior developers appreciate collab-oration generally more than junior developers, suggestingthe value of collaboration changes with experience. Thisfinding is in line with recent work that found motivation andjob satisfaction at work is changing as individuals age [72].
7.3 Evaluation of Contributions at Work
The competing interests between individual productivityand team productivity also highlight potential issues in howwe evaluate success and measure productivity at work.Our findings indicate that developers who reflect aboutsuccessful work mostly consider the produced output, andvalue collaborative work much lower. This is why on goodand typical days, the majority of developers reported makinga lot of progress on their coding tasks and producing alot of output (49.4%), rather than focussing on contribut-ing something meaningful (6.4%), learning something new(4.7%), or helping a team-mate to make progress (4.7%).Initial discussions with a few project managers at thecorporation confirmed this interpretation. According to them,many teams are starting to consider developers’ support toother team-members, and contributions to other teams andeven external (open-source) projects when evaluating theperformance in job reviews and salary discussions. This issimilar to reports from industry, where developers are notonly evaluated by their managers but also their peers, or

PRE-PRINTIEEE TRANSACTIONS ON SOFTWARE ENGINEERING 14
where developers can recommend a small monetary bonusto another developer for great work done [101].
While our study with software developers showed thatlearning something new was rarely (4.7%) mentioned asa reason for a successful day, a study focusing on Ko-rean knowledge workers found that career satisfaction ispredicted by an organization’s learning culture and goalorientation [102]. According to Hofestede’s dimension ofmasculinity/femininity, masculine cultures focus more oncompetition and success, while more feminine ones on doingwhat one likes [103]. These examples suggest that reflectingabout (successful) work needs to be considered as a separatevariable in future work, to better understand how differencesin company culture, job profile, goal orientation and gendercould impact how developers reflect about their work.
8 THREATS TO VALIDITY
8.1 External ValidityThe main threat to the generalizability and validity ofour results is the external validity. Since our survey wasconducted at only one large organization, it is unclear howrepresentative our results are of the views of all softwaredevelopers, especially from smaller companies or open-source projects. Microsoft employs over thirty thousanddevelopers, who are working on various projects targetingprivate and commercial users, and at different stages oftheir projects. Survey respondents work in teams of differentsizes, at various locations, using varying technology andprocesses. Many teams in the organization have come fromacquisitions of smaller companies or startups, and theirdevelopment processes and tools have remained largelyuntouched. According to Microsoft’s yearly diversity report 5,the distribution of developers in the United States (US) wasthe following in 2018: 50.9% Caucasian, 39.2% Asian, 4.5%Hispanic, 2.8% African-American, and 2.6% other. 19.9%identify as female, 80% male, and 0.1% as other. At the timeof taking our survey, all participants resided in the greaterSeattle area in Washington state, US. Thus, while all of thedevelopers we studied are part of a single organization,we are confident to achieve some level of external validityand generalizability, based on the variation in paricipants’context, environment, culture, and experience, as well asthe large sample size. Finally, single-case empirical studieshave been shown to contribute to scientific discovery [104].Nonetheless, future work could consider additional variables,such as the company culture and size, and developers’gender, personality, and goal orientation.
8.2 Construct ValidityIn Section 5.1.1, we described how we analyzed the surveyresponses using methods common in the Grounded Theoryapproach by Corbin and Strauss [58]. One potential threatcould be that the Open Coding step was performed by oneauthor only. To reduce bias, we discussed 10-30 representa-tive quotes for each coded category as a team, and collectivelymapped all responses that could not distincitvely be mappedto a category. All subsequent steps, including Axial andSelective Coding and the development of the conceptual
5. https://www.microsoft.com/en-us/diversity/inside-microsoft/default.aspx
frameworks, were performed iteratively with three or allfour authors present.
8.3 Internal Validity
Selecting developers randomly with replacement whensending out the survey invitations via email might pose arisk to internal validity. Since all responses were anonymous,we cannot know the exact number of people who took thesurvey more than once and how much time was betweenthe two responses. We, however, expect the number to below, since from the 43.8% of participants who voluntarilyrevealed their identity, only 6.6% responded twice, and noone repeated more than once. Since the survey invitationswere sent out over the course of 4 months, we further alsoexpect the number of responses from the same participantwithin subsequent days to be very low. Thus, we believethat the large amount of participants (N=5971) reporting atrandom workdays and varying stages of their projects is afairly representative sample of how developer workdays looklike. Future work could consider how developers’ decisionto participate in the survey and more importantly, theiranswers are affected by their experiences of the previousworkday and their personality. For example, previous workshowed that well-being on the preceding day can affectthe well-being on the subsequent day [5] and, hence, couldhave affected our respondents’ self-reports of how goodtheir previous workday was. Similarly and with respect topersonality, people who are generally more likely to respondto surveys are conscientious [105], agreeable [105], [106],[107] and open to new experiences [106], [107]. Our samplemight not accurately represent developers who do not fitinto these personality groups.
Another limitation of our study could be that we studieddevelopers’ workdays based on their self-reports and onlyon one day (and in a few cases two days) per developer. Wediscuss our rationale behind the study design in detail inSection 4. We are confident of the soundness of our design,also because our results replicate comparable findings (e.g.time spent on activities and the high cost of interruptionsand meetings) from previous work that applied differingmethods (e.g. observations, tracking).
The survey structure and formulation might be sourceof further risks to internal validity. For example, askingdevelopers whether they consider their workday as goodand typical after asking them to self-report their timespent at work might have framed participants. Anotherpotential framing threat is the positioning of the demographicquestions in the beginning of the survey, which might havecaused a Stereotype Threat [108]. For example, a developerworking in an open-plan office and not liking this might havebeen reminded of the fact when answering the survey. Futurework should redress this threat by placing the demographicquestions at the end of the survey [109], [110].
We also acknowledge that typicality and goodness ofworkdays are not binary ratings in reality, as several factorscould influence the assessment of a workday to be rathertypical or rather atypical, for example. However, for the sakeof first identifying the factors that influence what contributesto a good and typical workday, we decided that using adichotomous variable makes more sense. Dichotomizationwas also described as a standard practice in empirical

PRE-PRINTIEEE TRANSACTIONS ON SOFTWARE ENGINEERING 15
research, to avoid nominal scale violations [111]. In theinterviews, we noticed that there is no consensus betweenwhether writing code and debugging is the same activity.Hence, in the survey, we asked developers to distinguishbetween writing code and debugging when reporting thetime spent. An additional control question revealed that 58%distinguish between writing code and debugging, while 42%do not.
9 CONCLUSION
We extend previous work on understanding developerworkdays by adding two new perspectives: what makesa workday good and typical. We report on aspects thatcharacterize what makes developers consider workdays goodand typical, and how managers can leverage them to makegood workdays typical. On good workdays, developers makeprogress and create value on projects they consider meaning-ful, and spend their time efficiently, with little randomization,administrative work and infrastructure issues. What makes aworkday typical is primarily assessed by the match betweendevelopers’ expectations and the reality. Amongst otheraspects, this match is heavily influenced by the time theyspend on different activities, external factors they have littlecontrol over, and the current development phase. Sincedevelopers often complain meetings and interruptions areunproductive, prior work concludes that they are bad overall.Surprisingly, we find that their impact on productivity andjob satisfaction depends on the development phase: duringspecification/planning and release phases, they are common,but constructive. Another key finding is the importance ofagency, control over one’s workday and whether it goes asplanned and expected, or is disrupted by external factors.Our work provides a holistic perspective on how developersthink these aspects influence their workdays and helpsprioritize process and tool improvements. For example, oneunexpected finding is to de-emphasize email, contrary towhat was suggested by related work.
Our results stem from a large-scale survey with 5971responses, where professional software developers reflectedabout what made their workdays good and typical, andwhere they self-reported how they spent their time on theprevious workday. In contrast to related work using pri-marily automated tracking, by using self-reports we captureunanticipated events in each developer’s own classificationat scale. Our scale also gives us the resolution to uncovernuances, e.g. what makes developers happy and satisfiedvaries with their seniority.
10 ACKNOWLEDGEMENTS
We thank our study participants for their participation. Wealso thank the anonymous reviewers and our editor for theirvaluable feedback.
REFERENCES
[1] D. Graziotin, X. Wang, and P. Abrahamsson, “Happy softwaredevelopers solve problems better: psychological measurements inempirical software engineering,” PeerJ, vol. 2, p. 289, 2014.
[2] ——, “Software developers, moods, emotions, and performance,”IEEE Software, vol. 31, no. 4, pp. 24–27, 2014.
[3] ——, “Do feelings matter? on the correlation of affects and the self-assessed productivity in software engineering,” Journal of Software:Evolution and Process, vol. 27, no. 7, pp. 467–487, 2015.
[4] T. Amabile and S. Kramer, The progress principle: Using small winsto ignite joy, engagement, and creativity at work. Harvard BusinessPress, 2011.
[5] K. M. Sheldon, R. Ryan, and H. T. Reis, “What makes for a goodday? competence and autonomy in the day and in the person,”Personality and social psychology bulletin, vol. 22, no. 12, pp. 1270–1279, 1996.
[6] D. E. Perry, N. A. Staudenmayer, and L. G. Votta, “People,organizations, and process improvement,” IEEE Software, vol. 11,no. 4, pp. 36–45, 1994.
[7] M. K. Goncalves, L. de Souza, and V. M. Gonzalez, “Collaboration,information seeking and communication: An observational studyof software developers’ work practices,” Journal of UniversalComputer Science, vol. 17, no. 14, pp. 1913–1930, 2011.
[8] J. Singer, T. Lethbridge, N. Vinson, and N. Anquetil, “An exami-nation of software engineering work practices,” in CASCON FirstDecade High Impact Papers, ser. CASCON ’10. IBM Corporation,2010, pp. 174–188.
[9] A. N. Meyer, T. Fritz, G. C. Murphy, and T. Zimmermann,“Software developers’ perceptions of productivity,” in Proceedingsof the 22Nd ACM SIGSOFT International Symposium on Foundationsof Software Engineering, ser. FSE 2014. ACM, 2014, pp. 19–29.
[10] A. N. Meyer, L. E. Barton, G. C. Murphy, T. Zimmermann, andT. Fritz, “The Work Life of Developers: Activities, Switches andPerceived Productivity,” Transactions of Software Engineering, pp.1–15, 2017.
[11] X. Xia, L. Bao, D. Lo, Z. Xing, A. E. Hassan, and S. Li, “MeasuringProgram Comprehension: A Large-Scale Field Study with Pro-fessionals,” IEEE Transactions on Software Engineering, pp. 1–26,2017.
[12] S. Astromskis, G. Bavota, A. Janes, B. Russo, and M. D. Penta,“Patterns of developers’ behaviour: A 1000-hour industrial study,”Journal of Systems and Software, vol. 132, pp. 85–97, 2017.
[13] D. Graziotin, F. Fagerholm, X. Wang, and P. Abrahamsson, “Onthe Unhappiness of Software Developers,” in Proceedings of the 21stInternational Conference on Evaluation and Assessment in SoftwareEngineering. ACM, 2017, pp. 324–333.
[14] G. Mark, D. Gudith, and U. Klocke, “The Cost of InterruptedWork : More Speed and Stress,” in CHI 2008: Proceedings of theSIGCHI Conference on Human Factors in Computing Systems, 2008,pp. 107–110.
[15] F. P. Brooks Jr, The Mythical Man-Month: Essays on SoftwareEngineering, Anniversary Edition, 2/E. Pearson Education India,1995.
[16] T. D. LaToza, G. Venolia, and R. DeLine, “Maintaining mentalmodels: a study of developer work habits,” in Proceedings of the28th international conference on Software engineering. ACM, 2006,pp. 492–501.
[17] R. Minelli, A. Mocci, and M. Lanza, “I Know What You DidLast Summer – An Investigation of How Developers Spend TheirTime,” Proceedings of ICPC 2015 (23rd IEEE International Conferenceon Program Comprehension), pp. 25—-35, 2015.
[18] S. Amann, S. Proksch, S. Nadi, and M. Mezini, “A study of visualstudio usage in practice,” in Proceedings of the 23rd IEEE Interna-tional Conference on Software Analysis, Evolution, and Reengineering(SANER ’16), 2016.
[19] M. Beller, G. Gousios, A. Panichella, S. Proksch, S. Amann, andA. Zaidman, “Developer Testing in The IDE: Patterns, Beliefs, andBehavior,” IEEE Transactions on Software Engineering, vol. 14, no. 8,pp. 1–23, 2017.
[20] E. Goodman, M. Kuniavsky, and A. Moed, “Observing theuser experience: A practitioner’s guide to user research (secondedition),” IEEE Transactions on Professional Communication, vol. 56,no. 3, pp. 260–261, 2013.
[21] C. Parnin and S. Rugaber, “Resumption strategies for interruptedprogramming tasks,” Software Quality Journal, vol. 19, no. 1, pp.5–34, 2011.
[22] B. P. Bailey, J. A. Konstan, and J. V. Carlis, “The effects ofinterruptions on task performance, annoyance, and anxiety inthe user interface.” in Interact, vol. 1, 2001, pp. 593–601.
[23] M. Czerwinski, E. Horvitz, and S. Wilhite, “A diary study oftask switching and interruptions,” in Proceedings of the SIGCHIconference on Human factors in computing systems. ACM, 2004, pp.175–182.
[24] M. Mazmanian, “Avoiding the trap of constant connectivity: Whencongruent frames allow for heterogeneous practices,” Academy ofManagement Journal, vol. 56, no. 5, pp. 1225–1250, 2013.
[25] L. A. Dabbish and R. E. Kraut, “Email overload at work: ananalysis of factors associated with email strain,” in Proceedings

PRE-PRINTIEEE TRANSACTIONS ON SOFTWARE ENGINEERING 16
of the 2006 20th anniversary conference on Computer supportedcooperative work. ACM, 2006, pp. 431–440.
[26] S. R. Barley, D. E. Meyerson, and S. Grodal, “E-mail as a sourceand symbol of stress,” Organization Science, vol. 22, no. 4, pp.887–906, 2011.
[27] S. C. Muller and T. Fritz, “Stuck and frustrated or in flowand happy: Sensing developers’ emotions and progress,” inSoftware Engineering (ICSE), 2015 IEEE/ACM 37th IEEE InternationalConference on, vol. 1. IEEE, 2015, pp. 688–699.
[28] S. Beecham, N. Baddoo, T. Hall, H. Robinson, and H. Sharp,“Motivation in software engineering: A systematic literaturereview,” Information and Software Technology, vol. 50, no. 9, pp.860 – 878, 2008.
[29] Y.-h. Kim and E. K. Choe, “Understanding Personal Productivity:How Knowledge Workers Define,” in Proceedings of the 2019 CHIConference on Human Factors in Computing Systems - CHI ’19, no.May, 2019.
[30] G. Mark, S. T. Iqbal, M. Czerwinski, P. Johns, and A. Sano,“Neurotics Can’t Focus: An in situ Study of Online Multitasking inthe Workplace,” in Proceedings of the SIGCHI Conference on HumanFactors in Computing Systems, 2016, pp. 1739–1744.
[31] I. A. Khan, W.-P. Brinkman, and R. M. Hierons, “Do moods affectprogrammers’ debug performance?” Cognition, Technology & Work,vol. 13, no. 4, pp. 245–258, 2010.
[32] C. D. Fisher, “Mood and emotions while working: missing piecesof job satisfaction?” Journal of Organizational Behavior, vol. 21, no. 2,pp. 185–202, 2000.
[33] B. L. Fredrickson, M. A. Cohn, K. A. Coffey, J. Pek, and S. M.Finkel, “Open hearts build lives: positive emotions, inducedthrough loving-kindness meditation, build consequential personalresources.” Journal of personality and social psychology, vol. 95, no. 5,p. 1045, 2008.
[34] E. Ouweneel, P. M. Le Blanc, W. B. Schaufeli, and C. I. van Wijhe,“Good morning, good day: A diary study on positive emotions,hope, and work engagement,” Human Relations, vol. 65, no. 9, pp.1129–1154, 2012.
[35] B. E. Kahn and A. M. Isen, “The influence of positive affecton variety seeking among safe, enjoyable products,” Journal ofConsumer Research, vol. 20, no. 2, pp. 257–270, 1993.
[36] B. L. Fredrickson, “What good are positive emotions?” Review ofgeneral psychology, vol. 2, no. 3, p. 300, 1998.
[37] G. Mark, S. T. Iqbal, M. Czerwinski, and P. Johns, “Bored mondaysand focused afternoons: The rhythm of attention and onlineactivity in the workplace,” in Proceedings of the SIGCHI Conferenceon Human Factors in Computing Systems. ACM, 2014, pp. 3025–3034.
[38] S. Melamed, I. Ben-Avi, J. Luz, and M. S. Green, “Objective andsubjective work monotony: Effects on job satisfaction, psycholog-ical distress, and absenteeism in blue-collar workers.” Journal ofApplied Psychology, vol. 80, no. 1, p. 29, 1995.
[39] R. Tourangeau, L. J. Rips, and K. Rasinski, The psychology of surveyresponse. Cambridge University Press, 2000.
[40] N. M. Bradburn, “Recall period in consumer expenditure surveysprogram,” 2010.
[41] R. L. Hudson and J. L. Davis, “The effects of intralist cues, extralistcues, and category names on categorized recall,” PsychonomicScience, vol. 29, no. 2, pp. 71–75, 1972.
[42] F. S. Bellezza and T. C. Hartwell, “Cuing subjective units,” TheJournal of Psychology, vol. 107, no. 2, pp. 209–218, 1981.
[43] E. Tulving and Z. Pearlstone, “Availability versus accessibility ofinformation in memory for words,” Journal of Verbal Learning andVerbal Behavior, vol. 5, no. 4, pp. 381–391, 1966.
[44] N. Schwarz and D. Oyserman, “Asking Questions About Behavior:Cognition, Communication, and Questionnaire Construction,”American Journal of Evaluation, vol. 22, no. 2, pp. 127–160, 2001.
[45] E. Babbie, The practice of social research. Nelson Education, 2015.[46] G. Guest, A. Bunce, and L. Johnson, “How many interviews are
enough? an experiment with data saturation and variability,” Fieldmethods, vol. 18, no. 1, pp. 59–82, 2006.
[47] D. Spencer, Card sorting: Designing usable categories. RosenfeldMedia, 2009.
[48] B. A. Kitchenham and S. L. Pfleeger, “Personal opinion surveys,”in Guide to advanced empirical software engineering. Springer, 2008,pp. 63–92.
[49] W. W. Daniel and C. L. Cross, Biostatistics: a foundation for analysisin the health sciences. Wiley, 2018.
[50] T. Punter, M. Ciolkowski, B. Freimut, and I. John, “Conductingon-line surveys in software engineering,” in Empirical Software
Engineering, 2003. ISESE 2003. Proceedings. 2003 InternationalSymposium on. IEEE, 2003, pp. 80–88.
[51] L. L. Stinson, “Measuring how people spend their time: a time-usesurvey design,” Monthly Lab. Rev., vol. 122, p. 12, 1999.
[52] G. Menon, “Judgments of behavioral frequencies: Memory searchand retrieval strategies,” in Autobiographical Memory and theValidity of Retrospective Reports, N. Schwarz and S. Sudman, Eds.Springer, 1994, pp. 161–172.
[53] E. Blair and S. Burton, “Cognitive processes used by surveyrespondents to answer behavioral frequency questions,” Journal ofconsumer research, vol. 14, no. 2, pp. 280–288, 1987.
[54] N. M. Bradburn, L. J. Rips, and S. K. Shevell, “Answeringautobiographical questions: The impact of memory and inferenceon surveys,” Science, vol. 236, no. 4798, pp. 157–161, 1987.
[55] S. Sudman and N. M. Bradburn, “Effects of time and memoryfactors on response in surveys,” Journal of the American StatisticalAssociation, vol. 68, no. 344, pp. 805–815, 1973.
[56] J. Neter and J. Waksberg, “A study of response errors in expen-ditures data from household interviews,” Journal of the AmericanStatistical Association, vol. 59, no. 305, pp. 18–55, 1964.
[57] R. A. LeBoeuf and E. Shafir, “Anchoring on the” here” and” now”in time and distance judgments.” Journal of Experimental Psychology:Learning, Memory, and Cognition, vol. 35, no. 1, p. 81, 2009.
[58] A. Strauss and J. Corbin, Basics of Qualitative Research: Techniquesand Procedures for Developing Grounded Theory. Sage Publishing,1998.
[59] K. Charmaz, Constructing grounded theory. Sage, 2014.[60] K.-J. Stol, P. Ralph, and B. Fitzgerald, “Grounded theory in
software engineering research,” Proceedings of the 38th InternationalConference on Software Engineering - ICSE ’16, no. Aug 2015, pp.120–131, 2016.
[61] V. M. Gonzalez and G. Mark, “Constant, constant, multi-taskingcraziness: Managing multiple working spheres,” in Proceedings ofthe SIGCHI Conference on Human Factors in Computing Systems, ser.CHI ’04. ACM, 2004, pp. 113–120.
[62] T. Althoff, E. Horvitz, R. W. White, and J. Zeitzer, “Harnessingthe web for population-scale physiological sensing: A case studyof sleep and performance,” in Proceedings of the 26th InternationalConference on World Wide Web. International World Wide WebConferences Steering Committee, 2017, pp. 113–122.
[63] A. Murgia, P. Tourani, B. Adams, and M. Ortu, “Do developersfeel emotions? an exploratory analysis of emotions in softwareartifacts,” in Proceedings of the 11th Working Conference on MiningSoftware Repositories, ser. MSR 2014. ACM, 2014, pp. 262–271.
[64] M. Claes, M. V. Mantyla, M. Kuutila, and B. Adams, “Do program-mers work at night or during the weekend?” in Proceedings of the40th International Conference on Software Engineering. ACM, 2018,pp. 705–715.
[65] Y. Lott and H. Chung, “Gender discrepancies in the outcomesof schedule control on overtime hours and income in germany,”European Sociological Review, vol. 32, no. 6, pp. 752–765, 2016.
[66] I. Kandolin, M. Harma, and M. Toivanen, “Flexible working hoursand well-being in finnland,” Journal of Human Ergology, vol. 30, no.1-2, pp. 35–40, 2001.
[67] L. Kaufman and P. Rousseeuw, Clustering by means of medoids.North-Holland, 1987.
[68] Y. Benjamini and Y. Hochberg, “Controlling the false discoveryrate: a practical and powerful approach to multiple testing,”Journal of the royal statistical society. Series B (Methodological), pp.289–300, 1995.
[69] R. Van Solingen, E. Berghout, and F. Van Latum, “Interrupts: justa minute never is,” IEEE software, no. 5, pp. 97–103, 1998.
[70] T. J. Van Der Voordt, “Productivity and employee satisfaction inflexible workplaces,” Journal of Corporate Real Estate, vol. 6, no. 2,pp. 133–148, 2004.
[71] J. Ruostela, A. Lonnqvist, M. Palvalin, M. Vuolle, M. Patjas,and A.-L. Raij, “‘new ways of working’ as a tool for improvingthe performance of a knowledge-intensive company,” KnowledgeManagement Research & Practice, vol. 13, no. 4, pp. 382–390, 2015.
[72] M. Rozman, S. Treven, and V. Cancer, “Motivation and satisfactionof employees in the workplace,” Business Systems Research Journal,vol. 8, 09 2017.
[73] P. G. Lange, “Interruptions and intertasking in distributed knowl-edge work,” NAPA Bulletin, vol. 30, no. 1, pp. 128–147, 2008.
[74] B. Donohue, “Three-day no-meeting schedule forengineers,” https://medium.com/@Pinterest Engineering/three-day-no-meeting-schedule-for-engineers-fca9f857a567, 2019.
[75] A. Mockus and J. D. Herbsleb, “Expertise browser: a quantitativeapproach to identifying expertise,” in Proceedings of the 24th

PRE-PRINTIEEE TRANSACTIONS ON SOFTWARE ENGINEERING 17
International Conference on Software Engineering. ICSE 2002, 2002,pp. 503–512.
[76] K. Balog, L. Azzopardi, and M. de Rijke, “Formal modelsfor expert finding in enterprise corpora,” in Proceedings of the29th Annual International ACM SIGIR Conference on Research andDevelopment in Information Retrieval, ser. SIGIR ’06. ACM, 2006,pp. 43–50.
[77] T. Fritz and G. C. Murphy, “Using information fragments toanswer the questions developers ask,” in Proceedings of the 32ndACM/IEEE International Conference on Software Engineering - Volume1, vol. 1. ACM Press, 2010, p. 175.
[78] M. Robillard, R. Walker, and T. Zimmermann, “Recommendationsystems for software engineering,” IEEE Software, vol. 27, no. 4,pp. 80–86, 2010.
[79] J. T. Biehl, M. Czerwinski, G. Smith, and G. G. Robertson,“Fastdash: A visual dashboard for fostering awareness in softwareteams,” in Proceedings of the SIGCHI Conference on Human Factorsin Computing Systems, ser. CHI ’07. ACM, 2007, pp. 1313–1322.
[80] A. Sarma, Z. Noroozi, and A. Van Der Hoek, “Palantır: raisingawareness among configuration management workspaces,” inSoftware Engineering, 2003. Proceedings. 25th International Conferenceon. IEEE, 2003, pp. 444–454.
[81] M. R. Jakobsen, R. Fernandez, M. Czerwinski, K. Inkpen, O. Kulyk,and G. G. Robertson, “Wipdash: Work item and people dashboardfor software development teams,” in IFIP Conference on Human-Computer Interaction. Springer, 2009, pp. 791–804.
[82] G. Mark, S. T. Iqbal, M. Czerwinski, P. Johns, and A. Sano, “EmailDuration, Batching and Self-interruption: Patterns of Email Use onProductivity and Stress,” in Proceedings of the 2016 CHI Conferenceon Human Factors in Computing Systems (CHI ’16), vol. 21, no. 1,2016, pp. 98–109.
[83] M. Sappelli, G. Pasi, S. Verberne, M. De Boer, and W. Kraaij,“Assessing e-mail intent and tasks in e-mail messages,” InformationSciences, vol. 358-359, pp. 1–17, 2016.
[84] M. Burnett, S. Stumpf, J. Macbeth, S. Makri, L. Beckwith, I. Kwan,A. Peters, and W. Jernigan, “Gendermag: A method for evaluat-ing software’s gender inclusiveness,” Interacting with Computers,vol. 28, no. 6, pp. 760–787, 2016.
[85] A. N. Meyer, T. Zimmermann, and T. Fritz, “CharacterizingSoftware Developers by Perceptions of Productivity,” in EmpiricalSoftware Engineering and Measurement (ESEM), 2017 InternationalSymposium on, 2017.
[86] C. J. Soto and O. P. John, “The next big five inventory (bfi-2):Developing and assessing a hierarchical model with 15 facets toenhance bandwidth, fidelity, and predictive power.” Journal ofPersonality and Social Psychology, vol. 113, no. 1, pp. 117–143, 2017.
[87] S. P. Whiteside and D. R. Lynam, “The five factor model andimpulsivity: Using a structural model of personality to understandimpulsivity,” Personality and Individual Differences, vol. 30, no. 4,pp. 669–689, 2001.
[88] R. Agarwal and E. Karahanna, “Time Flies When You’re Hav-ing Fun: Cognitive Absorption and Beliefs about InformationTechnology Usage,” MIS Quarterly, vol. 24, no. 4, pp. 665–694,2000.
[89] C. Barker, Cultural studies: Theory and practice. Sage, 2003.[90] N. G. Dodd and D. C. Ganster, “The interactive effects of variety,
autonomy, and feedback on attitudes and performance,” Journalof Organizational Behavior, vol. 17, no. 4, pp. 329–347, 1996.
[91] M. Tims, A. B. Bakker, and D. Derks, “Development and validationof the job crafting scale,” Journal of Vocational Behavior, vol. 80, no. 1,pp. 173 – 186, 2012.
[92] P. Petrou, E. Demerouti, M. C. Peeters, W. B. Schaufeli, andJ. Hetland, “Crafting a job on a daily basis: Contextual correlatesand the link to work engagement,” Journal of OrganizationalBehavior, vol. 33, no. 8, pp. 1120–1141, 2012.
[93] M. Zuger, C. Corley, A. N. Meyer, B. Li, T. Fritz, D. Shepherd,V. Augustine, P. Francis, N. Kraft, and W. Snipes, “ReducingInterruptions at Work: A Large-Scale Field Study of FlowLight,”in Proceedings of the 2017 CHI Conference on Human Factors inComputing Systems (CHI ’17), 2017, pp. 61–72.
[94] M.-A. Storey, A. Zagalsky, F. Figueira Filho, L. Singer, and D. M.German, “How social and communication channels shape andchallenge a participatory culture in software development,” IEEETransactions on Software Engineering, vol. 43, no. 2, pp. 185–204,2017.
[95] G. Mark, M. Czerwinski, and S. T. Iqbal, “Effects of IndividualDifferences in Blocking Workplace Distractions,” in CHI ’18.ACM, 2018.
[96] F. Origo and L. Pagani, “Workplace flexibility and job satisfaction:Some evidence from europe,” International Journal of Manpower,vol. 29, pp. 539–566, 09 2008.
[97] S. Whittaker and H. Schwarz, “Meetings of the board: Theimpact of scheduling medium on long term group coordinationin software development,” Computer Supported Cooperative Work(CSCW), vol. 8, no. 3, pp. 175–205, 1999.
[98] J. C. Tang, C. Zhao, X. Cao, and K. Inkpen, “Your time zoneor mine?: a study of globally time zone-shifted collaboration,”in Proceedings of the ACM 2011 conference on Computer supportedcooperative work. ACM, 2011, pp. 235–244.
[99] M. A. Babar, B. Kitchenham, and R. Jeffery, “Comparing dis-tributed and face-to-face meetings for software architecture eval-uation: A controlled experiment,” Empirical Software Engineering,vol. 13, no. 1, pp. 39–62, 2008.
[100] J. Sutherland, A. Viktorov, J. Blount, and N. Puntikov, “Distributedscrum: Agile project management with outsourced developmentteams,” in System Sciences, 2007. HICSS 2007. 40th Annual HawaiiInternational Conference on. IEEE, 2007, pp. 274a–274a.
[101] L. Goler, J. Gale, and A. Grant, “Let’s not killperformance evaluations yet,” https://hbr.org/2016/11/lets-not-kill-performance-evaluations-yet, 2019.
[102] B. K. B. Joo and S. Park, “Career satisfaction, organizational com-mitment, and turnover intention: The effects of goal orientation,organizational learning culture and developmental feedback,”Leadership & Organization Development Journal, vol. 31, no. 6, pp.482–500, 2010.
[103] G. H. Hofstede, G. Hofstede, and W. A. Arrindell, Masculinityand femininity: The taboo dimension of national cultures. Sage, 1998,vol. 3.
[104] B. Flyvbjerg, “Five misunderstandings about case-study research,”Qualitative inquiry, vol. 12, no. 2, pp. 219–245, 2006.
[105] S. G Rogelberg, J. Conway, M. E Sederburg, C. Spitzmuller, S. Aziz,and W. E Knight, “Profiling active and passive nonrespondents toan organizational survey,” The Journal of applied psychology, vol. 88,pp. 1104–14, 01 2004.
[106] T. L. Tuten and M. Bosnjak, “Understanding differences in webusage: The role of need for cognition and the five factor model ofpersonality,” Social Behavior and Personality: an international journal,vol. 29, no. 4, pp. 391–398, 2001.
[107] B. Marcus and A. Schutz, “Who are the people reluctant toparticipate in research? personality correlates of four differenttypes of nonresponse as inferred from self- and observer ratings,”Journal of Personality, vol. 73, no. 4, pp. 959–984, 2005.
[108] C. Steele and J. Aronson, “Stereotype threat and the intellectualtest-performance of african-americans,” Journal of personality andsocial psychology, vol. 69, pp. 797–811, 12 1995.
[109] L. J. Stricker and W. C. Ward, “Stereotype threat, inquiringabout test takers’ ethnicity and gender, and standardized testperformance1,” Journal of Applied Social Psychology, vol. 34, no. 4,pp. 665–693, 2004.
[110] K. Danaher and C. S. Crandall, “Stereotype threat in appliedsettings re-examined,” Journal of Applied Social Psychology, vol. 38,no. 6, pp. 1639–1655, 2008.
[111] B. A. Kitchenham and S. L. Pfleeger, “Personal opinion surveys,”in Guide to advanced empirical software engineering. Springer, 2008,pp. 63–92.
Andre N. Meyer is a Ph.D student in ComputerScience at the University of Zurich, Switzerland,supervised by Prof. Thomas Fritz. His researchinterests lie in developers’ productivity and work,and in creating tools that foster productive workby using persuasive technologies such as self-monitoring and goal-setting. He also works in theinformation technology industry as an applica-tion developer and consultant. His homepage ishttp://www.andre-meyer.ch.

PRE-PRINTIEEE TRANSACTIONS ON SOFTWARE ENGINEERING 18
Earl T. Barr Earl Barr is a senior lecturer (asso-ciate professor) at the University College London.He received his Ph.D. at UC Davis in 2009.Earl’s research interests include bimodal softwareengineering, testing and analysis, and computersecurity. His recent work focuses on automatedsoftware transplantation, applying game theory tosoftware process, and using machine learning tosolve programming problems. Earl dodges vansand taxis on his bike commute in London.
Christian Bird Christian Bird is a researcherin the Empirical Software Engineering group atMicrosoft Research. He focuses on using qualita-tive and quantitative methods to both understandand help software teams. Christian received hisBachelor’s degree from Brigham Young Universityand his Ph.D. from the University of California,Davis. He lives in Redmond, Washington with hiswife and three (very active) children.
Thomas Zimmermann is a Senior Researcherat Microsoft Research. He received his Ph.D.degree from Saarland University in Germany.His research interests include software pro-ductivity, software analytics, and recommendersystems. He is a member of the IEEE Com-puter Society. His homepage is http://thomas-zimmermann.com.