toiletries 2011
TRANSCRIPT

Market Report Plus 2011
24th Edition July 2011Edited by Sarah Walker
ISBN 978-1-84729-750-1
Toiletries

In today’s competitive business environment, knowledge and understanding of yourmarketplace is essential. With over 30 years’ experience producing highly respectedoff-the-shelf publications, Key Note has built a reputation as the number one sourceof UK market information. Below are just a few of the comments our business partnersand clients have made on Key Note’s range of reports.
"The test of any marketing strategy and plan lies in the quality of information used, upon whichmarketing judgments and decisions are based. Quality is the key word here. The Key Notereports are an excellent source of such quality information, covering a wide variety of productsectors."
The Chartered Institute of Marketing
"We have enjoyed a long-standing relationship with Key Note and have always received anexcellent service. Key Note reports are well produced and are always in demand by users of thebusiness library. Having subscribed to Market Assessment reports for a number of years, wecontinue to be impressed by their quality and breadth of coverage."
The British Library
"Key Note is an invaluable resource which is reliable and easy to use. With a wide range ofreports, it is useful for monitoring the outside world. Staff are always very helpful."
The National Trust
"The US Commercial Service in London has been subscribing to Key Note market researchreports for over 5 years. We find the reports an invaluable resource in our business counselingactivities to the US companies wishing to enter the UK market with products and services. Thereports’ market data, competition, and forecast sections are especially useful."
US Embassy
"I regard Key Note as the number one provider of UK market research. The way Key Notecontent is packaged and presented is appealing and easy to understand and therefore a mustfor my taught course students. Its products are complemented by remarkably high levels ofcustomer service."
University of Cambridge, Judge Business School
Toiletries Foreword
© Key Note Ltd 2011
Contents
Executive Summary 1
1. Market Definition 2
REPORT COVERAGE....................................................................................................................2
MARKET SECTORS.......................................................................................................................2
MARKET TRENDS.........................................................................................................................3
Suppliers Change Promotional Strategies.................................................................................3
Growing Popularity of Social Media..........................................................................................3
Private Labels Benefiting From Changing Consumer Spending Habits..............................3
ECONOMIC TRENDS....................................................................................................................4
Gross Domestic Product ...............................................................................................................4Table 1.1: UK Gross Domestic Product at Current and Annual Chain-Linked Prices(£m), 2006-2010..............................................................................................................................4
Inflation ..........................................................................................................................................4Table 1.2: UK Rate of Inflation (%), 2006-2010.......................................................................5
Household Disposable Income ...................................................................................................5Table 1.3: UK Household Disposable Income Per Capita (£), 2006-2010............................5
Population ......................................................................................................................................6Table 1.4: UK Resident Population Estimates by Sex (000), Mid-Years 2006-2010...........6
Unemployment ..............................................................................................................................6Table 1.5: Actual Number of Unemployed Persons in the UK (million), 2006-2010.........7
MARKET POSITION......................................................................................................................7
The UK..............................................................................................................................................7
Table 1.6: Consumer Expenditure on Miscellaneous Goods and Services for PersonalCare (£m), 2006-2010....................................................................................................................7
Overseas...........................................................................................................................................8
2. Market Size 9
THE TOTAL MARKET..................................................................................................................9
Manufacturers’ Sales ....................................................................................................................9Retail Sales.......................................................................................................................................9
Table 2.1: The Total UK Market for Toiletries by Sector by Value at Current Prices(£m at rsp), 2006-2010...................................................................................................................9
Toiletries Contents
© Key Note Ltd 2011

Figure 2.1: The Total UK Market for Toiletries by Value at Current Prices(£m at rsp), 2006-2010.................................................................................................................10
BY MARKET SECTOR.................................................................................................................10
Figure 2.2: The Total UK Toiletries Market by Sector Share (%), 2010.............................11
Personal Wash and Bathroom Toiletries ................................................................................11
Table 2.2: The UK Personal Wash and Bathroom Toiletries Sector by Subsectorby Value at Current Prices (£m at rsp), 2009 and 2010........................................................12
Skincare Products ........................................................................................................................12
Table 2.3: The UK Skincare Products Sector by Subsector by Value at Current Prices(£m at rsp), 2009 and 2010.........................................................................................................12
Hair Care Products.......................................................................................................................13
Table 2.4: The UK Hair Care Products Sector by Subsector by Value at Current Prices(£m at rsp), 2009 and 2010.........................................................................................................13
Oral Care Products ......................................................................................................................13
Table 2.5: The UK Oral Care Products Sector by Subsector by Value at Current Prices(£m at rsp), 2009 and 2010.........................................................................................................14
Shaving Products .........................................................................................................................14
Table 2.6: The UK Shaving Products Sector by Subsector by Value at Current Prices(£m at rsp), 2009 and 2010.........................................................................................................14
OVERSEAS TRADE......................................................................................................................15
Table 2.7: UK Imports and Exports of Toiletries by Value (£000), 2008-2010..................15
Imports...........................................................................................................................................15
Table 2.8: UK Intra-EU Arrivals and Extra-EU Imports of Toiletries by Categoryby Value (£000), 2010..................................................................................................................16
Exports............................................................................................................................................16
Table 2.9: UK Intra-EU Despatches and Extra-EU Exports of Toiletries by Categoryby Value (£000), 2010..................................................................................................................17
3. Industry Background 18
RECENT HISTORY.......................................................................................................................18
NUMBER OF COMPANIES.......................................................................................................18
Table 3.1: Number of UK VAT- and/or PAYE-Based Enterprises Engagedin the Manufacture of Perfumes and Toilet Preparations by Turnover Sizeband,2010................................................................................................................................................18
EMPLOYMENT............................................................................................................................19
Table 3.2: Number of UK VAT- and/or PAYE-Based Enterprises Engagedin the Manufacture of Perfumes and Toilet Preparations by Employment Sizeband,2010................................................................................................................................................19
REGIONAL VARIATIONS IN THE MARKETPLACE.............................................................20
DISTRIBUTION.............................................................................................................................20
Selective Distribution .................................................................................................................20
Specialist Retailers ......................................................................................................................20
Toiletries Contents
© Key Note Ltd 2011

High-Street Stores........................................................................................................................21
Department Stores ......................................................................................................................21
Supermarkets ...............................................................................................................................21
Direct Selling ................................................................................................................................21
HOW ROBUST IS THE MARKET?...........................................................................................21
LEGISLATION...............................................................................................................................22
Cosmetics Directive 1976............................................................................................................22
Cosmetics Products Regulations................................................................................................22
REACH............................................................................................................................................22
KEY TRADE ASSOCIATIONS....................................................................................................23
Cosmetic, Toiletry and Perfumery Association.......................................................................23
The European Cosmetics Association ......................................................................................23
4. Competitor Analysis 24
THE MARKETPLACE..................................................................................................................24
MARKET LEADERS — MANUFACTURERS..........................................................................24
Avon Cosmetics Ltd......................................................................................................................24
Estée Lauder Cosmetics Ltd .......................................................................................................25
L’Oréal (UK) Ltd............................................................................................................................25
Procter & Gamble (Health & Beauty Care) Ltd ......................................................................26
PZ Cussons PLC..............................................................................................................................26
Unilever PLC..................................................................................................................................27
MARKET LEADERS — RETAILERS ........................................................................................27
Alliance Boots Ltd .......................................................................................................................27
Table 4.1: Alliance Boots Group Revenue and Trading Profit by Division (£m), YearEnding 31st March 2011.............................................................................................................28
The Body Shop International PLC ............................................................................................29
Lush Cosmetics Ltd ......................................................................................................................29
Molton Brown Ltd ......................................................................................................................30
Superdrug Stores PLC .................................................................................................................30
OUTSIDE SUPPLIERS..................................................................................................................31
Research and Development ......................................................................................................31
Raw Materials ..............................................................................................................................31
Processing Machinery, Packaging and components ............................................................31
Outsourcing ..................................................................................................................................32
MARKETING ACTIVITY.............................................................................................................32
Main Media Advertising Expenditure .....................................................................................32
Table 4.2: Main Media Advertising Expenditure on Toiletries by Sector (£000), YearsEnding March 2010 and 2011....................................................................................................32
Table 4.3: Main Media Advertising Expenditure on Deodorants (£000), Year EndingMarch 2011....................................................................................................................................34
Toiletries Contents
© Key Note Ltd 2011

Table 4.4: Main Media Advertising Expenditure on Bath Toiletries and Shower Gels(£000), Year Ending March 2011...............................................................................................36
Table 4.5: Main Media Advertising Expenditure on Mass-Market Cleaners and Wipes(£000), Year Ending March 2011...............................................................................................37
Table 4.6: Main Media Advertising Expenditure on Liquid Foam Bath and LiquidHand Soap (£000), Year Ending March 2011..........................................................................37
Table 4.7: Main Media Advertising Expenditure on Mass-Market Bath and BeautyRanges (£000), Year Ending March 2011................................................................................38
Table 4.8: Main Media Advertising Expenditure on Skincare by Type (£000), YearEnding Marching 2011................................................................................................................38
Table 4.9: Main Media Advertising Expenditure on Mass-Market Women’s FacialSkincare (£000), Year Ending March 2011..............................................................................39
Table 4.10: Main Media Advertising Expenditure on Mass-Market Women’s BodySkincare (£000), Year Ending March 2011..............................................................................42
Table 4.11: Main Media Advertising Expenditure on Premium Women’s FacialSkincare (£000), Year Ending March 2011..............................................................................44
Table 4.12: Main Media Advertising Expenditure on Mass-Market Women’sMedicated Facial Skincare (£000), Year Ending March 2011..............................................45
Table 4.13: Main Media Advertising Expenditure on Mass-Market Men’s Skincare(£000), Year Ending March 2011...............................................................................................46
Table 4.14: Main Media Advertising Expenditure on Mass-Market Suncareand Tanning Products (£000), Year Ending March 2011......................................................47
Table 4.15: Main Media Advertising Expenditure on Shampoos and Conditionersby Type (£000), Year Ending March 2011...............................................................................49
Table 4.16: Main Media Advertising Expenditure on Shampoos and Conditioners(£000), Year Ending March 2011...............................................................................................49
Table 4.17: Main Media Advertising Expenditure on Hair Colourants (£000), YearEnding March 2011......................................................................................................................51
Table 4.18: Main Media Advertising Expenditure on Hair Product Ranges (£000),Year Ending March 2011............................................................................................................52
Table 4.19: Main Media Advertising Expenditure on Hair Styling Aids (£000), YearEnding March 2011......................................................................................................................53
Table 4.20: Main Media Advertising Expenditure on Hairsprays (£000), Year EndingMarch 2011....................................................................................................................................53
Table 4.21: Main Media Advertising Expenditure on Toothpastes and Polishes(£000), Year Ending March 2011...............................................................................................54
Table 4.22: Main Media Advertising Expenditure on Other Oral Hygiene Products(£000), Year Ending March 2011...............................................................................................56
Table 4.23: Main Media Advertising Expenditure on Wet Razors and Blades (£000),Year Ending March 2011............................................................................................................58
Table 4.24: Main Media Advertising Expenditure on Shaving Preparations (£000),Year Ending March 2011............................................................................................................59
Table 4.25: Main Media Advertising Expenditure on Depilatories and Bleach(£000), Year Ending March 2011...............................................................................................59
Exhibitions and Trade Fairs........................................................................................................60
Toiletries Contents
© Key Note Ltd 2011

5. Brand Strategy 61
INTRODUCTION..........................................................................................................................61
THE WORLD’S MOST VALUABLE BRANDS .......................................................................61
Table 5.1: Leading Global Brands of Cosmetics and Toiletries by Rank and Value($m), 2010......................................................................................................................................61
CEW AWARDS.............................................................................................................................62
LEADING BRANDS BY SECTOR..............................................................................................63
Personal Wash and Bathroom Toiletries ................................................................................63
Skincare Products.........................................................................................................................63
Hair Care Products ......................................................................................................................63
Oral Care Products ......................................................................................................................63
Shaving Products .........................................................................................................................64
6. Strengths, Weaknesses, Opportunities and Threats 65
STRENGTHS..................................................................................................................................65
WEAKNESSES..............................................................................................................................65
OPPORTUNITIES.........................................................................................................................66
THREATS.......................................................................................................................................66
7. Buying Behaviour 67
AVERAGE WEEKLY HOUSEHOLD EXPENDITURE............................................................67
Table 7.1: Average Weekly Household Expenditure on Personal Care (£), 2009............67
By Age............................................................................................................................................67
Table 7.2: Average Weekly Household Expenditure on Personal Care by Ageof Household Reference Person (£), 2009...............................................................................68
By Gross Income Decile Group...................................................................................................68
Table 7.3: Average Weekly Household Expenditure on Personal Care by GrossIncome Decile Group (£), 2009..................................................................................................69
CUSTOMER PENETRATION.....................................................................................................69
Hair Care Products ......................................................................................................................70
Table 7.4: Usage of Hair Care Products in the Last 12 Months by Sex (% of adults),2010................................................................................................................................................70
Shampoo........................................................................................................................................70
Table 7.5: Female Usage of Shampoo in the Last 12 Months by Age and Social Grade(% of adults), 2010......................................................................................................................71
Table 7.6: Types of Shampoo Used Most Often by Women in the Last 12 Months(%), 2010........................................................................................................................................71
Conditioner ..................................................................................................................................72
Toiletries Contents
© Key Note Ltd 2011

Table 7.7: FemaIe Usage of Conditioners (Excluding Treatments and Masques)in the Last 12 Months by Age and Social Grade (% of adults), 2010................................72
Hair Styling Products ..................................................................................................................73
Table 7.8: Usage of Hair Styling Products in the Last 12 Months by Sex, Ageand Social Grade (% of adults), 2010.......................................................................................73
Hair Colourants ...........................................................................................................................74
Table 7.9: Usage of Hair Colourants in the Last 12 Months by Sex, Age and SocialGrade (% of adults), 2010..........................................................................................................74
Other Toiletries ...........................................................................................................................75
Table 7.10: Usage of Other Toiletries Products by Women in the Last 12 Months(%), 2010........................................................................................................................................75
Table 7.11: Usage of Other Toiletries Products by Men in the Last 12 Months (%),2010................................................................................................................................................76
Toothpaste ...................................................................................................................................76
Table 7.12: Usage of Toothpaste in the Last 12 Months by Age and Social Grade(% of adults), 2010......................................................................................................................76
Deodorants ...................................................................................................................................77
Table 7.13: Usage of Deodorant in the Last 12 Months by Sex, Age and Social Grade(% of adults), 2010......................................................................................................................77
Face Creams and Lotions ...........................................................................................................78
Table 7.14: Usage of Face Cream and Lotions in the Last 12 Months by Sex, Ageand Social Grade (% of adults), 2010.......................................................................................78
Hair Removers and Razors ........................................................................................................79
Table 7.15: Usage of Hair Removers and Razors in the Last 12 Months by Sex, Ageand Social Grade (% of adults), 2010.......................................................................................79
Shower Gels and Bath Products ...............................................................................................80
Table 7.16: Usage of Shower Gels and Bath Products in the Last 12 Months by Sex,Age and Social Grade (% of adults), 2010..............................................................................80
Cleansing Creams, Lotions and Wipes ....................................................................................81
Table 7.17: Usage of Cleansing Creams, Milks, Lotions, Toner, Wipes and Washesby Women in the Last 12 Months by Age and Social Grade (% of adults), 2010...........81
Liquid Soap/Handwash ..............................................................................................................82
Table 7.18: Usage of Liquid Soap/Handwash in the Last 12 Months by Age and SocialGrade (% of adults), 2010..........................................................................................................82
Bars of Soap .................................................................................................................................83
Table 7.19: Usage of Bars of Soap in the Last 12 Months by Age and Social Grade(% of adults), 2010......................................................................................................................83
Suntan and Sun Protection Products ......................................................................................84
Table 7.20: Usage of Suntan and Sun Protection Products in the Last 12 Monthsby Age and Social Grade (% of adults), 2010.........................................................................84
Toiletries Contents
© Key Note Ltd 2011

8. Current Issues 86
THE ECONOMY...........................................................................................................................86
RETAILERS ARE STRUGGLING................................................................................................86
RISING MATERIALS COSTS CAUSING PRICES HIKES........................................................87
UNILEVER AND P&G IN PRICE FIXING FINE.......................................................................87
NEW PRODUCTS.........................................................................................................................87
NIVEA..............................................................................................................................................87
L’Oreal ...........................................................................................................................................87
Dove ...............................................................................................................................................88
Sensodyne......................................................................................................................................88
Mandara.........................................................................................................................................88
Sk:n.................................................................................................................................................88
9. The Global Market 89
INTRODUCTION..........................................................................................................................89
EUROPE.........................................................................................................................................89
Table 9.1: Retail Sales of Cosmetics and Toiletries in the Top Five EU Member Statesby Value (€), 2009........................................................................................................................89
THE US...........................................................................................................................................90
SELECTED GLOBAL COMPETITORS .....................................................................................90
AS Watson Group.........................................................................................................................90
Avon Products Inc........................................................................................................................91
Beiersdorf AG................................................................................................................................91
Burt’s Bees ....................................................................................................................................91
Colgate-Palmolive Company .....................................................................................................92
Crabtree & Evelyn Ltd.................................................................................................................92
Estee Lauder Inc...........................................................................................................................92
Table 9.2: Estée Lauder Inc — Total Sales by Product Category ($m), Years Ending30th June 2009 and 2010...........................................................................................................93
L’Oreal SA......................................................................................................................................93
Mary Kay Inc..................................................................................................................................94
Procter & Gamble Company .....................................................................................................94
PZ Cussons ....................................................................................................................................94
Table 9.3: PZ Cussons — Group Revenue by Geographical Region (£m), Years Ending31st May 2009 and 2010.............................................................................................................95
Unilever PLC..................................................................................................................................95
Table 9.4: Unilever PLC — Sales by Geographic Region (€m), Year Ending31st December 2009 and 2010..................................................................................................96
Toiletries Contents
© Key Note Ltd 2011

10. Forecasts 97
INTRODUCTION..........................................................................................................................97
Population.....................................................................................................................................97
Table 10.1: Forecast UK Resident Population by Sex (000), Mid-Years 2011-2015.........97
Gross Domestic Product..............................................................................................................97
Table 10.2: Forecast UK Growth in Gross Domestic Product in Real Terms (%),2011-2015......................................................................................................................................98
Inflation.........................................................................................................................................98
Table 10.3: Forecast UK Rate of Inflation (%), 2011-2015...................................................98
Unemployment.............................................................................................................................98
Table 10.4: Forecast Actual Number of Unemployed Persons in the UK (million),2011-2015......................................................................................................................................99
FORECASTS 2006-2010.............................................................................................................99
Table 10.5: The Forecast UK Market for Toiletries by Sector by Value at CurrentPrices (£m at rsp), 2011-2015.....................................................................................................99
MARKET GROWTH..................................................................................................................100
Figure 10.1: The Actual and Forecast UK Market for Toiletries by Sector by Valueat Current Prices (£m at rsp), 2006-2015...............................................................................100
FUTURE TRENDS.......................................................................................................................100
New Product Development......................................................................................................100
Size of Products Set to Shrink..................................................................................................101
11. Company Profiles 102
AVON COSMETICS LTD..........................................................................................................103
ESTEE LAUDER COSMETICS LTD.........................................................................................105
L’OREAL (UK) LTD....................................................................................................................107
PROCTER & GAMBLE (HEALTH & BEAUTY CARE) LTD................................................109
PZ CUSSONS PLC......................................................................................................................111
SUPERDRUG STORES PLC......................................................................................................113
UNILEVER PLC...........................................................................................................................115
12. Company Financials 117
13. Further Sources 119
Associations...............................................................................................................................119
Publications...............................................................................................................................119
General Sources.......................................................................................................................120
Toiletries Contents
© Key Note Ltd 2011

Government Publications ....................................................................................................120
Other Sources...........................................................................................................................121
Key Note Sources ....................................................................................................................122
Understanding TGI Data 124
Number, Profile, Penetration..............................................................................................124
Social Grade...............................................................................................................................125
Standard Region......................................................................................................................125
Key Note Research 126
The Key Note Range of Reports 127
Toiletries Contents
© Key Note Ltd 2011
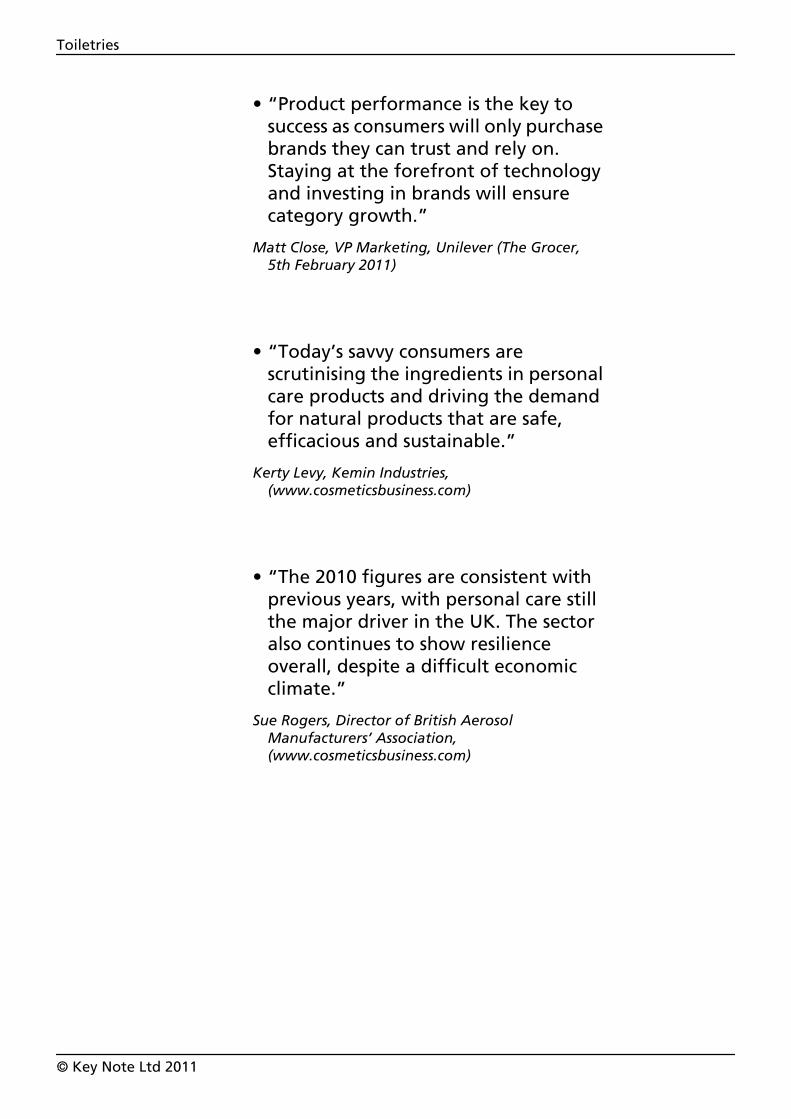
• “Product performance is the key tosuccess as consumers will only purchasebrands they can trust and rely on.Staying at the forefront of technologyand investing in brands will ensurecategory growth.”
Matt Close, VP Marketing, Unilever (The Grocer,5th February 2011)
• “Today’s savvy consumers arescrutinising the ingredients in personalcare products and driving the demandfor natural products that are safe,efficacious and sustainable.”
Kerty Levy, Kemin Industries,(www.cosmeticsbusiness.com)
• “The 2010 figures are consistent withprevious years, with personal care stillthe major driver in the UK. The sectoralso continues to show resilienceoverall, despite a difficult economicclimate.”
Sue Rogers, Director of British AerosolManufacturers’ Association,(www.cosmeticsbusiness.com)
Toiletries
© Key Note Ltd 2011

Executive Summary
This Key Note Market Report Plus examines the toiletries market in the UK.Characterised by a wide range of product types, the toiletries market isdominated by a small number of large multinational corporations includingProcter & Gamble, PZ Cussons, L’Oreal SA and Unilever.
The market itself is divided into five sectors: personal wash and bathroomproducts, skincare products, hair care products, oral care products and shavingproducts (for men and women). Key Note estimates that the total UK toiletriesmarket was worth £4.5bn in 2010, with personal wash and bathroom toiletriescomprising the largest sector by value (27.3%), followed by skincare products(27.1%) and hair care products (24.8%).
Compared with other industries — such as the construction and propertymarkets — the overall toiletries market weathered the recent economicdownturn relatively well. Many items, such as shampoos, soaps anddeodorants, etc., are regarded as daily essentials. Nevertheless, the economicdownturn did leave its mark on the industry.
One manifestation of this has been a change in consumer spending habits, withincreasing numbers trading down to value products. On the positive side, someconsumers are purchasing more premium products as they cut down on moreexpensive salon treatments, effectively transferring new business to thetoiletries market. Another noticeable impact of the strained economy has beenthe clear scaling down of some promotional activities, a result of suppliers’profit margins being squeezed as commodity prices have risen for almosteverything from oil to specialist beauty ingredients.
While television and print media remain popular, brands are increasinglyexperimenting with new digital channels as they seek more effective ways ofconnecting with their existing and potential clientele. The Internet and socialmedia sites such as Facebook, Twitter, and YouTube, are perceived to beeffective avenues for brands to communicate through, especially to both maleand younger buyers.
Although some sectors are reaching saturation point — and discountingcontinues to restrict value growth — outlook for the industry is positive. The‘necessary’ nature of its products and a strong sense of brand loyalty amongits customers are its strongest assets. The industry also features high levels ofinvestment in new product development (NPD), which continues to drive sales.Significant opportunities exist in the areas of cosmeceuticals and green/ethicalproducts.
Key Note forecasts retail sales of toiletries will grow by close to 10% between2011 and 2015, to reach £5.03m in the latter year. The sectors which areexpected to exhibit the strongest growth are skincare products, followed bypersonal wash and bathroom toiletries.
Toiletries Executive Summary
© Key Note Ltd 2011 1

1. Market Definition
REPORT COVERAGE
Cosmetic and toiletry products are defined as any substance or preparationintended to be placed in contact with the various external parts of the humanbody, or with the teeth and the mucous membranes of the oral cavity, with aview exclusively or mainly of cleaning them, perfuming them, changing theirappearance and/or correcting body odours, and/or protecting them or keepingthem in good condition. This Key Note report looks at the range of toiletryproducts that are primarily of a functional use. Cosmetics, which are of a purelydecorative nature, are not included, although the distinction is becomingincreasingly blurred with new types of product.
MARKET SECTORS
For the purpose of this report, the toiletries market will be divided into thefollowing sectors:
• Personal washing and related bathroom products — traditional bar soaps,liquid soaps, shower gels, bath liquids, deodorants, bodysprays and talcumpowder
• Oral care products — toothpaste, mouthwash, dental floss, etc.
• Hair care products — shampoos, conditioners, colourants and hair styling aidssuch as gels, mousses and sprays
• Skincare products — hand, body and facial moisturisers, cleansers and toners,exfoliating scrubs and sun filters/after-sun products
• Shaving products — wet-shave and after-shave products, and razors andblades, including those designed specifically for the women’s market;depilatory creams are also included.
Toiletries Market Definition
© Key Note Ltd 2011 2

MARKET TRENDS
Suppliers Change Promotional Strategies
In recent years, promotions in the toiletries market have been exerting a stronginfluence on consumer purchasing behaviour, with supermarkets being one ofthe most common places to buy toiletry products. The ’buy one, get one free’trend became so wide-spread that consumers rarely needed to buy certainproducts at full price. In 2010, however, as a result of suppliers being unableto sustain the level of promotions (following the increases in commodity prices,from oil to specialist beauty ingredients including geranium and lavender),deep discount promotion all but disappeared. Many suppliers believe thechange is necessary. As one brand manager of Beiersdorf put it: ‘If you promoteand promote, there will be no value left. That’s not beneficial to anybody. Noteven consumers, because it will stop brands investing in new productdevelopment (NPD). There needs to be some value, so that’s why we’re startingto do ’two for £4’ on our deodorants, rather than ’three for £3.50’.’
Growing Popularity of Social Media
While television and print media remain popular, social media is thefastest-growing marketing channel. Brands are increasingly experimentingwith these new digital channels, from which they are seeking to developstronger and deeper relationships with their existing and potential clientele.Lynx, for example, launched its Excite variant with a focus on digital activity,including a Facebook game — featuring Kelly Brook — aimed at maleaudiences. The Internet and social media sites, such as Facebook, Twitter,YouTube and Flickr, are perceived to be a particularly effective way for brandsto reach both male and younger buyers. Social media avenues may be used fordirect communication with consumers and for listening exercises, to promotebrand awareness or trial new product ideas, and to support larger mediacampaigns.
Private Labels Benefiting From Changing Consumer SpendingHabits
Economic turbulence has undoubtedly accelerated the growth of private-labelproducts, as a significant number of consumers seek out less expensivepurchases. This is evident from the number of private-label products that havebeen launched by retailers in recent years, examples of which are Tesco’sVitamin E skincare range and Boots’ No. 7 range. According to the Private LabelManufacturers Association (PLMA), private-label products now hold theirstrongest competitive position, accounting for one of every two products soldin the UK and Switzerland. Younger shoppers show particularly strong supportfor this sector.
Toiletries Market Definition
© Key Note Ltd 2011 3

ECONOMIC TRENDS
Gross Domestic Product
Between 2003 and 2008, the UK’s gross domestic product (GDP) grew at ayear-on-year rate of approximately 5%. This growth was principally driven byconsumer spending and low interest rates. In 2008, however, as a result of thefinancial crisis, growth slowed markedly to 2.9% — and dramatically moved toa contraction of 3.5% (at current prices) as the country entered recession in2009. The UK officially emerged from recession in January 2010, bringing to anend six consecutive quarters of contraction. In 2010, official figures confirmedthat the economy had begun to recover, as GDP increased by 4.2% (at currentprices) on 2009. However, annual chain-linked figures for 2010 indicate thatGDP growth remains well below levels registered prior to the recession.
Table 1.1: UK Gross Domestic Product at Current and AnnualChain-Linked Prices (£m), 2006-2010
2006 2007 2008 2009 2010
Current prices 1,328,363 1,404,845 1,445,580 1,394,989 1,453,616
% changeyear-on-year - 5.8 2.9 -3.5 4.2
Annual chain-linkedGDP 1,328,363 1,364,029 1,363,139 1,296,689 1,312,911
% changeyear-on-year - 2.7 -0.1 -4.9 1.3
GDP — gross domestic product
Source: Economic & Labour Market Review, May 2011, National Statistics website© Crown copyright material is reproduced with the permission of the Controllerof HMSO (and the Queen’s Printer for Scotland)
Inflation
UK inflation rose gradually in the years leading up to 2007, before droppingby 0.3 percentage points in 2008. By the end of 2009, despite the high price ofa number of commodities, including fuel, clothing and certain foods, inflationturned negative. However, it has since started to rise sharply, with the latestNational Statistics figures placing it at 4.6%, more than twice that of the Bankof England’s target of 2%. This sharp hike in inflation has been buoyed in partby the rise in VAT which came into effect in January 2011.
Toiletries Market Definition
© Key Note Ltd 2011 4

Table 1.2: UK Rate of Inflation (%), 2006-2010
2006 2007 2008 2009 2010
Inflation (%) 3.2 4.3 4.0 -0.5 4.6
Percentage point changeyear-on-year - 1.1 -0.3 -4.5 5.1
Note: inflation is at retail price index (RPI).
Source: Focus on Consumer Price Indices — Data for April 2011, published May2011, National Statistics website © Crown copyright material is reproduced withthe permission of the Controller of HMSO (and the Queen’s Printer for Scotland)
Household Disposable Income
Despite the current economic downturn, household disposable income percapita continued to increase year-on-year of approximately 3% over the reviewperiod, although growth in this measure slowed markedly to around 1.7% in2009. Rising household disposable income should, under normal circumstances,help to encourage consumer spending. However, since the recession, consumerconfidence has remained low and is likely to continue to do so as theGovernment’s proposed cuts to the public sector come into force.
Table 1.3: UK Household Disposable Income Per Capita (£),2006-2010
2006 2007 2008 2009 2010
Household disposableincome (£) 14,080 14,453 14,976 15,225 15,676
% change year-on-year - 2.6 3.6 1.7 3.0
Source: Economic & Labour Market Review, May 2011, National Statistics website© Crown copyright material is reproduced with the permission of the Controllerof HMSO (and the Queen’s Printer for Scotland)
Toiletries Market Definition
© Key Note Ltd 2011 5

Population
According to the Office for National Statistics, the UK’s population is currentlygrowing at an average annual rate of around 0.6% to 0.7% a year. At this rate,it is expected the 65 million-barrier will be exceeded by 2017. A growingpopulation is likely to contribute to an increase in consumer spending, whichin turn, will benefit the toiletries market.
Table 1.4: UK Resident Population Estimates by Sex (000),Mid-Years 2006-2010
2006 2007 2008 2009 †2010
Female 30,895 31,068 31,244 31,418 31,614
Male 29,689 29,918 30,154 30,374 30,609
Total 60,584 60,986 61,398 61,792 ‡62,222
% changeyear-on-year - 0.7 0.7 0.6 0.7
† — taken from Population Projections Database
‡ — does not sum due to rounding at source
Source: Time Series Data — Monthly Digest of Statistics (accessed June 2011)/Population Projections Database (2008-based projections), National Statisticswebsite © Crown copyright material is reproduced with the permission of theController of HMSO (and the Queen’s Printer for Scotland)
Unemployment
In 2004, the number of people unemployed in the UK stood at 850,000 — itslowest level in over a decade. This remained at a comparable level up until2007. Starting in March 2008, however, the economic downturn beganaffecting the labour market, sending UK unemployment figures rising. Theclaimant count reached 1 million in October 2008 and rose to a 13-year highof 1.53 million in 2009, before decreasing again in 2010. The latest figurespublished by National Statistics suggest that the number of peopleunemployed in the UK currently stands at 2.5 million. This figure is likely toincrease in the first half of 2011 as public sector cuts come into effect.
Toiletries Market Definition
© Key Note Ltd 2011 6
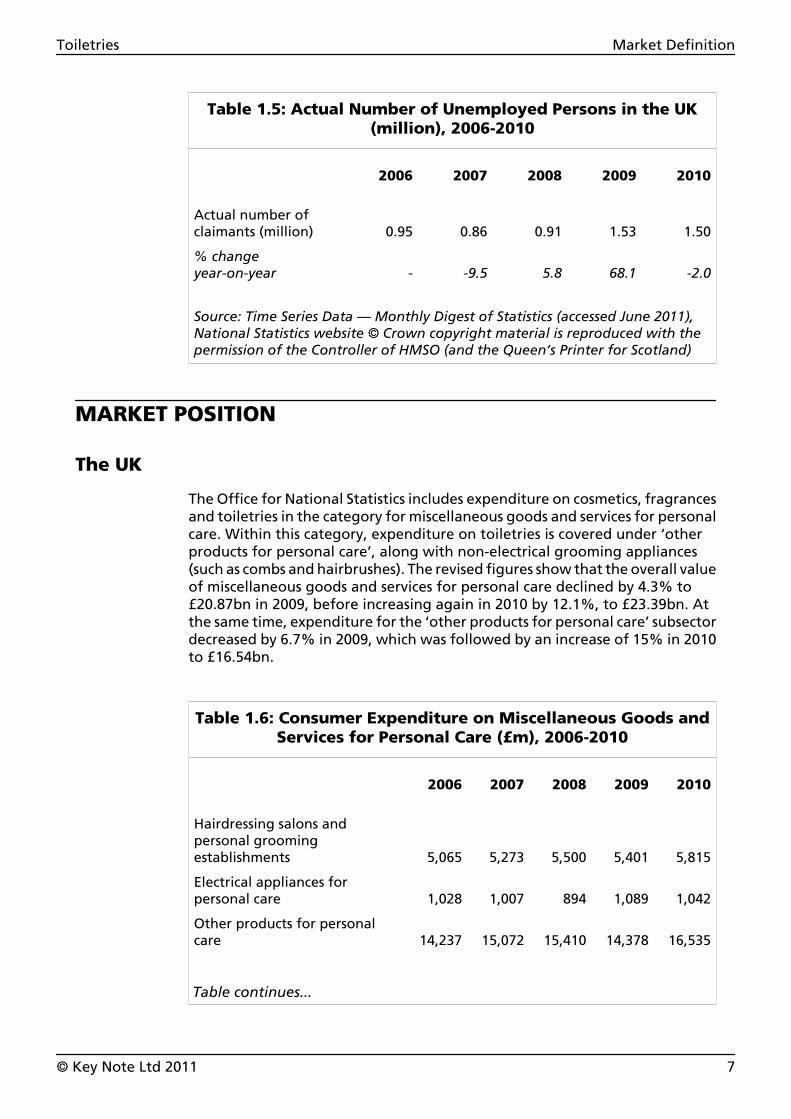
Table 1.5: Actual Number of Unemployed Persons in the UK(million), 2006-2010
2006 2007 2008 2009 2010
Actual number ofclaimants (million) 0.95 0.86 0.91 1.53 1.50
% changeyear-on-year - -9.5 5.8 68.1 -2.0
Source: Time Series Data — Monthly Digest of Statistics (accessed June 2011),National Statistics website © Crown copyright material is reproduced with thepermission of the Controller of HMSO (and the Queen’s Printer for Scotland)
MARKET POSITION
The UK
The Office for National Statistics includes expenditure on cosmetics, fragrancesand toiletries in the category for miscellaneous goods and services for personalcare. Within this category, expenditure on toiletries is covered under ‘otherproducts for personal care’, along with non-electrical grooming appliances(such as combs and hairbrushes). The revised figures show that the overall valueof miscellaneous goods and services for personal care declined by 4.3% to£20.87bn in 2009, before increasing again in 2010 by 12.1%, to £23.39bn. Atthe same time, expenditure for the ‘other products for personal care’ subsectordecreased by 6.7% in 2009, which was followed by an increase of 15% in 2010to £16.54bn.
Table 1.6: Consumer Expenditure on Miscellaneous Goods andServices for Personal Care (£m), 2006-2010
2006 2007 2008 2009 2010
Hairdressing salons andpersonal groomingestablishments 5,065 5,273 5,500 5,401 5,815
Electrical appliances forpersonal care 1,028 1,007 894 1,089 1,042
Other products for personalcare 14,237 15,072 15,410 14,378 16,535
Table continues...
Toiletries Market Definition
© Key Note Ltd 2011 7

Table 1.6: Consumer Expenditure on Miscellaneous Goods andServices for Personal Care (£m), 2006-2010
...table continued
2006 2007 2008 2009 2010
Total 20,330 21,352 21,804 20,868 23,392
% change year-on-year - 5.0 2.1 -4.3 12.1
Source: Consumer Trends 2010, National Statistics © Crown copyright material isreproduced with the permission of the Controller of HMSO (and the Queen’sPrinter for Scotland)
Overseas
According to the European Cosmetics Association (Colipa), the EU-27 marketfor cosmetics and fragrances including toiletries covered in this Key Note reportrepresents close to one-third of the global market. At retail prices, the marketwas valued at €69.5bn in 2009, marginally down — by 1.6% — from €70.6bnin 2008. The UK’s market was valued at €8.9bn, accounting for 12.8% of salesin the EU-27.
Toiletries Market Definition
© Key Note Ltd 2011 8

2. Market Size
THE TOTAL MARKET
Manufacturers’ Sales
According to the latest available figures from National Statistics, the value ofUK manufacturers’ sales of perfumes and toilet preparations (which coverscosmetics and perfumes, as well as products for personal care), was worth£2.25bn in 2009, having marginally declined — by 0.8% — from £2.27bn in2008. The value of manufacturers’ sales fell in most personal care productcategories, including shaving preparations, oral care, shampoos and skincareproducts.
Retail Sales
The total market for toiletries, as covered by this report, was valued at £4.53bnin 2010. Personal wash and bathroom toiletries make up the largest sector byvalue, accounting for 27.3% of the total. This is closely followed by skincareand hair care products, accounting for 27.1% and 24.8%, respectively in 2010.
Table 2.1: The Total UK Market for Toiletries by Sector by Valueat Current Prices (£m at rsp), 2006-2010
2006 2007 2008 2009 2010
Personal wash andbathroom toiletries 1170.0 1172.0 1175.0 1212.0 1237.0
Skincare products 978.0 1060.0 1140.0 1196.9 1229.0
Hair care products 1100.5 1106.5 1118.0 1120.0 1123.0
Oral care products 545.0 549.5 557.0 559.0 562.6
Shaving preparations,wet razors and blades,and depilatories 378.0 380.5 385.0 378.0 381.3
Total 4171.5 4268.5 4375.0 4465.9 4532.9
% change year-on-year - 2.3 2.5 2.1 1.5
rsp — retail selling prices
Source: Key Note
Toiletries Market Size
© Key Note Ltd 2011 9

Figure 2.1: The Total UK Market for Toiletries by Value atCurrent Prices (£m at rsp), 2006-2010
20062007
20082009
2010
3,000
3,250
3,500
3,750
4,000
4,250
4,500
4,750
5,000
rsp — retail selling prices
Source: Key Note
BY MARKET SECTOR
Figure 2.2 displays the market share percentage attributed to each sectorfeatured in this Key Note Market Report Plus.
Toiletries Market Size
© Key Note Ltd 2011 10

Figure 2.2: The Total UK Toiletries Market by Sector Share (%),2010
Shaving preparations,
wet razors and blades,
and depilatories
8.4%
Oral care products
12.4%
Hair care products
24.8%
Personal wash and bathroom toiletries
27.3%
Skincare products
27.1%
Source: Key Note
Personal Wash and Bathroom Toiletries
As shown in Table 2.2, the total value for personal wash and bathroomtoiletries increased by an estimated 2.1% from £1.21bn in 2009 to £1.24bn in2010. Although household penetration of personal wash and bathroomtoiletries remains high, potential value growth is restricted due to theprevalence of discounting. Moreover, retailers’ own brands are increasinglygaining market share over more expensive brands, as consumers are likely totrade down to less expensive products in the current economic climate.Notably, however, deodorants outperformed the sector as a whole, with salesincreasing in value by an estimated 3.8%. Continuing economic recovery, albeitslow, should see less discounting and returning consumer confidence.
Toiletries Market Size
© Key Note Ltd 2011 11

Table 2.2: The UK Personal Wash and Bathroom Toiletries Sectorby Subsector by Value at Current Prices (£m at rsp),
2009 and 2010
2009 2010% Change2009-2010
Bath/shower soaps, gels, additives andtalcum powder 690.0 695.0 0.7
Deodorants 522.0 542.0 3.8
Total 1,212.0 1,237.0 2.1
rsp — retail selling prices
Source: Key Note
Skincare Products
The market for skincare products, including sun care, was valued at £1.23bn in2010, an increase of 2.7% from the previous year. Growth in this marketcontinues to be driven by premium-priced products with anti-ageingformulations.
Table 2.3: The UK Skincare Products Sector by Subsector byValue at Current Prices (£m at rsp), 2009 and 2010
2009 2010% Change2009-2010
Facial skincare 680.0 702.0 3.2
Hand and body skincare 316.0 324.0 2.5
Suncare 200.9 203.0 1.0
Total 1,196.9 1,229.0 2.7
rsp — retail selling prices
Source: Key Note
Toiletries Market Size
© Key Note Ltd 2011 12

Hair Care Products
The value of the market for hair care products in 2010 increased by a marginal0.3%, from £1.12bn in 2009. The colourants and enhancers sector showed thestrongest growth with 1.3%, followed by conditioners with 0.8%. By contrast,sales of hairsprays and other styling aids decreased. The largest sector in thismarket segment is formed by shampoo, which accounts for just under a third(32.5%) of the total value of hair care products. This subsector is, however,another which is subject to heavy discounting, thereby restricting valuegrowth.
Table 2.4: The UK Hair Care Products Sector by Subsector byValue at Current Prices (£m at rsp), 2009 and 2010
2009 2010% Change2009-2010
Shampoo 364.0 365.2 0.3
Conditioners 238.0 240.0 0.8
Colourants and enhancers 221.0 223.8 1.3
Hairsprays 131.0 130.0 -0.8
Other styling aids 166.0 164.0 -1.2
Total 1,120.0 1,123.0 0.3
rsp — retail selling prices
Source: Key Note
Oral Care Products
Oral care products accounted for 12.4% of the toiletries market in 2010, saleshaving increased in value by a marginal 0.6%, to £562.6m. Householdpenetration of oral care products is high (see Chapter 7 — Buying Behaviour),and volume sales are helped by a growing population. It is, however, anothersector in which special price promotions are frequent, thereby keeping a checkon value growth.
Toiletries Market Size
© Key Note Ltd 2011 13

Table 2.5: The UK Oral Care Products Sector by Subsector byValue at Current Prices (£m at rsp), 2009 and 2010
2009 2010% Change2009-2010
Toothpaste, mouthwashes, etc. 425.0 428.6 0.8
Toothbrushes 134.0 134.0 0.0
Total 559.0 562.6 0.6
rsp — retail selling prices
Source: Key Note
Shaving Products
Shaving products account for the remaining 8.4% of the toiletries market andthis sector was worth an estimated £381.3m in 2010. The men’s sector has beendriven by new product innovation in recent years, although this trend notablyreversed during the economic downturn, as cost-conscious consumersincreasingly looked for less expensive — yet still high quality — alternatives.The sector experienced an increase in value of just under 1% in 2010,amounting to £381.3m.
Table 2.6: The UK Shaving Products Sector by Subsector byValue at Current Prices (£m at rsp), 2009 and 2010
2009 2010% Change2009-2010
Shaving preparations 88.0 89.0 1.1
Razors, blades and depilatories 290.0 292.3 0.8
Total 378.0 381.3 0.9
rsp — retail selling prices
Source: Key Note
Toiletries Market Size
© Key Note Ltd 2011 14

OVERSEAS TRADE
The UK has had a favourable trade balance in toiletries in the 3 years between2008 and 201, exporting a greater value than is imported. However, the tradebalance for 2010 decreased by 29.3% from £295.3m in 2009 to £208.7m in 2010.
Table 2.7: UK Imports and Exports of Toiletries by Value (£000),2008-2010
2008 2009 2010
Exports 1,012,512.0 1,097,203.3 1,045,949.3
Less imports 742,723.9 801,950.7 837,297.4
Balance of trade 269,788.1 295,252.6 208,651.9
Source: HM Revenue & Customs © Crown copyright material is reproduced withpermission of the Controller of HMSO (and the Queen’s Printer for Scotland)
Imports
Imports of toiletries from within the EU accounted for 76% of the value of totalUK imports of toiletries in 2010 (see Table 2.8). Hair care products representedthe highest-value category, accounting for 44.4% of total imports.Interestingly, this is one of only two sectors for which the cost of importsexceeded the value of exports, the other sector being perfumed bath salts andother bath preparations. The EU was the biggest source of imports in almostall sectors, with the exception of toilet soap. The UK’s main European sourcesof toiletries are Germany, France and Italy; while non-EU suppliers includeNorth America, the People’s Republic of China (PRC) and India.
Toiletries Market Size
© Key Note Ltd 2011 15

Table 2.8: UK Intra-EU Arrivals and Extra-EU Imports ofToiletries by Category by Value (£000), 2010
Intra-EU Extra-EU Total
Preparations for the hair 282,181.8 94,807.5 376,989.3
Preparations for oral or dental hygiene 106,394.7 26,718.5 133,113.2
Personal deodorants and anti-perspirants 104,259.5 11,124.6 115,384.1
Perfumed bath salts and other bathpreparations 40,226.4 15,396.3 55,622.7
Toilet soap 29,738.0 31,462.8 61,200.8
Pre-shave, shaving and after-shavepreparations 46,483.8 6,064.8 52,548.6
Depilatories and perfumery, cosmetic ortoilet preparations not elsewherespecified 26,753.6 15,685.1 42,438.7
Total 636,037.8 201,259.6 837,297.4
Source: HM Revenue & Customs © Crown copyright material is reproduced withpermission of the Controller of HMSO (and the Queen’s Printer for Scotland)
Exports
EU countries were the principal destinations for UK exports of toiletries,accounting for 70.1% of total exports in 2010, compared with 74.1% in 2009.The Netherlands, the Republic of Ireland (RoI), Germany, France, and Spainwere the most important EU destinations for UK exports of toiletries, whilenon-EU markets include North America, Russia, Australia and the United ArabEmirates.
Toiletries Market Size
© Key Note Ltd 2011 16

Table 2.9: UK Intra-EU Despatches and Extra-EU Exports ofToiletries by Category by Value (£000), 2010
Intra-EU Extra-EU Total
Preparations for the hair 208,637.7 62,838.8 271,476.5
Preparations for oral or dentalhygiene 170,349 57,544.1 227,893.1
Personal deodorants andanti-perspirants 173,600 45,971.3 219,571.3
Perfumed bath salts and otherbath preparations 30,634.6 14,183.7 44,818.3
Toilet soap 41,642.0 33,668.7 75,310.7
Pre-shave, shaving andafter-shave preparations 80,880.7 47,500.5 128,381.2
Depilatories and perfumery,cosmetic or toilet preparationsNES 27,177.5 51,320.7 78,498.2
Total 732,921.5 313,027.8 1,045,949.3
Source: HM Revenue & Customs © Crown copyright material is reproduced withpermission of the Controller of HMSO (and the Queen’s Printer for Scotland)
Toiletries Market Size
© Key Note Ltd 2011 17

3. Industry Background
RECENT HISTORY
The use of some form of personal care products can be traced back thousandsof years, and usage is evident in almost every society. Throughout time, peoplehave striven to make the most of their appearance with feature-enhancingpastes and dyes — such as henna — and perfumed oil, which was frequentlyused by the wealthy as a means to mask body odours.
By the 1970s, mounting pressure from environmentalists and animal-rightsactivists marked the beginning of closer scrutiny of industry practices. Despitestringent regulation, such as the European Cosmetics Directive of 1976 and theCosmetic Products (Safety) Regulations of 1996, as well as assurances fromindustry members, animal testing scandals still arise. Toiletries that areformulated using natural, plant-based ingredients have become the preferredchoice of many customers; this trend is exemplified by the success of The BodyShop International over the past couple of decades.
NUMBER OF COMPANIES
In 2010, according to UK Business: Activity, Size and Location, there were 320VAT- and/or PAYE-based enterprises involved in the manufacturing ofperfumes and toilet preparations. 46.9% of these had a turnover of more than£250,000, while nearly one third (29.7%) of these companies turned over £1mor more.
Table 3.1: Number of UK VAT- and/or PAYE-Based EnterprisesEngaged in the Manufacture of Perfumes and Toilet
Preparations by Turnover Sizeband, 2010
Number of Enterprises
Turnover Sizeband (£000)
0-49 55
50-99 60
100-249 55
250-499 30
500-999 25
Table continues...
Toiletries Industry Background
© Key Note Ltd 2011 18

Table 3.1: Number of UK VAT- and/or PAYE-Based EnterprisesEngaged in the Manufacture of Perfumes and Toilet
Preparations by Turnover Sizeband, 2010
...table continued
Number of Enterprises
Turnover Sizeband (£000)
1,000-4,999 55
5,000+ 40
Total 320
Source: UK Business: Activity, Size and Location, National Statistics website ©Crown copyright material is reproduced with the permission of the Controller ofHMSO (and the Queen’s Printer for Scotland)
EMPLOYMENT
Table 3.2 shows the same number of UK VAT- and/or PAYE-based enterprisesthat in 2010 were involved in the manufacturing of perfumes and toiletpreparations, this time separated by employment sizeband. As can be seen,most are small enterprises, with nearly two-third (70.3%) of companiesemploying fewer than ten people and more than half (57.8%) of companiesemploying fewer than five.
Table 3.2: Number of UK VAT- and/or PAYE-Based EnterprisesEngaged in the Manufacture of Perfumes and Toilet
Preparations by Employment Sizeband, 2010
Number of Enterprises
Employment Sizeband
0-4 185
5-9 40
10-19 30
20-49 25
50-99 15
Table continues...
Toiletries Industry Background
© Key Note Ltd 2011 19
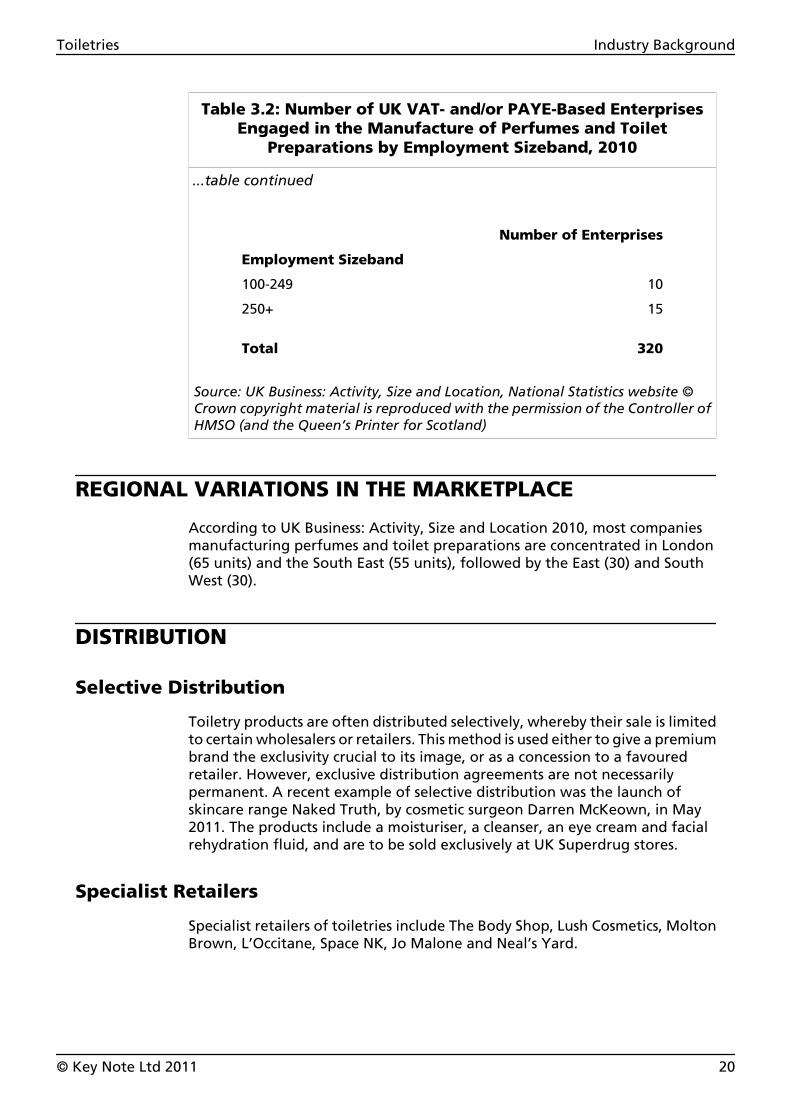
Table 3.2: Number of UK VAT- and/or PAYE-Based EnterprisesEngaged in the Manufacture of Perfumes and Toilet
Preparations by Employment Sizeband, 2010
...table continued
Number of Enterprises
Employment Sizeband
100-249 10
250+ 15
Total 320
Source: UK Business: Activity, Size and Location, National Statistics website ©Crown copyright material is reproduced with the permission of the Controller ofHMSO (and the Queen’s Printer for Scotland)
REGIONAL VARIATIONS IN THE MARKETPLACE
According to UK Business: Activity, Size and Location 2010, most companiesmanufacturing perfumes and toilet preparations are concentrated in London(65 units) and the South East (55 units), followed by the East (30) and SouthWest (30).
DISTRIBUTION
Selective Distribution
Toiletry products are often distributed selectively, whereby their sale is limitedto certain wholesalers or retailers. This method is used either to give a premiumbrand the exclusivity crucial to its image, or as a concession to a favouredretailer. However, exclusive distribution agreements are not necessarilypermanent. A recent example of selective distribution was the launch ofskincare range Naked Truth, by cosmetic surgeon Darren McKeown, in May2011. The products include a moisturiser, a cleanser, an eye cream and facialrehydration fluid, and are to be sold exclusively at UK Superdrug stores.
Specialist Retailers
Specialist retailers of toiletries include The Body Shop, Lush Cosmetics, MoltonBrown, L’Occitane, Space NK, Jo Malone and Neal’s Yard.
Toiletries Industry Background
© Key Note Ltd 2011 20
High-Street Stores
Health and beauty chains Boots and Superdrug are the leading high-streetstores, both selling a wide range of personal care products. Others includeLloyds Pharmacy, along with a number of smaller chains and independentstores.
Department Stores
Department stores, such as Debenhams, House of Fraser, Harrods, HarveyNichols, Selfridges and John Lewis, offer a range of branded as well asown-brand cosmetics and toiletries. Many stores also house concessions forbrands such as Molton Brown and L’Occitane.
Supermarkets
The supermarkets continue their expansion into the health and beauty sectorby offering products at discounted prices. Major UK supermarkets such asTesco, ASDA, Sainsbury’s, Morrisons and Waitrose also stock their own-brandtoiletry ranges, all sold at reasonable prices. It is the involvement of thesupermarkets and the price wars between them and other main competitors,that do much to keep down the value of sales of everyday toiletries.
Direct Selling
Avon is a prime example of the direct selling of cosmetics and fragrances, whichis carried out both online and through representatives. The Body Shop alsostarted its own ‘Body Shop at Home’ party plan, which offers 25% commissionto its sales representatives. VIE At Home is another company that specialises indirect selling of cosmetics, skincare and body care products in the UK. VIE AtHome was launched in 1996 and has more than 10,000 sales representatives.
HOW ROBUST IS THE MARKET?
The toiletries market was not impacted nearly as much by the global recessionas, for instance, the construction and property markets. Sales of toiletryproducts remained strong during the economic downturn as many of theseitems, such as shampoos, shower gels and deodorants, etc., are regarded asnecessities (see Chapter 2 — Market Size, and Chapter 7— Buying Behaviour).Nevertheless, there have been considerable changes in consumer behaviourand trends, predominantly in response to the ongoing economic uncertainty,rising energy and commodity prices, and a squeeze in households’ disposableincome. Combined, these factors are prompting consumers to adjust theirpriorities and spending habits. Consumers today are more likely to trade downto value products in order to save money, while others may view toiletryproducts as ‘feel good’ indulgences and stay loyal to their favourite brands. Intrading down, some consumers will be selecting premium products as analternative to salon beauty and spa treatments, effectively bringing new retailcustom to the toiletries market.
Toiletries Industry Background
© Key Note Ltd 2011 21

LEGISLATION
Cosmetics Directive 1976
All cosmetic, toiletry and perfumery products placed on the market in the UK(and throughout the EU) are regulated by European legislation, namely theCosmetics Directive (76/768/EEC). The primary purpose of these laws is toprotect human safety. The manufacturer or supplier of the cosmetic product isresponsible for ensuring it is safe; each cosmetic must be assessed for safety bya duly qualified safety assessor before it can be made available to the public.The Directive covers the composition, manufacturing, safety assessment andlabelling of all cosmetics products. The Cosmetics Directive also controls whatmay or may not be put in a cosmetic. There are lists of substances that mustnot be present and lists of substances that may be used as ingredients subjectto particular restrictions.
Cosmetics Products Regulations
The legislation that regulates cosmetic products in the UK is the CosmeticProducts (Safety) Regulations 2008. The Regulations are based on theCosmetics Directive (76/768/EEC) and are updated periodically, reflectingchanges to prohibitions of, and restrictions on, certain substances, andsubsequent amendments to the Cosmetic Products (Safety) Regulations 2008.
The Cosmetic Products (Safety) Regulations 2008 came into force on18th June 2008 and consolidated earlier Regulations, as well as implementingcurrent European Directives. Under the Cosmetic Products (Safety) Regulations2008, all cosmetic products sold in the EU must display a complete ingredientslist. New products are required to undergo a full safety assessment before theyare allowed onto the market. Safety assessments need to be carried out byqualified professionals and must cover the finished product, all ingredients andhow products will be used.
In July 2013, the EU Cosmetics Directive will be replaced by the EU CosmeticsRegulation (1223/2009), which will apply directly in all EU Member States.
REACH
Also relating to the industry is the Registration, Evaluation & Authorisation ofChemicals (REACH), a European regulation concerning the safety of chemicals.In order to ensure a high level of protection, this regulation requires data tobe provided concerning human and environmental safety. It applies to allchemicals made in the EU or imported into the EU, including certain naturalsubstances and other substances used in cosmetic products. It is intended toaddress any public concern about the use of chemicals.
Toiletries Industry Background
© Key Note Ltd 2011 22

KEY TRADE ASSOCIATIONS
Cosmetic, Toiletry and Perfumery Association
Founded in 1945, the Cosmetic, Toiletry and Perfumery Association (CTPA) is atrade association providing a voice for the UK cosmetic, toiletry and perfumeryindustry. Its members vary from small- and medium-sized companies to largemulti-nationals and include manufacturers, raw material suppliers and serviceproviders. The Association co-ordinates the industry’s viewpoint on key issues,such as science, innovation and safety, and maintains an open dialogue withthe Government, both in the UK and in Europe, as well as with internationalregulatory authorities and key opinion formers.
The European Cosmetics Association
Established in 1962 in Brussels, the European Cosmetics Association (Colipa)aims to be the voice of Europe’s cosmetic, toiletry and perfumery industry. Itrepresents the interests of more than 2,000 companies, ranging from majorinternational cosmetics manufacturers to small family-run businessesoperating in niche markets. Together, these companies employ more than500,000 people within the EU. The products that fall within the scope of Colipaextend across a diverse range and include essential personal hygiene products,such as deodorant, shampoo and toothpaste, as well as beauty preparations.The Association assists its members with the ongoing development of safe,innovative and effective products, while also meeting the demands ofconsumers through intensive market research.
Toiletries Industry Background
© Key Note Ltd 2011 23

4. Competitor Analysis
THE MARKETPLACE
The manufacture of toiletries is currently dominated by a small number ofmultinational corporations, such as Unilever and Procter & Gamble (P&G),which also produce a wide range of consumer goods for other markets outsideof the toiletry industry. Other specialist companies include L’Oreal, PZ Cussons,Estee Lauder and number of smaller, niche operations. On the retail side,principle retailers of toiletries include Alliance Boots, Superdrug and thegrocery multiples such as Tesco, which sell a much wider range of consumergoods than just toiletries.
MARKET LEADERS — MANUFACTURERS
Avon Cosmetics Ltd
Company Structure
Avon Cosmetics Ltd is one of the world’s leading direct sellers of beauty andrelated products, marketing to women in more than 100 countries throughapproximately 6.5 million independent sales representatives. Having enteredthe UK market in 1959, the company claims to be one of the top three beautybrands in the country today. The company’s head office is located inNorthampton and supports operations in both the UK and European market.
Current and Future Developments
In March 2011, over 5,000 independent Avon representatives joined AvonChairman and CEO Andrea Jung at a concert in Birmingham to mark Avon’s125th anniversary. In May, Avon Cosmetics Ltd was crowned the winner of theEnvironmental Award at the Direct Selling Association (DSA) Conference.
Financial Results
In the year ending 31st December 2009, Avon Cosmetics Ltd registered aturnover of £316.6m, a decrease of 0.6% from £318.6m in the previous year.Its pre-tax profit dropped significantly, from £20.6m to a loss of £7.1m over thesame period.
Toiletries Competitor Analysis
© Key Note Ltd 2011 24
Estée Lauder Cosmetics Ltd
Company Structure
Estée Lauder Cosmetics Ltd is a US-based company, which was established in1946. The company entered the European market in 1960, after setting upoperations in London. Its product range covers skincare, cosmetics, perfumeand haircare products, which are sold in more than 135 countries. Its subsidiaryoperations include Clinique Laboratories, Jo Malone and Bobbi Brown.
Current and Future Developments
In December 2010, the company announced that it had signed Puerto Ricanmodel Joan Smalls as the new face for its cosmetics and skincare advertisingcampaigns. In March 2011, Estee Lauder launched a new fragrance —Adventurous — which is exclusive to travel retail. The product is a fragrancedesigned for the modern jet setter, and is available at all Estee Lauder travelretail locations worldwide.
Financial Results
In the 12 months ending 30th June 2010, turnover at Estée Lauder CosmeticsLtd reached £365.9m, up by 5.9% from £345.6m in the previous year. Its pre-taxprofit also improved, increasing by 7.1% from £56.2m in the previous year to£60.2m in 2010.
L’Oréal (UK) Ltd
Company Structure
Based in London, L’Oréal (UK) Ltd is a subsidiary of the French company L’OréalSA and specialises in women’s make-up, skincare, hair care, dermatology andfragrances. In 2006, the company acquired The Body Shop International for£652m.
Current and Future Developments
In March 2010, L’Oreal’s YSL Beauty brand and Ermenegildo Zegna agreed toput an early termination to their existing license agreement for the creationand development of fine fragrances under the Ermenegildo Zegna brand. Themove was based on L’Oreal’s Luxury Division objective to focus its men’sperfume business on a number of limited brands which include — amongothers — Giorgio Armani, Ralph Lauren, Yves Saint Laurent and Diesel.
In May, L’Oreal was recognised for its innovative reporting on sustainabledevelopment by Ethical Corporation, an organisation that promotes debateand discussion about corporate social responsibility.
Toiletries Competitor Analysis
© Key Note Ltd 2011 25

Financial Results
In the year ending 31st December 2009, turnover at L’Oréal UK Ltd increasedby 2.2% to £745.8m, compared with £730.1m in the previous year. Pre-taxprofit increased by 25.8% from £74m to £93.2m.
Procter & Gamble (Health & Beauty Care) Ltd
Company Structure
P&G Ltd was founded in 1837 by William Procter and James Gamble. Whatstarted off as a small family-run soap and candle company in the US is nowconsidered to be the world’s largest consumer goods company. It owns manywell-known branded products, including Fairy Liquid washing-up liquid, andGillette. Its UK subsidiary, P&G (Health & Beauty Care) Ltd, is based in Surrey.
Current and Future Developments
In February 2011, P&G announced its Oral-B brand had appointed Dr JamesRussell as its ambassador, who was known for his work on Channel 4’s primetime Embarrassing Bodies series. In April, P&G launched its ‘Proud Sponsor ofMums’ campaign for Mother’s Day, to promote its own corporate brand forthe first time in the UK, in addition to the outlay campaigns for its 50-plushousehold products including Pringles, Pampers and Pantene.
Financial Results
In the year ending 30th June 2010, Procter & Gamble (Health & Beauty Care)Ltd recorded a pre-tax loss of £10.1m, down from a profit of £77.7m in theprevious year. Total turnover for the same period is not available from the atthe time of writing, July 2011.
PZ Cussons PLC
Company Structure
Known as Paterson Zochonis PLC until 2002, PZ Cussons manufactures personaland household cleaning products in Europe, Asia and Africa. Its origins go backto 1879, when George Paterson and George Zochonis set up a trading post inSierra Leone. It acquired the soap-making Cussons Group Ltd in 1975.
Current and Future Developments
In February 2011, PZ Cussons announced it would form a new beauty divisioncomprising its premium beauty brands: St Tropez, The Sanctuary and CharlesWorthington. The division is based in Covent Garden, London and aims tomaximise the three ranges and their presence both in the UK andinternationally.
Toiletries Competitor Analysis
© Key Note Ltd 2011 26

Financial Results
In the year ending 31st May 2010, PZ Cussons PLC recorded a turnover of£771.6m, a decrease of 7.9% from £838.1m in the previous 12 months.However, its pre-tax profit grew by 20.6%, from £84.4m to £101.8m over thesame period.
Unilever PLC
Company Structure
Originally two separate legal entities — Unilever NV and Unilever PLC — withseparate stock-exchange listings, the Unilever Group announced a series ofsignificant changes to streamline its management and leadership in 2005.Unilever is home to brands such as: Knorr, Hellmann’s, Lipton, Dove, Vaseline,Persil, Cif and Marmite.
Current and Future Developments
In February 2011, Unilever reported savings of €1.4bn in 2010 throughlowering supply chain costs and indirect costs, well ahead of the €1bn thegroup was targeting at the start of the year. Later in April, Unilever sold Sanex,the multi-category personal care brand, to Colgate for €672m. Sanex wasacquired by Unilever from Sara Lee in 2009. In May 2011, Unilever completedthe acquisition of Alberto Culver Company, manufacturer and distributor ofbeauty care and other personal care brands, including TRESemme, AlbertoVO5, St. Ives and Simple. Unilever paid $3.7bn in cash for the acquisition.
Financial Results
In the year ending 31st December 2010, turnover at Unilever PLC grew by11.1%, to €44.26bn, up from €39.82bn in 2009. Over the same period, itspre-tax profit increased by 24.7%, from €4.92bn to €6.13bn.
MARKET LEADERS — RETAILERS
Alliance Boots Ltd
Company Structure
Alliance Boots Ltd is a privately owned company and a leading internationalpharmacy-led health and beauty group. It offers a wide range of products andservices to its customers. The company, which employs over 115,000 people,has two core business divisions — pharmacy-led health and beauty retailing;and pharmaceutical wholesaling. Its wholesale and distribution network servesover 150,000 pharmacies, doctors, health centres and hospitals from over 360pharmaceutical wholesale distribution centres in 16 countries. The companywas taken over by private-equity firm Kohlberg Kravis Roberts (KKR) in 2007.
Toiletries Competitor Analysis
© Key Note Ltd 2011 27

Current and Future Developments
In March 2011, Alliance Boots agreed to produce beauty and skin care productsfor the world’s second largest supermarket chain, Carrefour. Boots will bemaking the products, including cosmetics, bathing and hair care, which will besold under Carrefour’s own name. Boots also planned to open its nextdrive-through store at St James Retail Park in Northampton in May 2011, anda further 20 in the next few years. The format aims to allow customers to driveup to a window where they can drop off or pick up prescriptions rather thanqueuing up in stores.
At the time this Key Note Report was published (June 2011), Boots is workingon a major upgrade of its Advantage Card programme under a project entitledAdvantage Card Futures. The project aims to increase the personalisation ofthe card with mailings tailored to individuals’ shopping patterns and personalneeds, which is to be completed by the end of 2011.
Financial Results
According to the Alliance Boots 2010/2011 Annual Review (see Table 4.1), thecompany’s revenue for its financial year ending 31st March 2011 was £20.22bn,up 8% from £18.72bn in the previous year.
Table 4.1: Alliance Boots Group Revenue and Trading Profit byDivision (£m), Year Ending 31st March 2011
Revenue (£m)Trading Profit
(£m)
Health and beauty 7,626 767
Pharmaceutical wholesale 13,942 320
Contract manufacturing andcorporate costs 253 -36
Intra-group -1,603 -
Total 20,218 1,051
Source: Alliance Boots 2010/2011 Annual Review
Toiletries Competitor Analysis
© Key Note Ltd 2011 28
The Body Shop International PLC
Company Structure
The Body Shop was founded in 1976 by the late entrepreneur Dame AnitaRoddick as a single shop in Brighton. The Body Shop chain now comprises morethan 2,500 stores worldwide, some of which are company-owned, while othersare franchised. The company was bought by the French cosmetic giant L’Orealin 2006, but retains a separate identity from the parent company. The BodyShop is widely known for its focus on environmentally-friendly and fairtradecosmetic products.
Current and Future Developments
In April 2011, the ethical brand launched a petition calling on the Governmentto improve, and offer greater, protection to young children who are victims oftrafficking.
Financial Results
In the 53 weeks ending 2nd January 2010, turnover at The Body ShopInternational PLC had grown by 10.5% to £320.5m, up from £290m on27th December 2008. Its pre-tax profit also increased from £25.4m to £34.7m.
Lush Cosmetics Ltd
Company Structure
Lush Cosmetics Ltd began as a manufacturer and supplier of handmadetoiletries and cosmetics to The Body Shop in 1978, before opening its own shopon the King’s Road, Chelsea, in 1994. It now operates a chain of more than 600stores in 40-plus countries, with its own production facilities in the UK, NorthAmerica and Japan. The company intends to open another factory in Chile toserve the South American market.
Current and Future Developments
In April 2011, Lush decided to pay an hourly rate of £7.85 to its staff at all 11Lush stores in the capital. The decision was hailed as a breakthrough for theLondon Citizens group, which launched the living wage campaign back in 2001.
Financial Results
In the year ending 30th June 2010, turnover at Lush Cosmetics Ltd increasedby 15.2% to £247.2m from £214.m in 2009. Its pre-tax profit increased by 60.2%to £22.3m, from £13.9m in the previous year.
Toiletries Competitor Analysis
© Key Note Ltd 2011 29

Molton Brown Ltd
Company Structure
Molton Brown originated as a hair salon in London’s Mayfair in 1973, but, bythe 1980s, it had expanded into retail products with an emphasis on natural,plant-based toiletries. Molton Brown grooming products are now sold in 70countries worldwide, in its own stores, department-store concessions, spas andonline, and in leading luxury hotels and airlines. In July 2005, Molton Brownwas acquired by the Kao Corporation of Japan, in a £170m deal.
Current and Future Developments
In April 2011, Molton Brown announced the launch of two new products to itsbath, body and fragrance collection. The two products, Vitalising Vitamin AB+C body hydrating gel and Vitalising Vitamin AB+C eau fraiche body spray arenew additions to the brand’s original AB+C bath foam and shower gel.
Financial Results
In the year ending 31st, December 2009, turnover at Molton Brown Ltddecreased marginally (by 2%), to £58.2m from £59.4m in 2009. Its pre-tax profitwas reduced by 54.9%, from £9.6m to £4.3m over the same period.
Superdrug Stores PLC
Company Structure
Superdrug was founded in 1964 by the Goldstein family, who developed thebusiness from a single store and eventually sold it to Kingfisher in 1987. A majorexpansion programme took place in 1988, which included the acquisition ofthe Tip Top chain. In 1989, the company acquired the Medicare chain whichincreased its store base to over 650. In 2002, the company became part of theAS Watson family, the world’s largest health and beauty retailer. Today,Superdrug Stores PLC is the UK’s second-largest beauty and health retailer, andcurrently has over 900 stores across the UK.
Current and Future Developments
In May 2011, Superdrug launched its first loyalty card for customers to enablethem to earn points online and in-store. The loyalty card will be known as theBeautycard and doubles as a mirror; it offers one point for every pound spent,with 100 points translating into a pound to spend in store. The launch wasaccompanied by points promotions both in store and online.
Financial Results
Superdrug Stores PLC registered a turnover of £1.07bn in the year ending26th December 2009, almost unchanged on the previous year. In 2010, this fellslightly to £1.05bn. Pre-tax profit, meanwhile, increased from a loss of £7.4min 2008 to a loss of £234,000 in 2009, before reaching £9.3m in 2010.
Toiletries Competitor Analysis
© Key Note Ltd 2011 30
OUTSIDE SUPPLIERS
Research and Development
The Scientific advisory Committee (SAC), which is part of the Cosmetic Toiletryand Perfumery Association (CTPA), consists of senior scientists form leadingcosmetics, fragrances and toiletries companies, who advise and give help onthe safety of ingredients and production procedures. Others giving advice andguidance for safety evaluation and risk assessment include the Intertek Group.Founded more than 100 years ago, it is an industry leader in quality, processand systems, employing more than 30,000 people in 1,000 locations in over 100countries.
Raw Materials
Givaudan is a Swiss manufacturer of flavouring and fragrances. Its FineFragrance division has created perfumes that include L’Air du Temps by NinaRicci, Thierry Mugler’s Angel and Prada’s Infusion d’Iris.
Lonza Group Ltd is a leading supplier to the pharmaceutical, healthcare andlife science industries. Headquartered in Basel, Switzerland, it is also a leaderin the production and support of active pharmaceutical ingredients, bothchemically as well as biotechnologically.
Sensient Technologies Corporation is a US-based manufacturer and supplier offlavours, fragrances and colours which are used for foods, beverages,pharmaceuticals, cosmetics, home and personal care products and printing andimaging products. The company has operations in more than 30 countries.
Treatt PLC is an independent supplier to the flavour and fragrance industries.It also supplies products to food, beverage, soap, perfumery, cosmetic andpharmaceutical companies. Treatt manufactures and supplies a vast range ofproducts, from essential oils and natural fractions to high-impact specialtyaroma chemicals. The company is publicly traded and listed on the LondonStock Exchange (LSE).
Processing Machinery, Packaging and components
Suppliers of equipment, such as moulds, pumps, mixers, blenders andequipment for processing, packaging, solids/fluids handling and control,include the German company Dieter Bakic, Chesterfield-based Robinson PLC,Harlands Labels, Vetroplas Packaging, Boxes Prestige Ltd, Rio Tinto, andMeason Freer Ltd, among many others.
Toiletries Competitor Analysis
© Key Note Ltd 2011 31

Outsourcing
Swallowfield PLC is one of the leading suppliers of contract outsourcingservices to the toiletries and cosmetics industry. Founded in 1876, its servicesinclude formulating, manufacturing and packaging cosmetics and toiletries forown-label and brand names. In 2009, it worked in collaboration with theclothing store Primark, developing the Beautiful Colour Cosmetics range,which went on sale in 30 Primark stores across the UK.
MARKETING ACTIVITY
Main Media Advertising Expenditure
Total expenditure on the main media advertising of toiletries amounted to£354.3m for the year ending March 2011, up by 3% from £343.9m in theprevious year. As can be seen in Table 4.2, hair care products had the largestadvertising budget in 2011, accounting for 36.4% of total expenditure,followed by skincare products, which accounted for 29% of the total.
Table 4.2: Main Media Advertising Expenditure on Toiletries bySector (£000), Years Ending March 2010 and 2011
2010 2011
Personal Wash and Bathroom Products
Deodorants 35,199 36,515
Bath toiletries, shower gels and wipes 6,935 10,579
Liquid foam bath and liquid soap 5,747 4,160
Bath and beauty ranges 1,924 2,676
Total personal wash and bathroomproducts 49,805 53,930
Skincare Products
Skincare (excluding suncare/tanning) 100,956 94,060
Suncare and tanning 8,512 8,868
Total skincare products 109,468 102,928
Table continues...
Toiletries Competitor Analysis
© Key Note Ltd 2011 32

Table 4.2: Main Media Advertising Expenditure on Toiletries bySector (£000), Years Ending March 2010 and 2011
...table continued
2010 2011
Hair Care Products
Shampoos and conditioners 50,328 57,889
Hair colourants 42,515 48,111
Hair product ranges 9,290 8,938
Hair styling aids 9,804 7,701
Hairsprays 5,861 6,480
Total hair care products 117,798 129,119
Oral Care Products
Toothpaste and polishes 28,422 25,460
Other oral hygiene products 15,346 19,259
Total oral care products 43,768 44,719
Shaving Products
Wet razors and blades 12,918 19,580
Shaving preparations 4,861 1,209
Depilatories and bleach 5,246 2,845
Total shaving products 23,025 23,634
Total 343,864 354,330
Source: Nielsen Media Research
Personal Wash and Bathroom Products
• Deodorants
As shown in Table 4.3, main media advertising expenditure on deodorants inthe year ending March 2011 was £36.5m, up by 3.7% from £35.2m in theprevious year. Unilever was the biggest spender in this category, backing itsSure brand with £9.2m and its Dove and Elide Lynx brands by £8m and £6.3m,respectively. Beiersdorf supported its NIVEA deodorant brand with advertisingexpenditure of £5.4m over the same period.
Toiletries Competitor Analysis
© Key Note Ltd 2011 33

Table 4.3: Main Media Advertising Expenditure on Deodorants(£000), Year Ending March 2011
L’Oreal
Men Expert 48h Dry Full Power deodorant 1,430
Men Expert 48h Dry Non Stop deodorant 217
Total L’Oreal 1,647
Sure
Sure for Men 603
Sure for Men Sport 337
Sure for Men Sport Defence 748
Sure Crystal for Women 823
Sure for Women 3,656
Sure for Women Cotton Fresh 624
Sure Maximum Protection women’s deodorant 1,382
Sure Natural Minerals women deodorant 1,012
Total Sure 9,185
Garnier
Garnier Invisi Calm deodorant 401
Mineral 48hr Protection deodorant 248
Mineral 48hr deodorant for women 1,445
Total Garnier 2,094
Elida
Lynx deodorant range 1,972
Lynx Dry+Sensitive deodorant 2,624
Impulse Body Sprays 560
Impulse Generic 630
Impulse Into Glamour 492
Total Elida 6,278
Table continues...
Toiletries Competitor Analysis
© Key Note Ltd 2011 34

Table 4.3: Main Media Advertising Expenditure on Deodorants(£000), Year Ending March 2011
...table continued
Dove
Deodorant for women 2,656
Go Fresh deodorant 174
Hair Minimising anti-perspirant 630
Invisible Dry Deodorant 1,755
Men+Care Clean Comfort deodorant 2,800
Total Dove 8,015
NIVEA
Calm & Care deodorant for women 3,831
Invisible Black & White range 1,419
Silver Protect deodorant for men 144
Total NIVEA 5,394
Right Guard
Right Guard deodorant spray 203
Right Guard Xtreme deodorant 1,264
Total Right Guard 1,467
Sanex deodorant range 977
Gillette Series anti-perspirant 772
Sub-threshold brands 686
Total 36,515
Source: Nielsen Media Research
• Bath Toiletries, Shower Gels and Wipes
Main media advertising expenditure on bath toiletries and shower gelsamounted to £6.9m in 2011 (see Table 4.4). Unilever spent a combined £4.6mto promote its Dove, Radox and Elida Lynx brands, while PZ Cussons supportedits Imperial Leather brand with £1.1m.
Toiletries Competitor Analysis
© Key Note Ltd 2011 35

Table 4.4: Main Media Advertising Expenditure on BathToiletries and Shower Gels (£000), Year Ending March 2011
Dove
Dove Men+Care body & face wash 659
Dove Visible Care Nutrium Moisture 924
Total Dove 1,583
Imperial Leather
Imperial Leather Skin Kind Hydrate 175
Imperial Leather Skin Kind Refresh 108
Imperial Leather Skin Kind Range 837
Total Imperial Leather 1,120
Radox
Radox shower gel and shampoo for men 1,309
Radox Men shower gel range 202
Radox Shower Smoothies 661
Total Radox 2,172
Sanex
Sanex Dermo Moisturising shower gel 115
Sanex Dermo Protector shower gel 554
Total Sanex 669
Palmolive Naturals Nutra Fruit 182
Elida Lynx Rise shower gel 893
Sub-threshold brands 267
Total Shower Gel 6,886
Source: Nielsen Media Research
In the mass-market cleansers and wipes product sector, the brand that receivedthe highest advertising spending was Simple’s Kind to Skin cleansing wipes,accounting for 46.8% of total category spending in the year ending March2011 (see Table 4.5).
Toiletries Competitor Analysis
© Key Note Ltd 2011 36

Table 4.5: Main Media Advertising Expenditure on Mass-MarketCleaners and Wipes (£000), Year Ending March 2011
Clearasil Skin Perfecting wash 146
Loreal Dermo Expertise Perfect Clean gel 521
Loreal Dermo Expertise Perfect Clean scrub 443
Neutrogena Wave Duo Power cleanser 593
NIVEA Visage Daily Essentials wipes 104
Simple Kind to Skin cleansing wipes 1,728
Sub-threshold brands 157
Total Ϯ3,693
† — does not sum due to rounding
Source: Nielsen Media Research
• Liquid Foam Bath and Liquid Hand Soap
Main media advertising expenditure on liquid foam bath and hand soapamounted to £4.2m in 2011, a decrease from £5.7m in the previous year. Thebrand that received the strongest backing was Dettol’s No Touch hand soapsystem, which accounted for 79.1% of spending in this category.
Table 4.6: Main Media Advertising Expenditure on Liquid FoamBath and Liquid Hand Soap (£000), Year Ending March 2011
Cussons Carex anti-bacterial handwash 82
Cussons Carex handwash 722
Dettol No Touch hand soap system 3,292
Total liquid foam bath 26
Sub-threshold brands 38
Total 4,160
Source: Nielsen Media Research
Toiletries Competitor Analysis
© Key Note Ltd 2011 37

• Bath and Beauty Ranges
Annual main media advertising expenditure on mass-market bath and beautyranges increased from £1.9m in March 2010 to £2.7m in the following year. TheNIVEA product range received the highest advertising expenditure, accountingfor approximately half (50.9%) of total spending in this category.
Table 4.7: Main Media Advertising Expenditure on Mass-MarketBath and Beauty Ranges (£000), Year Ending March 2011
Dove product range 92
Johnson & Johnson generic 686
Johnson & Johnson product range 80
NIVEA generic 141
NIVEA product range 1,361
Space NK beauty range 84
Sub-threshold brands 232
Total 2,676
Source: Nielsen Media Research
Skincare Products
Total expenditure on skincare advertising in the main media amounted to£102.9m in the year ending March 2011, down from £109.5m in the previousyear.
Table 4.8: Main Media Advertising Expenditure on Skincare byType (£000), Year Ending Marching 2011
Skincare for Women
Mass-market women’s facial skincare 52,857
Mass-market women’s body skincare 18,552
Premium women’s facial skincare 8,228
Mass-market women’s medicated facial skincare 7,324
Premium women’s body skincare 56
Table continues...
Toiletries Competitor Analysis
© Key Note Ltd 2011 38

Table 4.8: Main Media Advertising Expenditure on Skincare byType (£000), Year Ending Marching 2011
...table continued
Skincare for Men
Mass-market men’s facial skincare 6,866
Premium men’s facial skincare 177
Suncare and Tanning
Mass-market suncare and tanning 8,739
Premium suncare and tanning 129
Total 102,928
Source: Nielsen Media Research
• Women’s Skincare
A total of £52.9m was spent on advertising mass-market women’s facialskincare in 2011, of which Olay and L’Oreal were responsible for the lion’sshare. They contributed 32% and 30% of total expenditure, respectively.Garnier was the third biggest spender in this sector, contributing a further13.9% of the total.
Table 4.9: Main Media Advertising Expenditure on Mass-MarketWomen’s Facial Skincare (£000), Year Ending March 2011
Avon
Anew Clinical Luminosity Pro 331
Anew Emulsions range 598
Anew Regime Starter Kit 610
Total Avon 1,539
Garnier
Anti-dark circles roll on 5,110
Nutritionist eye roll on 259
Skin Natural Ultra ProX roll on 162
Table continues...
Toiletries Competitor Analysis
© Key Note Ltd 2011 39

Table 4.9: Main Media Advertising Expenditure on Mass-MarketWomen’s Facial Skincare (£000), Year Ending March 2011
...table continued
Garnier (cont.)
Skin Natural Ultra Lift range 230
Skin Natural Ultra Lift roll on 84
Skin Natural Ultra Lift SPF15 1,504
Total Garnier 7,349
Johnson’s
Daily Essentials facial moisturizer 544
Daily Essentials face care 320
Total Johnson’s 864
L’Oreal
Dermo Exage Perfect range 564
Dermo Exage re-perfect 110
Collagen Double act lip 837
Dermo Expertise CollagenMicro-Vibration Eye 2,187
Dermo Expertise Revitalift 1,975
Dermo Expertise Revitalift ProConturing System 2,158
Dermo Expertise Youth Code 6,184
Dermo Expertise Youth Code range 1,826
Total L’Oreal 15,841
NIVEA
Visage Q10 plus day cream 1,766
Visage Q10 plus product range 978
Total NIVEA 2,744
Olay
Anti-wrinkle Aqua Physics serum 2,014
Anti-wrinkle classic deep wrinkletreatment 627
Anti-wrinkle range 350
Table continues...
Toiletries Competitor Analysis
© Key Note Ltd 2011 40

Table 4.9: Main Media Advertising Expenditure on Mass-MarketWomen’s Facial Skincare (£000), Year Ending March 2011
...table continued
Olay (cont.)
Complete Care range 576
Complete Care Touch of Foundation 501
Definity Colour Enhancer Anti-ageingmoisturiser 420
Generic 171
Regenerist daily 3 point treatmentcream 3,185
Skincare range 1,185
Total effects 7x day moisturiser 5,008
Total Effects range 252
Total Effects Touch of Foundation 651
Total Effects Wake Up Wonder 1,957
Total Olay 16,897
Roc
Retin Ox Wrinkle Correxion 712
Sublime Energy Eye 1,412
Total Roc 2,124
Simple
Kind To Skin range 90
Kind To Skin Vital Vitamin moisturiser 989
Kind To Skin Vital Vitamin range 119
Total Simple 1,198
Vichy
Liftactiv Retinol HA Night 342
Normaderm 389
Total Vichy 731
Good Skin Tri-Aktiline Deep WrinkleFiller 440
Imedeen skincare range 118
Table continues...
Toiletries Competitor Analysis
© Key Note Ltd 2011 41
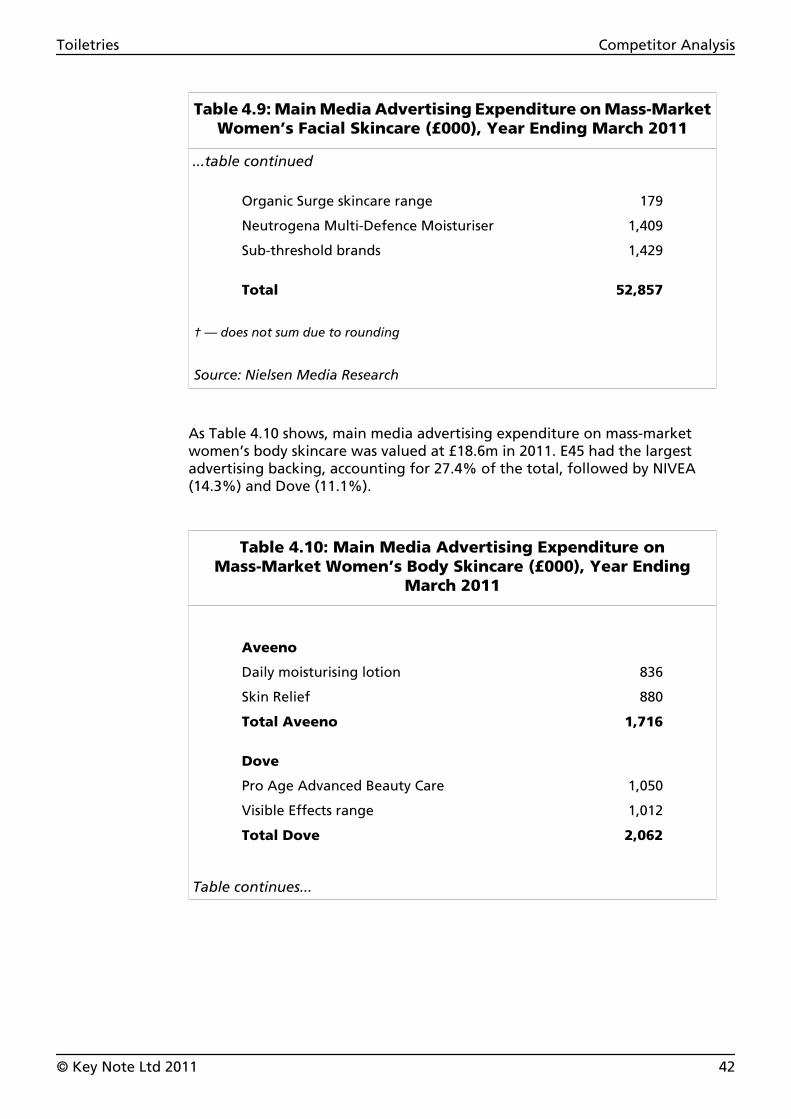
Table 4.9: Main Media Advertising Expenditure on Mass-MarketWomen’s Facial Skincare (£000), Year Ending March 2011
...table continued
Organic Surge skincare range 179
Neutrogena Multi-Defence Moisturiser 1,409
Sub-threshold brands 1,429
Total Ϯ52,857
† — does not sum due to rounding
Source: Nielsen Media Research
As Table 4.10 shows, main media advertising expenditure on mass-marketwomen’s body skincare was valued at £18.6m in 2011. E45 had the largestadvertising backing, accounting for 27.4% of the total, followed by NIVEA(14.3%) and Dove (11.1%).
Table 4.10: Main Media Advertising Expenditure onMass-Market Women’s Body Skincare (£000), Year Ending
March 2011
Aveeno
Daily moisturising lotion 836
Skin Relief 880
Total Aveeno 1,716
Dove
Pro Age Advanced Beauty Care 1,050
Visible Effects range 1,012
Total Dove 2,062
Table continues...
Toiletries Competitor Analysis
© Key Note Ltd 2011 42

Table 4.10: Main Media Advertising Expenditure onMass-Market Women’s Body Skincare (£000), Year Ending
March 2011
...table continued
E45
Dermatological cream 2,283
Endless Moisture body lotion 317
Endless Moisture Radiance 243
Endless Moisture range 1,899
E45 lotion 343
Total E45 5,085
Johnson’s
24 hour moisture body lotion 230
Daily Essentials range 394
Total Johnson’s 624
NIVEA
Body moisturiser range 1,018
Q10 Plus firming lotion 1,642
Total NIVEA 2,660
L’Oreal Body Expertise Perfect Slim 375
Garnier Body Intensive 7 Days 1,061
Astral Moisturising cream 144
Mama Mio Get Waisted Body Shaping 214
Neutrogena Norwegian Deep Moisture 763
Palmers Cocoa Butter Formula range 285
Sudocrem Skincare cream 339
Union Swiss Bio-oil skincare 1,661
Vaseline Sheer Infusion body lotion 711
Sub-threshold brands 854
Total Ϯ18,552
† — does not sum due to rounding
Table continues...
Toiletries Competitor Analysis
© Key Note Ltd 2011 43

Table 4.10: Main Media Advertising Expenditure onMass-Market Women’s Body Skincare (£000), Year Ending
March 2011
...table continued
Source: Nielsen Media Research
In the year ending March 2011, £8.2m was spent on advertising premiumwomen’s facial skincare. Genifigue by Lancome was the product with thelargest promotional budget, accounting for approximately a quarter (25.1%)of the total advertising expenditure in this category.
Table 4.11: Main Media Advertising Expenditure on PremiumWomen’s Facial Skincare (£000), Year Ending March 2011
Clarins
Beauty Flash Balm 263
Multi-Active day cream 184
Vital Light day cream 1,022
Total Clarins 1,469
Clinique
All About Eyes 101
Even Better Dark Spot Corrector 1,601
Total Clinique 1,702
Estee Lauder
Advanced Night Repair range 1,486
Daywear SPF15 range 261
Time Zone Line moisturiser 103
Total Estee Lauder 1,850
Lancome
Genifique 2,062
Renergie Lift Volumetry 92
Total Lancome 2,154
Table continues...
Toiletries Competitor Analysis
© Key Note Ltd 2011 44

Table 4.11: Main Media Advertising Expenditure on PremiumWomen’s Facial Skincare (£000), Year Ending March 2011
...table continued
Origins Ginzing eye cream 83
Sanctuary Therapist’s Secret 95
Sub-threshold brands 874
Total Ϯ8,228
† — does not sum due to rounding
Source: Nielsen Media Research
Main media advertising expenditure on mass-market women’s medicatedfacial skincare was valued at £7.3m in 2011. Garnier’s Skin Naturals Pure Activeand Frederm’s gel were the two products with the biggest advertisingexpenditure, accounting for 24% and 23.3% of the total, respectively.
Table 4.12: Main Media Advertising Expenditure onMass-Market Women’s Medicated Facial Skincare (£000), Year
Ending March 2011
Clearasil
Overnight wash 889
Clearasil product range 384
Rapid Action 389
Ultra Overnight lotion 140
Total Clearasil 1,802
Garnier
Skin Naturals Pure Active 1,760
Skin Natural Pure Active Tinted roll on 307
Total Garnier 2,067
Doctor Brand Blemish Relief 121
Freederm gel 1,707
Table continues...
Toiletries Competitor Analysis
© Key Note Ltd 2011 45

Table 4.12: Main Media Advertising Expenditure onMass-Market Women’s Medicated Facial Skincare (£000), Year
Ending March 2011
...table continued
Johnson’s Clean & Clear spot control 575
Neutrogena Visibly Clear Pink facial 499
Proactiv Solution Acne Treatment 186
Sub-threshold brands 367
Total 7,324
Source: Nielsen Media Research
• Men’s Skincare
Main media advertising expenditure on mass-market men’s skincare wasvalued at £6.9m in the year ending March 2011. As can be seen in Table 4.13,L’Oreal was the biggest spender, backing up its Men Expert Hydra Energeticproducts with £4.6m, which accounted for 67.3% of the total advertisingexpenditure in this category.
Table 4.13: Main Media Advertising Expenditure onMass-Market Men’s Skincare (£000), Year Ending March 2011
L’Oreal
Men Expert Hydra Energetic eye roll on 2,703
Men Expert Hydra Energetic Fatigue 1,601
Men Expert Hydra Energetic TurboBooster 203
Men Expert Hydra Energetic range 113
Total L’Oreal 4,620
Gillette Series Energising moisturiser 2,148
NIVEA for men Q10 Revitalising gel 92
Sub-threshold brands 7
Table continues...
Toiletries Competitor Analysis
© Key Note Ltd 2011 46

Table 4.13: Main Media Advertising Expenditure onMass-Market Men’s Skincare (£000), Year Ending March 2011
...table continued
Total Ϯ6,866
† — does not sum due to rounding
Source: Nielsen Media Research
• Suncare and Tanning Products
In the year ending in March 2011, main media advertising expenditure onmass-market suncare and tanning products increased by 4.2%, to £8.9m.Garnier had the highest advertising expenditure in this category andaccounted for 34.3% of the total. It is followed by NIVEA and L’Oreal, whichaccounted for 24.7% and 22.5% of the total, respectively.
Table 4.14: Main Media Advertising Expenditure onMass-Market Suncare and Tanning Products (£000), Year Ending
March 2011
Garnier
Ambre Clear spray 167
Ambre Solaire Golden Protect 234
Ambre Kids Rapido 50 SPF 589
Ambre Light & Silky Milk 1,283
Ambre Light & Silky range 95
Ambre Sun Protect range 83
Ambre Bronzer Spray 85
Ambre No Streaks Bronzer 508
Total Garnier 3,044
NIVEA
NIVEA Sun Invisible Protection spray 370
NIVEA Sun Protect & Bronze 1,419
NIVEA Sun Kids Swim & Play lotion 404
Table continues...
Toiletries Competitor Analysis
© Key Note Ltd 2011 47
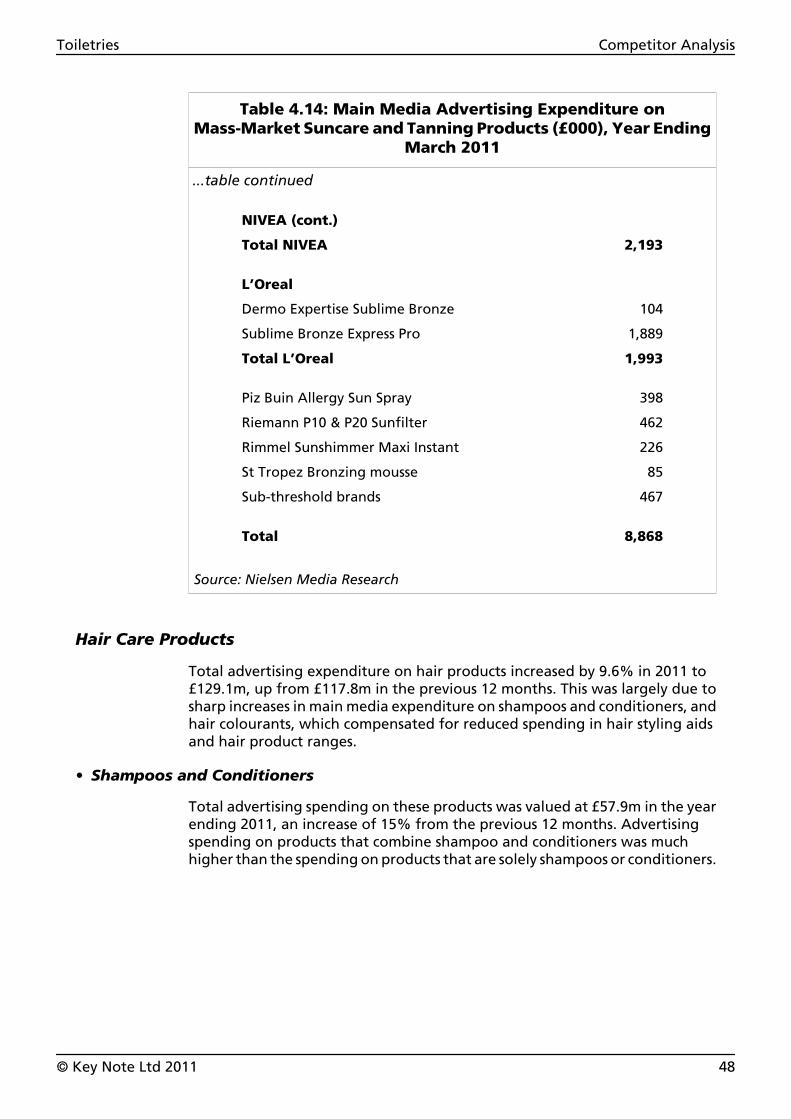
Table 4.14: Main Media Advertising Expenditure onMass-Market Suncare and Tanning Products (£000), Year Ending
March 2011
...table continued
NIVEA (cont.)
Total NIVEA 2,193
L’Oreal
Dermo Expertise Sublime Bronze 104
Sublime Bronze Express Pro 1,889
Total L’Oreal 1,993
Piz Buin Allergy Sun Spray 398
Riemann P10 & P20 Sunfilter 462
Rimmel Sunshimmer Maxi Instant 226
St Tropez Bronzing mousse 85
Sub-threshold brands 467
Total 8,868
Source: Nielsen Media Research
Hair Care Products
Total advertising expenditure on hair products increased by 9.6% in 2011 to£129.1m, up from £117.8m in the previous 12 months. This was largely due tosharp increases in main media expenditure on shampoos and conditioners, andhair colourants, which compensated for reduced spending in hair styling aidsand hair product ranges.
• Shampoos and Conditioners
Total advertising spending on these products was valued at £57.9m in the yearending 2011, an increase of 15% from the previous 12 months. Advertisingspending on products that combine shampoo and conditioners was muchhigher than the spending on products that are solely shampoos or conditioners.
Toiletries Competitor Analysis
© Key Note Ltd 2011 48

Table 4.15: Main Media Advertising Expenditure on Shampoosand Conditioners by Type (£000), Year Ending March 2011
Shampoo and conditioners 45,388
Shampoo only 8,215
Conditioners only 4,286
Total 57,889
Source: Nielsen Media Research
As Table 4.16 shows the brand that received by far the largest spend across theentire shampoo/conditioner category was Pantene’s Pro V, supported by£11.7m in 2011 and accounting for 25.7% of total expenditure on shampoosand conditioners. Other products supported by significant promotionalbudgets were L’Oreal’s Elvive (£8.7m), Clairol’s Herbal Essence (7.2m) and Head& Shoulders (£6.1m).
Table 4.16: Main Media Advertising Expenditure on Shampoosand Conditioners (£000), Year Ending March 2011
Shampoos and Conditioners
Alberto VO5 271
Aussie 3 Minute Miracle 2,117
Charles Worthington range 261
Clairol Herbal Essences range 7,194
Head & Shoulders range 6,147
John Frieda range 1,545
L’Oreal Elvive range 8,749
Pantene Pro V hair product range 11,658
Schwarzkopf Gliss Hair Repair 187
Timotei range 1,381
Tresemme range 5,547
Sub-threshold brands 329
Total Ϯ45,388
Table continues...
Toiletries Competitor Analysis
© Key Note Ltd 2011 49

Table 4.16: Main Media Advertising Expenditure on Shampoosand Conditioners (£000), Year Ending March 2011
...table continued
Shampoos Only
Alpecin Caffeine shampoo 1,369
Head & Shoulders Classic Clean 869
Head & Shoulders shampoo 4,434
Loreal Elvive colour protect shampoo 766
Tresemme Instant Refresh 652
Sub-threshold brands 124
Total Ϯ8,215
Conditioners Only
Aussie 3 Minute Miracle 1,364
Aussie Limited Edition Colour Mate 239
Head & Shoulders conditioner 166
John Frieda Frizz Ease serum 840
Kerastase Chroma Sensitive 80
Loreal Elvive Full Restore 1,515
Sub-threshold brands 83
Total Ϯ4,286
† — does not sum due to rounding
Source: Nielsen Media Research
• Hair Colourants
Main media advertising expenditure on hair colourants increased by 13.2% in2011, to a total of £48.1m. The two brands that received the strongestadvertising support were Clairol and L’Oreal, accounting for a combined 64.5%of the total expenditure in this category. L’Oreal spent a further £9m backingits Garnier brand, which accounted for 18.7% of the total.
Toiletries Competitor Analysis
© Key Note Ltd 2011 50

Table 4.17: Main Media Advertising Expenditure on HairColourants (£000), Year Ending March 2011
Clairol
Nice ’n Easy Colour Blend 3,063
Nice ’n Easy Permanent 7,405
Nice ’n Easy Perfect 10 5,448
Nice ’n Easy Non Permanent 109
Total Clairol 16,025
Garnier
Garnier Belle Color 2,432
Garnier Herbashine 809
Nutrisse colour cream 5,734
Total Garnier 8,975
L’Oreal
Excellence 10 3,197
Excellence Creme 1,547
Loreal Feria 3D 235
Loreal Men Expert Excell 5 702
Recital Preference 1,725
Casting Creme Gloss 5,902
Casting Sublime Mousse 1,676
Total L’Oreal 14,984
Schwarzkopf
Schwarzkopf Live XXL 1322
Schwarzkopf Palette cream colour 2,497
Total Schwarzkopf 3,819
Combe
Just For Men hair colour 1,123
Just For Men Touch of Grey 187
Total Combe 1,310
Table continues...
Toiletries Competitor Analysis
© Key Note Ltd 2011 51

Table 4.17: Main Media Advertising Expenditure on HairColourants (£000), Year Ending March 2011
...table continued
John Frieda Precision Foam 2,467
Colour B4 hair colour remover 146
Sub-threshold brands 385
Total 48,111
Source: Nielsen Media Research
• Hair Product Ranges
Total expenditure on hair product ranges declined from £9.3m in 2010 to £8.9min 2011. With a value of £2.3m, Dove Damage Therapy was the brandsupported by the highest advertising expenditure in this category, followed byPantene Pro V (£2.2m) and L’Oreal’s Elvive Nutri-Gloss (£2m).
Table 4.18: Main Media Advertising Expenditure on HairProduct Ranges (£000), Year Ending March 2011
Aussie hair care range 232
Charles Worthington Full Volume range 109
Dove Damage Therapy range 2,272
John Frieda Frizz Ease product range 731
L’Oreal Elvive Nutri-Gloss range 1,968
Pantene Pro V Colour Protect & Smooth 1,702
Pantene Pro V Smooth & Sleek range 461
Tresemme 24 Hour Body range 1,138
Sub-threshold brands 325
Total 8,938
Source: Nielsen Media Research
Toiletries Competitor Analysis
© Key Note Ltd 2011 52

• Hair Styling Aids
Main media advertising expenditure on hair styling gels, waxes, mousses, etc.,was valued at £7.7m in 2011, a decline from £9.8m in the previous 12 months.Alberto Culver’s VO5 range received the largest advertising spend in thiscategory, accounting for more than half (50.2%) of the total expenditure.
Table 4.19: Main Media Advertising Expenditure on Hair StylingAids (£000), Year Ending March 2011
Alberto VO5 Extreme 3,686
Schwarzkopf Got2b range 126
Avon Advance Techniques Lotus Shield 554
Garnier Fructis Style Survivor 631
L’Oreal Studio Indestructible 800
L’Oreal Studio Silk & Gloss Volume range 635
Tresemme 24 Hour Body Dramatic 556
Wella Shockwaves range 502
Sub-threshold brands 211
Total 7,701
Source: Nielsen Media Research
• Hairsprays
Total advertising expenditure on hairsprays increased by 10.6%, from £5.9m in2010 to £6.5m in 2011. In this category, L’Oreal was the biggest spender in 2011,supporting its Elnett hairspray range with a £3.8m advertising budget.
Table 4.20: Main Media Advertising Expenditure on Hairsprays(£000), Year Ending March 2011
L’Oreal
Elnett hairspray 2,374
Elnett Satin Absolute Extreme 287
Elnett Satin hairspray 382
Table continues...
Toiletries Competitor Analysis
© Key Note Ltd 2011 53

Table 4.20: Main Media Advertising Expenditure on Hairsprays(£000), Year Ending March 2011
...table continued
L’Oreal (cont.)
Elnett Satin Love Cheryl 735
Total L’Oreal 3,778
Alberto VO5 Weather Resist 990
Garnier Fructis Style Bamboo spray 268
Tresemme hairspray 624
Wella Silvikrin hairspray 668
Sub-threshold brands 152
Total 6,480
Source: Nielsen Media Research
Oral Care Products
Total expenditure on toothpastes, polishes, mouthwashes, etc., was valued at£44.7m in 2011, up from £43.8m in preceding 12 months. Toothpastes andpolishes accounted for 56.9% of the total spending in this category, a smallershare compared to the previous year (64.9%).
• Toothpastes and Polishes
Expenditure on toothpastes and polishes for the year ending March 2011 wasvalued at £25.5m, a decrease of 10.4% from the previous year. The marketleader, Colgate, supported its brand with £9.3m in 2011. GlaxoSmithKlinespent a total of £11.8m promoting its Sensodyne and Aquafresh brands.
Table 4.21: Main Media Advertising Expenditure onToothpastes and Polishes (£000), Year Ending March 2011
Aquafresh
Big Teeth range 112
Complete Care 260
Fresh & Minty 201
Table continues...
Toiletries Competitor Analysis
© Key Note Ltd 2011 54

Table 4.21: Main Media Advertising Expenditure onToothpastes and Polishes (£000), Year Ending March 2011
...table continued
Aquafresh (cont.)
Iso-Active toothpaste 770
Iso-Active Whitening 993
Little Teeth toothpaste 133
Milk Teeth toothpaste 156
Aquafresh toothpaste 1,269
Triple Protection 1,181
Total Aquafresh 5,075
Arm & Hammer
Brilliant Sparkle 1,178
Enamel Care 134
Enamel Care Sensitive 239
Total Arm & Hammer 1,551
Beverly Hills
Natural White range 79
Sensitive Whitening 85
Beverly Hills formula toothpaste 249
Beverly Hills formula Total Enamel 85
Total Beverly Hills 498
Colgate
Maxfresh mouthwash beads 103
Sensitive Pro-Relief 3,997
Total Advanced Clean 640
Total sensitive 609
Total toothpaste 3,944
Total Colgate 9,293
Table continues...
Toiletries Competitor Analysis
© Key Note Ltd 2011 55

Table 4.21: Main Media Advertising Expenditure onToothpastes and Polishes (£000), Year Ending March 2011
...table continued
Sensodyne
Pronamel Gentle Whitening 896
Pronamel toothpaste 2,032
Rapid Relief 2,788
Sensodyne toothpaste 1,007
Total Sensodyne 6,723
Corsodyl Daily gum & toothpaste 116
Macleans Whitening 1,406
ACDO Blanx Whitening toothpaste 464
Sub-threshold brands 337
Total Ϯ25,460
† — does not sum due to rounding
Source: Nielsen Media Research
• Other Oral Hygiene Products
Advertising expenditure on other oral hygiene products includingmouthwashes amounted to £19.3m in 2011, an increase of 25.5% from theprevious year. The biggest spender in this category was Johnson & Johnson,which backed its Listerine brand with £7.7m in advertisements, accounting for40.1% of the total expenditure.
Table 4.22: Main Media Advertising Expenditure on Other OralHygiene Products (£000), Year Ending March 2011
Mouthwash
Aquafresh Extra Care 2,435
Colgate Plax Dental Rinse 1,431
Corsodyl mouthwash 4,093
Table continues...
Toiletries Competitor Analysis
© Key Note Ltd 2011 56

Table 4.22: Main Media Advertising Expenditure on Other OralHygiene Products (£000), Year Ending March 2011
...table continued
Mouthwash (cont.)
Dentyl mouthwash 1,039
Listerine Antiseptic mouthwash 3,425
Listerine Smart Rinse 931
Listerine Total Care Enamel Guard 3,374
Retardent/Retardex 227
Sensodyne Pronamel Dailymouthwash 123
Sub-threshold brands 95
Total mouthwash Ϯ17,172
Multi-Product
Aquafresh product range 358
Corsodyl product range 1,250
Oral-B Dentaid World Wide Smiles 249
Sensodyne Pronamel product range 129
Sub-threshold brands 102
Total multi-product Ϯ2,087
Total 19,259
† — does not sum due to rounding
Source: Nielsen Media Research
Shaving Products
• Wet Razors and Blades
Main media advertising expenditure on wet razors and blades was valued at£19.6m in year ending March 2011. The market leader, Gillette, invested a totalof £12.1m in its Fusion and Venus ranges, while its competitor, WilkinsonSword, invested £6.5m in its brand products. The two leading manufacturerstogether accounted for 94.7% of all main media advertising expenditure inthis sector.
Toiletries Competitor Analysis
© Key Note Ltd 2011 57

Table 4.23: Main Media Advertising Expenditure on Wet Razorsand Blades (£000), Year Ending March 2011
Gillette
Fusion blades 253
Fusion Power 292
Fusion Proglide razor 2,688
Fusion razor range 4,730
Venus Embrace 2,502
Venus Spa Breeze 1,617
Total Gillette 12,082
Wilkinson Sword
Hydro 5 razor 3,384
Wilkinson Sword productrange 444
Quattro Titanium Precision 556
Quattro Women Bikini 2,081
Total Wilkinson Sword 6,465
Bic razor range 76
Bic Soleil Scent womens razors 93
BNL Microforce razor 677
Sub-threshold brands 187
Total 19,580
Source: Nielsen Media Research
• Shaving Preparations
Expenditure on advertising for shaving preparations decreased dramaticallyfrom £4.9m in 2010 to £1.2m in 2011. Gillette, which spent £3.2m in theprevious year on advertising its shaving preparations, has significantly reducedits expenditure in 2011, to £471,000.
Toiletries Competitor Analysis
© Key Note Ltd 2011 58

Table 4.24: Main Media Advertising Expenditure on ShavingPreparations (£000), Year Ending March 2011
Gillette Generic 102
Gillette series shave care 369
Pitchwell Sheer Skin hair removal 203
Wilkinson Sword Hydro range 301
Sub-threshold brands 221
Total Ϯ1,197
† — does not sum due to rounding
Source: Nielsen Media Research
• Depilatories and Bleach
Main media advertising expenditure on depilatories and bleach decreased by45.8% in 2011. The brand receiving the highest spending was Veet by ReckittBenckiser, which accounted for 82.2% of total expenditure in this category.
Table 4.25: Main Media Advertising Expenditure onDepilatories and Bleach (£000), Year Ending March 2011
Nair hair removal range 433
Veet bikini & underarm kit 178
Veet hair remover 1,568
Veet Suprem Essence range 592
Sub-threshold brands 74
Total 2,845
Source: Nielsen Media Research
Toiletries Competitor Analysis
© Key Note Ltd 2011 59

Exhibitions and Trade Fairs
Beautyworld
Beautyworld is an international trade fair for the perfumery, drug store,cosmetics and hairdressing trades, organised by Messe Frankfurt GmbH. Thenext event will take place from 24th to 26th October 2011 in Osaka, Japan.
Beyond Beauty Paris
Beyond Beauty Paris is the umbrella name covering the trade showsCosmeeting, European Exhibition and Creative. The next event will take placeon 12th to 14th of September 2011 in Paris.
Cosmobelleza & Wellness
Cosmobelleza & Wellness is a leading trade event for companies involved inbeauty and well-being businesses. The trade event shows world-renownedbrands of perfumes, cosmetics, hair care, skincare, toiletries, salon and spaproducts and equipment, raw materials, components, packaging as well asprivate label products and services. The next event is scheduled to take placein February 2012.
Cosmoprof
Cosmoprof has been held annually in April in the Italian city of Bologna since1967, however, there are now three additional events bearing the Cosmoprofbrand: Cosmoprof Asia, which is held in Hong Kong; Cosmoprof Shanghai; andCosmoprof North America, which is held in Las Vegas.
In-Cosmetics
Staged annually in spring in a major European city, In-Cosmetics bringstogether the world’s leading personal care ingredients suppliers, formulators,research and development (R&D) and marketing specialists.
Luxe Pack
Luxe Pack is an annual trade show dedicated to the packaging of luxuryproducts. It is staged in Monaco, with similar Luxe Pack events taking place inNew York and Shanghai. The next event will take place in Monaco on 19th to21st October 2011.
Natural & Organic Products Europe
Natural & Organic Products Europe is the UK’s only trade show for natural andorganic products. The show, which runs annually, attracts thousands of tradebuyers from across the world. It is dedicated to natural, organic, biodynamic,fairtrade, artisan and sustainable products to be used in the beauty industry,in sports nutrition or as pure ingredients, among other things. The next eventwill be held in London’s Olympia on 3rd and 4th April 2011.
Toiletries Competitor Analysis
© Key Note Ltd 2011 60

5. Brand Strategy
INTRODUCTION
Owing to the downturn in the economy and the ensuing changes in customerpriorities and spending habits, even the strongest brands are facing a toughtrading environment. Consumers may decide to trade down from moreexpensive brand’s products to cheaper and private-label brands. On the otherhand, product quality, reputation, customer loyalty and trust also haveconsiderable influence on consumer choice. Equally, brands which are moreresponsive to socioeconomic trends and understand the needs of the customercan be expected to continue to perform well.
THE WORLD’S MOST VALUABLE BRANDS
Interbrand, a leading branding consultancy, compiles an annual league tableof the world’s most valuable brands. Table 5.1 shows the cosmetics, fragrancesand toiletries brands that were included in Interbrand’s most recent top 100global brands by rank and value. It should be noted that, in addition totoiletries, a brand’s value may include other products by the same company.For example, as well as toiletries, Louis Vuitton, Gucci and Giorgio Armani sella range of products including bags, clothing and fashion accessories. Amongthese brands, Gillette, Cartier and Louis Vuitton maintained their rank fromthe previous year, while Gucci, Lancôme and Giorgio Armani — despite thesebrands having increasing their total value in 2010 — moved down in ranking.Brands that appeared in the 2009 top 100 global brands but disappearedaltogether in 2010 include Prada, Chanel and Ralph Lauren.
Table 5.1: Leading Global Brands of Cosmetics and Toiletries byRank and Value ($m), 2010
Value ($m)
Rank Brand
13 Gillette 23,298
16 Louis Vuitton 21,860
44 Gucci 8,346
45 L’Oréal 7,981
64 Avon 5,072
69 Hermes 4,782
75 Johnson & Johnson 4,155
Table continues...
Toiletries Brand Strategy
© Key Note Ltd 2011 61

Table 5.1: Leading Global Brands of Cosmetics and Toiletries byRank and Value ($m), 2010
...table continued
Value ($m)
Rank Brand
77 Cartier 4,052
87 NIVEA 3,734
95 Giorgio Armani 3,443
96 Lancôme 3,403
Source: Interbrand Corporation
CEW AWARDS
CEW UK (Cosmetic Executive Women) is a network of 700 beauty industryinsiders, such as beauty editors, buyers and brand directors. Each year, theyjudge the CEW Awards, having first tested the products. First launched in 2006,the CEW Beauty Awards were created to drive brands awareness as well ashelping consumers find the best products in the market.
Title-sponsored by Superdrug, there were 304 products that entered the awardin 2011 and votes were cast by over 600 CEW members. The winners of the2011 CEW Beauty Awards relevant to this report are as follows:
• Best New Bath and Body Product (mass) — The Sanctuary Ultra Rich BodyButter by The Sanctuary
• Best New Haircare/Styling/Colouring Product (mass) — Batiste Dry ShampooFresh by Batiste
• Best New Everyday Facial Skincare Product (mass) — Dr Organic’s OrganicRose Otto Facial Serum by Dr Organic
• Best New Men’s Grooming Product (mass) — Q10 Revitalising Gel by NIVEAFor Men
• Best New Bath and Body Product (prestige) — Rose Otto Body Wash byBalance Me
• Best New Haircare/Styling Product (prestige) — Botanical Shine Shampoo byLiz Earle
• Best New Everyday Facial Skincare Product (prestige) — Clarins Multi-ActiveDay Early Wrinkle Correction Cream by Clarins
• Best New Men’s Grooming Product (prestige) — Shiseido for Men SkinEmpowering Cream by Shiseido
Toiletries Brand Strategy
© Key Note Ltd 2011 62

• Best New Certified Organic Skincare Product (mass or prestige) — BalanceMe Super Oil with juniper and bergamot by Balance Me
• Best New Self Tan or Sun Care Product (mass or prestige) — Eight Hour CreamSun Defense for Face SPF 50 by Elizabeth Arden
LEADING BRANDS BY SECTOR
Personal Wash and Bathroom Toiletries
PZ Cussons is a major manufacturer of personal wash products in the UK. Itsbrands include numerous British household names such as Imperial Leather,Carex and Original Source. Other major brands in the personal wash sectorinclude NIVEA, Johnson & Johnson, Radox, and Dove and Lux soap, owned bythe British-Dutch company Unilever. Unilever also dominates the deodorantsand bodysprays market, its biggest brands there being Lynx, Impulse, Dove andSure.
Skincare Products
Procter & Gamble’s Olay is the UK’s leading mass-market skincare brand, alongwith L’Oréal’s Garnier. Olay’s successful sub-brands include Regenerist, TotalEffects and Olay Pro-X. Other leading brands in the skincare market includeBoots No7 and Beiersdorf’s NIVEA. Simple is another best-selling women’sskincare brand in the UK, with its Kind To Skin range winning many beautyawards.
Hair Care Products
Leading mass market hair care brands include Procter & Gamble’s Head &Shoulders, Pantene, Wella, Herbal Essences, Aussie, Clairol Nice n Easy, andSilvikrin. Its rival Unilever owns everyday hair care brands Dove and Sunsilk, aswell as premium brand TIGI.
L’Oreal is market leader in hair colour and is also prominent in other hairproduct categories with brands that include Elvive, Elnett, Garnier Fructis,Redken and Kérastase. Alberto Culver is another major contender in hair care,with, among others, the TRESemmé and VO5 brand. Alberto Culver wasacquired by Unilever in May 2011.
Oral Care Products
The diversified, US company Colgate-Palmolive is a market leader in the oralcare sector. GlaxoSmithKline’s rate of market growth, however, is increasinglychallenging its lead with brands such as Macleans, Aquafresh and Sensodyne.Other oral hygiene ranges of significance include Procter & Gamble’s Crest andOral-B toothpaste.
Toiletries Brand Strategy
© Key Note Ltd 2011 63

Shaving Products
Procter & Gamble’s Gillette is the UK’s leading brand in the shaving productssector. Gillette offers a variety of razors for men and women, as well as shavingcream for men. Its shaving product range includes Gillette Fusion and theVenus range for women. Wilkinson Sword is another major brand in theshaving product sector. Wilkinson Sword is owned by Energizer Holdings andits razors are produced in Germany.
Toiletries Brand Strategy
© Key Note Ltd 2011 64

6. Strengths, Weaknesses, Opportunitiesand Threats
STRENGTHS
• Many toiletry products, such as shower gels, deodorants, shaving creams,etc., are considered to be essentials.
• Some toiletry products, such as bath salts or body spray, are perceived to havethe effect of enhancing well-being and potentially self-esteem.
• There is strong brand loyalty, as well a willingness to try new products.
• Luxury toiletries make a good choice for gifts, especially for women.
• The common human traits of vanity and insecurity make many consumerssusceptible to marketing strategies.
• The toiletries and cosmetics industry has high levels of investment in newproduct development (NPD). For example, a lot of activity has recently beenfocused on cosmeceuticals — cosmetics with medical benefits.
• Toiletry products are sold in most supermarket stores and can be easily pickedup by consumers when doing their weekly grocery shopping.
WEAKNESSES
• In times of prolonged economic hardship, consumers may trade down theirchoices of toiletries, opting for value or discounted ranges instead of themore usual brands.
• Some categories of toiletries are reaching saturation levels, leaving littleopportunity to increase consumer penetration.
• Competition in the marketplace is fierce for both manufacturers andretailers, as well as in the premium and mass-market sectors.
• Discounting is common, especially in the middle range and mass-marketrange, limiting overall opportunity for value growth.
• Brand loyalty makes it difficult for new brands to break through successfully.
• The market is, to some extent, seasonal, peaking around Christmas,Valentine’s Day and Mother’s Day.
• The perceived safety and efficacy of toiletry products is under constantscrutiny and is vulnerable to scaremongering.
Toiletries Strengths, Weaknesses, Opportunities and Threats
© Key Note Ltd 2011 65

OPPORTUNITIES
• UK’s aging population will increase the demand for cosmeceutical products— products containing ingredients that claim to influence the biologicalperformance of the skin.
• The ’baby-boomer’ generation has a relatively high disposable income andis more often willing to pay premium prices for products that promise to holdback the effects of time.
• A fall in the strength of the Sterling, as witnessed currently in the UK, hasmade British manufactured products more competitive in the global market.
• Green and ethical products are becoming increasingly popular, presentingopportunities for brands to expand in this sector of the market.
• Sales of toiletries may benefit from discounting and promotional activities,especially in times of economic hardship.
THREATS
• Rising inflation and high unemployment rates are forcing people to cut backon spending and/or trade down to cheaper brands or retailers’ own labels.
• The involvement of the grocery chains in the toiletries market is continuingto exert downward pressure on prices.
• A decline in the value of Sterling makes the purchasing of raw materials andcomponents sourced from outside the UK more expensive.
• With a wide range of toiletry brands available, and constant new productlaunches, retailers are ruthless about removing underperforming brandsfrom their shelves.
Toiletries Strengths, Weaknesses, Opportunities and Threats
© Key Note Ltd 2011 66

7. Buying Behaviour
AVERAGE WEEKLY HOUSEHOLD EXPENDITURE
According to figures published by the Office for National Statistics (FamilySpending 2010), average weekly household expenditure on personal care,including cosmetics and toiletries, amounted to £10.60 in 2009, up from £9.90per week in 2008. As Table 7.1 shows, average weekly spending on toiletriesand soap was £2.20 in 2009, up from £2.00 in 2008. Average weekly householdexpenditure on hairdressing and beauty treatments also increased, up from£3.10 in 2008 to £3.40 in 2009. Expenditure on hair products, cosmetics andrelated electrical appliances rose from £3.40 to £3.50 over the same period.
Table 7.1: Average Weekly Household Expenditure on PersonalCare (£), 2009
Hairdressing, beauty treatments 3.40
Toilet paper 0.80
Toiletries and soap 2.20
Baby toiletries and accessories 0.70
Hair products, cosmetics and related electricalappliances 3.50
Total 10.60
Source: Family Spending, 2010, National Statistics © Crown copyright material isreproduced with the permission of the Controller of HMSO (and the Queen’sPrinter for Scotland)
By Age
Table 7.2 shows average weekly household expenditure on personal careproducts by age group. Those aged between 30 and 49 spent the most on hairproducts, cosmetics and related electrical appliances, as well as on toiletriesand soap. People over 75 generally had the lowest level of expenditure on alltypes of personal care products, with the exception of hairdressing and beautytreatments, on which they spent an average of £3.00 per week. People in theyoungest age group were more likely to spend their money on hair products,cosmetics and related electrical appliances. However, the same age group wasleast likely to spend money on hairdressing and beauty treatments.
Toiletries Buying Behaviour
© Key Note Ltd 2011 67

Table 7.2: Average Weekly Household Expenditure on PersonalCare by Age of Household Reference Person (£), 2009
Under30 30-49 50-64 65-74 75+
Hairdressing, beauty treatment 1.90 3.60 3.90 3.00 3.00
Toilet paper 0.50 0.90 0.80 0.80 0.50
Toiletries and soap 1.70 2.60 2.50 1.70 1.10
Baby toiletries and accessories 1.70 1.00 0.30 0.10 0.10
Hair products, cosmetics and relatedelectrical appliances 3.10 4.40 4.10 2.50 1.30
Total 8.90 12.50 11.60 8.10 6.00
Source: Family Spending, 2010, National Statistics © Crown copyright material isreproduced with the permission of the Controller of HMSO (and the Queen’sPrinter for Scotland)
By Gross Income Decile Group
As one might expect, households with a higher gross income were inclined tospend more on personal care products than households with lower grossincomes. This is reflected in data from the Office for National Statistics, asshown in Table 7.3, listing average weekly household expenditure on personalcare by gross income decile group. Households in the highest gross incomedecile group spent more than six times as much on personal care items thanthose in the lowest income decile, including a weekly average of £9.10 on hairproducts, cosmetics and related electrical equipment and £8.40 on hairdressingand beauty treatments. This contrasts with just £2.10 spent on the same itemsby households in the lowest income decile.
Toiletries Buying Behaviour
© Key Note Ltd 2011 68

Table 7.3: Average Weekly Household Expenditure on PersonalCare by Gross Income Decile Group (£), 2009
Haird
ressin
g,
Beau
ty Tre
atm
en
t
Toile
t Pap
er
Toile
tries
an
d S
oap
Bab
y To
iletrie
s an
dA
ccesso
ries (D
ispo
sab
le)
Hair P
rod
ucts, C
osm
etics
an
d R
ela
ted
Ele
ctrical A
pp
lian
ces
Tota
l
Lowest 10% 1.20 0.40 1.00 0.20 0.90 3.70
2nd decile group 1.80 0.50 1.10 0.40 1.20 5.00
3rd decile group 2.00 0.60 1.40 0.50 1.90 6.40
4th decile group 2.60 0.70 1.50 0.50 2.00 7.30
5th decile group 2.60 0.70 2.00 0.60 3.20 9.10
6th decile group 2.40 0.80 2.00 0.70 3.00 8.90
7th decile group 3.40 0.90 2.30 0.70 4.10 11.40
8th decile group 4.20 1.00 2.60 0.80 4.80 13.40
9th decile group 4.80 1.10 3.20 1.50 5.30 15.90
Highest 10% 8.40 1.10 4.70 1.00 9.10 24.30
All households 3.40 0.80 2.20 0.70 3.50 10.60
Source: Family Spending, 2010, National Statistics © Crown copyright material isreproduced with the permission of the Controller of HMSO (and the Queen’sPrinter for Scotland)
CUSTOMER PENETRATION
To gauge consumer penetration on toiletries, Key Note has analysed relevantTarget Group Index (TGI) survey data. The survey was conducted in January2011 among a nationally representative sample of adults in Great Britain, allof whom were asked about their usage of various toiletries products in theprevious 12 months.
Toiletries Buying Behaviour
© Key Note Ltd 2011 69

Hair Care Products
Table 7.4 shows the usage of hair care products by both men and women in2010. Unsurprisingly, shampoo and conditioner are the most commonly usedhair care products among both sexes.
Table 7.4: Usage of Hair Care Products in the Last 12 Months bySex (% of adults), 2010
Women
Shampoo 96.8
Conditioner (excluding treatments andmasques) 75.7
Conditioning treatments and masques 26.1
2 in 1 combined shampoo/conditioner 14.6
Hair styling and finishing products (includinghairsprays) 63.2
Hair colourants, bleaches and lighteners 35.9
Men
Shampoos and conditioners 89.2
Hair styling products 29.1
Hair colourants, lighteners and bleach 3.4
Source: Target Group Index (TGI) © Kantar Media, Quarter 2 (January2010-December 2010), 2011
Shampoo
49.6% of total respondents using shampoo were women, while percentagepenetration among female respondents alone was as high as 96.8%. Table 7.5shows the use of shampoo among women as a percentage penetration of allrespondents by age and social grade. Usage was highest among older womenand lowest among 15 to 19 year-olds; 51.6% of those aged 65+ using shampoowere women, while 46.3% of all those aged 15 to 19 were female. In terms ofsocial grade, the usage was highest among those in the E social grade.
Toiletries Buying Behaviour
© Key Note Ltd 2011 70

Table 7.5: Female Usage of Shampoo in the Last 12 Months byAge and Social Grade (% of adults), 2010
Age
15-19 46.3
20-24 49.6
25-34 48.2
35-44 49.9
45-54 49.7
55-64 49.7
65+ 51.6
Social Grade
A 43.2
B 47.8
C1 52.4
C2 44.8
D 51.5
E 56.7
Source: Target Group Index (TGI) © Kantar Media, Quarter 2 (January2010-December 2010), 2011
• Women’s Hair Type
According to the TGI survey, the most common natural hair colours amongwomen respondents were dark brown and light brown. Common hairproblems cited were split ends (22.9%) and/or itchy scalps (15.3%). However,the type of shampoo that was used most often was one with a normalformulation, followed by shampoos for coloured/permed hair (see Table 7.6).
Table 7.6: Types of Shampoo Used Most Often by Women in theLast 12 Months (%), 2010
Normal 38.4
Coloured/permed 32.5
Dry 18.1
Table continues...
Toiletries Buying Behaviour
© Key Note Ltd 2011 71

Table 7.6: Types of Shampoo Used Most Often by Women in theLast 12 Months (%), 2010
...table continued
Anti-dandruff 14.0
Fine 13.8
Greasy 11.7
Others 8.5
Source: Target Group Index (TGI) © Kantar Media, Quarter 2 (January2010-December 2010), 2011
Conditioner
In 2010, 75.7% of women (or 38.8% of total respondents) responded they hadused conditioners (other than treatments and masques). Usage tailed offamong older age groups after peaking among 20 to 24 year-olds. In terms ofsocial grade, usage was most prevalent among women in the C1 social grade,followed by Es and Ds.
Table 7.7: FemaIe Usage of Conditioners (Excluding Treatmentsand Masques) in the Last 12 Months by Age and Social Grade
(% of adults), 2010
Age
15-19 39.3
20-24 44.6
25-34 41.2
35-44 41.2
45-54 39.4
55-64 36.8
65+ 32.9
Table continues...
Toiletries Buying Behaviour
© Key Note Ltd 2011 72

Table 7.7: FemaIe Usage of Conditioners (Excluding Treatmentsand Masques) in the Last 12 Months by Age and Social Grade
(% of adults), 2010
...table continued
Social Grade
A 32.8
B 38.5
C1 41.8
C2 35.2
D 39.2
E 40.6
Source: Target Group Index (TGI) © Kantar Media, Quarter 2 (January2010-December 2010), 2011
Hair Styling Products
According to the TGI survey, 63.2% of women (or 32.4% of all respondents)and 29.1% of men (or 14.2% of all respondents) said they had used hair stylingproducts in 2010. Among women, those in the oldest age group were the mostlikely to use these products. In contrast, among men, those in the youngest agegroup were the most likely to use hair styling products, and the tendencydecreases with age. In terms of social grade, both men and women in the C1grades were the most likely to use hair styling products.
Table 7.8: Usage of Hair Styling Products in the Last 12 Monthsby Sex, Age and Social Grade (% of adults), 2010
†Women ‡Men
Age
15-19 33.4 30.9
20-24 33.5 27.6
25-34 29.4 24.2
35-44 31.2 14.3
45-54 28.7 8.8
55-64 32.2 4.7
65+ 38.0 5.5
Table continues...
Toiletries Buying Behaviour
© Key Note Ltd 2011 73

Table 7.8: Usage of Hair Styling Products in the Last 12 Monthsby Sex, Age and Social Grade (% of adults), 2010
...table continued
Social Grade
A 27.2 13.5
B 32.3 13.9
C1 36.4 15.3
C2 29.3 14.8
D 30.3 13.0
E 33.5 12.4
† — including hairsprays
‡ — excluding hairsprays
Source: Target Group Index (TGI) © Kantar Media, Quarter 2 (January2010-December 2010), 2011
Hair Colourants
35.9% of women (or 18.4% of all respondents) and 3.4% of men (or 1.7% ofall respondents) said they had used hair colourants at home in 2010. For bothsexes, usage of hair colourants was most common among those in the youngestage groups, as well as among those in the E social grade.
Table 7.9: Usage of Hair Colourants in the Last 12 Months bySex, Age and Social Grade (% of adults), 2010
Women Men
Age
15-19 26.6 3.4
20-24 21.7 2.3
25-34 18.4 2.2
35-44 20.7 2.4
45-54 21.3 1.4
55-64 16.7 1.0
65+ 10.6 0.5
Table continues...
Toiletries Buying Behaviour
© Key Note Ltd 2011 74

Table 7.9: Usage of Hair Colourants in the Last 12 Months bySex, Age and Social Grade (% of adults), 2010
...table continued
Social Grade
A 9.9 0.5
B 14.2 1.8
C1 19.5 1.4
C2 18.1 1.8
D 22.9 1.5
E 23.1 3.1
Source: Target Group Index (TGI) © Kantar Media, Quarter 2 (January2010-December 2010), 2011
Other Toiletries
Other toiletry products such as toothpaste, deodorant, liquid soap and showergels also had the highest penetration rates among women in 2010 (see Table7.10). Usage of toothpaste, deodorants and shower gels was almost universal,as might be expected.
Table 7.10: Usage of Other Toiletries Products by Women in theLast 12 Months (%), 2010
Toothpaste 97.6
Deodorants 94.4
Face creams and lotions 86.0
Body creams and lotions 72.6
Hair removers/razors 79.4
Shower gels and bath products 91.0
Cleansing creams, milks, lotions, toners, wipes andwashes 69.0
Liquid soap/handwash 88.5
Bars of soap 75.9
Suntan and sun protection products 60.1
Source: Target Group Index (TGI) © Kantar Media, Quarter 2 (January2010-December 2010), 2011
Toiletries Buying Behaviour
© Key Note Ltd 2011 75

In comparison, percentage penetration of other toiletries tended to be loweramong men than women, with the exception of razors and bars of soap.
Table 7.11: Usage of Other Toiletries Products by Men in the Last12 Months (%), 2010
Toothpaste 96.3
Deodorants 87.8
Face creams and lotions (including masks and scrubs) 36.7
Razors/razor blades and electric shavers 93.8
Shower gels and bath products 83.5
Liquid soap/handwash 83.1
Bars of soap 79.1
Suntan and sun protection products 40.6
Source: Target Group Index (TGI) © Kantar Media, Quarter 2 (January2010-December 2010), 2011©
Toothpaste
Overall penetration of toothpaste among all respondents was high (96.8%).However, usage was notably lower among those aged 65 and over. In terms ofsocial grade, differences in penetration rates were less marked, with usagepeaking at 98% among Bs and falling to 94.4% among Es.
Table 7.12: Usage of Toothpaste in the Last 12 Months by Ageand Social Grade (% of adults), 2010
Age
15-19 98.1
20-24 98.5
25-34 98.8
35-44 97.3
45-54 97.0
55-64 96.6
65+ 93.6
Table continues...
Toiletries Buying Behaviour
© Key Note Ltd 2011 76
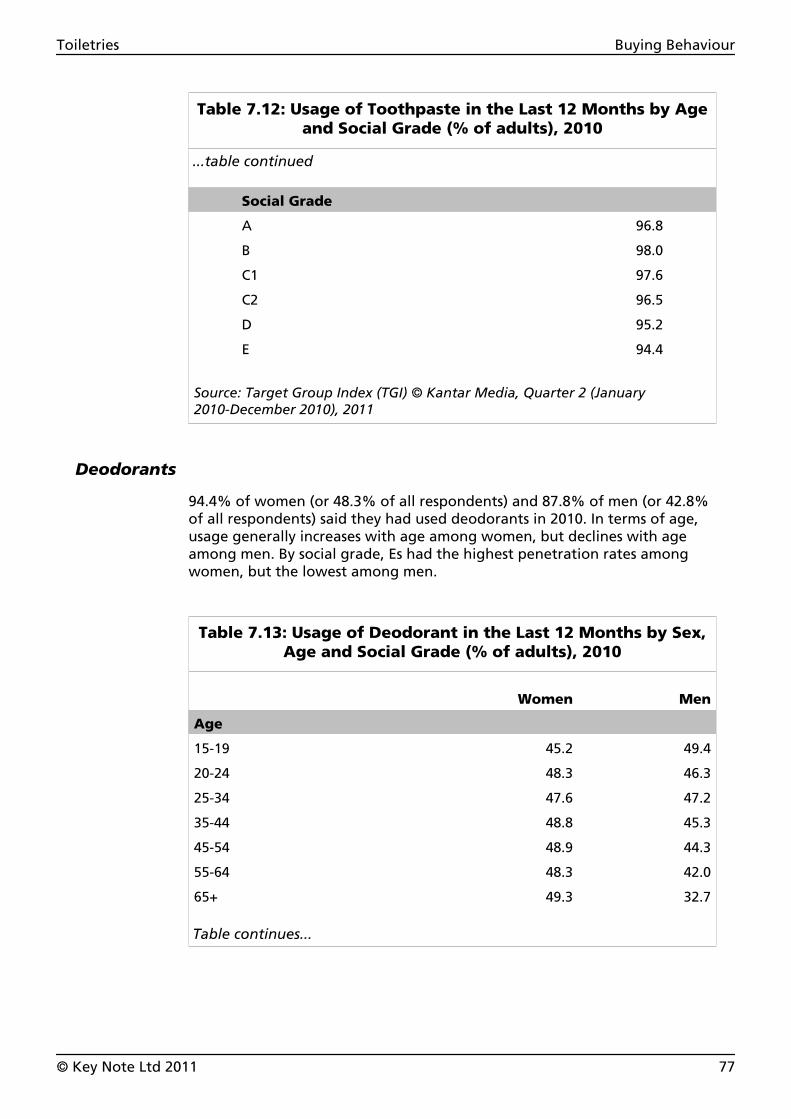
Table 7.12: Usage of Toothpaste in the Last 12 Months by Ageand Social Grade (% of adults), 2010
...table continued
Social Grade
A 96.8
B 98.0
C1 97.6
C2 96.5
D 95.2
E 94.4
Source: Target Group Index (TGI) © Kantar Media, Quarter 2 (January2010-December 2010), 2011
Deodorants
94.4% of women (or 48.3% of all respondents) and 87.8% of men (or 42.8%of all respondents) said they had used deodorants in 2010. In terms of age,usage generally increases with age among women, but declines with ageamong men. By social grade, Es had the highest penetration rates amongwomen, but the lowest among men.
Table 7.13: Usage of Deodorant in the Last 12 Months by Sex,Age and Social Grade (% of adults), 2010
Women Men
Age
15-19 45.2 49.4
20-24 48.3 46.3
25-34 47.6 47.2
35-44 48.8 45.3
45-54 48.9 44.3
55-64 48.3 42.0
65+ 49.3 32.7
Table continues...
Toiletries Buying Behaviour
© Key Note Ltd 2011 77

Table 7.13: Usage of Deodorant in the Last 12 Months by Sex,Age and Social Grade (% of adults), 2010
...table continued
Social Grade
A 41.7 45.1
B 46.8 44.1
C1 51.1 40.8
C2 44.0 47.6
D 50.2 42.1
E 54.7 34.8
Source: Target Group Index (TGI) © Kantar Media, Quarter 2 (January2010-December 2010), 2011
Face Creams and Lotions
According to TGI, 86% of women (or 44% of all respondents) and 36.7% ofmen (or 17.9% of all respondents) used face creams and lotions in 2010.Penetration rates were generally higher in the older age groups amongwomen, but among men the reverse is true. There was no clear trend in usageby social grade among men or women.
Table 7.14: Usage of Face Cream and Lotions in the Last12 Months by Sex, Age and Social Grade (% of adults), 2010
Women Men
Age
15-19 40.3 24.7
20-24 43.1 23.4
25-34 42.8 26.9
35-44 42.4 22.0
45-54 43.8 16.0
55-64 44.5 11.9
65+ 48.1 8.4
Table continues...
Toiletries Buying Behaviour
© Key Note Ltd 2011 78

Table 7.14: Usage of Face Cream and Lotions in the Last12 Months by Sex, Age and Social Grade (% of adults), 2010
...table continued
Social Grade
A 40.4 14.9
B 44.9 20.8
C1 48.0 18.1
C2 38.8 18.2
D 43.0 16.4
E 45.5 13.3
Source: Target Group Index (TGI) © Kantar Media, Quarter 2 (January2010-December 2010), 2011
Hair Removers and Razors
79.4% of women (or 40.6% of all respondents) and 93.8% of men (or 45.8%of all respondents) responded positive to having used razors or depilatories in2010. Usage of hair removers and razors generally decreases with age amongboth men and women beyond the middle age group. Trends are not clearlydefined by social grade, but As and Es had the lowest penetration rates forwomen and men, respectively.
Table 7.15: Usage of Hair Removers and Razors in the Last12 Months by Sex, Age and Social Grade (% of adults), 2010
ϮWomen ‡Men
Age
15-19 43.8 45.1
20-24 47.8 46.5
25-34 45.7 48.7
35-44 45.9 47.0
45-54 43.4 46.4
55-64 38.9 45.6
65+ 26.9 42.0
Table continues...
Toiletries Buying Behaviour
© Key Note Ltd 2011 79
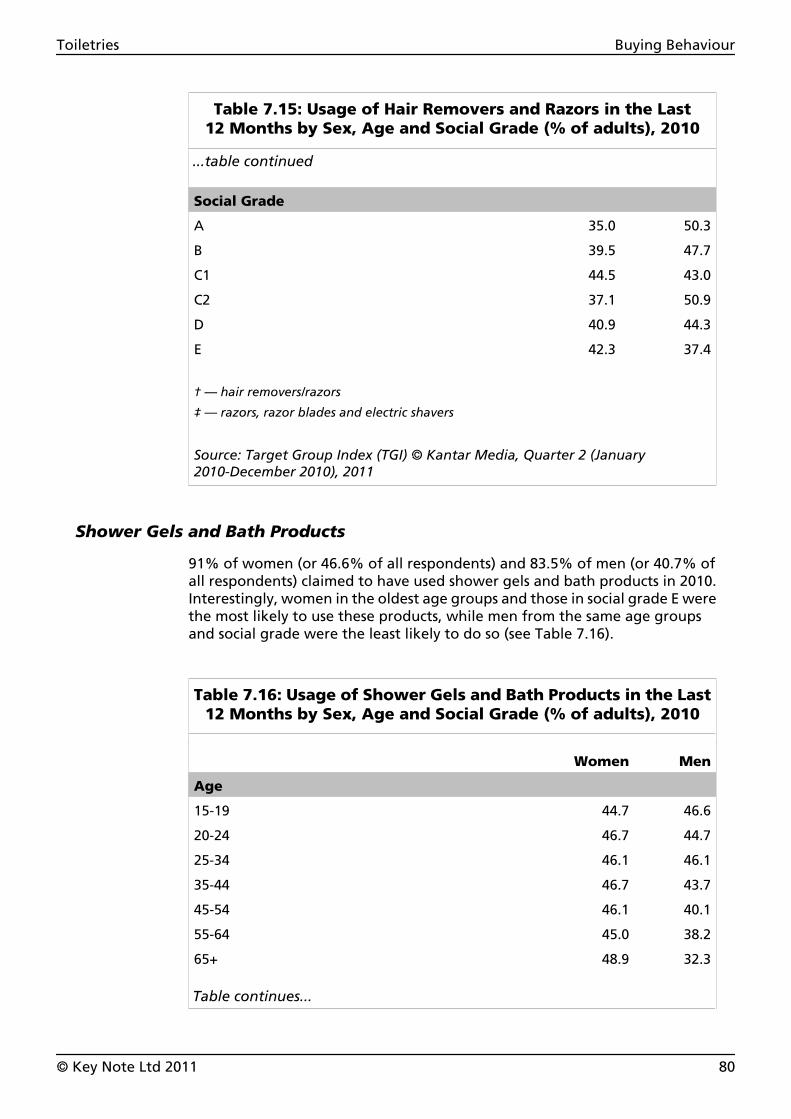
Table 7.15: Usage of Hair Removers and Razors in the Last12 Months by Sex, Age and Social Grade (% of adults), 2010
...table continued
Social Grade
A 35.0 50.3
B 39.5 47.7
C1 44.5 43.0
C2 37.1 50.9
D 40.9 44.3
E 42.3 37.4
† — hair removers/razors
‡ — razors, razor blades and electric shavers
Source: Target Group Index (TGI) © Kantar Media, Quarter 2 (January2010-December 2010), 2011
Shower Gels and Bath Products
91% of women (or 46.6% of all respondents) and 83.5% of men (or 40.7% ofall respondents) claimed to have used shower gels and bath products in 2010.Interestingly, women in the oldest age groups and those in social grade E werethe most likely to use these products, while men from the same age groupsand social grade were the least likely to do so (see Table 7.16).
Table 7.16: Usage of Shower Gels and Bath Products in the Last12 Months by Sex, Age and Social Grade (% of adults), 2010
Women Men
Age
15-19 44.7 46.6
20-24 46.7 44.7
25-34 46.1 46.1
35-44 46.7 43.7
45-54 46.1 40.1
55-64 45.0 38.2
65+ 48.9 32.3
Table continues...
Toiletries Buying Behaviour
© Key Note Ltd 2011 80

Table 7.16: Usage of Shower Gels and Bath Products in the Last12 Months by Sex, Age and Social Grade (% of adults), 2010
...table continued
Social Grade
A 41.1 43.4
B 44.2 41.3
C1 49.8 39.1
C2 42.6 45.5
D 47.9 39.4
E 52.9 33.2
Source: Target Group Index (TGI) © Kantar Media, Quarter 2 (January2010-December 2010), 2011
Cleansing Creams, Lotions and Wipes
According to the TGI survey, 69% of women, representing 35.3% of allrespondents, had used cleansing creams, milks, lotions, toner, wipes and/orwashes in 2010. Women in younger age groups were more inclined to haveused these products, and the trend decreases with age. There was no strongcorrelation between usage and social grade, with percentage penetrationranging from 31.1% among C2s to 38.9% among C1s.
Table 7.17: Usage of Cleansing Creams, Milks, Lotions, Toner,Wipes and Washes by Women in the Last 12 Months by Age and
Social Grade (% of adults), 2010
Age
15-19 40.2
20-24 40.6
25-34 37.5
35-44 35.5
45-54 34.1
55-64 33.2
65+ 31.9
Table continues...
Toiletries Buying Behaviour
© Key Note Ltd 2011 81

Table 7.17: Usage of Cleansing Creams, Milks, Lotions, Toner,Wipes and Washes by Women in the Last 12 Months by Age and
Social Grade (% of adults), 2010
...table continued
Social Grade
A 32.0
B 36.8
C1 38.9
C2 31.1
D 33.3
E 35.5
Source: Target Group Index (TGI) © Kantar Media, Quarter 2 (January2010-December 2010), 2011
Liquid Soap/Handwash
Percentage penetration of liquid soap among all respondents was high,standing at 85.9%, and ranged from 83.1% of men to 88.5% of women.Penetration was highest among the youngest age group and social grade B,and lowest among the oldest age group and social grade E.
Table 7.18: Usage of Liquid Soap/Handwash in the Last12 Months by Age and Social Grade (% of adults), 2010
Age
15-19 91.4
20-24 89.9
25-34 90.0
35-44 88.5
45-54 84.7
55-64 84.5
65+ 78.6
Table continues...
Toiletries Buying Behaviour
© Key Note Ltd 2011 82

Table 7.18: Usage of Liquid Soap/Handwash in the Last12 Months by Age and Social Grade (% of adults), 2010
...table continued
Social Grade
A 87.0
B 90.5
C1 88.6
C2 85.3
D 81.4
E 73.8
Source: Target Group Index (TGI) © Kantar Media, Quarter 2 (January2010-December 2010), 2011
Bars of Soap
According to the TGI survey, 77.5% of adults were said to have used bars ofsoap in 2010, with men being slightly more likely to do so than women.Respondents in older age groups were more inclined to use bars of soap, whilepenetration among the youngest age group was also fairly high (79.9%). Interms of social grade, penetration was highest among As, and lowest amongC1s and Ds.
Table 7.19: Usage of Bars of Soap in the Last 12 Months by Ageand Social Grade (% of adults), 2010
Age
15-19 79.9
20-24 69.8
25-34 69.0
35-44 69.8
45-54 78.6
55-64 84.7
65+ 86.8
Table continues...
Toiletries Buying Behaviour
© Key Note Ltd 2011 83

Table 7.19: Usage of Bars of Soap in the Last 12 Months by Ageand Social Grade (% of adults), 2010
...table continued
Social Grade
A 81.6
B 76.8
C1 76.7
C2 78.0
D 76.7
E 79.6
Source: Target Group Index (TGI) © Kantar Media, Quarter 2 (January2010-December 2010), 2011
Suntan and Sun Protection Products
In 2010, 60.1% of women (or 30.8% of all respondents) and 40.6% of men (or19.8% of all respondents) used suntan and sun protection products, includingself-tanning products. Among both sexes, usage of these products was mostlikely among 35 to 44 year-olds, and least likely among those aged 65 and over.In terms of social grade, penetration rates were low among C2s, Ds and Es.
Table 7.20: Usage of Suntan and Sun Protection Products in theLast 12 Months by Age and Social Grade (% of adults), 2010
Women Men
Age
15-19 29.4 19.0
20-24 29.4 15.1
25-34 31.6 21.9
35-44 34.9 24.7
45-54 32.7 22.1
55-64 32.0 19.9
65+ 25.2 14.1
Table continues...
Toiletries Buying Behaviour
© Key Note Ltd 2011 84

Table 7.20: Usage of Suntan and Sun Protection Products in theLast 12 Months by Age and Social Grade (% of adults), 2010
...table continued
Social Grade
A 32.6 32.3
B 34.3 25.9
C1 34.5 20.6
C2 28.3 18.8
D 25.9 14.4
E 23.1 6.6
Source: Target Group Index (TGI) © Kantar Media, Quarter 2 (January2010-December 2010), 2011
Toiletries Buying Behaviour
© Key Note Ltd 2011 85

8. Current Issues
THE ECONOMY
The UK economy is currently still reeling from the longest recession in recordedhistory. 2009 saw the economy shrink by 5%, the biggest calendar-year fallsince 1921. Although there were hints of recovery in the UK economy duringthe first half of 2010, in the final quarter of 2010 gross domestic product (GDP)contracted by 0.5%, demonstrating that the economy is still some way off frombeing back to normality. Encouragingly, in the first 3 months of 2011 the UKeconomy grew by 0.5%. Inflation rates, however, continue to rise, having beenpushed upwards by increasing fuel, energy and commodity prices, as well asthe VAT increase introduced in January 2011. In June, Scottish Power, one ofthe major gas and electricity suppliers in the UK, announced gas tariffs are torise by 19%, with electricity up by 10%. This is expected to be soon followedby other energy companies. According to official inflation figures, theconsumer price index (CPI) currently stands at 4.5% (June 2011), well above theBank of England’s target rate of 2%. The latest inflation report, published inMay 2011 by the Bank of England, predicted that inflation may rise to 5% laterin the year, largely due to price hikes in utility bills.
RETAILERS ARE STRUGGLING
The retail sector has been adversely affected by the Government’s proposedspending cuts, the increased tax burden and rising commodity costs. Non-foodretailers were hit particularly hard, including those selling clothing, footwearand big ticket items. According to British Retail Consortium (BRC), UK retailsales values in May were 2.1% lower on a like-for-like basis than in 2010. Thecauses are well-known: household disposable incomes continue to be squeezedby high inflation rates and low wage growth, while uncertainty over the effectsof Government cuts is weighing down consumer confidence. It is believed thatthe increase in VAT since January 2011 is flattering the sales figures for mostnon-food goods.
Toiletries Current Issues
© Key Note Ltd 2011 86

RISING MATERIALS COSTS CAUSING PRICES HIKES
Conscious of squeezed household budgets and trading-down trends, brandowners are struggling to pass on the rising costs of raw materials, packaging,and energy costs to consumers. In June, PZ Cussons announced plans to cut itsImperial Leather soap bar by a fifth in weight — to 100g — as the manufacturerattempts to reduce the product rather than raise the price. PZ Cussons andothers are facing steep rises in the cost of raw materials, including palm oil.The company has raised prices by an average of 7% in 2010, and hopes toincrease prices by another 2% in 2011. Procter & Gamble (P&G) has increasedprices by up to 7% on a wide range of household and personal care products,while Unilever, the maker of Dove soap, expects its commodity costs to rise by14 to 16% in 2011. In April, market leaders Procter & Gamble, Unilever and PZCussons announced that they expect trading for the rest 2011 to be challengingas UK consumers further cut spending on products such as shower gels andhandwash.
UNILEVER AND P&G IN PRICE FIXING FINE
In April, 2011, the consumer products giants Unilever and P&G were fined€315m for fixing washing powder prices in 8 European countries. This followeda 3-year investigation by the European Commission following a tip-off byGerman company Henkel in 2008. The cartel was said to have existed for atleast 3 years between 2002 and 2006, fixing prices of powder detergents forwashing machines in Belgium, France, Germany, Greece, Portugal, Spain andthe Netherlands. The total fine of €315.2m (€104m for Unilever and €211.2mfor P&G) includes a 10 per cent reduction for acknowledging the facts. The finalfigures also reflect a 50 per cent reduction for P&G and 25 per cent for Unileveron account of their co-operation with regulators under the EU’s leniencynotice.
NEW PRODUCTS
NIVEA
In January 2011, Beiersdorf launched a new deodorant — Invisible for Black &White — for NIVEA. Stephen Byrne from Beiersdorf says the point of differencewith this new deodorant is that it prevents stains on light and dark clothes.Available in Boots and major supermarkets, it comes in two fragrances and 4sizes, and it is backed by an outdoor media campaign.
L’Oreal
In February 2011, L’Oreal launched its new hair colour product Sublime Mousse,which was backed with digital investment in order to reach a younger,previously untapped audience. The product’s innovation removes the need forsectioning hair while colouring, allowing shampoo-like application.
Toiletries Current Issues
© Key Note Ltd 2011 87
Dove
In March 2011, Dove launched two post-wash variants — Intensive Repair Maskand Overnight Creme — to its Intensive Repair hair care range. The newadditions were prompted by findings that nearly 30% of UK women considertheir hair ‘dry’ or ‘’normal to dry’, and are part of their increased investmentin the portfolio in 2011.
Sensodyne
In March 2011, GlaxoSmithKline launched Repair & Protect Toothpaste for itsSensodyne brand. The product is designed to repair teeth that have sufferederosion.
Mandara
Luxury spa brand Mandara Spa, part of Steiner Leisure, has created a new rangeof bath and body products that will be retailed exclusively through 400Sainsbury’s supermarkets. The premium own-label, which was launched in May2011 and will not carry the Sainsbury’s name, aims to provide affordable luxury.Based on Mandara’s Balinese relaxation treatments, the five collections includeTropical Blooms, Honeymilk Dream, Amber Heaven, Island Paradise and CitrusSpice.
Sk:n
In June 2011, UK skin clinic Sk:n created a new range of skin care products,which will be launched in Sk:n clinics and larger Boots stores across the UK inJuly. The collection is split into five treatment areas include cleansing andexfoliating, anti-aging, anti-blemish, corrective and repair and protect. Theintention is to provide a more accessible alternative to doctor brands sold indepartment stores and through Sk:n clinics.
Toiletries Current Issues
© Key Note Ltd 2011 88

9. The Global Market
INTRODUCTION
The diversified, multinational companies Unilever and Proctor & Gamble (P&G)remain the stalwarts of the global toiletries market. L’Oreal, meanwhile,remains the main player in the make-up and skincare sector.
EUROPE
According to the European Cosmetics Association (Colipa), the retail marketfor cosmetic and toiletries in the EU-27, as well as Norway and Switzerland,was worth €69.5bn in 2009, having decreased from €70.4bn in the previousyear. The five major European cosmetics and toiletries markets are Germany,France, Italy, the UK and Spain. In 2009, the German market accounted for18.5% of European sales, France for 15.1%, Italy for 13.1%, and the UK andSpain for 12.7% and 6.5%, respectively.
As can be seen in Table 9.1, while Germany and France saw the value of theirsales increase, Italy, the UK and Spain all experienced a decline in sales. TheUK’s cosmetics, toiletries and perfumery market shrunk by 3.1% in 2009, whilein Italy sales decreased, albeit marginally, by 0.4%. Spain experienced thelargest decline, with a drop in cosmetics, toiletries and perfumes sales of 8.5%.
It should be noted, however, that these sales figures are not only inclusive oftoiletries, but also of cosmetics and fragrances. Therefore, the decrease in totalvalue does not necessarily indicate a drop in the sales value of toiletries.
Table 9.1: Retail Sales of Cosmetics and Toiletries in the Top FiveEU Member States by Value (€), 2009
Value (€m)% Change2008-2009
Germany 12,829 1.8
France 10,517 0.9
Italy 9,108 -0.4
UK 8,855 -3.1
Spain 7,203 -8.5
Source: Colipa Activity Report 2009
Toiletries The Global Market
© Key Note Ltd 2011 89

According to Industrieverband Köerperpflege und Waschmittel eV (IKW), theGerman Cosmetic, Toiletry, Perfumery and Detergent Association, the personalcare sector in Germany, including decorative cosmetics and perfumes/fragrances, was worth €12.74bn in 2010. Sales of deodorants rose by 2.3% from€689m in 2009 to €705m in 2010. On the other hand, sales of hair care, skincare,soaps, bath and shower products fell by 2.9%, 0.7%, 1.8% and 2.2%,respectively.
THE US
According to Kline & Company, the research and consultancy firm, sales ofcosmetics and toiletries in the US grew by 2.4% in 2010 at the manufacturers’level, reaching $36.5bn. Growth was driven by rising consumer confidence,aggressive promotional activity and technological advances.
SELECTED GLOBAL COMPETITORS
AS Watson Group
The AS Watson Group (ASW) dates back to 1828 and has evolved into aninternational retail and manufacturing business with operations in 33 marketsworldwide. Currently owned by Hong Kong-based conglomerate HutchinsonWhampoa, the Group employs 98,000 staff in more than 9,500 retail stores.These stores focus on a range of products from health and beauty goods, luxuryperfumeries and cosmetics to food and electronics. The Group is also anestablished player in the beverage industry, supplying a full range of beveragesfrom bottled water, fruit juices, soft drinks and tea products to premium winelabels via its international wine wholesaler and distributor.
The ASW portfolio encompasses popular Asian brands and retail chains. Theseinclude the health and beauty specialists Watson’s (Your Personal Store); Park‘n Shop supermarket; the food galleria, Taste; Great Food Halls; Gourmet, aboutique-style fine food hall; Fortress electrical appliance stores; Watson’sWine Cellar; and Nuance-Watson airport duty-free shops. ASW is also a majorproducer and distributor of water products and beverages in the region, andWatsons Water is the top-selling brand in Hong Kong.
In Europe, ASW currently operates stores in more than 20 countries under thehealth and beauty brands Kruidvat, Trekpleister, Rossmann, Superdrug, Savers,DC, Drogas, Spektr and Watson’s (Your Personal Store), as well as luxuryperfumeries and cosmetics brands, Marionnaud, ICI Paris XL and The PerfumeShop.
In March 2011, ASW announced it would rebrand its 212-store retail networkin Ukraine from DC Ukraine to Watsons. DC Ukraine operates retail store ofhousehold chemical goods, personal hygiene products, perfumes andcosmetics throughout Ukraine. The rebranding decision followed a successfulexpansion of DC in the market since the Group acquired the business in 2006.
Toiletries The Global Market
© Key Note Ltd 2011 90

Avon Products Inc
The world’s largest direct seller and leading beauty company, Avon ProductsInc, had a market capitalisation in excess of $12bn as of January 2011. Itsproducts fall into three categories, namely beauty, fashion and home products.Its beauty products division consists of colour cosmetics, fragrances, skincareand personal care. Avon Products’ best-recognised brands include Avon Colour,Anew, Skin-So-Soft, Advance Techniques, Avon Naturals and Mark. Avonprimarily sells its products through direct-selling channels. It has operations insix regions including Latin America, North America, Central and EasternEurope, Western Europe, the Middle East and Africa, Asia/Pacific, and thePeople’s Republic of China (PRC).
In April 2011, beauty company Avon Products, Inc. joined the Roundtable onSustainable Palm Oil (RSPO) in support of its commitment to 100% certifiedsustainable palm oil. The company has made a commitment to purchaseGreenPalm certificates covering all of its global palm oil use. The certificatesaim to help to drive demand for sustainable palm oil, increase the supply forsustainable palm oil, and maintain biodiversity and habitat for endangeredspecies.
In June 2011, Avon launched ‘Barbie Loves Avon’ beauty and lifestyle productsacross Europe, Middle East and Africa. The collection, in partnership with theUS-based toy company, Mattel, includes lip gloss, hair care, sunglasses andhandbags, and will be supported by a marketing programme targeting girlsand mums via social media and digital advertising.
Beiersdorf AG
The German company Beiersdorf AG is a leading manufacturer in the cosmeticsand toiletries, as well as medical and adhesive-tape industries. Its brandsinclude NIVEA, Eucerin and La Prairie. Beiersdorf employs around 20,000people worldwide.
In May 2011, Beiersdorf launched the global campaign ’100 Years Skincare forLife’ for its NIVEA brand. The campaign was centred around the values that itbelieves have been associated with NIVEA for generations: trust, honesty,reliability, quality and family. In 2010, turnover at Beiersdorf amounted to€6.19bn, up from €5.75bn in 2009. Its pre-tax profit, however, decreased from€583m to €553m.
Burt’s Bees
Burt’s Bees is a US company that produces personal care, health, beauty andpersonal hygiene products. Established in the 1980s, the companymanufacturers its products with natural ingredients using minimal processing,including distillation, exaction and hydrolysis.
In May 2011, Burt’s Bees teamed up with Natural Environmental EcologicalManagement to build three urban gardens in downtown Durham, NC. Thegardens were constructed using natural and sustainable agricultural methods.
Toiletries The Global Market
© Key Note Ltd 2011 91

Colgate-Palmolive Company
The US-based Colgate-Palmolive Company was founded as a small soap andcandle business in 1806. Today it sells its oral care, personal care, householdcare and pet nutrition products in more than 200 countries. The Palmolivebrand is prominent in hair care, but the company is particularly strong in oralcare. Colgate is among the 100 most valuable global brands with a marketshare of 45% in the toothpaste and 30.8% in toothbrush segments.
In March 2011, Colgate-Palmolive came to an agreement with Unilever to sellits laundry brands Fab, Lavomatic and Vel in Columbia to Unilever for $215m.In May, Colgate announced it would sponsor the breakfast show across GlobalRadio’s Heart network for 4 weeks starting from 9th May, part of its ’KeepBritain Smiling’ campaign. The campaign, the stated aim of which was tocollect one million ’smiles’ during May and June, pledged to donate £100,000to children’s charity Barnardo’s when said target was reached.
Crabtree & Evelyn Ltd
Founded in 1972, the British company Crabtree & Evelyn has evolved from asmall, family-run business specialising in fine soaps to an internationalcompany known for its fragrances, toiletries, gourmet foods and gifts. It wasa forerunner in the use of natural ingredients from fruit, plants and flowers inits toiletries, and its products are available in more than 40 countries andthrough its e-commerce site.
In March 2011, Crabtree & Evelyn Ltd launched the first phase of a 5 yearmarketing strategy in which it would use digital channels to attract newaudiences. In April, the company launched a new home fragrance collectionwhich was available in room sprays, scented candles, drawer liners and reeddiffusers. The summer scents include single notes of lily, rose, lavender and iris.
Estee Lauder Inc
Founded in New York City in 1946 by a husband-and-wife team, the cosmeticscompany Estée Lauder is a US manufacturer and marketer of skincare,cosmetics, perfume and haircare products. It went international in 1960, withits first overseas concession opening in the London department store Harrods.Its products are now sold in 140 countries and, in its latest financial year (ending30th June 2010), sales outside the Americas accounted for 55.9% of revenueand 81.5% of operating income. Total sales for the year ending 30th June 2010amounted to $7.8bn, up from $7.33bn in the previous year. Its operatingincome increased from $510.1m in 2008/2009 to $874.6m in 2009/2010.
In June 2011, Estee Lauder Inc announced the opening of an innovation centrein Shanghai, China. The new centre aims to increase the company’s researchcapabilities in Asia, reinforcing a commitment to local consumers bydeveloping products tailored to the needs of Chinese and Asian skin.
Toiletries The Global Market
© Key Note Ltd 2011 92

Table 9.2: Estée Lauder Inc — Total Sales by Product Category($m), Years Ending 30th June 2009 and 2010
2009 2010
Skincare 2,886.0 3,227.1
Make-up 2,830.9 2,978.2
Fragrance 1,150.9 1,136.9
Hair care 402.4 413.9
Other 61.7 55.4
Total 7,331.9 7,811.5
Note: total are before returns associated with restructuring activities.
Source: Estee Lauder Inc
L’Oreal SA
The French group L’Oréal was founded in 1907 by the chemist, EugèneSchueller, who invented the first synthetic hair colourant, which he calledAuréale. The company markets 23 global cosmetic brands under a number ofdifferent product ranges, including ‘Consumer Products’, which compriseproducts intended for skincare, haircare, hair colouring, make-up and stylingproducts; its ‘Luxury Products’ range includes international brand cosmetics,such as Lancôme, Ralph Lauren and Cacharel, distributed through selectedretail channels; while its ‘Active Cosmetics’ division consists of the Innéov andVichy brands among others, for sale principally in pharmacies.
In 2008, L’Oréal acquired YSL Beauté for €1.15bn. YSL Beauté and its subsidiary,Roger & Gallet, formed part of PPR’s Gucci Group luxury division. In October2010, the company announced plans to review its digital media planning andbuying business across Europe and to increase its digital spend. In December,beauty pills manufacturer Innéov, which is owned by L’Oréal and Nestlé,announced plans to launch in the People’s Republic of China (PRC) in 2011. Asmore people in the region are turning to dietary supplements to treat skin andhair conditions, the company sees a huge opportunity in Asia fornutricosmetics.
In January 2011, singer Gwen Stefani signed a deal with L’Oreal and becameits latest public face. In May, L’Oreal picked digital marketing company Gyroto handle its estimated £20m UK customer relationship marketing account.Gyro is to build customer engagement across the Garnier, Maybelline andL’Oreal beauty brands, and the activity will span direct mail and digitalchannels.
Toiletries The Global Market
© Key Note Ltd 2011 93

Mary Kay Inc
Mary Kay Inc is a US-based direct selling company that sells skincare andcosmetics products in more than 30 global markets through an independentsales force of more than 1.7 million consultants. Founded in 1963 by Mary KayAsh, the company has headquarters in Dallas, Texas, and manufacturingfacilities in Dallas and the PRC.
Procter & Gamble Company
From its origins as a small family-run soap and candle company, established in1837, Cincinnati-based Procter & Gamble (P&G) now employs around 135,000people in more than 80 countries worldwide, marketing to consumers in morethan 180 countries. It operates in the divisions of Beauty & Grooming, Health& Well-Being and Household Care. 22 of its brands earn more than $1bn insales each year. The billion-dollar toiletries brands include Gillette, Crest, Head& Shoulders, Olay and Pantene.
In April 2011, P&G announced it would sell its Pringles snacks business toDiamond Foods, the owner of Kettle Chips. Under the terms of the deal, a newentity will be formed to hold the Pringles business, which will then be mergedinto Diamond Foods. P&G shareholders will own about 57% of the newcompany, with Diamond shareholders owning the rest. In the same month,P&G launched a new monthly digital magazine to drive up its online offering.The magazine is sent to the 1 million customers who are registered on the P&Gsite, supersavvyme.com. Also in the same month, P&G’s hair brand Pantenestarted producing its first shampoo and conditioner bottles made primarilyfrom plant-based plastic, derived from sugarcane.
In 2010, P&G’s net sales were valued at $78.94bn, up from $76.69bn in 2009.Its operating income increased from $15.37bn to $16.02bn.
PZ Cussons
Following the recent acquisition of St Tropez (September 2010), PZ Cussonsformed a new beauty division comprising its premium beauty brands: StTropez, The Sanctuary and Charles Worthington. The division is based inCovent Garden, London and aims to maximise the three products and theirpresence both in the UK and internationally. It has been fully operational byJune 2011. In the same month, PZ Cussons also announced it would cut itsImperial Leather soap size by 20% to 100g as a result of the rising costs of rawmaterials. The manufacturer’s decision to reduce the product quantity ratherthan raise the price reflects the increased price sensitivity among its customers.Cussons’ revenue in 2010 — for its European and African business — decreasedby 2.5% and 9.3%, respectively. Sales in Asia, however, grew by a massive22.7% over the same period.
Toiletries The Global Market
© Key Note Ltd 2011 94

Table 9.3: PZ Cussons — Group Revenue by Geographical Region(£m), Years Ending 31st May 2009 and 2010
2009 2010
Africa 358.7 325.2
Asia 135.0 165.6
Europe 288.1 280.8
Total 781.8 771.6
Source: PZ Cussons Annual Report 2010
Unilever PLC
Having sold its fine-fragrance business to Coty Inc in 2005, Unilever’s personalcare division is now primarily concentrated on toiletries. Its Impulse brand,however, remains a leader in the women’s mass-market fragrance sector, whileLynx, which is known as Axe outside of the UK, is an important brand in themen’s mass-market fragrance sector.
In January 2011, Unilever entered into a partnership with BioLeap — acompany specialising in molecular design technology — with the aim ofdeveloping improved consumer products. The first 2 years of partnership willconsist of a team of scientists from Unilever and BioLeap working together onthe core biology of ageing. The company hopes molecular design technologywill enable it to build differentiated, health-enhancing products across severalcategories.
In March, Unilever sold the Sanex brands to Colgate-Palmolive for €672m. Themultinational was ordered by the European commission to sell the Sanexportfolio, part of the €1.28bn Sara Lee personal care acquisition in 2009, oncompetitive grounds. Later in April, the company shut its UK Final-salarypension scheme to the existing members and said the scheme hasbecome ’increasingly unaffordable and unsustainable’. In May 2011, Unilevercompleted the acquisition of Alberto Culver, the personal care company forbrands including Tresemme, nexus, Albert VO5 and St. Ives. Unilever claims theacquisition makes it the world leader in hair conditioning, second largest inshampoo products and third largest in styling. Turnover at Unilever PLCincreased from €39.82bn in 2009 to €44.26bn in 2010, a big contribution towhich came from sales growth in the US, Asia and Africa.
Toiletries The Global Market
© Key Note Ltd 2011 95

Table 9.4: Unilever PLC — Sales by Geographic Region (€m),Year Ending 31st December 2009 and 2010
2009 2010
Western Europe 12,067 12,015
The Americas 12,850 14,562
Asia Africa 14,897 17,685
Total †39,823 44,262
† — does not sum due to rounding at source
Source: Unilever PLC, Annual Report 2010
Toiletries The Global Market
© Key Note Ltd 2011 96

10. Forecasts
INTRODUCTION
Population
According the latest estimates by the Office for National Statistics, the UKpopulation will increase at an average annual rate of 0.7% over the next fewyears. At this rate, the UK’s population will surpass the 65 million and 70 millionmarks in 2018 and 2033, respectively. This increase will inevitably boost overallconsumer consumption. Although the female population will continue tooutnumber the male population, the latter is anticipated to grow at a slightlyfaster rate. In the long term, this may constitute a potential driver for the maletoiletries market.
Table 10.1: Forecast UK Resident Population by Sex (000),Mid-Years 2011-2015
2011 2012 2013 2014 2015
Female 31,807 32,001 32,196 32,391 32,587
Male 30,842 31,073 31,302 31,530 31,757
Total 62,649 63,074 63,498 63,921 64,344
% change year-on-year 0.7 0.7 0.7 0.7 0.7
Source: Population Projections Database (2008-based projections), NationalStatistics website © Crown copyright material is reproduced with the permissionof the Controller of HMSO (and the Queen’s Printer for Scotland)
Gross Domestic Product
In June, HM Treasury released figures to the effect that it expects the UK’seconomy to grow by 1.5% in 2011, before increasing by a further 2.2% in 2012(see Table 9.1). It should be noted, however, that these figures represent adowngrade of 0.3 percentage points from February 2011, when GDP wasforecast to grow by 1.8%.
Toiletries Forecasts
© Key Note Ltd 2011 97

Table 10.2: Forecast UK Growth in Gross Domestic Product inReal Terms (%), 2011-2015
2011 2012 2013 2014 2015
Gross domestic product growth(%) 1.5 2.2 2.4 2.5 2.5
Percentage point changeyear-on-year - 0.7 0.2 0.1 0.0
Source: Forecasts for the UK Economy, May 2011, Treasury Independent Average© Crown copyright
Inflation
The latest official figures place inflation at 5.1%, up from 3.7% in December2010. It is believed that the rise in fuel, commodity and energy costs, as well asthe value-added-tax rise in effect since 4th January 2011, has significantlypushed up the inflation rate. Food, energy and mortgage costs are currentlyrising well above average inflation levels and are expected to continue to doso in the near future.
Table 10.3: Forecast UK Rate of Inflation (%), 2011-2015
2011 2012 2013 2014 2015
Inflation (%) 5.1 3.6 3.4 3.4 3.1
Percentage point changeyear-on-year 0.5 -1.5 -0.2 0.0 -0.3
Note: inflation is at retail price index (RPI).
Source: Forecasts for the UK Economy, May 2011, Treasury Independent Average© Crown copyright
Unemployment
Unemployment, already at a 17-year high, is expected to stabilise in 2012 atthe 1.51 million mark, before lowering, starting in 2013. It is not until 2015,however, that the number of claimants is predicted to fall below pre-recessionlevels to 1.28 million.
Toiletries Forecasts
© Key Note Ltd 2011 98

Table 10.4: Forecast Actual Number of Unemployed Persons inthe UK (million), 2011-2015
2011 2012 2013 2014 2015
Actual number ofclaimants (million) 1.51 1.51 1.45 1.33 1.28
% change year-on-year 0.7 0.0 -4.0 -8.3 -3.8
Source: Forecasts for the UK Economy, May 2011, Treasury Independent Average© Crown copyright
FORECASTS 2006-2010
Key Note expects growth in the value of retail sales of toiletries to remainmoderate in the coming years, particularly in the fragrances sector. During the5-year forecast period, the total sales value of toiletries is expected to increaseby around 9.5%, driven by new product innovations (e.g. the so-calledcosmeceuticals), as well as benefiting from a growing population. Key Noteforecasts the UK market for toiletries to be worth around £5.03bn by 2015.
Table 10.5: The Forecast UK Market for Toiletries by Sector byValue at Current Prices (£m at rsp), 2011-2015
2011 2012 2013 2014 2015
Personal wash and bathroomtoiletries 1,267.3 1,312.7 1,357.3 1,398.3 1,428.2
Skincare products 1,230.6 1,270.5 1,304.5 1,344.4 1,377.9
Hair care products 1,134.2 1,139.2 1,151.1 1,162.8 1,196.9
Oral care products 569.4 567.3 575.5 583.9 598.5
Shaving preparations, wetrazors and blades, anddepilatories 390.3 398.5 407.7 417.0 427.5
Total 4,591.8 4,688.2 4,796.1 4,906.4 5,029.0
% change year-on-year 1.3 2.1 2.3 2.3 2.5
rsp — retail selling prices
Source: Key Note
Toiletries Forecasts
© Key Note Ltd 2011 99
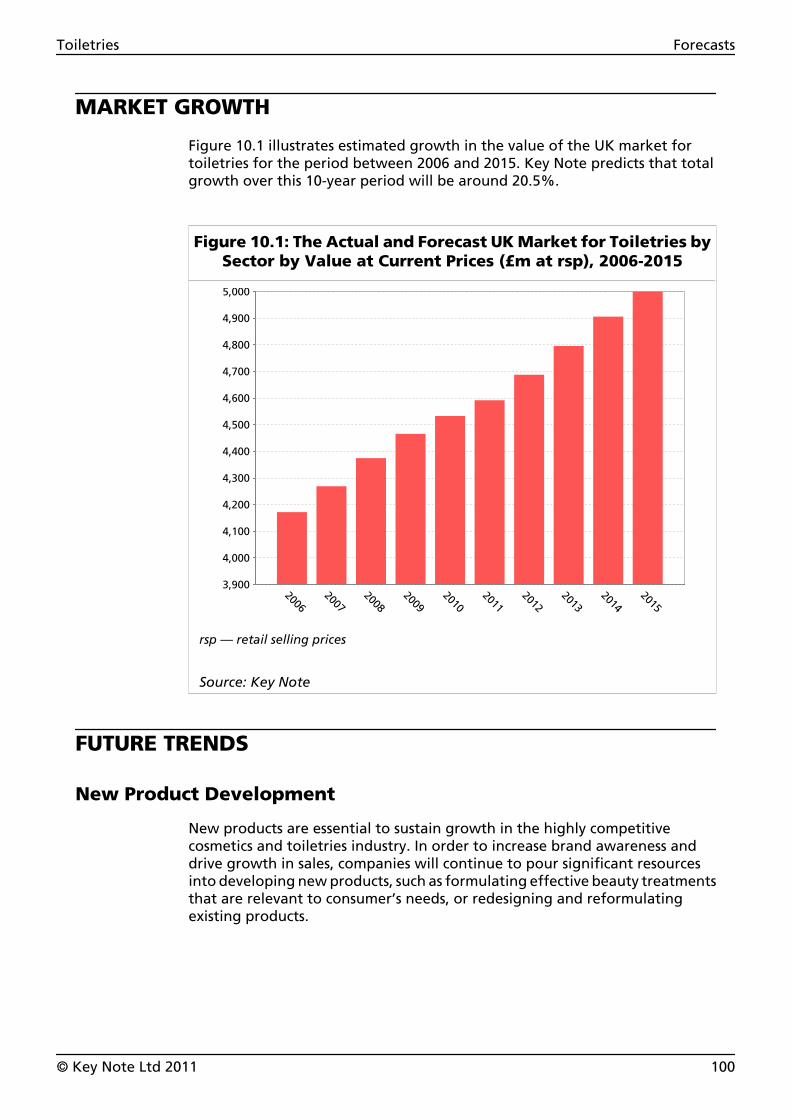
MARKET GROWTH
Figure 10.1 illustrates estimated growth in the value of the UK market fortoiletries for the period between 2006 and 2015. Key Note predicts that totalgrowth over this 10-year period will be around 20.5%.
Figure 10.1: The Actual and Forecast UK Market for Toiletries bySector by Value at Current Prices (£m at rsp), 2006-2015
20062007
20082009
20102011
20122013
20142015
3,900
4,000
4,100
4,200
4,300
4,400
4,500
4,600
4,700
4,800
4,900
5,000
rsp — retail selling prices
Source: Key Note
FUTURE TRENDS
New Product Development
New products are essential to sustain growth in the highly competitivecosmetics and toiletries industry. In order to increase brand awareness anddrive growth in sales, companies will continue to pour significant resourcesinto developing new products, such as formulating effective beauty treatmentsthat are relevant to consumer’s needs, or redesigning and reformulatingexisting products.
Toiletries Forecasts
© Key Note Ltd 2011 100
Size of Products Set to Shrink
As the cost of raw materials continues to rise, manufacturers will see theirprofit margins shrink unless these costs are passed on to the consumer. In aclimate of economic uncertainty and price-conscious customers, manufacturersare loathed to raise prices for fear of losing their customer base. An alternativestrategy, which has already been adopted by some (e.g. PZ Cussons’ decisionto reduce the size of its Imperial Leather soap from 125g to 100g) and whichis likely to become more widespread, is to reduce product sizes instead.
Toiletries Forecasts
© Key Note Ltd 2011 101

11. Company Profiles
INTRODUCTION
The following section contains financial profiles of some of the principalcompanies identified as operating within the market sector discussed in thisreport. The financial results of some of the important names within the sectormay not be reported if:
• their principal activities are so varied that their results are not consideredapplicable to the survey
• they are no longer trading as separate companies
• their financial data are very out of date.
DEFINITIONS
A company which has a ‘Y’ consolidated value has filed consolidated accountsfor the relevant year.
† — denotes that the growth rate calculation is invalid, because the figureseither move from positive to negative or from negative to positive.
Turnover (Sales)
This includes all income derived from the principal activities of the firm, net ofVAT. It encompasses UK sales, exports and overseas and intercompany sales.
Pre-Tax Profit
The net trading profit figure after deduction of all operating expenses,including depreciation and finance charges but before deduction of tax,dividends, subventions or group relief, and other appropriations. Whereapplicable, it will include the share of profits and losses of associatedcompanies. Items described by the company as exceptional are included;extraordinary items are excluded.
Profit Margin
Pre-tax profit expressed as a percentage of sales.
Average Remuneration
Total employee remuneration divided by the number of employees.
Sales per Employee
Sales divided by the number of employees.
FURTHER INFORMATION
For more detailed financial information telephone Key Note on: 0845-5040452.
Toiletries Company Profiles
© Key Note Ltd 2011 102

AVON COSMETICS LTD
Registered Office Nunn Mills Road,Northampton, NN1 5PATelephone: 01604-232 425
Company Registration Number 00592235Date of Incorporation 21/10/57Holding Company Avon European Holdings LtdUltimate Holding Company Avon Products Inc
Previous Name(s) and Date(s) of Change
None.
Principal Activities
The distribution and sale of beauty products, gifts and decorative products.
SIC Codes
51450, Wholesale of perfume and cosmetics51479, Wholesale of other household goods not elsewhere classified
Structure
Avon Cosmetics Ltd is one of the world’s leading direct sellers of beauty and related products,marketing to women in more than 100 countries through approximately 6.5 millionindependent sales representatives. Avon entered the UK market in 1959.
Brand Information
Avon’s leading brands of toiletries include Anew, Solutions, Skin So Soft and Senses.
Recent Developments
In May 2011, Avon Cosmetics Ltd was crowned the winner of the Environmental Award at theDirect Selling Association (DSA) conference.
Toiletries Company Profiles
© Key Note Ltd 2011 103

FINANCIAL PROFILE
Year End 31/12/09 31/12/08 31/12/07 31/12/06Weeks 52 52 52 52Consolidated N N N N
Sales
Sales (£000) 316,642 318,599 297,961 283,772% change year-on-year -0.61 6.93 5.00 -Exports (£000) 25,161 23,502 17,281 8,166Exports/Sales (%) 7.95 7.38 5.80 2.88
Profits
Pre-Tax Profit (£000) -7,105 20,644 7,421 9,928% change year-on-year -134.42 178.18 -25.25 -Profit Margin (%) -2.24 6.48 2.49 3.50Operating Profit (£000) -4,325 20,844 6,543 8,553
Employees
Number of Employees 1,766 1,599 1,632 1,734Average Employee Remuneration (£) 30,278 30,874 32,604 33,307Sales per Employee (£) 179,299 199,249 182,574 163,652Profit per Employee (£) -4,023 12,911 4,547 5,725Capital Employed per Employee (£) 43,314 52,171 41,224 45,413
Balance Sheet/Ratios
Capital Employed (£000) 76,493 83,422 67,277 78,747Return on Capital (%) -9.29 24.75 11.03 12.61Net Worth (£000) 39,123 45,811 61,119 52,752Current Ratio 0.96 1.07 0.94 0.95Liquidity Ratio 0.78 0.87 0.74 0.71
Toiletries Company Profiles
© Key Note Ltd 2011 104

ESTEE LAUDER COSMETICS LTD
Registered Office 73 Grosvenor Street,London, W1K 3BQTelephone: 01730-266 531
Company Registration Number 00659213Date of Incorporation 16/05/60Holding Company Estee Lauder Europe Inc.Ultimate Holding Company Estee Lauder Companies Inc.
Previous Name(s) and Date(s) of Change
None.
Principal Activities
A group engaged in the sale of cosmetics to retail outlets in the UK and the Republic of Ireland.
SIC Codes
51450, Wholesale of perfume and cosmetics.
Structure
Estée Lauder Cosmetics Ltd is a US-based company, which was established in 1946. The companyentered the European market in 1960, after setting up operations in London. Its product rangecovers skincare, cosmetics, perfume and haircare products, which are sold in more than 135countries.
Brand Information
Brands include Aveda, Bobbi Brown, Clinique and Jo Malone.
Recent Developments
In March 2011, Estee Lauder launched a new fragrance, Adventurous, which is exclusive to travelretail and available at all Estee Lauder travel retail locations worldwide.
Toiletries Company Profiles
© Key Note Ltd 2011 105

FINANCIAL PROFILE
Year End 30/06/10 30/06/09 30/06/08 30/06/07Weeks 52 52 52 52Consolidated Y Y Y Y
Sales
Sales (£000) 365,899 345,558 326,755 301,195% change year-on-year 5.89 5.75 8.49 -Exports (£000) 23,905 23,904 21,961 19,145Exports/Sales (%) 6.53 6.92 6.72 6.36
Profits
Pre-Tax Profits (£000) 60,202 56,167 44,390 48,599% change year-on-year 7.18 26.53 -8.66 -Profit Margin (%) 16.45 16.25 13.59 16.14Operating Profit (£000) 59,712 53,171 39,360 46,139
Employees
Number of Employees 6,236 6,429 4,240 4,008Average Employee Remuneration (£) 15,804 15,440 21,548 21,910Sales per Employee (£) 58,675 53,750 77,065 75,148Profit per Employee (£) 9,654 8,737 10,469 12,126Capital Employed per Employee (£) 20,208 19,358 21,124 13,552
Balance Sheet/Ratios
Capital Employed (£000) 126,014 124,454 89,564 54,317Return on Capital (%) 47.77 45.13 49.56 89.47Net Worth (£000) 122,983 121,454 85,611 51,092Current Ratio 2.60 2.64 2.05 1.54Liquidity Ratio 2.35 2.41 1.74 1.24
Toiletries Company Profiles
© Key Note Ltd 2011 106

L’OREAL (UK) LTD
Registered Office 255 Hammersmith Road,London, W6 8AZTelephone: 01443 234400
Company Registration Number 00271555Date of Incorporation 24/12/32Holding Company L’oreal SAUltimate Holding Company L’oreal SA
Previous Name(s) and Date(s) of Change
Golden Ltd (01/01/86)
Principal Activities
The manufacture and distribution of hair care, hair colour, perfume, make-up and skincareproducts.
SIC Codes
24520, Manufacture of perfumes and toilet preparations.
Structure
Based in London, L’Oréal (UK) Ltd is a subsidiary of the French company L’Oréal SA andspecialises in women’s make-up, skincare, haircare, dermatology and fragrances. In 2006, thecompany acquired The Body Shop International for £652m.
Brand Information
L’Oreal’s leading cosmetics and toiletries brands include Vichy, Biotherm, YSL Beaute, Elvive,Garnier and luxury brand Lancome.
Recent Developments
In May 2011, L’Oreal picked digital marketing company Gyro to handle its estimated £20m UKcustomer relationship marketing account. Gyro is to build customer engagement across theGarnier, Maybelline and L’Oreal beauty brands, and the activity will span direct mail and digitalchannels.
Toiletries Company Profiles
© Key Note Ltd 2011 107

FINANCIAL PROFILE
Year End 31/12/09 31/12/08 31/12/07 31/12/06Weeks 52 52 52 52Consolidated N N N N
Sales
Sales (£000) 745,770 730,066 721,597 663,611% change year-on-year 2.15 1.17 8.74 -Exports (£000) - - - -Exports/Sales (%) - - - -
Profits
Pre-Tax Profits (£000) 93,180 74,042 96,043 76,961% change year-on-year 25.85 -22.91 24.79 -Profit Margin (%) 12.49 10.14 13.31 11.60Operating Profit (£000) 95,944 104,612 94,397 76,764
Employees
Number of Employees 2,937 2,534 2,491 2,399Average Employee Remuneration (£) 24,191 28,487 29,277 28,218Sales per Employee (£) 253,922 288,108 289,682 276,620Profit per Employee (£) 31,726 29,219 38,556 32,080Capital Employed per Employee (£) 11,250 42,945 38,552 33,727
Balance Sheet/Ratios
Capital Employed (£000) 33,040 108,823 96,033 80,910Return on Capital (%) 282.02 68.04 100.01 95.12Net Worth (£000) -29,314 45,160 65,873 35,449Current Ratio 1.02 1.13 1.18 1.16Liquidity Ratio 0.93 0.99 1.04 1.02
Toiletries Company Profiles
© Key Note Ltd 2011 108

PROCTER & GAMBLE (HEALTH & BEAUTY CARE) LTD
Registered Office The Heights,Brooklands,Weybridge,Surrey, KT13 0XP
Company Registration Number 00436549Date of Incorporation 06/06/47Holding Company Procter & Gamble LtdUltimate Holding Company Procter & Gamble Co.
Previous Name(s) and Date(s) of Change
Richardson-Vicks Ltd (01/01/89)
Principal Activities
A partner in Procter & Gamble UK.
SIC Codes
65239, Financial intermediation not elsewhere classified.
Structure
Procter & Gamble (P&G) Ltd was founded in 1837 by William Procter and James Gamble. It ownsmany well-known branded products, including the washing-up liquid, Fairy Liquid, and Gillette.Its UK subsidiary, P&G (Health & Beauty Care) Ltd, is based in Surrey.
Brand Information
Leading Procter & Gamble brands include Olay, Head & Shoulders, Pantene, Herbal Essences,Braun, Gillette, Crest and Oral-B.
Recent Developments
In February, Proctor & Gamble announced one of its brands, Oral-B, had appointed Dr JamesRussell as its ambassador, who was known for his work on Channel 4’s prime time EmbarrassingBodies series.
Toiletries Company Profiles
© Key Note Ltd 2011 109

FINANCIAL PROFILE
Year End 30/06/10 30/06/09 30/06/08 30/06/07Weeks 52 52 52 52Consolidated N N N N
Sales
Sales (£000) 0 0 19,330 57,643% change year-on-year - -100.00 -66.47 -Exports (£000) 0 0 - -Exports/Sales (%) - - - -
Profits
Pre-Tax Profits (£000) -10,110 77,716 19,330 57,643% change year-on-year † 302.05 -66.47 -Profit Margin (%) - - 100.00 100.00Operating Profit (£000) -10,110 30,716 19,330 57,643
Employees
Number of Employees - - - -Average Employee Remuneration (£) - - - -Sales per Employee (£) - - - -Profit per Employee (£) - - - -Capital Employed per Employee (£) - - - -
Balance Sheet/Ratios
Capital Employed (£000) 389,971 386,582 348,436 322,327Return on Capital (%) -2.59 20.10 5.55 17.88Net Worth (£000) 389,971 386,582 348,436 321,685Current Ratio 1.44 1.41 1.09 0.87Liquidity Ratio 1.44 1.41 1.09 0.87
Toiletries Company Profiles
© Key Note Ltd 2011 110

PZ CUSSONS PLC
Registered Office Manchester Business Park,3500 Aviator Way,Manchester, M22 5TGTelephone: 0161-491 8000
Company Registration Number 00019457Date of Incorporation 20/02/84Holding Company NoneUltimate Holding Company None
Previous Name(s) and Date(s) of Change
Paterson Zochonis Public Ltd Company (31/05/02)
Principal Activities
A group engaged in the manufacture and distribution of soaps, detergents, toiletries,pharmaceuticals, electrical goods, edible oils, fats and spreads and nutritional products.
SIC Codes
24511, Manufacture of soap and detergents.24520, Manufacture of perfumes and toilet preparations.24421, Manufacture of medicaments.29230, Manufacture of non-domestic cooling and ventilation equipment.15420, Manufacture of refined oils and fats.15519, Manufacture of other milk products.
Structure
Known as Paterson Zochonis PLC until 2002, PZ Cussons manufactures personal and householdcleaning products in Europe, Asia and Africa. Its origins go back to 1879, when George Patersonand George Zochonis set up a trading post in Sierra Leone. It acquired the soap-making CussonsGroup Ltd in 1975.
Brand Information
PZ Cussons’ brands include Imperial Leather, Carex, Sanctuary and Original Source.
Recent Developments
PZ Cussons formed a new beauty division comprising its premium beauty brands: St Tropez, TheSanctuary and Charles Worthington. The division aims to maximise the three products and theirpresence both in the UK and internationally. It has been fully operational since June 2011.
Toiletries Company Profiles
© Key Note Ltd 2011 111

FINANCIAL PROFILE
Year End 31/05/10 31/05/09 31/05/08 31/05/07Weeks 52 52 52 52Consolidated Y Y Y Y
Sales
Sales (£000) 771,600 838,100 660,900 577,900% change year-on-year -7.93 26.81 14.36 -Exports (£000) - - - 577,900Exports/Sales (%) - - - 100.00
Profits
Pre-Tax Profits (£000) 101,800 84,400 76,500 67,900% change year-on-year 20.62 10.33 12.67 -Profit Margin (%) 13.19 10.07 11.58 11.75Operating Profit (£000) 101,400 86,200 76,400 65,800
Employees
Number of Employees 8,312 8,596 8,697 9,877Average Employee Remuneration (£) 11,044 9,970 8,221 -Sales per Employee (£) 92,830 97,499 75,992 58,510Profit per Employee (£) 12,247 9,819 8,796 6,875Capital Employed per Employee (£) 77,960 67,148 64,402 42,776
Balance Sheet/Ratios
Capital Employed (£000) 648,000 577,200 560,100 422,500Return on Capital (%) 15.71 14.62 13.66 -Net Worth (£000) 291,800 232,300 196,500 257,600Current Ratio 1.84 1.94 2.26 2.54Liquidity Ratio 1.19 1.08 1.10 1.29
Toiletries Company Profiles
© Key Note Ltd 2011 112

SUPERDRUG STORES PLC
Registered Office 118 Beddington Lane,Croydon,Surrey, CR0 4TBTelephone: 020-8684 7000
Company Registration Number 00807043Date of Incorporation 28/05/64Holding Company Kruidvat Uk LtdUltimate Holding Company Hutchison Whampoa Ltd
Previous Name(s) and Date(s) of Change
Superdrug Stores Ltd (24/07/01)Superdrug Stores PLC (17/07/01)
Principal Activities
The retail of health and beauty products.
SIC Codes
52310, Dispensing chemists.52330, Retail sales of cosmetic and toilet articles.
Structure
Superdrug Stores is a part of AS Watson Group, which also owns the UK chains The PerfumeShop and Savers Health & Beauty. AS Watson, in turn, is owned by the Hong Kong-basedcompany Hutchison Whampoa Ltd.
Brand Information
Superdrug stocks brands of toiletries including NIVEA, Garnier and Olay, as well as selling itsown-brand ranges, such as its Naturals Collection.
Recent Developments
In May 2011, Superdrug launched its first loyalty card for customers to enable them to earnpointes online and in store. The launch was accompanied by points promotions both in storeand online.
Toiletries Company Profiles
© Key Note Ltd 2011 113
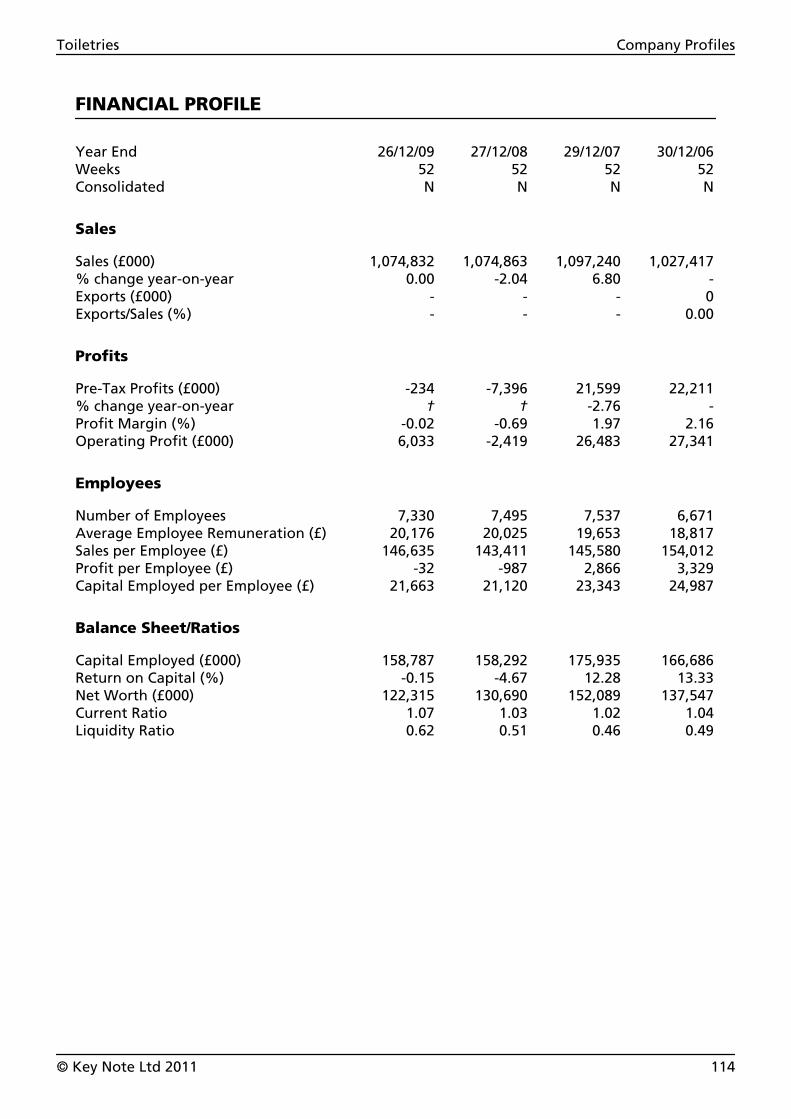
FINANCIAL PROFILE
Year End 26/12/09 27/12/08 29/12/07 30/12/06Weeks 52 52 52 52Consolidated N N N N
Sales
Sales (£000) 1,074,832 1,074,863 1,097,240 1,027,417% change year-on-year 0.00 -2.04 6.80 -Exports (£000) - - - 0Exports/Sales (%) - - - 0.00
Profits
Pre-Tax Profits (£000) -234 -7,396 21,599 22,211% change year-on-year † † -2.76 -Profit Margin (%) -0.02 -0.69 1.97 2.16Operating Profit (£000) 6,033 -2,419 26,483 27,341
Employees
Number of Employees 7,330 7,495 7,537 6,671Average Employee Remuneration (£) 20,176 20,025 19,653 18,817Sales per Employee (£) 146,635 143,411 145,580 154,012Profit per Employee (£) -32 -987 2,866 3,329Capital Employed per Employee (£) 21,663 21,120 23,343 24,987
Balance Sheet/Ratios
Capital Employed (£000) 158,787 158,292 175,935 166,686Return on Capital (%) -0.15 -4.67 12.28 13.33Net Worth (£000) 122,315 130,690 152,089 137,547Current Ratio 1.07 1.03 1.02 1.04Liquidity Ratio 0.62 0.51 0.46 0.49
Toiletries Company Profiles
© Key Note Ltd 2011 114

UNILEVER PLC
Registered Office Port Sunlight,Wirral,Merseyside, CH62 4ZDTelephone: 020-7822 5252
Company Registration Number 00041424Date of Incorporation 21/06/94Holding Company NoneUltimate Holding Company None
Previous Name(s) and Date(s) of Change
None.
Principal Activities
A group engaged in the manufacture and supply of savoury, dressings and spreads, personalcare products, ice cream and tea-based beverages and home care and cleaning products.
SIC Codes
24520, Manufacture of perfumes and toilet preparations.15870, Manufacture of condiments and seasonings.15430, Manufacture of margarine and similar edible fats.15891, Manufacture of soups.15899, Manufacture of other food products not elsewhere classified.15520, Manufacture of ice cream.24511, Manufacture of soap and detergents.24512, Manufacture of cleaning and polishing preparations.
Structure
Unilever is one of the world’s leading suppliers of fast-moving consumer goods (FMCG). Its threeglobal product divisions are Food, Home Care and Personal Care.
Brand Information
Unilever’s toiletries brands include Dove, Sure, Pears, Sunsilk and TIGI.
Recent Developments
In April 2011, Unilever sold Sanex, the multi-category personal care brand, to Colgate for€672m.
Toiletries Company Profiles
© Key Note Ltd 2011 115

FINANCIAL PROFILE
Year End 31/12/10 31/12/09 31/12/08 31/12/07Weeks 52 52 52 52Consolidated Y Y Y Y
Sales
Sales (£000) 44,262,000 39,823,000 40,523,000 40,187,000% change year-on-year 11.15 -1.73 0.84 -Exports (£000) - - 40,523,000 40,187,000Exports/Sales (%) - - 100.00 100.00
Profits
Pre-Tax Profits (£000) 6,132,000 4,916,000 7,129,000 5,184,000% change year-on-year 24.74 -31.04 37.52 -Profit Margin (%) 13.85 12.34 17.59 12.90Operating Profit (£000) 6,450,000 5,020,000 7,167,000 5,245,000
Employees
Number of Employees 165,000 168,000 174,000 175,000Average Employee Remuneration (£) 27,709 24,774 24,098 25,246Sales per Employee (£) 268,255 237,042 232,891 229,640Profit per Employee (£) 37,164 29,262 40,971 29,623Capital Employed per Employee (£) 167,036 151,292 128,402 135,674
Balance Sheet/Ratios
Capital Employed (£000) 27,561,000 25,417,000 22,342,000 23,743,000Return on Capital (%) 22.25 19.34 31.91 21.83Net Worth (£000) -3,793,000 -4,982,000 -6,143,000 -4,368,000Current Ratio 0.92 0.93 0.81 0.73Liquidity Ratio 0.60 0.62 0.53 0.45
Toiletries Company Profiles
© Key Note Ltd 2011 116

12. Company Financials
The following companies, listed in alphabetical order, are taken from the KeyNote database.
Links with Companies House mean that when the latest accounts fora company are made available, they can be incorporated on our databaseand be ready for inclusion in Key Note Market Report Plus’. A short delay occursat Companies House between receipt of documents and their public release.As this delay can be longer, the availability of accounts can sometimes beaffected.
It should be noted that the financial results for certain companies are notrestricted to sales of the products covered by this report.
Turnover (£000)Pre-Tax Profit
(£000) Year End
Company
Alberto-CulverGroup Ltd 0 290,146 30/09/2010
Alliance BootsHoldings Ltd 0 530,000 31/03/2010
Avon CosmeticsLtd 316,642 -7,105 31/12/2009
Baylis & HardingPLC 18,985 89 31/05/2010
The Body ShopInternational PLC 320,500 34,700 02/01/2010
The BootsCompany PLC 1,146,000 220,000 31/03/2010
Bourjois Ltd 19,821 505 31/12/2010
Church & DwightUK Ltd 53,818 1,789 30/11/2009
Colgate-Palmolive(UK) Ltd 212,040 21,471 31/12/2009
CombeInternational Ltd 42,272 4,012 31/12/2009
Coty UK Ltd 228,597 995 30/06/2010
Creightons PLC 13,590 303 31/03/2010
DEB Ltd 44,011 9,214 31/12/2009
Gillette UK Ltd 30,499 746 30/06/2010
Toiletries Company Financials
© Key Note Ltd 2011 117

Turnover (£000)Pre-Tax Profit
(£000) Year End
Company
GR & MMBlackledge PLC 126,908 -330 31/12/2009
H Bronnley & CoLtd 7,054 -1,500 31/12/2009
Johnson &Johnson Ltd 44,701 7,461 02/01/2011
L’Oréal (UK) Ltd 745,770 93,180 31/12/2009
Mercona (GB) Ltd 10,356 269 31/12/2009
Milton-Lloyd Ltd 13,802 2,321 31/12/2009
Molton Brown Ltd 58,195 4,338 31/12/2009
Pfizer ConsumerHealthcare Ltd 35,999 801 30/11/2009
Phyllis Earle Ltd 288 72 31/12/2009
Procter & GambleLtd 0 -43,028 30/06/2010
Procter & Gamble(Health
& Beauty Care) Ltd 0 -10,110 30/06/2010
PZ Cussons PLC 771,600 101,800 31/05/2010
Rayburn TradingCompany Ltd 77,657 561 31/08/2010
Sara Lee UKFinance Ltd 0 0 03/07/2010
Simple ToiletriesLtd 56,350 15,203 30/09/2010
Superdrug StoresPLC 1,074,832 -234 26/12/2009
Unilever PLC† 44,262,000 6,132,000 31/12/2010
Wella (UK) Ltd 94,657 687 30/06/2010
† — accounts express in Euros (€)
Source: Key Note
Toiletries Company Financials
© Key Note Ltd 2011 118

13. Further Sources
Associations
Cosmetic Toiletry and PerfumeryAssociation (CTPA)Josaron House5/7 John Princes StreetLondon, W1G 0JNTelephone: 020-7491 8891Fax: 020-7493 8061E-mail: [email protected]://www.ctpa.org.uk European Cosmetics Association(COLIPA)Avenue Herrmann Debroux 15AB-1160 AuderghemBrusselsBelgiumTelephone: +32 2 227 66 10Fax: +32 2 227 66 27http://www.colipa.eu
Private Label ManufacturersAssociation (PLMA)630 Third AvenueNew York, NY 10017USTelephone: +1 212 972 3131Fax: +1 212 983 1382E-mail: [email protected]://plma.com
Publications
PZ Cussons, Annual Report 2010Manchester Business Park3500 Aviator WayManchester M22 5TGTelephone: 01614-351 000E-mail:[email protected]://www.pzcussons.com
Unilever PLC, Annual Report 2010Unilever House100 Victoria EmbankmentLondon, EC4Y 0DYUnited KingdomTelephone: 020-7822 5252Fax: 020-7822 5951http://www.unilever.co.uk
Toiletries Further Sources
© Key Note Ltd 2011 119

General Sources
Kantar MediaEaling Gateway26-30 Uxbridge RoadEalingLondon, W5 2BPTelephone: 020-8433 4000Fax: 020-8433 4001http://www.kantarmedia.com
Nielsen Media ResearchAtrium CourtThe RingBracknellBerkshire, RG12 1BZTelephone: 01344-469 100Fax: 01344-469 102E-mail: [email protected]://www.nielsenmedia.co.uk
Government Publications
HM Treasury1 Horse Guards RoadLondon, SW1A 2HQTelephone: 020-7270 4558Fax: 020-7270 4861http://www.hm-treasury.gov.uk•Forecasts for the UKEconomy-Treasury IndependentAverage National Statistics1 Myddelton StreetLondon, EC1R 1UWTelephone: 08456-013 034Fax: 01633-652 747E-mail: [email protected]://www.statistics.gov.uk•Annual Business Inquiry•Consumer Trends 2010•Economic & Labour Market Review,May 2011•Family Spending 2010•Focus on Consumer Price Indices,April 2011•Times Series Data-Monthly Digest ofStatistics, June 2011•UK Business: Activity, Size andLocation
UK TradeinfoHM Revenue & Customs3rd Floor CentralAlexander House21 Victoria AvenueSouthend on SeaEssex, SS99 1AATelephone: 01702-367 485E-mail: [email protected]://www.uktradeinfo.com
Toiletries Further Sources
© Key Note Ltd 2011 120

Other Sources
British Retail Consortium (BRC)21 Dartmouth StreetWestminsterLondon, SW1H 9BPTelephone: 020-7854 8900Fax: 020-7854 8901http://www.brc.org.uk CEW UK (Cosmetic Executive Women)Telephone: 020-7940 2900Fax: 020-7940 2901http://www.cewuk.co.uk Estee Lauder Inc767 Fifth AvenueNew York, NY 10153USTelephone: +1 212 572 4200http://www.esteelauder.com Industrieverband Koerperpflege undWaschmittel eV (IKW)Mainzer Landstraße 5560329 Frankfurt am MainGermanyTelephone: +49 69 25 56 13 23Fax: +49 69 23 76 31E-mail: [email protected]://www.ikw.org
Interbrand Corporation85 StrandLondon, WC2R 0DWTelephone: 020-7554 1000Fax: 020-7554 1001http://www.interbrand.com Kline & Company7200 The QuorumOxford Business Park NorthOxford, OX4 2JZTelephone: 01865-481 430Fax: 01865-481 482http://www.klinegroup.com
Toiletries Further Sources
© Key Note Ltd 2011 121

Key Note Sources
Key Note Ltd
5th FloorHarlequin House7 High StreetTeddingtonRichmond Upon Thames, TW11 8EETelephone: 0845-504 0452Fax: 0845-504 0453E-mail: [email protected]://www.keynote.co.uk
Key Note Market Reports• Bridalwear
• Childrenswear
• Clothing Manufacturing
• Hand Luggage & Leather Goods
• Household Detergents & Cleaners
• Jewellery & Watches
• Lingerie
• Sports Clothing & Footwear Invaluable aids to anyone needing togain a highly detailed understandingof a specific market for more informeddecision-making.
Key Note Market Reports Plus• Cosmetics & Fragrances
• Footwear Concentrating on more dynamicconsumer markets, these offer thesame incisive market intelligenceas Market Reports, but includeadditional chapters and primaryresearch data.
Key Note Market Reviews• Clothing & Footwear Industry Focusing on the bigger picture,Key Note Market Reviews aredesigned to inform you ofdevelopments and opportunitiesacross entire industry sectors.
Key Note Market Assessments• Men’s Toiletries & Fragrances
• Plus-Size Fashion
• Teenage Fashionwear Providing in-depth strategic analysisand including primary research, thesepremium reports examine the scope,dynamics and shape of key UK andEuropean markets, with a particularfocus on financial services, consumerand lifestyle sectors.
Key Note UKplc ReportUKplc is an indispensable guide formanagers and for those interestedin gaining a greater insight into thefinancial performance of an averagecompany operating in each of themain industries in the UK. Providingup-to-date information and analysis,the publication will allow the readerto gain a greater level of marketintelligence as well as a goodknowledge of the current stateof the UK industry.
Toiletries Further Sources
© Key Note Ltd 2011 122

Key Note BespokeData Service As well as choosing the companiesyou want to analyse, you can alsochoose exactly what performanceinformation you need on them —with our Bespoke Data Service.We will be able to provide you withinformation covering the companies,sectors, performance figures, ratiosand other data items specific toyour individual requirements alone.Even historical figures can beprovided. Contact us for more information:[email protected]
Key Note ResearchConsultancyWe can offer a full-servicebespoke solution for any researchrequirements not covered by thepublished report range. Ourcomprehensive market researchand information consultancy serviceis managed in house. Contact us for more information:[email protected]
Toiletries Further Sources
© Key Note Ltd 2011 123

Understanding TGI Data
TGI tables, produced by Kantar Media, are generally based on one of the following groups:
• Households — a private household consists of either one person living alone or a group ofpeople, usually, but not always, members of one family, who live together and whose foodand other household expenses are managed as one unit.
• Adults — any person aged 15 or over.
• Housewives — a member of a private household who is solely or mainly responsible for thehousehold duties.
Number, Profile, Penetration
Tables used in Key Note reports may give figures for the Number, Profile, and/or Penetration.These terms are explained in the following table.
Toiletries Understanding TGI Data
© Key Note Ltd 2011 124

TGI data used in Key Note reports are broken down by age, social grade and standard region.
Social Grade
This is normally based on the occupation of the Head of the Household, or if the Head of theHousehold is retired, their former occupation. If this information is not available, social gradeis based on environmental factors such as type of dwelling, amenities in the home, presence ofdomestic help, etc.
Social grade is assessed by the interviewer when collecting the information and is, therefore,based on information given personally and verbally by the respondent. Social grade is checkedby Kantar Media’s coding and editing office.
The following table broadly defines the six social grades used. The relationship between socialgrade and net income of the Head of the Household is a complex one and readers should notethat income is not determinant of social grade.
Social Grade Social StatusHead of Household’sOccupation
A Upper middle class Higher managerial,administrative or professional
B Middle class Intermediate managerial,administrative or professional
C1 Lower middle class Supervisory or clerical andjunior managerial,administrative or professional
C2 Skilled working class Skilled manual workers
D Working class Semi and unskilled workers
E Those at lowest levels ofsubsistence (no other earner)
State pensioners or widows
Standard Region
This is as defined by the Registrar-General.
Toiletries Understanding TGI Data
© Key Note Ltd 2011 125

Key Note Research
Key Note is a leading supplier of market information, publishing an extensive range ofconsumer, industrial, business-to-business and services titles. With over 30 years’ experience,Key Note represents clear, concise, quality market information.
For all reports, Key Note undertakes various types of research:
Online searching is carried out by product code or free search method, and covers the periodfrom the last edition of the report to the current day.
Trade sources, such as trade associations, trade journals and specific company contacts, areinvaluable to the Key Note research process.
Secondary data are provided by Kantar Media (TGI) and Nielsen Media Research for consumer/demographic information and advertising expenditure, respectively. In addition, various officialpublications published by National Statistics, etc. are used for essential background data andmarket trends.
Interviews are undertaken by Key Note for various reports, either face-to-face or by telephone.This provides qualitative data (‘industry comment’) to enhance the statistics in reports;questionnaires may also be used.
Field research is commissioned for various consumer reports and market reviews, and is carriedout by NEMS Market Research.
Key Note estimates are derived from statistical analysis and trade research carried out byexperienced research analysts. Up-to-date figures are inserted where possible, although therewill be some instances where a realistic estimate cannot be made or external sources requestthat we do not update their figures.
Key Note Editorial, 2011
Toiletries Key Note Research
© Key Note Ltd 2011 126

The Key Note Range of Reports
Key Note publishes over 180 titles each year, across both the Key Note and Market Assessmentproduct ranges. The total range covers consumer, lifestyle, financial services and industrialsectors.
Title Edition Published
Key Note Current Reports
AABC1 Consumer 6 2010
Access Control 11 2011
Accountancy 14 2010
Activity Holidays 4 2009
Advertising Agencies 5 2011
Airlines 22 2011
Airports Update 15 2011
Alternative Healthcare 6 2010
Arts & Media Sponsorship 4 2011
Automatic Vending 25 2011
Automotive Services 7 2010
Autoparts 19 2009
B
B2B Marketing 2 2011
Baby Products 5 2010
Baths & Sanitaryware 14 2009
Betting & Gaming 23 2010
Biscuits & Cakes 18 2011
Book Publishing 21 2011
Book Retailing on the Internet 4 2010
Bookselling 17 2010
Bread & Bakery Products 26 2011
Breakfast Cereals 15 2011
Breweries & the Beer Market 28 2011
Bricks & Tiles 16 2010
Bridalwear 5 2010
Builders’ Merchants 17 2010
Building Contracting 10 2009
Building Materials 14 2011
Bus & Coach Operators 10 2010
Business Postal Services 2 2008
Business Press 14 2009
Business Travel Market 5 2008
C
C2DE Consumer 6 2010
Canned Foods 18 2011
Carpets & Floorcoverings 16 2009
Catering Equipment 14 2011
Catering Market 21 2009
Title Edition Published
Chemical Industry 13 2010
Childcare 6 2011
Children’s Publishing 3 2010
Childrenswear 9 2011
Chilled Foods 16 2011
China & Earthenware Update 28 2011
Cigarettes & Tobacco 24 2010
Closed-Circuit Television 12 2010
Clothing & Footwear Industry 13 2010
Clothing Manufacturing 16 2011
Clothing Retailing 8 2011
Coffee & Sandwich Shops 6 2009
Commercial Dynamics inFinancial Services 4 2010
Commercial Insurance for SmallBusinesses 3 2009
Commercial Vehicles 15 2009
Computer Hardware 9 2011
Computer Services 9 2010
Computer Software 8 2011
Condiments and Sauces 5 2008
Confectionery 29 2011
Construction Industry 11 2009
Consumer Credit & Debt 6 2010
Consumer Magazines 17 2010
Contact Centres 8 2010
Contraception 4 2009
Contract Catering & FoodserviceManagement 21 2010
Contract Cleaning 21 2010
Cooking & Eating Habits 6 2009
Cooking Sauces & FoodSeasonings 4 2010
Corporate & PromotionalGiftware 4 2011
Cosmetic Surgery 9 2011
Cosmetics & Fragrances 24 2011
Courier & Express Services 16 2010
Cruise Market 2 2008
Customer Magazines & ContractPublishing 4 2009
Toiletries The Key Note Range of Reports
© Key Note Ltd 2011 127

Title Edition Published
Customer RelationshipManagement 4 2008
Customer Services in FinancialOrganisations 5 2010
D
Debt Management (Commercial& Consumer) 6 2010
Defence Equipment 11 2010
Diet Foods 4 2011
Digital Broadcasting 5 2011
Digital Communications 1 2009
Direct Insurance 6 2010
Direct Marketing 19 2009
Direct Mortgages 7 2010
Discount Retailing 7 2009
Disposable Paper Products 13 2009
Distribution Industry 10 2009
DIY & Home ImprovementsIndustry 11 2009
Domestic Heating 14 2009
Drinks Market 19 2009
E
E-Commerce: The InternetGrocery Market 6 2009
E-Commerce: The InternetLeisure & Entertainment Market 5 2008
Electrical Contracting 9 2009
Electrical Wholesale 5 2009
Electricity Industry 7 2011
Electronic Banking 4 2008
Energy Industry 8 2010
Equipment for the Disabled 5 2009
Estate Agents 18 2011
Estate Agents and Services 5 2010
Ethnic Foods 16 2011
European Long-Term Insurance 4 2008
European Renewable Energy 2 2008
European Short Breaks 2 2008
European Telecommunications 3 2010
European Tourist Attractions 3 2010
European Trends in FoodShoppin 4 2009
Exhibitions & Conferences 12 2011
Title Edition Published
F
Fast Food & Home DeliveryOutlets 4 2010
Film Market 2 2009
Financial Services Marketing toBCs 1 2009
Financial Services Marketing toDEs 2009
Financial Services Marketing toStart-Up Businesses and the Self-Employed 3 2010
Financial Services Marketing tothe Affluent 1 2009
Financial Services Organisationson the Internet 4 2009
Fish & Fish Products 14 2010
Food Industry 20 2010
Football Clubs & Finance 4 2009
Footwear 16 2009
Forecourt Retailing 8 2010
Franchising 12 2010
Freight Forwarding 17 2009
Frozen Foods 25 2011
Fruit & Vegetables 22 2011
Fruit Juices & Health Drinks 13 2010
Functional Foods 6 2010
Further & Higher Education 6 2009
G
Garden Equipment 13 2009
Gas Industry 6 2011
General Insurance 13 2010
Giftware 19 2010
Glassware 15 2009
Green and Ethical Consumer 4 2008
Greetings Cards Plus 26 2010
Grey Consumer 5 2009
H
Hand Luggage & Leather Goods 15 2010
Health Clubs & Leisure Centres 10 2010
Healthy Eating 6 2008
Holiday Purchasing Patterns 5 2009
Home Entertainment 3 2008
Home Furnishings 20 2011
Home Shopping 14 2011
Horticultural Retailing 17 2008
Hot Beverages 5 2009
Hotels 25 2011
Housebuilding 19 2011
Household Appliances (BrownGoods) 11 2008
Toiletries The Key Note Range of Reports
© Key Note Ltd 2011 128

Title Edition Published
Household Appliances (WhiteGoods) 16 2008
Household Detergents &Cleaners 2010
Household Furniture 19 2011
I
Ice Creams & Frozen DessertsUpdate 15 2011
Independent Financial Advisers 4 2008
Insurance Companies 12 2009
Insurance Industry 10 2009
Insurance Prospects 2 2008
Internet & Telephone Banking 1 2011
Internet Advertising 6 2009
IT Recruitment 5 2010
IT Security 10 2011
IT Training 13 2010
J
Jewellery & Watches 26 2011
K
Kitchenware 7 2009
L
Laboratory Equipment 10 2011
Leisure in the Home 3 2010
Leisure Outside the Home 3 2010
Lifestyle Magazines 5 2011
Lingerie 10 2011
Local Government Services 3 2010
Low-Fat & Reduced-Sugar Foods 5 2008
M
Marketing in the Digital Age 3 2009
Meat & Meat Products 21 2010
Medical Equipment 17 2009
Men and Women’s Buying Habits 5 2008
Men’s Toiletries & Fragrances 5 2008
Metal Recycling 6 2011
Milk & Dairy Products 24 2010
Mobile Marketing 1 2009
Mobile Phones 7 2010
Motor Finance 4 2011
Motor Industry 12 2008
Music Industry 2 2010
Title Edition Published
N
Newspapers 18 2010
Non-Food Sales in Supermarkets 5 2010
Non-Metal Recycling 3 2010
Nutraceuticals 3 2008
O
Office Equipment Industry 9 2010
Office Furniture 21 2008
Offshore Oil & Gas Industry 5 2009
Ophthalmic Goods & Services 17 2010
Opticians & Optical Goods 5 2010
Organic Food & Drink 7 2010
OTC Pharmaceuticals 15 2011
Over-50s Consumer 1 2009
Own Brands 13 2010
P
Packaging (Food & Drink) 6 2010
Packaging (Glass) 13 2008
Packaging (Paper & Board) 15 2010
Packaging (Plastics) 15 2010
Pensions 6 2009
Personal Lines Insurance 4 2010
Personal Loans 4 2008
Pet Market 4 2009
Pharmaceuticals Industry 6 2008
Planning for Retirement 1 2008
Plus-Size Fashion 3 2009
Poultry 4 2009
Premium Lagers, Beers & Ciders 9 2010
Printing 16 2011
Private Healthcare 22 2011
Protective Clothing & Equipment 7 2009
Public Houses Update 27 2011
Publishing Industry 13 2010
R
Rail Travel 8 2011
Ready Meals 12 2011
Recruitment Agencies(Permanent) 11 2011
Recruitment Agencies(Temporary & Contract) 11 2011
Renewable Energy 3 2009
Restaurants 25 2011
Retail Pharmacies 17 2011
Road Haulage 22 2009
Rural Economy 2 2009
Toiletries The Key Note Range of Reports
© Key Note Ltd 2011 129

Title Edition Published
S
Sauces & Spreads 12 2010
Savings & Investments 6 2010
Security Industry 13 2010
Shopfitting 14 2009
Shopping Centres 3 2008
Singles Market 4 2009
Slimming Market 4 2011
Small Businesses & Banks 2 2010
Small Domestic ElectricalAppliances 12 2010
Snack Foods 20 2010
Social Media Marketing 1 2010
Soft Drinks (Carbonated &Concentrated) 18 2011
Soup Market 3 2009
Spirits & Liqueurs 1 2010
Sports Clothing & Footwear 13 2011
Sports Equipment 16 2011
Sports Market 13 2010
Sports Sponsorship 8 2011
Stationery (Personal & Office) 25 2010
Supermarket Own Label 4 2009
Sweet & Salty Snacks 16 2010
T
Take-Home Trade 18 2011
Teenage & Pre-Teen Magazines 4 2009
Teenage Fashionwear 2 2008
Timber & Joinery 19 2008
Toiletries 24 2011
Toys & Games 24 2010
Training 19 2011
Travel & Tourism Market 17 2010
Travel Agents & Overseas TourOperators 23 2010
Trends in Food Shopping 5 2008
Tyre Industry 5 2010
U
UK Internet Market 1 2009
Utilities 4 2010
V
Vegetarian Foods 6 2009
Vehicle Breakdown Services 6 2010
Vehicle Security 9 2010
Video Gaming 1 2011
Vitamins, Minerals &Supplements 6 2009
Title Edition Published
W
Wallcoverings & Ceramic Tiles 18 2010
Waste Management 11 2011
Water Industry 6 2011
Windows & Doors 20 2010
Wine 21 2011
Working Women 5 2009
Key Note Archive Reports
A
Aerospace 12 2003
Agrochemicals & Fertilisers 3 2002
Air Freight 2 2005
Air Transport Logistics 1 2003
All Inclusive Holidays 1 2000
Animal Feedstuffs 11 2001
Audio Visual Retailing 1 2000
B
Baby Foods 3 2006
Baths and Showers 1 2000
Bearings 2 2007
Beds, Bedrooms and UpholsteredFurniture 2 2000
Bottled Water 2 2001
C
Cable & Satellite TV 10 2004
Call Centres 6 2006
Cash & Carry Outlets 16 2001
Charity Funding 3 2005
Cinemas & Theatres 9 2001
Clothing Retailers 1 2000
Commercial Radio 8 2004
Consumer Borrowing in Europe 1 2004
Consumer Internet Usage 4 2000
Contracted-Out Services 3 2007
Convenience Retailing 12 2002
Corporate Hospitality 6 2007
Cross-Border Shopping 1 2000
Customer Loyalty in the FinancialServices 1 2000
D
Dark Spirits & Liqueurs 3 2004
Defence Industry 7 2003
Design Consultancies 3 2000
Digital TV 2 2003
DINKY Market 3 2007
Document Imaging Systems 1 2007
Domestic Telecommunications 4 2006
Dry Cleaning & Laundry Services 5 2005
Toiletries The Key Note Range of Reports
© Key Note Ltd 2011 130

Title Edition Published
E
Electronic ComponentDistribution 12 2002
Electronic ComponentManufacturing 11 2002
Electronic Games 4 2003
Equipment Leasing 12 2003
E-Recruitment 3 2006
E-Shopping 1 2002
European Electricity Industry 3 2007
European Gas Industry 3 2007
European Oil & Gas Industry 2 2007
European Water Industry 3 2007
Extended Financial Families 1 2005
F
Factoring & Invoice Discounting 2 2003
Finance Houses 11 2000
Financial Services Marketing toABC1s 1 2000
Financial Services Marketing toABs 4 2006
Financial Services Marketing toC1C2DEs 1 2004
Financial Services Marketing toOver 60s 1 2004
Financial Services Marketing tothe Retired and Elderly 3 2007
Fire Protection Equipment 8 2006
Fitted Kitchens 11 2007
Free-To-Air TV 8 2004
G
Generation Y 1 2007
Global Positioning Systems 1 2002
Global Waste management 2 2070
H
Health Foods 22 2003
Healthcare Market 10 2005
Heating, Ventilating & AirConditioning 9 2002
I
In-Car Entertainment 1 2000
Individual Savings Accounts 2 2005
Industrial Fasteners 8 2001
Industrial Pumps 5 2000
Industrial Valves 8 2001
Internet Service Providers 2 2005
Internet Usage in Business 8 2005
Issues and Challenges in the UKLife Assurance Market 2 2002
Issues in Higher EducationFunding 2 2006
Title Edition Published
L
Leisure & Recreation Market 15 2005
Lighting Equipment 14 2002
M
Management Consultants 10 2003
Marketing to Children 4-11 3 2003
Mechanical Handling 9 2001
Medical & Health Insurance 3 2007
Millenium Youth 2 2002
Mobile Telecommunications 2 2007
N
Natural Products 2 2007
New Media Marketing 3 2002
O
Off-Trade Spirits 3 2004
Organic Baby & Toddler Care 1 2007
Over-40s Consumer 2 2005
P
Packaging (Metals & Aerosols) 12 2003
Paper & Board Manufacturers 14 2002
Passenger Travel in the UK 5 2007
Pay TV 2 2004
Pension Extenders 1 2002
Personal Banking 1 2003
Photocopiers & Fax Machines 14 2005
Plant Hire 13 2007
Plastic Cards in Europe 2 2005
Plastics Processing 10 2003
Power Tools 5 2007
Pre-School Childcare 1 2001
Private-Sector Opportunities inEducation 2 2001
Process Plant Industry 1 2000
Public Relations Industry 3 2007
Public Transport 1 2001
R
Rail Transport Logistics 1 2003
Railway Industry 2 2006
Recycling and the Environment 1 2000
Retail Credit 2 2000
Retail Development 1 2001
Road Transport Logistics 1 2003
S
Saving Trends in Eurozone 2 2002
Short Break Holidays 4 2001
Short Breaks 2 2004
Slimming Market 8 2000
Small Office Home OfficeConsumer 1 2001
Toiletries The Key Note Range of Reports
© Key Note Ltd 2011 131

Title Edition Published
Small Office Home OfficeProducts 1 2001
Sponsorship 2 2000
Supermarket Services 3 2007
Supermarkets & Superstores 20 2003
T
Teenage Magazines 3 2007
Telecommunications 21 2007
Teleworking 2 2003
The Computer Market 11 2004
The Film Industry 4 2002
The Fish Industry 1 2001
The Legal Services Market 1 2005
The Luggage Market 1 2000
Title Edition Published
The Newspaper Industry 3 2005
Tourist Attractions 5 2001
Trends in Leisure Activities 4 2007
Tweenagers 1 2001
V
Video & DVD Retail & Hire 8 2005
Videoconferencing 4 2007
W
Water Transport Logistics 1 2003
White Goods 2 2000
White Spirits 1 2005
Women over 45 3 2007
© Key Note Ltd 2011
All rights reserved.
No part of this publication may be reproduced, copied, stored in an electronic retrieval system or transmittedsave with written permission or in accordance with the provisions of the Copyright, Designs and Patents Act
1988.
Published by Key Note Ltd, 5th Floor, Harlequin House, 7 High Street, Teddington, Richmond Upon Thames,TW11 8EE. Telephone: 0845-504 0452
Stringent efforts have been made by Key Note to ensure accuracy. However, due principally to the fact thatdata cannot always be verified, it is possible that some errors or omissions may occur; Key Note cannot acceptresponsibility for such errors or omissions. Details supplied by Key Note should only be used as an aid, to assist
the making of business decisions, not as the sole basis for taking such decisions.
Under the new Privacy and Electronic Communications Regulations 2004, it is unlawful for a business to makean unsolicited sales & marketing call to a corporate subscriber if it is either registered with CTPS or has
requested NOT to receive such calls.
Key Note Ltd holds and regularly updates (every 28 days) its data in accordance with the regulations andensures that its data are compliant, as of the date created. It is the responsibility of the caller to ensure that
these data are up to date; Key Note Ltd does not hold itself liable for any subsequent legalities.
If you have any queries regarding the CTPS legislation you may find the following website useful:www.ico.gov.uk
Toiletries The Key Note Range of Reports
© Key Note Ltd 2011 132