tokyo university of agriculture and technology - …web.tuat.ac.jp/~m_nabe/watanabe's...
TRANSCRIPT

average daytime concentration of O3 increased from 1985 to 1999, at a rate of 0.33 nmol mol-1 year-1 (Ohara and Sakata, 2003). Since the ambient levels of O3 adversely affect the growth and physiological functions, such as photosynthesis, of forest tree species, this gas is considered to be one of the most important factors relating to forest decline and tree dieback in the USA, Europe and Japan (Sandermann et al., 1997; Bytnerowicz et al., 2004; ADORC, 2006). Because a forest plays important conservation roles for soil and head waters, decline in forests increases the risks of
Effects of Ozone on the Growth and Photosynthesis of Castanopsis sieboldii Seedlings Grown under Different Nitrogen Loads
Makoto WATANABE*†, Masahiro YAMAGUCHI*, Hideyuki MATSUMURA**, Yoshihisa KOHNO**, and Takeshi IZUTA***
*United Graduate School of Agricultural Science, Tokyo University of Agriculture and Technology, Fuchu, Tokyo, 183–8509, Japan
**Environmental Science Research Laboratory, Central Research Institute of Electric Power Industry, Abiko, Chiba, 270–1194, Japan
***Institute of Symbiotic Science and Technology, Tokyo University of Agriculture and Technology, Fuchu, Tokyo, 183–8509, Japan
AbstractTo obtain basic data for evaluating the critical levels of ozone (O3) for protecting Japanese evergreen
broad-leaved tree species, we investigated the effects of O3 on the growth and net photosynthesis of Castanopsis sieboldii seedlings grown under different nitrogen (N) loads. Two-year-old seedlings were grown in 12 experimental treatments, which were comprised of four gas treatments (charcoal-filtered air and three levels of O3 at 1.0, 1.5 and 2.0 times the ambient concentration) in combination with three N treatments (0, 20 and 50 kg ha-1 year-1) in open-top chambers during the two growing seasons. The net photosynthetic rate and the whole-plant dry mass of the seedlings were reduced by exposure to O3, while were increased by N load. No significant interaction between O3 and the N load for the whole-plant dry mass of the seedlings was observed. The N load increased the sensitivity of net photo-synthetic rate to O3 during the first and second growing seasons. However, the increase in the area of second-flush leaves during the second growing season compensated for the O3-induced reduction in the net photosynthetic rate of the seedlings grown under relatively high N load. We concluded that the N load to the soil at ≤50 kg ha-1 year-1 has no influence on the sensitivity of the whole-plant dry mass of C. sieboldii seedlings to O3. Based on the relationship between AOT40 (accumulated exposure over a threshold of 40 nmol mol-1) of O3 during the daylight hours from April to September and the whole-plant dry mass increment per one growing season, the critical level of O3 for C. sieboldii, which was expressed as AOT40 for one growing season and corresponding to a 5% reduction in the whole-plant dry mass increment, was evaluated as 22 µmol mol-1 h.
Keywords: Castanopsis sieboldii, Growth, Net photosynthesis, Nitrogen load, Ozone.
Received; March 21, 2008.
Accepted; May 20, 2008.† Present address: JSPS Research Fellowship, Research
Faculty of Agriculture, Hokkaido Uni-
versity, Sapporo 060-8589, Japan
1. Introduction
Ozone (O3) in the troposphere is recognized as a widespread phytotoxic air pollutant and its concentra-tions have been increasing in the Northern Hemisphere (Akimoto, 2003; ADORC, 2006). In Japan, the annual
143
Full Paper J. Agric. Meteorol. (農業気象) 64 (3): 143–155, 2008

soil erosion, water pollution and groundwater depletion (Inoue et al., 2003). Therefore, it is necessary to clarify the effects of O3 on growth and physiological functions, such as the photosynthesis of Japanese forest tree species.
The atmospheric deposition of nitrogen (N) to terrestrial ecosystems has been increasing with elevated anthropogenic emissions of N (Galloway et al., 2003; Ohara et al., 2007). In general, N is a limiting resource of tree growth in forest ecosystems, and atmospheric N deposition acts as a fertilizer (Bobbink et al., 2003; Magnani et al., 2007). However, increasing anthropogenic N deposition from the atmosphere induces over-nutrition in some terrestrial ecosystems (Schulze, 1989; Fenn et al., 1996; Baba and Okazaki, 1998). In Europe, the threshold value of N load for the occurrence of N-saturation and the critical N load for protecting forest ecosystems are considered to be approximately 10 kg ha-1 year-1 and 10 to 30 kg ha-1 year-1, respectively (Wright et al., 1995; WHO Regional Office for Europe, 2000). In the forested area of Japan, N input by wet deposition (bulk precipitation) and that by throughfall and stemflow ranged from 10 to 25 kg ha-1 year-1 (Baba and Okazaki, 1998; Baba et al., 2001; Okochi and Igawa, 2001) and from 10 to 40 kg ha-1 year-1 (Kobayashi et al., 1995; Baba and Okazaki, 1998; Baba et al., 2001), respectively. Furthermore, the phenomena of N-saturation in several Japanese forest ecosystems have been already reported (Baba and Okazaki, 1998; Okochi and Igawa, 2001). Generally, excessive N deposition from the atmosphere to forest ecosystems causes soil acidification, reduction in the growth of fine roots, degradation of nutrient status in leaves, decline of frost hardiness and tolerance of trees to parasite attacks, and changes the sensitivity of trees to other environmental stresses such as gaseous air pollutants (Nihlgård, 1985; Schulze, 1989; Izuta, 2001; Bobbink et al., 2003). Therefore, N deposition from the atmosphere may induce negative impacts on Japanese forest ecosystems.
In Europe, critical levels of gaseous air pollutants for vegetation have been developed (Wieser and Tausz, 2007). Current critical levels of gaseous air pollutants are defined as “concentration, cumulative exposure or cumulative stomatal flux of atmospheric pollutants above which direct adverse effects on sensitive vegeta-tion may occur according to present knowledge” (Mills, 2004). There is a possibility of Japanese forest tree species being affected, not only by O3, but also by
N deposition. To evaluate the critical levels of O3 for protecting Japanese forests tree species, therefore, it is necessary to clarify the effects of O3 on growth and physiological functions, such as photosynthesis under different N loads. Watanabe et al. (2006) and Häikiö et al. (2007) reported that increasing N availability can confer greater resistance to O3 in the seedlings of Larix kaempferi and Populus tremula×Populus tremuloides, respectively. However, opposite responses have been reported in the seedlings of Pinus sylvestris and Fagus crenata by Utriainen and Holopainen (2001a) and Yamaguchi et al. (2007a), respectively. Pell et al. (1995) reported that the greatest O3-induced reduction in the whole-plant growth of Populus tremuloides seedlings was observed under the condition of N supply that induced the highest tree growth rate. These results suggest that there are considerable differences in the combined effects of O3 and N load among tree species. However, no information is available on the combined effects of O3 and N deposition on growth and physiological functions such as the photosynthesis of Japanese evergreen broad-leaved tree species.
Castanopsis sieboldii is a representative evergreen broad-leaved tree species, which is distributed in a warm-temperate zone in Japan (Murata, 2004). This tree species is most widely distributed among evergreen broad-leaved tree species in Japan (Kohno, 2004). Therefore, to obtain basic data for evaluating the critical levels of O3 for protecting evergreen broad-leaved tree species, we investigated the effects of O3 on the growth and net photosynthesis of C. sieboldii seedlings grown under different N loads.
2. Materials and Methods
2.1 Plant materialsAndisol was collected from the A soil horizon of an
oak-pine forest in Maebashi, Gunma Prefecture, Japan. The soil was passed through a 2-mm sieve after the collection. The total N concentration and ratio of the carbon (C) concentration to the N concentration (C/N ratio) of the soil on the basis of the soil dry weight were 3.7 mg g-1 and 15.5 g g-1, respectively. On 8 March, 2004, two-year-old seedlings of C. sieboldii, which were obtained from a commercial nursery in Ibaraki Prefecture, Japan, were individually planted in 12 L pots filled with the soil. The average values ± standard deviation of the whole-plant dry mass, plant height and stem base diameter of the seedlings at the beginning of the experiment were 11.9±2.9 g,
J. Agric. Meteorol. (農業気象) 64 (3), 2008
144

53.5±1.8 cm and 4.43±0.1 mm, respectively. All the seedlings were grown until 15 April, 2004 under field conditions at an experimental field of the Akagi Testing Center of the Central Research Institute of Electric Power Industry (Gunma Prefecture, Japan, 36º28´ N, 139º11´ E, 540 m above sea level). On 16 April, 2004, the seedlings were transferred into 12 open-top chambers (OTC, 13.0 m2 of growth space and 2.4 m in height) located at the experimental field and were then grown for 564 days until 1 November, 2005. The average air temperature, average absolute air humidity and average photosynthetic photon flux density in the OTCs from April to October were 20.2℃, 15.4 g m-3 and 18.6 mol m-2 day-1 in 2004 and 19.7℃, 15.3 g m-3 and 17.0 mol m-2 day-1 in 2005, respectively.2.2 Ozone exposure and nitrogen treatment
The present experiment had a split-plot factorial design and employed the randomized block method. The whole-plot treatment was comprised of 4 levels of O3 with three chamber replications for a total of 12 OTCs to analyze the data, including the variance among the 12 OTCs. The sub-plot treatment consisted of 3 levels of N treatment in each OTC. Four seed-lings per OTC were assigned to each O3-N-chamber combination for a total of 144 seedlings. From 16 April, 2004 to 1 November, 2005, the seedlings were exposed to charcoal-filtered air or three levels of O3 at 1.0, 1.5 or 2.0 times the ambient concentration, these O3 treatments being designated as CF, O3×1.0, O3×1.5 and O3×2.0, respectively. Ozone was generated from oxygen-enriched dry air by an electrical discharge O3 generator (Oz-24-UA, Ebara Corporation, Japan) and injected into 9 OTCs for O3-exposure through a water trap to remove nitrogen by-products such as N2O5, produced by the O3 generator (Brown and Roberts, 1988). The concentrations of O3 in the 12 OTCs at 90 cm above the floor were continuously monitored at intervals of 12 minutes with a UV absorption O3 analyzer (ML9810, Monitor Labs, USA). The ambient concentration of O3, which is the standard concentration to regulate the O3 concentration in the OTCs, was also continuously monitored using the same system at the experimental field. The AOT40 (accumulated exposure over a threshold of 40 nmol mol-1, Kärenlampi and Skärby, 1996) of O3 during the growing season from April to September were calculated based on the monitoring data of O3 concentration in the OTCs. The AOT40 is the sum of the differences between the hourly mean O3 concentration and 40 nmol mol-1
for each hour when the O3 concentration exceeded 40 nmol mol-1. The AOT40 of O3 was accumulated for 24 hours and during the daylight hours with solar irradiation above 50 W m-2.
Ammonium nitrate (NH4NO3) was used for the N load to the soil in the present study. The current molar ratio of NH4
+ to NO3- in precipitation has
been reported to be 1.0 in Japan (Network Center for EANET, 2006). From April to September in 2004 and 2005, 500 ml of 1.17 or 2.92 mM of NH4NO3 solution was added to the surface of the potted soil at 1-month intervals. The total amounts of N added to the potted soil were 20 and 50 kg ha-1 year-1 on the basis of the potted soil surface area, these soil treatments being designated as N20 and N50, respectively. The control soil (N0) was supplemented with deionized water instead of NH4NO3 solution.2.3 Soil solution analyses
Soil solutions of the potted soil were collected using a soil moisture sampler (Eijklkamp Co., The Netherlands) in July and November 2004 and April, July and October 2005. The concentration of NH4
+ of the soil solution was determined by the method of indophenol blue colorimetry (Tsuzuki, 1999), while the concentration of NO3
– of the soil solution was determined with an ion chromatograph (IC7000, Yokogawa, Japan). The pH of the soil solution was determined with a pH meter (D-24, Horiba, Japan). Because neither a significant effect of the N load nor significant interaction between O3 and the N load for the pH and inorganic N concentrations of soil solution was observed, these data were pooled across
Table 1. The pH and concentrations of NO3- and
NH4+ of soil solution.
N0 N20 N50pHNO3
- (μM)NH4
+ (μM)
5.60.63.5
5.62.43.7
5.615.43.9
n.s.*
n.s.The N was supplied to the potted soil as NH4NO3 at 0 (N0), 20 (N20) and 50 kg ha-1 year-1 (N50).The values are the means of five analyses of soil solution collected in July and November 2004, and April, July and October 2005.Because no significant effect of O3 nor significant in-teraction between O3 and N load were detected, these data were pooled across the gas treatments.The significance of treatment effect is shown as an as-terisk (Friedman test: *p<0.05; n.s. not significant).
M. Watanabe et al. : Effects of Ozone and Nitrogen Load on Castanopsis sieboldii Seedlings
145

the gas treatments. Table 1 indicates the mean values of the pH and concentrations of NO3
- and NH4+ of
soil solutions collected from the potted soil in July and November 2004 and April, July and October 2005. There was no significant effect of the N load on the pH of the soil solutions. Although the N load significantly increased the concentration of NO3
- of the soil solutions, no significant effect of N load on the concentration of NH4
+ of the soil solutions was observed. This phenomenon may be due to the nitrification of the ammonium (Izuta, 2001; Bobbink et al., 2003). Similar results were reported by Nakaji et al. (2001) and Izuta et al. (2005).2.4 Measurements of plant growth
On 1 November, 2005, all the seedlings were harvested in order to determine the leaf area and dry mass of the plant organs. The seedlings were separated into leaves having emerged in 2004 ('04 leaves), leaves emerged in May 2005 ('05 first-flush leaves), leaves emerged from July to October 2005 ('05 second-flush leaves) and stems and roots. The plant organs were dried at 80℃ for 1 week and weighed.2.5 Measurements of the leaf gas exchange rates
The net photosynthetic rates of the leaves at 380 μmol mol-1 CO2 (A380) were measured with a portable infrared gas analyzer system (LI-6400, Li-Cor Inc., Lincoln, NE, USA) on 13 July and 27 October, 2004 and 7 June, 19 July and 13 October, 2005. In each measurement, the A380 of the 2 seedlings per treat-ment-chamber combination (6 seedlings per treatment) was determined. During the measurements of A380, the atmospheric CO2 concentration, air temperature and relative air humidity in the leaf cuvette were maintained at 380±5 μmol mol-1, 24.0±0.1℃ and 60±5%, respectively, while the photosynthetic photon flux density (PPFD) was maintained at approximately 1500 μmol m-2 s-1 at the leaf surface. The A380 was determined on the basis of the leaf area. Before the measurements of A380, the seedlings were taken from OTCs into an experimental room and placed under dark conditions for at least 12 h. After acclimation of the seedlings to the dark conditions, the A380 was measured in the room from 5:00 to 17:00 under the aforementioned conditions. The leaf clipped in the leaf chamber of LI-6400 was adapted to the conditions for approximately 30 min. to obtain a steady state. During the present study, we defined the steady state as a condition with stable A380 for 1–2 min. When the steady state was obtained, the A380 was measured.
2.6 Calculations of the ozone exposure-response relationships
The relationship between daylight AOT40 and the whole-plant dry mass increment were investigated. The mean daylight AOT40 of the two growing seasons from April to September in 2004 and 2005 was used in the calculation. The whole-plant dry mass increment was the difference between the whole-plant dry mass on 16 April, 2004 and that on 1 November, 2005. A regression line was obtained from the relationship between AOT40 of O3 and the whole-plant dry mass increment. The theoretical whole-plant dry mass increment at zero AOT40 was determined to be the y-axis intercept of the regression line. The theoretical whole-plant dry mass increment at zero AOT40 was used as a reference (100%) in order to calculate the relative whole-plant dry mass increment for each gas treatment. The calculated value is the relative whole-plant dry mass increment during the two growing seasons. The whole-plant dry mass increment per one growing season was calculated as the square root of the relative whole-plant dry mass increment during the two growing seasons. The aforementioned procedure was conducted separately for each N treatment. The regression line was obtained from the relationship between AOT40 of O3 and the relative whole-plant dry mass increment to calculate the slope and coefficient of determination values (R2).2.7 Statistical analyses
All statistical analyses were performed with the SPSS statistical package. The Friedman test was used to test the effects of N load on the chemical properties of the soil solution, while analysis of the variance (ANOVA) was used to test the effects of O3 and N load on the growth and leaf gas exchange parameters of the seedlings (Tjoelker and Luxomre, 1991). When a significant interaction of O3 and N load was detected, Tukey's HSD test was performed to identify significant differences among the 12 treatments.
3. Results
Table 2 shows the concentration and AOT40 of O3 during the growing seasons of C. sieboldii seedlings from April to September in 2004 and 2005. The values of O3 exposure indices in 2004 were similar to those in 2005 except for the maximum 1-h peak concentrations. The average 24-h concentration of O3 in the CF, O3×1.0, O3×1.5 and O3×2.0 treatments during the two growing seasons were 11.7, 42.6, 63.3
J. Agric. Meteorol. (農業気象) 64 (3), 2008
146
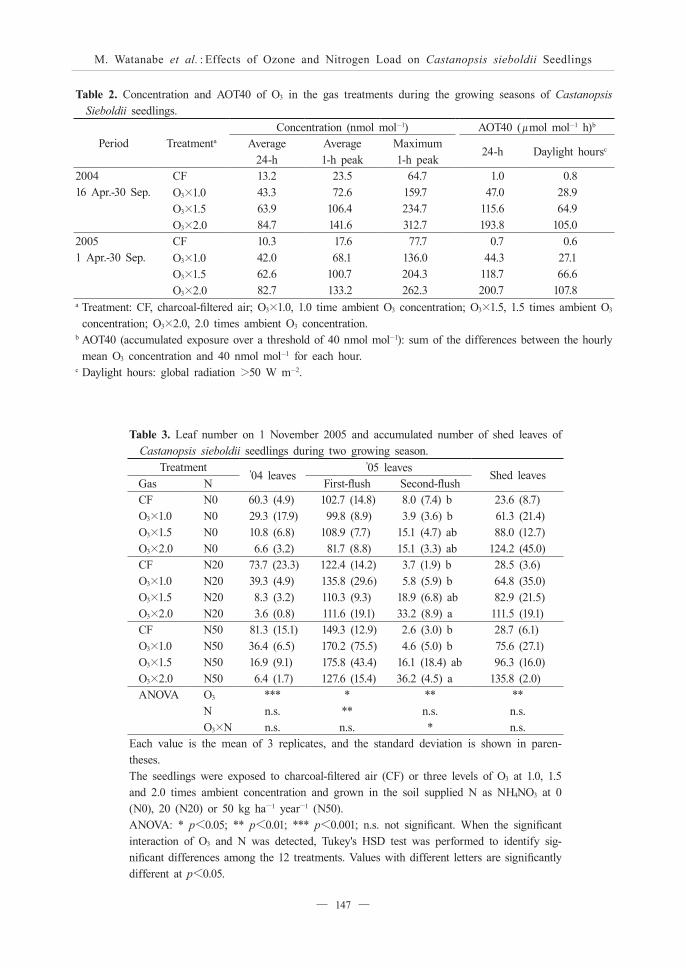
Table 3. Leaf number on 1 November 2005 and accumulated number of shed leaves of Castanopsis sieboldii seedlings during two growing season.
Treatment’04 leaves
’05 leavesShed leaves
Gas N First-flush Second-flushCFO3×1.0O3×1.5O3×2.0
N0N0N0N0
60.3 (4.9)29.3 (17.9)10.8 (6.8)6.6 (3.2)
102.7 (14.8)99.8 (8.9)
108.9 (7.7)81.7 (8.8)
8.0 (7.4) b3.9 (3.6) b
15.1 (4.7) ab15.1 (3.3) ab
23.6 (8.7)61.3 (21.4)88.0 (12.7)
124.2 (45.0)CFO3×1.0O3×1.5O3×2.0
N20N20N20N20
73.7 (23.3)39.3 (4.9)8.3 (3.2)3.6 (0.8)
122.4 (14.2)135.8 (29.6)110.3 (9.3)111.6 (19.1)
3.7 (1.9) b5.8 (5.9) b
18.9 (6.8) ab33.2 (8.9) a
28.5 (3.6)64.8 (35.0)82.9 (21.5)
111.5 (19.1)CFO3×1.0O3×1.5O3×2.0
N50N50N50N50
81.3 (15.1)36.4 (6.5)16.9 (9.1)6.4 (1.7)
149.3 (12.9)170.2 (75.5)175.8 (43.4)127.6 (15.4)
2.6 (3.0) b4.6 (5.0) b
16.1 (18.4) ab36.2 (4.5) a
28.7 (6.1)75.6 (27.1)96.3 (16.0)
135.8 (2.0)ANOVA O3
NO3×N
***n.s.n.s.
***n.s.
**n.s.*
**n.s.n.s.
Each value is the mean of 3 replicates, and the standard deviation is shown in paren-theses.The seedlings were exposed to charcoal-filtered air (CF) or three levels of O3 at 1.0, 1.5 and 2.0 times ambient concentration and grown in the soil supplied N as NH4NO3 at 0 (N0), 20 (N20) or 50 kg ha-1 year-1 (N50).ANOVA: * p<0.05; ** p<0.01; *** p<0.001; n.s. not significant. When the significant interaction of O3 and N was detected, Tukey's HSD test was performed to identify sig-nificant differences among the 12 treatments. Values with different letters are significantly different at p<0.05.
Table 2. Concentration and AOT40 of O3 in the gas treatments during the growing seasons of Castanopsis Sieboldii seedlings.
Period Treatmenta
Concentration (nmol mol-1) AOT40 (μmol mol-1 h)b
Average 24-h
Average 1-h peak
Maximum1-h peak
24-h Daylight hoursc
2004 CF 13.2 23.5 64.7 1.0 0.816 Apr.-30 Sep. O3×1.0
O3×1.5O3×2.0
43.363.984.7
72.6106.4141.6
159.7234.7312.7
47.0115.6193.8
28.964.9
105.02005 CF 10.3 17.6 77.7 0.7 0.61 Apr.-30 Sep. O3×1.0
O3×1.5O3×2.0
42.062.682.7
68.1100.7133.2
136.0204.3262.3
44.3118.7200.7
27.166.6
107.8a Treatment: CF, charcoal-filtered air; O3×1.0, 1.0 time ambient O3 concentration; O3×1.5, 1.5 times ambient O3
concentration; O3×2.0, 2.0 times ambient O3 concentration.b AOT40 (accumulated exposure over a threshold of 40 nmol mol-1): sum of the differences between the hourly
mean O3 concentration and 40 nmol mol-1 for each hour.c Daylight hours: global radiation >50 W m-2.
M. Watanabe et al. : Effects of Ozone and Nitrogen Load on Castanopsis sieboldii Seedlings
147

and 83.7 nmol mol-1, respectively.Table 3 indicates the leaf number per plant on 1
November, 2005 and the accumulated number of shed leaves of C. sieboldii seedlings during the two growing seasons. The exposure to O3 significantly reduced the numbers of the '04 leaves and '05 first-flush leaves, while conversely, the number of the '05 second-flush leaves was significantly increased by such exposure. The N load significantly increased the number of the '05 first-flush leaves. There was a significant interaction between O3 and the N load for the number of the '05 second-flush leaves. The exposure to O3 at 2.0 times the ambient concentration significantly increased the number of the '05 second-flush leaves in the N20 and N50 treatments, but not in the N0 treatment. The exposure to O3 significantly increased the accumulated number of shed leaves. Neither a significant effect of the N load nor any significant interaction between O3 and the N load for the accumulated number of shed leaves was observed.
Table 4 shows the leaf area and dry mass of plant organs of C. sieboldii seedlings at the end of the second growing season (1 November, 2005). The exposure to O3 significantly reduced the area of the '04 leaves, dry mass of the '04 leaves, the stem and roots, and the whole-plant dry mass. In contrast, the area and dry mass of the '05 second-flush leaves were significantly increased by the exposure to O3. The N load significantly increased the areas of the '05 first-flush leaves and '05 second-flush leaves, the dry mass of leaf, stem and roots, and the whole-plant dry mass. Significant interactions between O3 and the N load for the area of the '05 second-flush leaves and dry mass of the '05 second-flush leaves and roots were found. The exposure to O3 at 2.0 times the ambient concentration significantly increased the area and dry mass of the '05 second-flush leaves of the seedlings grown in the N20 and N50 treatments, but not in the N0 treatment. The exposure to O3 at 2.0 times the ambient concentration significantly reduced the root dry mass of the seedlings grown in the N0 treatment. In the N20 and N50 treatments, the root dry mass was significantly reduced, not only by the exposure to O3 at 2.0 times the ambient concentration, but also by the exposure to O3 at 1.0 and 1.5 times the ambient concentration in the N20 treatment and O3 at 1.5 times the ambient concentration in the N50 treatment.
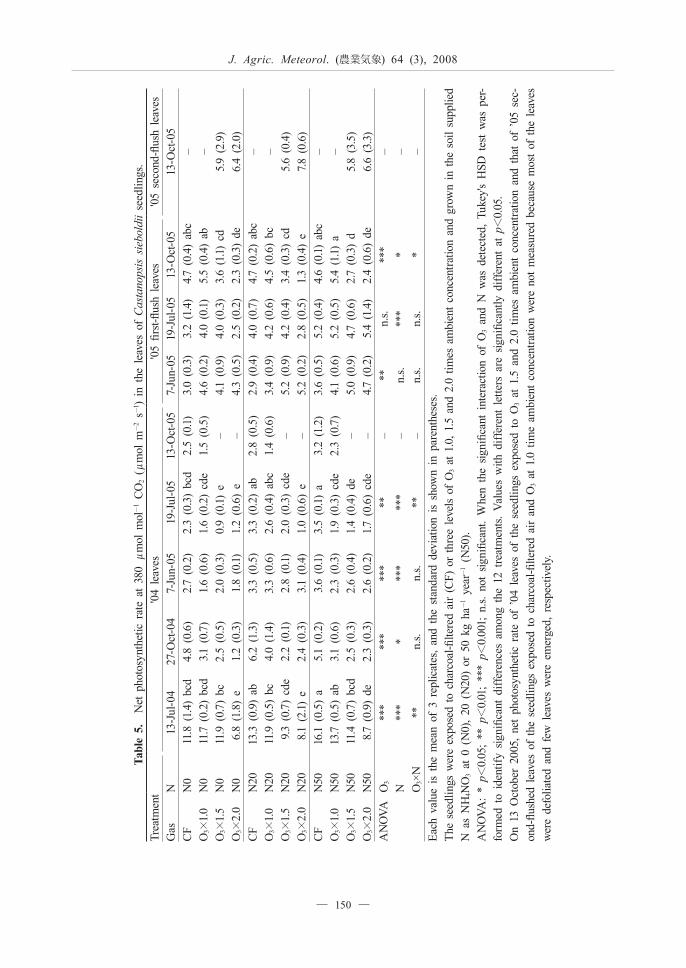
Table 5 indicates the net photosynthetic rate at 380 μmol mol-1 CO2 (A380) of C. sieboldii seedlings. The
exposure to O3 significantly reduced the A380 of the '04 leaves during the first and second growing seasons and that of the '05 first-flush leaves on 13 October, 2005. The A380 of the '05 first-flush leaves on 7 June 2005 was significantly increased by the exposure to O3. The N load significantly increased the A380 of the '04 leaves during the first and second growing seasons, and that of the '05 first-flush leaves on 19 July and 13 October, 2005. There were significant interactions between O3 and the N load for the A380 of the '04 leaves on 13 July, 2004 and 19 July, 2005 and that of the '05 first-flush leaves on 13 October, 2005. The O3 concentration that induced a significant reduction in the A380 decreased with an increase in the amount of N added to the potted soil.
4. Discussion
4.1 Growth and photosynthetic responses to ozone and nitrogen loads
Although the exposure to O3 significantly reduced the net photosynthetic rate of the '04 leaves of C. sieboldii seedlings during the first and second growing seasons, net photosynthetic rate of the '05 first-flush leaves in June of the second growing season was significantly increased by the exposure to O3 (Table 5). Greitner et al. (1994) reported that exposure to O3 increased the net photosynthetic rate of younger leaves, but reduced that of older leaves in Populus tremuloides seedlings. This phenomenon is considered to be a compensatory response to the negative effects of O3 on older leaves (Greitner et al., 1994; Bielenberg et al., 2001). In the case of C. sieboldii seedlings, which is an evergreen tree species, the O3-induced increase in the net photosynthetic rate of the '05 first-flush leaves compensated for the O3-induced reduction in that of the '04 leaves. Therefore, we considered this response to be one of the “carry-over effects of O3” (Oksanen and Saleem, 1999; Yonekura et al., 2004). An ozone-induced increase in the number and area of the '05 second-flush leaves were observed during the second growing season (Tables 3 and 4). These results indicate that compensatory responses of C. sieboldii seedlings were apparent, not only for physiological functions, such as the net photosynthetic rate, but also for morphological characteristics. However, these compensatory responses were insufficient to prevent O3-induced negative impacts on the whole-plant dry matter production of the seedlings (Table 4).
The nitrogen load increased the growth and net
J. Agric. Meteorol. (農業気象) 64 (3), 2008
148

Tab
le 4
. L
eaf
area
and
dry
mas
s of
pla
nt o
rgan
s of
Cas
tano
psis
sie
bold
ii se
edlin
gs o
n 1
Nov
embe
r 20
05.
Trea
tmen
tL
eaf
area
(cm
2 )D
ry m
ass
(g)
Gas
N’0
4 le
aves
’05
leav
es’0
4 le
aves
’05
leav
esSt
emR
oot
Who
le-p
lant
Firs
t-flus
hSe
cond
-flus
hFi
rst-fl
ush
Seco
nd-fl
ush
CF
O3×
1.0
O3×
1.5
O3×
2.0
N0
N0
N0
N0
653
(87)
262
(121
)11
5 (9
3) 8
4 (5
3)
562
(42
) 6
00 (
15)
595
(11
3) 5
53 (
75)
31
(27)
c 1
3 (1
1) c
138
(75)
bc
160
(45)
abc
9.5
(1.6
)3.
9 (1
.6)
1.5
(1.2
)1.
1 (0
.7)
8.2
(0.5
)8.
5 (0
.4)
8.4
(1.3
)7.
3 (1
.3)
0.4
(0.3
) b
0.2
(0.1
) b
1.6
(0.8
) ab
2.0
(0.7
) ab
20.2
(3.
4)14
.3 (
1.2)
15.5
(0.
7)13
.1 (
0.6)
26.3
(1.
2) c
d20
.5 (
1.2)
de
20.5
(2.
2) d
e14
.9 (
2.1)
e
64.6
(4.
5)47
.3 (
1.7)
47.4
(3.
4)38
.4 (
1.7)
CF
O3×
1.0
O3×
1.5
O3×
2.0
N20
N20
N20
N20
697
(238
)46
7 (7
3) 8
4 (4
2) 4
1 (1
4)
674
(70
) 6
94 (
82)
704
(69
) 6
98 (
21)
11
(6)
c 6
4 (9
2) c
144
(93)
abc
365
(15)
a
12.0
(3.
7)6.
6 (0
.7)
1.2
(0.6
)0.
5 (0
.2)
10.1
(1.
1)10
.0 (
1.3)
10.0
(1.
3)9.
5 (0
.6)
0.2
(0.1
) b
0.8
(1.1
) b
1.7
(1.0
) ab
4.0
(0.2
) a
22.7
(2.
3)19
.8 (
1.0)
17.7
(2.
3)16
.5 (
0.3)
35.6
(7.
1) a
b26
.9 (
2.6)
cd
22.3
(1.
2) c
de19
.1 (
1.3)
de
80.6
(14
.0)
64.2
(3.
1)52
.8 (
4.1)
49.6
(1.
6)C
FO
3×1.
0O
3×1.
5O
3×2.
0
N50
N50
N50
N50
961
(216
)39
2 (4
3)19
1 (1
12)
61
(20)
898
(15
5) 9
87 (
269)
1025
(26
1) 8
79 (
21)
9
(11)
c 3
5 (5
5) c
116
(109
) bc
323
(61)
ab
14.4
(2.
4)5.
9 (0
.4)
2.9
(1.9
)1.
0 (0
.2)
14.0
(2.
1)15
.8 (
3.0)
16.1
(2.
9)12
.9 (
1.2)
0.1
(0.1
) b
0.4
(0.6
) b
1.9
(2.1
) ab
3.8
(0.9
) a
26.3
(3.
6)26
.7 (
5.5)
24.6
(2.
3)23
.6 (
4.0)
41.0
(3.
1) a
43.1
(3.
6) a
29.8
(1.
8) b
c25
.0 (
1.7)
cd
95.7
(6.
2)91
.8 (
11.1
)75
.2 (
4.8)
66.2
(5.
9)A
NO
VA
O3
N O3×
N
***
n.s.
n.s.
n.s.
***
n.s.
** ***
***
*** * n.s.
n.s.
***
n.s.
** * *
** ***
n.s.
** ***
**
***
***
n.s.
Eac
h va
lue
is t
he m
ean
of 3
rep
licat
es,
and
the
stan
dard
dev
iatio
n is
sho
wn
in p
aren
thes
es.
The
see
dlin
gs w
ere
expo
sed
to c
harc
oal-fi
ltere
d ai
r (C
F) o
r th
ree
leve
ls o
f O
3 at
1.0
, 1.
5 an
d 2.
0 tim
es a
mbi
ent
conc
entr
atio
n an
d gr
own
in t
he s
oil
supp
lied
N a
s N
H4N
O3
at 0
(N
0),
20 (
N20
) or
50
kg h
a-1
year-
1 (N
50).
AN
OV
A:
* p<
0.05
; **
p<
0.01
; **
* p<
0.00
1; n
.s.
not
sign
ifica
nt.
Whe
n th
e si
gnifi
cant
int
erac
tion
of O
3 an
d N
was
det
ecte
d, T
ukey
's H
SD t
est
was
per
form
ed t
o id
entif
y si
gnifi
cant
dif
fere
nces
am
ong
the
12 t
reat
men
ts.
Val
ues
with
dif
fere
nt l
ette
rs a
re s
igni
fican
tly d
iffe
rent
at
p<0.
05.
M. Watanabe et al. : Effects of Ozone and Nitrogen Load on Castanopsis sieboldii Seedlings
149
Tab
le 5
. N
et p
hoto
synt
hetic
rat
e at
380
μm
ol m
ol-
1 C
O2
(μm
ol m
-2
s-1 )
in t
he l
eave
s of
Cas
tano
psis
sie
bold
ii se
edlin
gs.
Trea
tmen
t'0
4 le
aves
'05
first
-flus
h le
aves
'05
seco
nd-fl
ush
leav
esG
asN
13-J
ul-0
427
-Oct
-04
7-Ju
n-05
19-J
ul-0
513
-Oct
-05
7-Ju
n-05
19-J
ul-0
513
-Oct
-05
13-O
ct-0
5C
FO
3×1.
0O
3×1.
5O
3×2.
0
N0
N0
N0
N0
11.8
(1.
4) b
cd11
.7 (
0.2)
bcd
11.9
(0.
7) b
c6.
8 (1
.8)
e
4.8
(0.6
)3.
1 (0
.7)
2.5
(0.5
)1.
2 (0
.3)
2.7
(0.2
)1.
6 (0
.6)
2.0
(0.3
)1.
8 (0
.1)
2.3
(0.3
) bc
d1.
6 (0
.2)
cde
0.9
(0.1
) e
1.2
(0.6
) e
2.5
(0.1
)1.
5 (0
.5)
– –
3.0
(0.3
)4.
6 (0
.2)
4.1
(0.9
)4.
3 (0
.5)
3.2
(1.4
)4.
0 (0
.1)
4.0
(0.3
)2.
5 (0
.2)
4.7
(0.4
) ab
c5.
5 (0
.4)
ab3.
6 (1
.1)
cd2.
3 (0
.3)
de
– –5.
9 (2
.9)
6.4
(2.0
)C
FO
3×1.
0O
3×1.
5O
3×2.
0
N20
N20
N20
N20
13.3
(0.
9) a
b11
.9 (
0.5)
bc
9.3
(0.7
) cd
e8.
1 (2
.1)
e
6.2
(1.3
)4.
0 (1
.4)
2.2
(0.1
)2.
4 (0
.3)
3.3
(0.5
)3.
3 (0
.6)
2.8
(0.1
)3.
1 (0
.4)
3.3
(0.2
) ab
2.6
(0.4
) ab
c2.
0 (0
.3)
cde
1.0
(0.6
) e
2.8
(0.5
)1.
4 (0
.6)
– –
2.9
(0.4
)3.
4 (0
.9)
5.2
(0.9
)5.
2 (0
.2)
4.0
(0.7
)4.
2 (0
.6)
4.2
(0.4
)2.
8 (0
.5)
4.7
(0.2
) ab
c4.
5 (0
.6)
bc3.
4 (0
.3)
cd1.
3 (0
.4)
e
– –5.
6 (0
.4)
7.8
(0.6
)C
FO
3×1.
0O
3×1.
5O
3×2.
0
N50
N50
N50
N50
16.1
(0.
5) a
13.7
(0.
5) a
b11
.4 (
0.7)
bcd
8.7
(0.9
) de
5.1
(0.2
)3.
1 (0
.6)
2.5
(0.3
)2.
3 (0
.3)
3.6
(0.1
)2.
3 (0
.3)
2.6
(0.4
)2.
6 (0
.2)
3.5
(0.1
) a
1.9
(0.3
) cd
e1.
4 (0
.4)
de1.
7 (0
.6)
cde
3.2
(1.2
)2.
3 (0
.7)
– –
3.6
(0.5
)4.
1 (0
.6)
5.0
(0.9
)4.
7 (0
.2)
5.2
(0.4
)5.
2 (0
.5)
4.7
(0.6
)5.
4 (1
.4)
4.6
(0.1
) ab
c5.
4 (1
.1)
a2.
7 (0
.3)
d2.
4 (0
.6)
de
– –5.
8 (3
.5)
6.6
(3.3
)A
NO
VA
O3
N O3×
N
***
***
**
*** * n.s.
***
***
n.s.
** ***
**
– – –
** n.s.
n.s.
n.s.
***
n.s.
*** * *
– – –E
ach
valu
e is
the
mea
n of
3 r
eplic
ates
, an
d th
e st
anda
rd d
evia
tion
is s
how
n in
par
enth
eses
.T
he s
eedl
ings
wer
e ex
pose
d to
cha
rcoa
l-filte
red
air
(CF)
or
thre
e le
vels
of
O3
at 1
.0,
1.5
and
2.0
times
am
bien
t co
ncen
trat
ion
and
grow
n in
the
soi
l su
pplie
d N
as
NH
4NO
3 at
0 (
N0)
, 20
(N
20)
or 5
0 kg
ha-
1 ye
ar-
1 (N
50).
AN
OV
A:
* p<
0.05
; **
p<
0.01
; **
* p<
0.00
1; n
.s.
not
sign
ifica
nt.
Whe
n th
e si
gnifi
cant
int
erac
tion
of O
3 an
d N
was
det
ecte
d, T
ukey
's H
SD t
est
was
per
-fo
rmed
to
iden
tify
sign
ifica
nt d
iffe
renc
es a
mon
g th
e 12
tre
atm
ents
. V
alue
s w
ith d
iffe
rent
let
ters
are
sig
nific
antly
dif
fere
nt a
t p<
0.05
.O
n 13
Oct
ober
200
5, n
et p
hoto
synt
hetic
rat
e of
’04
lea
ves
of t
he s
eedl
ings
exp
osed
to
O3
at 1
.5 a
nd 2
.0 t
imes
am
bien
t co
ncen
trat
ion
and
that
of
’05
sec-
ond-
flush
ed l
eave
s of
the
see
dlin
gs e
xpos
ed t
o ch
arco
al-fi
ltere
d ai
r an
d O
3 at
1.0
tim
e am
bien
t co
ncen
trat
ion
wer
e no
t m
easu
red
beca
use
mos
t of
the
lea
ves
wer
e de
folia
ted
and
few
lea
ves
wer
e em
erge
d, r
espe
ctiv
ely.
J. Agric. Meteorol. (農業気象) 64 (3), 2008
150

photosynthetic rate of C. sieboldii seedlings during the first and second growing seasons (Tables 4 and 5). Furthermore, the N load did not significantly affect the pH and concentrations of the aluminum and manganese of soil solution (data not shown). In the present study, therefore, N acted as a fertilizer for the growth and net photosynthesis of the C. sieboldii seedlings.
The N load increased the sensitivity to O3 of the net photosynthetic rate of C. sieboldii seedlings during the first and second growing seasons (Table 5). On the other hand, the exposure to O3 significantly increased the '05 second-flush leaves of the seedlings grown under relatively high N load, but not under relatively low N load (Tables 3 and 4). These results suggest that the increase in the area of the '05 second-flush leaves compensated for the O3-induced reduction in the net photosynthetic rate of the seedlings grown under a relatively high N load. The degree of O3-induced reduction in the root dry mass of the seedlings was greater under a relatively high N load than under a relatively low one (Table 4). However, no N load-induced increase in the sensitivity of the whole-plant dry mass of the seedlings to O3 was observed (Table 4). Furthermore, no significant interaction between O3 and N load for the ratio of shoot dry mass to root dry mass of the seedlings was observed (data not shown). Therefore, we conclude that the N load to the soil at ≤50 kg ha-1 year-1 does not influence the sensitivity of the whole-plant dry mass of C. sieboldii seedlings to O3. This result is in agreement with the results obtained from seedlings of Picea abies, Pinus densiflora, Cryptomeria japonica and Quercus serrata (Utriainen and Holopainen, 2001b; Watanabe et al., 2006; Watanabe et al. 2007). We previously reported that the effects of N load on the sensitivity to O3 of the whole-plant dry mass of Q. serrata and F. crenata seedlings was closely related to those on the sensitivity to O3 of the net photosynthetic rate during the growing season, i.e. when the sensitivity of the net photosynthetic rate to O3 was increased by the N load, the negative impact of O3 on the whole-plant dry mass was increased (Watanabe et al,. 2007; Yamaguchi et al., 2007a; Yamaguchi et al., 2007b). In C. sieboldii seedlings, however, the sensitivity of the whole-plant dry mass to O3 did not necessarily correspond to that of the net photosynthetic rate to O3 (Tables 4 and 5). In C. sieboldii seedlings, the compensatory response of the second-flush leaves to O3 was observed under a relatively high N load (Tables 3 and 4). Therefore,
we must take into account not only the physiological functions, such as photosynthesis, but also phenological characteristics, in order to evaluate the effects of N load on the sensitivity to O3 of the whole-plant growth of Japanese forest tree species.4.2 Evaluation of critical levels of ozone for C. sieboldii
The current critical level of O3 for forest trees in Europe is expressed as AOT40 during the daylight hours for a one growing season from April to Sep-tember (Mills, 2004). Therefore, we investigate the relationship between daylight AOT40 of O3 and relative whole-plant dry mass increment per one growing season of C. sieboldii seedlings. Because no significant interaction between O3 and the N load for the whole-plant dry mass was detected at the end of the second growing season, a single regression line across three N treatments was obtained (Fig. 1). In Europe, a critical level of O3 for sensitive forest tree species. such as European beech and birch, was evaluated as 5 μmol mol-1 h of daylight AOT40, which is associated with a 5% reduction in the growth of the seedlings (Mills, 2004). Therefore, we evaluate the AOT40 of O3 that induced a 5% reduction in the whole-plant dry mass increment as a critical level of O3. Based on the results obtained from the present study, the critical level of O3
Fig. 1. The relationship between AOT40 (accumu-lated exposure over a threshold of 40 nmol mol-1) of O3 during the daylight hours with a solar irradiation above 50 W m-2 and relative whole-plant dry mass increment per one growing season of Castanopsis sieboldii seedlings (Relative WDMinc). The AOT40 is the means of two growing seasons from April to September in 2004 and 2005.
E
E E
E
C
C
C
C
GG
G
G
60
70
80
90
100
110
0 20 40 60 80 100 120AOT40 of O3 (µmol mol-1 h)
Rel
ativ
e W
DM
inc
(%)
slope: -0.231R2=0.858***
� N0� N20� N50
M. Watanabe et al. : Effects of Ozone and Nitrogen Load on Castanopsis sieboldii Seedlings
151

for C. sieboldii was estimated to be 21.7 μmol mol-1 h. This value was relatively low as compared with that for the other representative Japanese forest tree species, as shown in Fig. 2 (Watanabe et al., 2006, Watanabe et al., 2007, Yamaguchi et al., 2007a).
The main habitat of C. sieboldii in Japan is the Kyushu region, in the southern part of Japan. Therefore, we estimated the AOT40 of photochemical oxidant in the Kyushu region during daytime hours (6:00-18:00) from April to September, based on the monitoring data of photochemical oxidant and using the method of Ishii et al. (2007). When photochemical oxidant is regarded as O3, the yearly average AOT40 of O3, detected at 8% of the monitoring stations in the Kyushu region during the period 2000-2004, exceeded the estimated critical level of O3 for C. sieboldii (21.7 μmol mol-1 h). Furthermore, the yearly average AOT40 of O3 in this area increased from 1985 to 2004, representing an increase rate of 0.41 μmol mol-1 h. Based on the
increase rate of AOT40 of O3 in this area, an AOT40 at approximately 39% of the monitoring stations in the Kyushu region will exceed the estimated critical level of O3 for C. sieboldii in 2030.
Because there is a possibility that the sensitivity of mature trees to O3 is different from that of the seedlings to O3, we cannot directly apply the results obtained from seedlings to phenomena of mature tree grown in actual field (Nunn et al., 2005). However, our results obtained from the present study indicate the possibility that current ambient levels of O3 negatively affect the growth of C. sieboldii in Japan, and the adverse effects of O3 on the tree species will become serious in the near future.
Acknowledgments
This study was financially supported by the Ministry of the Environment, Japan through the program of Global Environmental Research Fund (C-03-07, 2003-2005). The authors are greatly indebted to M. Iwasaki, J. Naba, N. Matsuo, C. Tabe, R. Yamashita, Y. Shinozaki and M. Tanaka (Tokyo University of Agriculture and Technology), and staff of CERES Inc. for their technical support and discussion. We use the data file of photochemical oxidant from “Numerical database for environment” of National Institute for Environmental Studies.
References
ADORC (Acid deposition and oxidant research center) (ed), 2006: Tropospheric ozone a growing threat. ADORC, Niigata, 26 pp.
Akimoto, H., 2003: Global air quality and pollution. Science, 302, 1716–1719.
Baba, M., and Okazaki, M., 1998: Acidification in nitrogen–saturated forested catchment. Soil Sci. Plant Nutr., 44, 513–525.
Baba, M., Suzuki, Y., Sasaki, H., Matano, K., Sugi-ura, T., and Kobayashi, H., 2001: Nitrogen retention in Japanese cedar stands in northern Honshu, with high nitrogen deposition. Water Air Soil Pollut., 130, 1103–1108.
Bielenberg, D. G., Lynch, J. P., and Pell, E. J., 2001: A decline in nitrogen availability affects plant responses to ozone. New Phytol., 151, 413–425.
Bobbink, R., Ashmore, M., Braun, S., Flückiger, W., and Van den Wyngaert, I. J. J., 2003: Empirical nitrogen critical loads for natural and semi–natural ecosystems: 2002 update. In Empirical Critical
Fig. 2. Critical levels of O3 for Castanopsis sieboldii, Fagus crenata, Larix kaempferi, Pinus densiflora, Quercus serrata and Cryptomeria japonica. The values are recalculated from the results of stud-ies conducted in parallel with the present study (Watanabe et al., 2006; Watanabe et al., 2007; Yamaguchi et al., 2007a). Because there was no significant interaction between O3 and N load for the whole-plant dry mass of C. sieboldii, P. densiflora, Q. serrata and C. japonica seedlings at the end of the second growing season, critical level was calculated across the three N treatments.
Cri
tical
leve
l of
O3
(�m
olm
ol-1
h)
F. c
rena
ta(N
50)
C. s
iebo
ldii
L. k
aem
pfer
i(N
0)
F. c
rena
ta(N
20)
L. k
aem
pfer
i(N
20)
P. d
ensi
flora
F. c
rena
ta(N
0)
L. k
aem
pfer
i(N
50)
Q. s
erra
ta
C. j
apon
ica
120
100
80
60
40
20
0
J. Agric. Meteorol. (農業気象) 64 (3), 2008
152
Loads for Nitrogen, Environmental Documentation No. 164 (ed. by Achermann, B. and Bobbink, R.). Swiss Agency for the Environment, Forests and Landscape, Berne, Switzerland, pp. 43–170.
Brown, K. A., and Roberts, T. M., 1988: Effects of ozone on foliar leaching in Norway Spruce (Picea Abies L. Karst): Confounding factors due to NOx production during ozone generation. Environ. Pol-lut., 55, 55–73.
Bytnerowicz, A., Godzik, B., Grodziñska, K., Frączek, W., Musselman, R., Manning, W., Badea, O., Popescu, F. and Fleischer, P., 2004: Ambient ozone in forests of the Central and Eastern European mountains. Environ. Pollut., 130, 5–16.
Fenn, M. E., Poth, M. A., and Johnson, D. W., 1996: Evidence for nitrogen saturation in the San Ber-nardino Mountains in southern California. For. Ecol. Manage., 82, 211–230.
Galloway, J. N., Aber, J. D., Erisman, J. W., Seitzinger, S. P., Howarth, R. W., Cowling, E. B., and Cosby, B. J., 2003: The nitrogen cascade. Bioscience, 53, 341–356.
Greitner, C. S., Pell, E. J., and Winner, W. E., 1994: Analysis of aspen foliage exposed to multiple stresses: ozone, nitrogen deficiency and drought. New Phytol., 127, 579–589.
Häikiö, E., Freiwald, V., Silfver, T., Beuker, E., Holopainen, T., and Oksanen, E., 2007: Impacts of elevated ozone and nitrogen on growth and pho-tosynthesis of European aspen (Populus tremula) and hybrid aspen (P. tremula×Populus tremuloides) clones. Can. J. For. Res., 37, 2326–2336.
Inoue, M., Sakurai, S., Suzuki, K., Tomita, B., and Nakashizuka, T. (eds), 2003: Encyclopedia of forest. Asakura Publishing Co., Ltd., Tokyo, 739 pp.
Ishii, T., Matsumura, H., Hayami, H., and Kohno, Y., 2007: Relationship between oxidant-based AOT40 and forest environmental conditions of damaged Japanese cedars in the Kanto plains. J. Glob. Envi-ron. Eng., 12, 51–62.
Izuta, T., 2001: Nitrogen saturation in forest ecosystem and its effects on trees (in Japanese). J. Jpn. Soc. Atmos. Environ., 36, A1–A13.
Izuta, T., Tominaga, K., Watanabe, M., Matsumura, H., and Kohno, Y., 2005: Effects of nitrogen load on growth and leaf nutrient status of Japanese ever-green broad–leaved tree species. J. Agric. Meteorol., 60, 1125–1128.
Kärenlampi, L., and Skärby, L. (eds), 1996: Critical
levels for ozone in Europe: testing and finalizing the concepts, UN-ECE workshop reports. Department of Ecology and Environmental Science, University of Kuopio, Finland, 363 pp.
Kobayashi, T., Nakagawa, Y., Tamaki, M., Hiraki, T., and Shoga, M., 1995: Evaluation of acidic deposition onto the forest canopies. Study on the method of estimating dry deposition and leaching rate divid-edly (in Japanese with English summary). J. Soc. Environ. Sci. Jan., 8, 25–34.
Kohno, Y., 2004: Study on impacts of acidic and oxidative substances on vegetation and establish-ment of tentative critical level for protecting East Asian vegetation (in Japanese). In: Interim report of research results under the GERF (Global Environ-ment Research Fund) in FY2003 (ed. by Ministry of the Environment Government of Japan). Ministry of the Environment Government of Japan, Tokyo, pp. 197–249.
Magnani, F., Mencuccini, M., Borghetti, M., Berbigier, P., Berninger, F., Delzon, S., Grelle, A., Hari, P., Jarvis, P. G., Kolari, P., Kowalski, A. S., Lankreijer, H., Law, B. E., Lindroth, A., Loustau, D., Manca, G., Moncrieff, J. B., Rayment, M., Tedeschi, V., Val-entini, R., and Grace, J., 2007: The human footprint in the carbon cycle of temperate and boreal forests. Nature, 447, 848–852.
Mills, G. (ed), 2004: Mapping Manual 2004, Chapter III Mapping Critical Levels for Vegetation. UNECE convention on long–range transboundary air pollu-tion (http://www.icpmapping.org/), 52 pp.
Murata, J. (ed), 2004: Newly revised illustrated trees in colour. Hokuryukan, Tokyo, 894 pp.
Nakaji, T., Fukami, M., Dokiya, Y., and Izuta, T., 2001: Effects of high nitrogen load on growth, photosynthe-sis and nutrient status of Cryptomeria japonica and Pinus densiflora seedlings. Trees, 15, 453–461.
Network Center for EANET (ed), 2006: Data report on the acid deposition in the East Asian region 2005. Network Center for EANET, Niigata, 236 pp.
Nihlgård, B., 1985: The ammonium hypothesis-an ad-ditional Explanation to the forest dieback in Europe. Ambio, 14, 2–8.
Nunn, A. J., Kozovits, A. R., Reiter, I. M., Heerdt, C., Leuchner, M., Lütz, C., Liu, X., Löw, M., Winkler, J. B., Grams, T. E. E., Häberle, K. -H., Werner, H., Fabian. P., Rennenberg. H., and Matyssek. R., 2005: Comparison of ozone uptake and sensitivity between a phytotron study with young beech and a
M. Watanabe et al. : Effects of Ozone and Nitrogen Load on Castanopsis sieboldii Seedlings
153

field experiment with adult beech (Fagus sylvatica). Environ. Pollut., 137, 494–506.
Ohara, T., Akimoto, H., Kurokawa, J., Horii, N., Yamaji, K., Yan, X., and Hatasaka, T., 2007: An Asian emission inventory of anthropogenic emission sources for the period 1980–2020. Atmos. Chem. Phys. Discuss., 7, 4419–4444.
Ohara, T., and Sakata, T., 2003: Long–term variation of photochemical oxidants over Japan (in Japanese with English summary). J. Jpn. Soc. Atmos. Envi-ron., 38, 47–54.
Okochi, H., and Igawa, M., 2001: Elevational patterns of acid deposition into a forest and nitrogen satura-tion on Mt. Oyama, Japan. Water Air Soil Pollut., 130, 1091–1096.
Oksanen, E., and Saleem, A., 1999: Ozone exposure results in various carry-over effects and prolonged reduction in biomass in birch (Betula pendula Roth). Plant Cell Environ., 22, 1401–1411.
Pell, E. J., Sinn, J. P., and Johansen, C. V., 1995: Ni-trogen supply as a limiting factor determining the sensitivity of Populus tremuloides Michx. to ozone stress. New Phytol., 130, 437–446.
Sandermann, H., Wellburn, A. R., and Heath, R. L. (eds.), 1997: Forest decline and ozone. Springer–Ver-lag, Berlin, 400 pp.
Schulze, E. -D., 1989: Air pollution and forest decline in a spruce (Picea abies) Forest. Science, 244, 776–783.
Tjoelker, M. G., and Luxmoore, R. J., 1991: Soil nitro-gen and chronic ozone stress influence physiology, growth and nutrient status of Pinus taeda L. and Liriodendron tulipifera L. seedlings. New Phytol., 119, 69–81.
Tsuzuki, T., 1999: Ammonia nitrogen (NH4+–N). In
Water analysis (fourth edition) (ed. by Hokkaido af-filiate of the Japan society for analytical chemistry). Kagaku-Dojin, Kyoto, pp. 253–256.
Utriainen, J., and Holopainen, T., 2001a: Nitrogen availability modifies the ozone responses of Scots pine seedlings exposed in an open–field system. Tree Physiol., 21, 1205–1213.
Utriainen, J., and Holopainen, T., 2001b: Influence of nitrogen and phosphorus availability and ozone
stress on Norway spruce seedlings. Tree Physiol., 21, 447–456.
Watanabe, M., Yamaguchi, M., Iwasaki, M., Matsuo, N., Naba, J., Tabe, C., Matsumura, H., Kohno, Y., and Izuta, T., 2006: Effects of ozone and/or nitro-gen load on the growth of Larix kaempferi, Pinus densiflora and Cryptomeria japonica seedlings. J. Jpn. Soc. Atmos. Environ., 41, 320–334.
Watanabe, M., Yamaguchi, M., Tabe, C., Iwasaki, M., Yamashita, R., Funada, R., Fukami, M., Matsumura, H., Kohno, Y., and Izuta, T., 2007: Influences of nitrogen load on the growth and photosynthetic re-sponses of Quercus serrata seedlings to O3. Trees, 21, 421–432.
WHO (World Health Organization) Regional Office for Europe (ed), 2000: Air quality guidelines for Europe, second edition, WHO Regional Office for Europe, Copenhagen, Denmark, 273 pp.
Wieser, G., and Tausz, M., 2007: Preface to the special issue of the Obergurgl workshop on ozone. Environ. Pollut., 146, 577.
Wright, R. F., Brandrud, T. -E., Clemensson-Lindell, A., Hultberg, H., Kjønaas, O. J., Moldan, F., Pers-son, H., and Stuanes, A. O., 1995: NITREX project: ecosystem response to chronic additions of nitrogen to a spruce-forested catchment at Gårdsjön, Sweden. Ecological Bulletins, 44, 322–334.
Yamaguchi, M., Watanabe, M., Iwasaki, M., Tabe, C., Matsumura, H., Kohno, Y., and Izuta, T., 2007a: Growth and photosynthetic responses of Fagus cre-nata seedlings to O3 under different nitrogen loads. Trees, 21, 707–718.
Yamaguchi, M., Watanabe, M., Matsuo, N., Naba, J., Funada, R., Fukami, M., Matsumura, H., Kohno, Y., and Izuta, T., 2007b: Effects of nitrogen supply on the sensitivity to O3 of growth and photosynthesis of Japanese beech (Fagus crenata) seedlings. Water Air Soil Pollut: Focus, 7, 131–136.
Yonekura, T., Yoshidome, M., Watanabe, M., Honda, Y., Ogiwara, I., and Izuta, T., 2004: Carry-over ef-fects of ozone and water stress on leaf phenological characteristics and bud frost hardiness of Fagus crenata seedlings. Trees, 18, 581–588.
J. Agric. Meteorol. (農業気象) 64 (3), 2008
154

要 約
日本の常緑広葉樹を対象としたオゾンのクリティカルレベルを評価するための基礎的知見を得ることを目的として , 日本の代表的な常緑広葉樹であるスダジイの成長と光合成に対するオゾンの影響を異なる窒素条件下において調べた。2年生のスダジイの苗木を 4段階のガス処理 (浄化空気 , 外気オゾン濃度の 1.0, 1.5および 2.0倍 )と 3段階の土壌窒素処理 (0, 20および 50 kg ha- 1 year- 1)を組み合わせた合計 12処理区で 2成長期にわたって育成した。オゾン暴露によって , スダジイ苗の純光合成速度と個体乾重量は有意に低下した。 一方 , 土壌への窒素負荷によってスダジイ苗の純光合成速度および個体乾重量は有意に増加した。スダジイ苗の純光合成速度におけるオゾン感受性は土壌への窒素負荷によって増加した。しかしながら , 個体乾重量におけるオゾン感受性
は土壌への窒素負荷の影響を受けなかった。その原因として , 2成長期目に比較的窒素負荷量の多い処理区で認められたオゾン暴露による 2ndフラッシュ葉の有意な増加が純光合成速度の低下を補償したことが考えられる。本研究の結果より , 50 kg ha- 1 year- 1までの土壌への窒素負荷はスダジイの個体乾物成長におけるオゾン感受性に影響を与えないことが明らかになった。個体乾重量の増加量を 5%低下させる 1成長期あたりのAOT40 (accumulated exposure over a threshold of 40 nmol mol- 1)をクリティカルレベルとすると , スダジイのクリティカルレベルは 22 μmol mol- 1 hと評価された。キーワード: オゾン,純光合成,成長,スダジイ,窒
素負荷
異なる窒素負荷量で育成したスダジイ苗の成長および光合成に対するオゾンの影響
渡辺 誠 *†・山口真弘 *・松村秀幸 **・河野吉久 **・伊豆田 猛 ****東京農工大学大学院連合農学研究科
**(財 )電力中央研究所 環境科学研究所
***東京農工大学大学院 共生科学技術研究院
†現在:北海道大学大学院農学研究院
M. Watanabe et al. : Effects of Ozone and Nitrogen Load on Castanopsis sieboldii Seedlings
155