tom weldin llc retail opportunities
TRANSCRIPT
Retail Sales Opportunities:Retail is part of the Business Plan
Tom Weldin LLC
Tom Weldin(201)-314-7115
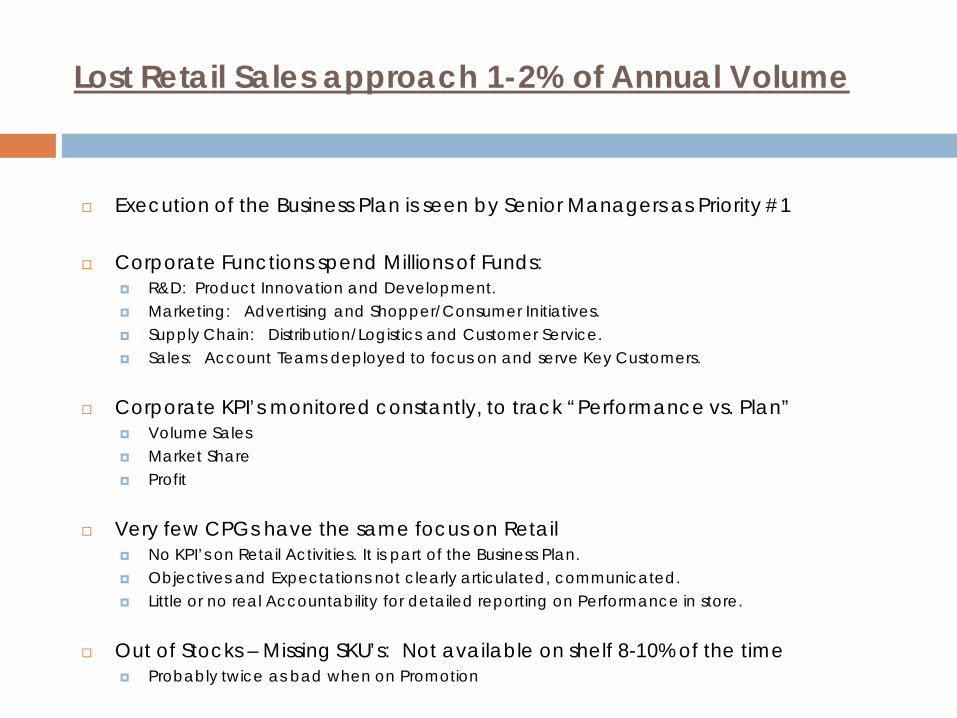
Lost Retail Sales approach 1-2% of Annual Volume
Execution of the Business Plan is seen by Senior Managers as Priority #1
Corporate Functions spend Millions of Funds: R&D: Product Innovation and Development. Marketing: Advertising and Shopper/Consumer Initiatives. Supply Chain: Distribution/Logistics and Customer Service. Sales: Account Teams deployed to focus on and serve Key Customers.
Corporate KPI’s monitored constantly, to track “Performance vs. Plan” Volume Sales Market Share Profit
Very few CPGs have the same focus on Retail No KPI’s on Retail Activities. It is part of the Business Plan. Objectives and Expectations not clearly articulated, communicated. Little or no real Accountability for detailed reporting on Performance in store.
Out of Stocks – Missing SKU’s: Not available on shelf 8-10% of the time Probably twice as bad when on Promotion

Fundamentals of Success for Retail
Clear set of Performance Expectations and Tolerances: What are the Brand Standards and what should the shelf look like? What is considered acceptable? Is the Account Authorized distribution and the
retail in-store distribution the same? What are the minimum expectations for Speed to Shelf for New Items/Innovations?
What stores should be included on regular day to day coverage? What Banners, how often, where, when and why.
What specific activities should the Retail Sales Team engage in, that create the most value for your Brands? Different Brands need different attention. Not all Categories in the store should be approached the same way. “Retail is not a Democracy”.
Who is Accountable for Performance and on what facts and reporting is Performance measured? What is acceptable performance – unacceptable performance?
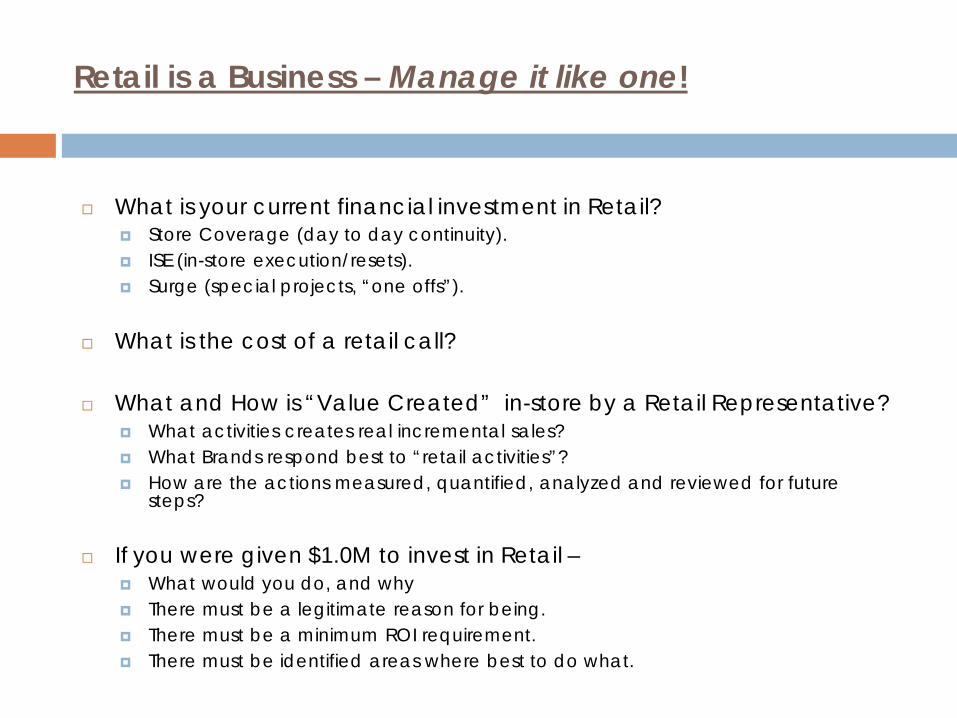
Retail is a Business – Manage it like one!
What is your current financial investment in Retail? Store Coverage (day to day continuity). ISE (in-store execution/resets). Surge (special projects, “one offs”).
What is the cost of a retail call?
What and How is “Value Created” in-store by a Retail Representative? What activities creates real incremental sales? What Brands respond best to “retail activities”? How are the actions measured, quantified, analyzed and reviewed for future
steps?
If you were given $1.0M to invest in Retail – What would you do, and why There must be a legitimate reason for being. There must be a minimum ROI requirement. There must be identified areas where best to do what.

Inspect What You Expect
Brokerage monies are focused on: 50% on Business Building (AE, Administration, Analysis, Supply Chain). 25% on Category Management (ISE Process). 25% on Retail Coverage.
Is the coverage focus based on where the commission is originated (account shipment) or where the consumption action is (the retail market)?
At store level, are we getting compliance on our programs paid at Headquarters? Is our pricing on target/plan? Are our shelf standards being executed? Are the POG being executed and compliant?
Account: Date:Category Non Pro. Range Strategy / Suggested Feature Price POG STD POG COM Comments / Competitive Activity
Lipton Tea 100ct Cup 2.89 - 3.79 Margin parity with key competition - Luzianne and Tetley
Lipton Tea 24ct Family 1.89 - 2.49 Margin parity with key competition - Luzianne and Tetley
Lipton Specialty 20ct 2.49 - 2.89 Margin parity with Celestial and Bigelow
Lipton 20ct Green 2.29 - 2.69 Margin parity with Celestial and Bigelow
Lipton 40ct Green 3.09 - 3.49 Margin parity with Celestial and Bigelow
Lipton 10qt Powder 2.99 - 3.59 Margin parity with key competition - Nestea
Lipton 20qt Powder 4.99 - 5.59 Margin parity with key competition - Nestea
Lipton 28qt Powder 5.79 - 6.59 Margin parity with key competition - Nestea
Ragu 26oz 2.09 - 2.19 Maintain .10 advantage versus Prego
Ragu Organic 2.49 - 2.59 Line priced with Bertolli
Ragu 32oz 3.59 - 3.89 Maintain .10 advantage versus Prego
Ragu 45oz 2.69 - 2.99 Maintain .10 advantage versus Prego
Ragu 66oz 3.49 - 3.69 Maintain .10 advantage versus Prego
Bertolli Sauce 26oz 2.89 - 3.09 .10 to.15 ABOVE Classico
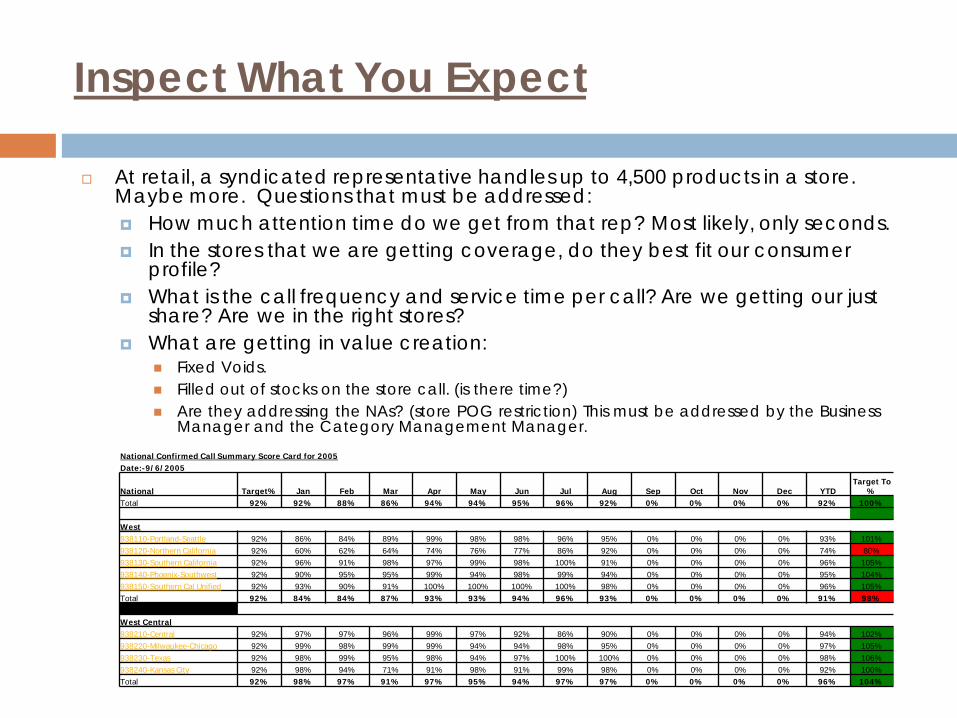
Inspect What You Expect
At retail, a syndicated representative handles up to 4,500 products in a store. Maybe more. Questions that must be addressed: How much attention time do we get from that rep? Most likely, only seconds. In the stores that we are getting coverage, do they best fit our consumer
profile? What is the call frequency and service time per call? Are we getting our just
share? Are we in the right stores? What are getting in value creation:
Fixed Voids. Filled out of stocks on the store call. (is there time?) Are they addressing the NAs? (store POG restriction) This must be addressed by the Business
Manager and the Category Management Manager.National Confirmed Call Summary Score Card for 2005Date:-9/6/2005
National Target% Jan Feb Mar Apr May Jun Jul Aug Sep Oct Nov Dec YTDTarget To
%Total 92% 92% 88% 86% 94% 94% 95% 96% 92% 0% 0% 0% 0% 92% 100%
West938110-Portland-Seattle 92% 86% 84% 89% 99% 98% 98% 96% 95% 0% 0% 0% 0% 93% 101%938120-Northern California 92% 60% 62% 64% 74% 76% 77% 86% 92% 0% 0% 0% 0% 74% 80%938130-Southern California 92% 96% 91% 98% 97% 99% 98% 100% 91% 0% 0% 0% 0% 96% 105%938140-Phoenix-Southwest 92% 90% 95% 95% 99% 94% 98% 99% 94% 0% 0% 0% 0% 95% 104%938150-Southern Cal Unified 92% 93% 90% 91% 100% 100% 100% 100% 98% 0% 0% 0% 0% 96% 105%Total 92% 84% 84% 87% 93% 93% 94% 96% 93% 0% 0% 0% 0% 91% 98%
West Central938210-Central 92% 97% 97% 96% 99% 97% 92% 86% 90% 0% 0% 0% 0% 94% 102%938220-Milwaukee-Chicago 92% 99% 98% 99% 99% 94% 94% 98% 95% 0% 0% 0% 0% 97% 105%938230-Texas 92% 98% 99% 95% 98% 94% 97% 100% 100% 0% 0% 0% 0% 98% 106%938240-Kansas City 92% 98% 94% 71% 91% 98% 91% 99% 98% 0% 0% 0% 0% 92% 100%Total 92% 98% 97% 91% 97% 95% 94% 97% 97% 0% 0% 0% 0% 96% 104%

Are We in the Right Stores
There is a profile for our products. Not all stores are the same. In the case of a wholesaler that services various chains, is the syndicated model
a blanket one or one that adjusts to the needs/profile of the client’s product? Do we have all the correct resources available? Do the sections meet Corporate Shelf Standards? In the Category Management Process, do we meet Customer POG Standards? Is the Customer POG updated and executed at retail quickly – or at all?
Some customers have well defined reset processes (i.e. Giant Carlisle) Others are not perfect.
Master Chain Chain Name Store Count
% of Coverage by Store Count
Store Count for Service
TimeCall
FrequencyTotal Planned
Calls Average of
Routed HoursPer Store Rec
Plan HoursTotal Monthly
Plan HoursTotal Annual Plan Hours
Annual Service Call Time Annual Cost
Affil Food Coop Amarillo Affil Food Amarillo TX 34 0.18% 34 1.00 34 2.75 4.00 136.00 1,632.00 0.18% $46,343.88 Affil Food Coop L R Affil Food-LR Indep 22 0.12% 22 1.00 22 2.70 4.00 88.00 1,056.00 0.12% $29,987.22 AG Alabama AG Alabama Independents 9 0.05% 9 1.00 9 1.75 3.00 27.00 324.00 0.04% $9,200.62 AG Baton Rouge AG Baton Rouge Indep 54 0.29% 54 1.00 54 2.45 4.00 216.00 2,592.00 0.29% $73,604.99
Rouse LA 7 0.04% 7 1.00 7 1.75 3.00 21.00 252.00 0.03% $7,156.04 AG Baton Rouge Total 61 0.32% 0 1.00 61 2.37
0.00 0.00 0.00% $80,761.03 AG Miami AG Miami FL-Indep 16 0.08% 16 1.00 16 1.75 3.00 48.00 576.00 0.06% $16,356.67
Food Show-AG Miami No 20 0.11% 0 0.00 0 0.00 0.00 0.00 0.00 0.00% $0.00 Food Show-AG Miami So 20 0.11% 0 0.00 0 0.00 0.00 0.00 0.00 0.00% $0.00 Sedanos Markets FL 26 0.14% 26 2.00 52 2.75 4.00 208.00 2,496.00 0.28% $70,878.88 Sell Inner Ct-AG Miami No 81 0.43% 0 0.00 0 0.00 0.00 0.00 0.00 0.00% $0.00 Sell Inner Ct-AG Miami So 118 0.63% 0 0.00 0 0.00 0.00 0.00 0.00 0.00% $0.00
AG Miami Total 281 1.49% 0 0.24 68 0.350.00 0.00 0.00% $87,235.55
AG Ocala AG Ocala FL Indep 2 0.01% 2 1.00 2 1.75 3.00 6.00 72.00 0.01% $2,044.58 Ahold Giant Food-Carlisle PA 122 0.65% 122 1.00 122 1.75 3.00 366.00 4,392.00 0.49% $124,719.57
Giant Food-Landover 162 0.86% 162 1.00 162 1.75 3.00 486.00 5,832.00 0.65% $165,611.23 Stop n Shop Metro NY 94 0.50% 94 1.00 94 1.75 3.00 282.00 3,384.00 0.38% $96,095.41 Stop n Shop New England 245 1.30% 245 1.00 245 1.75 3.00 735.00 8,820.00 0.98% $250,461.43 Tops Friendly Markets NY 65 0.34% 65 1.00 65 1.75 3.00 195.00 2,340.00 0.26% $66,448.95
Ahold Total 688 3.65% 0 1.00 688 1.75
0.00 0.00 0.00% $703,336.60
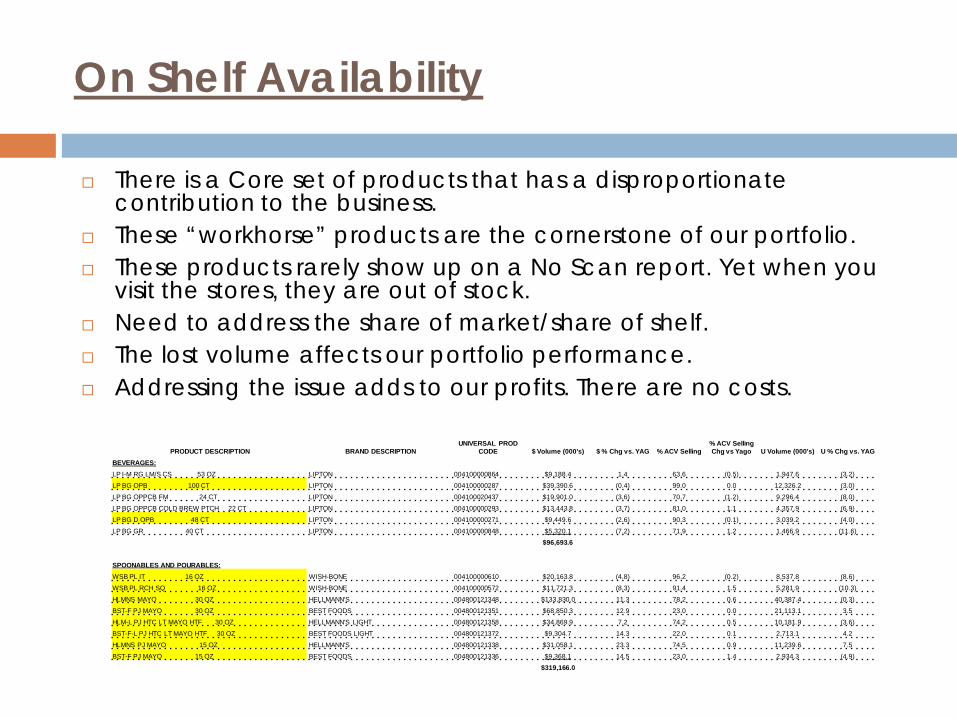
On Shelf Availability
There is a Core set of products that has a disproportionate contribution to the business.
These “workhorse” products are the cornerstone of our portfolio. These products rarely show up on a No Scan report. Yet when you
visit the stores, they are out of stock. Need to address the share of market/share of shelf. The lost volume affects our portfolio performance. Addressing the issue adds to our profits. There are no costs.
PRODUCT DESCRIPTION BRAND DESCRIPTION UNIVERSAL PROD
CODE $ Volume (000's) $ % Chg vs. YAG % ACV Selling% ACV Selling Chg vs Yago U Volume (000's) U % Chg vs. YAG
BEVERAGES:LP I-M RG LM/S CS 53 OZ LIPTON 004100000864 $9,188.4 1.4 63.6 (0.5) 1,947.6 (3.2)
LP BG OPB 100 CT LIPTON 004100000287 $39,390.6 (0.4) 99.0 0.0 12,326.2 (3.0)
LP BG OPPCB FM 24 CT LIPTON 004100020437 $19,901.0 (3.6) 70.7 (1.2) 9,296.4 (8.0)
LP BG OPPCB COLD BREW PTCH 22 CT LIPTON 004100000293 $13,443.8 (3.7) 81.0 1.1 4,357.9 (6.9)
LP BG D OPB 48 CT LIPTON 004100000271 $9,449.6 (2.6) 90.3 (0.1) 3,039.2 (4.0)
LP BG GR 40 CT LIPTON 004100000848 $5,320.1 (7.2) 71.9 1.2 1,466.9 (11.6)
$96,693.6
SPOONABLES AND POURABLES:WSB PL IT 16 OZ WISH-BONE 004100000610 $20,163.8 (4.8) 96.2 (0.2) 8,537.8 (8.6)
WSB PL RCH SQ 16 OZ WISH-BONE 004100000572 $11,721.3 (8.3) 91.4 1.5 5,281.9 (10.3)
HLMNS MAYO 30 OZ HELLMANN'S 004800121348 $133,830.0 11.3 78.2 0.6 40,387.4 (0.3)
BST-F PJ MAYO 30 OZ BEST FOODS 004800121351 $68,850.3 12.9 23.0 0.0 21,113.1 3.5
HLM-L PJ HTC LT MAYO HTF 30 OZ HELLMANN'S LIGHT 004800121358 $34,869.9 7.2 74.2 0.5 10,181.9 (3.6)
BST-F-L PJ HTC LT MAYO HTF 30 OZ BEST FOODS LIGHT 004800121372 $9,304.7 14.3 22.0 0.1 2,713.1 4.2
HLMNS PJ MAYO 15 OZ HELLMANN'S 004800121338 $31,058.1 23.3 74.5 0.9 11,239.6 7.5
BST-F PJ MAYO 15 OZ BEST FOODS 004800121336 $9,368.1 14.5 23.0 1.4 2,934.3 (4.9)
$319,166.0

Cost To Serve
Objective is to analyze and identify the customers that we need to focus for growth and development.
Not all customers are alike. Can we address any proposal for incremental spend? Need to identify these costs in order to determine an effective rate
of return. Costs include: Retail Service time and frequency. Reset costs. Trade Spend and Co Marketing Costs.
Number of stores Coverage Hours
Retail Hours per
Store
Cost per Store H1 Reset Budget
H1 # stores on Reset
Coverage
Reset cost per store
Total Retail + Reset Investment
per Store
H1 Investment per Chain H1 NSV % Retail Cost to
Serve
Reduction in cost due to
RCTS Ceiling of .89%
Continuity Cost Continuity C2S Reset Cost Reset CsS
Military** #DIV/0! #DIV/0! #DIV/0! #DIV/0! #DIV/0! #DIV/0! #DIV/0! #DIV/0! #DIV/0! #DIV/0! #DIV/0!
Winn Dixie 460 1,265.0 2.8 $ 792 $ 216,500 522 $ 415 $ 1,207 $ 580,820 $ 30,168,552 1.93% $ 312,320 $ 364,320 1.21% 216,500 0.718%
Ahold (direct & C&S) 708 1,239.0 1.8 $ 504 $ 1,002,604 101 $ 9,927 $ 10,431 $ 1,359,436 $ 268,313,696 0.51% $ (1,028,556) $ 356,832 0.13% 1,002,604 0.374%
Safeway 1,207 2,112.5 1.8 $ 504 $ 636,836 1554 $ 410 $ 914 $ 1,245,236 $ 133,863,984 0.93% $ 53,847 $ 608,400 0.45% 636,836 0.476%
Harris Teeter 129 225.8 1.8 $ 504 $ 105,000 144 $ 729 $ 1,233 $ 170,016 $ 12,982,246 1.31% $ 54,474 $ 65,016 0.50% 105,000 0.809%
Delhaize 1,113 1,947.8 1.8 $ 504 $ 752,756 1487 $ 506 $ 1,010 $ 1,313,708 $ 102,375,277 1.28% $ 402,568 $ 560,952 0.55% 752,756 0.735%
Publix 888 2,442.0 2.8 $ 792 $ 360,000 904 $ 398 $ 1,190 $ 1,063,296 $ 118,673,829 0.90% $ 7,099 $ 703,296 0.59% 360,000 0.303%
Wegmans Food Markets 25 43.8 1.8 $ 504 $ - 0 #DIV/0! #DIV/0! $ 12,600 $ 13,206,043 0.10% $ (104,934) $ 12,600 0.10% #DIV/0! #DIV/0!
Kroger 1,970 3,447.5 1.8 $ 504 $ 1,270,075 2430 $ 523 $ 1,027 $ 2,262,955 $ 259,947,879 0.87% $ (50,581) $ 992,880 0.38% 1,270,075 0.489%
Giant Eagle 269 1,144.0 4.3 $ 1,225 $ 116,588 330 $ 353 $ 1,578 $ 446,060 $ 35,750,477 1.25% $ 127,881 $ 329,472 0.92% 116,588 0.326%
Albertsons (LLC ONLY) 286 500.5 1.8 $ 504 $ 186,262 330 $ 564 $ 1,068 $ 330,406 $ 17,809,076 1.86% $ 171,905 $ 144,144 0.81% 186,262 1.046%
Tengelman 328 645.0 2.0 $ 566 $ 157,250 65 $ 2,419 $ 2,986 $ 343,010 $ 32,914,000 1.04% $ 50,075 $ 185,760 0.56% 157,250 0.478%
Average per store $ 9,127,543 $ 1,026,005,059 12.0% #DIV/0! #DIV/0! #DIV/0! #DIV/0!
Hy Vee 151 619.0 4.1 $ 1,181 $ 54,844 200 $ 274 $ 1,455 $ 233,116 $ 19,949,920 1.17% $ 55,562 $ 178,272 0.89% 54,844 0.275%
Regional Accounts
Inner City/Ethnic/Independent Sales Objectives
To cover stores, in an ethnic Neighborhoods, that are not on coverage by our Retail Sales Team.
Stores that are supplied by a local (ethnic specific where possible) Market Wholesaler. No direct shipments – no credit checks, minimum ships, or customer service support.
Primary Ethnic Audience is Hispanic (Caribbean, Mexican and South American) and African American. These groups are highly Brand Loyal.
□ Selling Objectives□ Get current deal sheets from the local Wholesaler(s) account manager(s)□ Drive whatever product is the “work horse” for the area□ Build on the workhorse volume and sell additional SKU’s□ Shelf stock and display stock can be sold (a loaded shelf is a happy shelf )
□ Merchandising should be limited□ Ensure that product is on shelf.□ Consider a “display” allowance if display quantities are sold AND if the merchant will put a sign in the window.□ Any allowances offered “on the street” need Rep verification for whatever performance ( display/sign. Etc ) was agreed to.

Inaugural Year Annual Ethnic/Inner City ResultsAs of December 31, 2007
NSV % CASES % ASP
TOTAL $6,485,440.50 100% 158,810 100% $40.84
Bronx, NYC *** $1,200,404.51 19% 46,154 29% $26.01
Detroit, MI *** $1,044,533.82 16% 9,484 6% $110.14
Brooklyn, NYC *** $1,014,242.88 16% 30,190 19% $33.60
Queens, NYC *** $546,113.26 8% 18,343 12% $29.77
New Jersey (01/07) $541,690.32 8% 17,430 11% $31.08
Valley, No Cal. (06/07) $514,907.32 8% 997 1% $516.46
Freemont, No. Cal (04/07) $387,178.91 6% 811 1% $477.41
Miami North, FL (03/07) $315,339.00 5% 8,374 5% $37.66
Bronx-Manhattan, NYC (03/07) $302,274.25 5% 11,993 8% $25.20
Miami South, FL (03/07) $221,857.77 3% 8,170 5% $27.16
San Diego, CA (05/07) $192,156.48 3% 5,917 4% $32.48
Los Angeles #2 (05/07-09/07) $148,532.19 2% 582 .5% $255.21
Los Angeles #3 (05/07) $56,209.79 1% 365 .5% $154.00

Extraordinary ROI
Breakeven Model Actual UnileverCost of a Rep 30,000$ 30,000$ Gross Margin Dollars per Ethnic Sale 7.20$ Number of Cases needed to sell to break even 4,167 If stores are monthly - # case sales per month 347 # of case sales per week 87 # of case sales per day 17
Anticipated calls per day for a Rep, for a given week 8# of calls in a month 18 working days a month 144# calls in a year 1728# of sales calls where a sales is made 50% close rate 864average # cases sold per average sale 5annual cases sold by the average Rep 4320
Total Gross Margin Dollars generated - annual average Rep Sales 31,104$ 850,000$ ROI 104% 2833%
Breakeven Sales level easily within reachPeer company performance, per Average Rep yields xx% ROI
Work with Finance – Agree the model – Agree ‘How to Measure” up front!

Costings for Opportunities
SCENARIO #6 = Crock Chilled/Bertolli Frozen Incremental Coverage only - Frequency is once per month. Use the DRT for the other call.Assume 30 minutes per Brand - 60 minutes total
ASSUMPTIONS:Number of Stores to Cover 9,000Works Crock Chilled and Bertolli FrozenEstimate 60 minutes per store call 60Estimate 38 minutes drive time from store to store 38Call Frequency per Month 1
A STORE CALL DAY FOR A REP: COSTS:Number of hours per day 8 Sales Reps Salaries:Number of minutes per hour 60 Fully Loaded Sales Rep Annual Salary $52,000.00Number of Minutes per Work Day 480 Number of Sales Reps 95less Personal Time per store call day 30 Annual Sales Rep Salaries $4,940,000.00Store Call Minutes per day 450Number of Store Call Minutes (call plus drive time) 98 Management Costs:Number of Store Calls per Day 4.591837 Number of Reps per Supervisor 12
5 Number of Supervisors Needed 7.9166666678
WORK DAYS PER SALES REP PER MONTH:Number pf Days in the Year 365 Fully Loaded Supervision Annual Salary $85,000.00Number of Weekend Days Per Year 104 Annual Supervisory Salaries $680,000.00Number of Maximum Workdays per Year 261Less Paid Vacations 10 Number of Supervisors Needed 8
251 Number of Supervisors per Area Manager 7Less Monday Holidays and Personal Days 10 Number of Area Managers Needed 1.142857143
241 1Less Administrative/Meetings Days Per Year 12
Equals Possible Max Number of Work Days Per Year 229 Fully Loaded Area Manager Salary $160,000.00Number of Months per Year 12 Annual Area Manager Salaries $160,000.00Number of Work Days Per Month 19.08333
19 Team Lead 0Fully Loaded Team Lead Salary $0.00
NUMBER OF REPS:Number of Stores Called Per Rep per Day 5 Annual Management Salaries $840,000.00Number of Days per Week 5Number of Stores Called per Week 25 TOTAL PAYROLL $5,780,000.00Frequency per Month 1Number of Weeks per Month 4Number of Stores Called per Month per Rep 100 Note:Number of Store Calls Made Per Month 100 Assumes no administrative and analytical functions.Meetings/Admin Days per Month 1 Assumes no training chargesFinal Number of Stores Called Per Month 95 Assumes no additional setup charges (routings)Final Number of Store Calls Made Per Month 95 Assumes reps are full time
Assumes store locations selected are the same as the DRT ModelNumber of Stores Targeted 9,000 Assumes the 9,000 stores are on the DRT coverage ModelFinal Number of Stores Called Per Month 95 The incremental supervisors and Area Managers are needed.Number of Reps Needed 94.7368 The Team Lead could be eliminated.
95 NOTE THE DRT COST WOULD ALSO HAVE TO BE INCREASED.

Recommendation: 120 day Fast Trak Program
Communication of Retail Standards - Category, Brand and Channel specific.
Implementation of a strategic Retail Coverage Strategy - The “right stores” with the “right coverage” doing the “right things”.
In-Store Procedures Training and Execution - What do to and why.
Integrated Real-Time reporting and visibility - Performance against Corporate defined standards. Performance against identified KPI’s.
Retail investment strategy linked to performance - Revised Broker Retail Commissions platform.
The Results
Immediate sense of “discomfort” by all those who really know that “nothing is really being done” You will know who was not “contributing” to the solution. Increased focus/attention will produce results.
Immediate respect by the Retail Sales Reps – because they know what they should be doing, and they are not driven or expected to do those things People want to do a good job – and want to be recognized for doing a
good job.
Immediate improvement of On Shelf Availability – and the clarity of understanding Reduced Out of Stocks and Voids. Improved turns of your most valuable SKUs. Increased profits since there is no incremental spend to drive volume. It is
already budgeted. Tracking and Recovery of up to 2% of annual sales – in recovered lost sales,
and the ability to understand “where” the sales came from, and the “commercial value” of the sales.