tomorrow and electricitymap, mapping emissions from ev
TRANSCRIPT

Tomorrow and electricityMap,mapping emissions from EV charging in real-time
Olivier Corradi / @[email protected]
tmrow.com
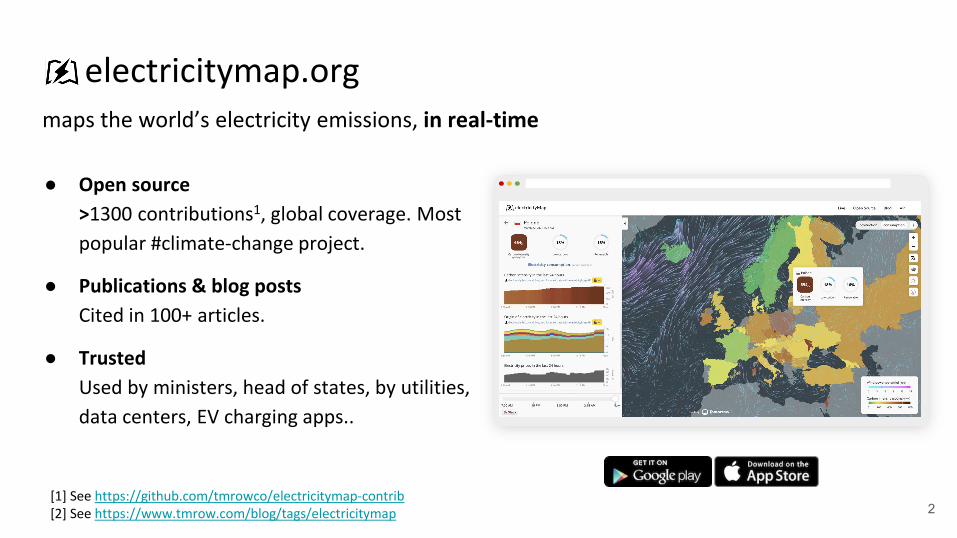
maps the world’s electricity emissions, in real-time
● Open source>1300 contributions1, global coverage. Most popular #climate-change project.
● Publications & blog postsCited in 100+ articles.
● TrustedUsed by ministers, head of states, by utilities, data centers, EV charging apps..
2[1] See https://github.com/tmrowco/electricitymap-contrib[2] See https://www.tmrow.com/blog/tags/electricitymap
electricitymap.org
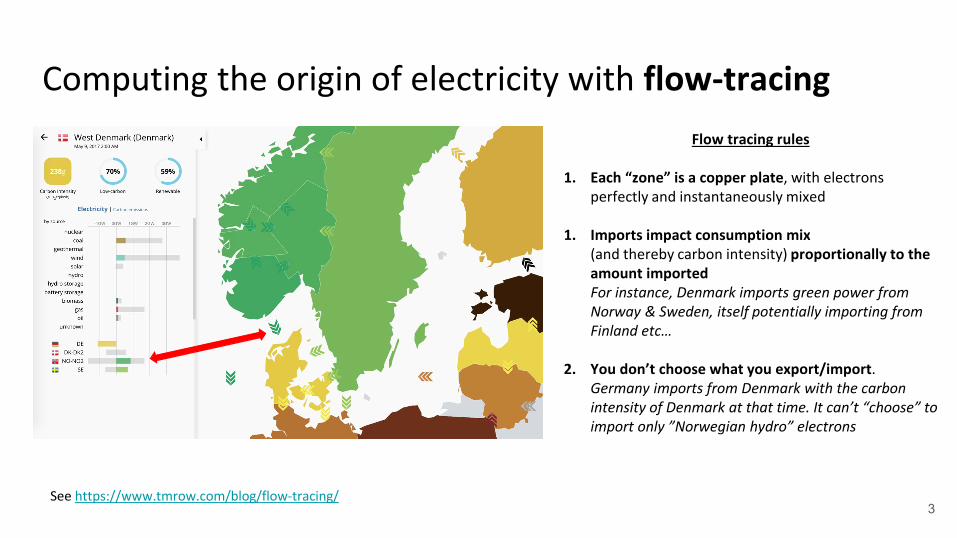
Flow tracing rules
1. Each “zone” is a copper plate, with electrons perfectly and instantaneously mixed
1. Imports impact consumption mix (and thereby carbon intensity) proportionally to the amount importedFor instance, Denmark imports green power from Norway & Sweden, itself potentially importing from Finland etc…
2. You don’t choose what you export/import. Germany imports from Denmark with the carbon intensity of Denmark at that time. It can’t “choose” to import only ”Norwegian hydro” electrons
Computing the origin of electricity with flow-tracing
See https://www.tmrow.com/blog/flow-tracing/3

33%wind
67% coal
Using average carbon intensity
Location-based approach
Using “Guarantees of Origin” or RECs
100% wind0% coal
0% wind100% coal
Residual mix
Market-based approach
What about my purchased electricity?
Challenges with having both:
● 2 methodologies meanstwo consumers can claim the same greenness
● Doesn’t match up with taxpayers’ intuition
● Granular GOs (hourly) duplicatesthe location-based method
Market-based will become a subsidysystem, and location-based an accounting system.
4

6
An opportunity to reduce emissions

Our forecasts predict when the electricity is cleanest
See https://api.electricitymap.org

Displaying and utilizing forecast data for smart charging EVsVisualizing carbon footprint of interconnectors
Showing carbon data and forecasts to electricity retailer users
Showing carbon data and forecasts to smart heater users
Showing carbon data and forecasts to electricity retailer users
Displaying and utilizing forecast data for smart charging EVs
Displaying and utilizing forecast data for smart charging EVs
Displaying and utilizing forecast data for smart charging EVs
Displaying carbon footprint data in home energy management app
Carbon-aware demand-responseof data centers
electricityMap forecasts used by leading companies
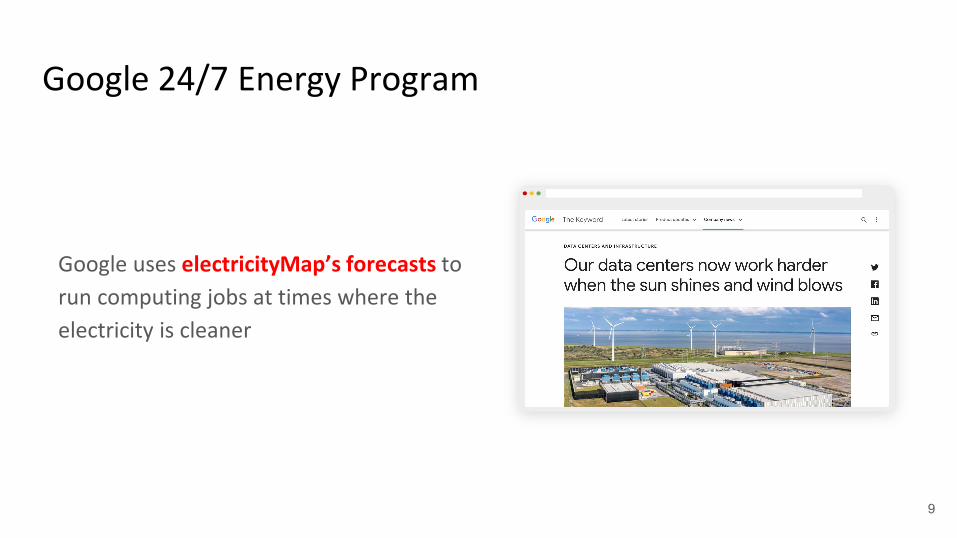
Google 24/7 Energy Program
Google uses electricityMap’s forecasts to run computing jobs at times where the electricity is cleaner
9
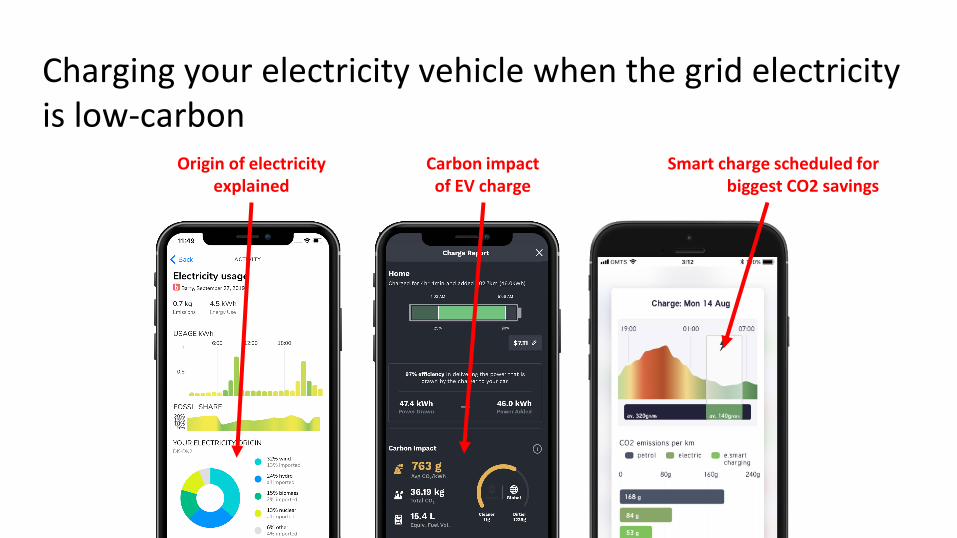
Charging your electricity vehicle when the grid electricity is low-carbon
Carbon impact of EV charge
Smart charge scheduled for biggest CO2 savings
Origin of electricity explained

Computing the marginal origin of electricity
Use case: when I charge my EV, where does that electricity come from?
Power plants are dispatched by increasing cost
When electricity demand is increased, the first power plant to increase its production is cheapest that has spare capacity
We call that power plant the marginal power plant.
Problem: the dispatch order is secret
11
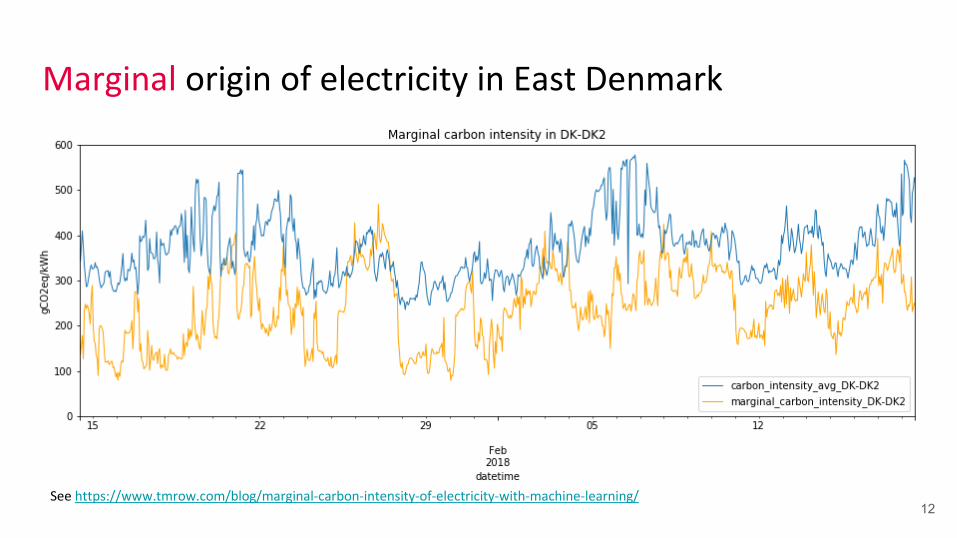
Marginal origin of electricity in East Denmark
12See https://www.tmrow.com/blog/marginal-carbon-intensity-of-electricity-with-machine-learning/

20% savings in Denmark using smart charging
13