tomorrow’s progress today - · pdf filetomorrow’s progress today ... domestic...
TRANSCRIPT
Apar Industries Limited Earnings Presentation | Q4 & FY16
1
Tomorrow’s Progress Today
Corporate Presentation
Q4 & FY16 Earnings Presentation
Apar Industries Ltd

Apar Industries Limited Earnings Presentation | Q4 & FY16
2
Safe Harbor
This presentation may have certain statements that may be “forward looking” including those relating togeneral business plans and strategy of Apar Industries Ltd., its future outlook and growth prospects. Theactual results may differ materially from these forward looking statements due to a number of risks anduncertainties which could include future changes or developments in Apar Industries Ltd.(Apar), thecompetitive environment, the company’s ability to implement its strategies and initiatives, respond totechnological changes as well as sociopolitical, economic and regulatory conditions in India.
All financial data in this presentation is obtained from the audited financial statements and the various ratiosare calculated based on these data. This presentation does not constitute a prospectus, offering circular oroffering memorandum or an offer, invitation or a solicitation of any offer, to purchase or sell, any shares ofApar and should not be considered or construed in any manner whatsoever as a recommendation that anyperson should subscribe for or purchase any of Apar’s shares. None of the projection, expectations, estimatesor prospects in this presentation should be construed as a forecast implying any indicative assurance orguarantee of future performance, nor that the assumptions on which such future projects, expectations,estimates or prospects have been prepared are complete or comprehensive .
This presentation is for information purposes only. This document and its contents should not forwarded ordelivered or transmitted in any manner to any person other than its intended recipients, and should not bereproduced in any manner whatsoever. The recipients further represents and warrants that : (i) It is lawfullyable to receive this presentation under the laws of the jurisdiction in which it is located, and / or any otherapplicable laws, (ii) It is not a U.S. person, (iii) This presentation is furnished to it, and has been received,outside of the United States, and (iv) It will not reproduce, publish, disclose, redistribute or transmit thispresentation, directly or indirectly, into the United States or to any U.S. person either within or outside ofrecipient’s organisation.

Apar Industries Limited Earnings Presentation | Q4 & FY16
3
Key Highlights FY16:Strong performance amid challenging market conditions
Robust growth in profitability - EBITDA & PAT up 44% & 142% YoY, respectivelyHistorically high volumes delivered across all three business segments
Revenue up 10%YoY with 13% YoY increase in volumes despite fall in raw material prices.
Exports contribution at 40%. HEC revenue up at 6.2% of Conductors’ revenue from 1.1% in
FY15. Order book at Rs 1,751 Cr; Increased traction for High
efficiency conductors. EBITDA (post adj*) up 12% YoY.
Speciality Oils & Auto Lubes
Cables
FY16 Revenue
Rs 5,080 Cr
Up ~226bps
excluding exceptional gain of Rs 43 Cr from treasury
shares sale
EBITDA Margin
7.2%
PAT
Rs 120 Cr
Apar is investing Rs 140 Cr in India & $15.5mn (Rs 100 Cr) in overseas plant to fuel future growth.
Conductors
Setting up Conductors plant in Jharsuguda of30,000 MT. Strategically located to tap increasinggeneration capacity in eastern India, along with itsproximity to smelters, for logistical benefits.
Revenue up 20% YoY. Uptick in both exports and domestic markets with increased ordering by Defence, Railways, Wind & Solar Companies.
EBITDA (post adj*) up 25% YoY.
Aggregate Volume up 2.6% YoY despite sluggish market conditions & falling Crude prices.
Domestic demand is picking up, but lacks consistency; expected to further increase on account of UDAY.
Exports impacted as cash-strapped commodity-driven economies are curtailing T&D investments.
EBITDA (post adj*) up 104% YoY driven by richer product mix.
Setting up a port-based Oil plant at Sharjah, of100,000 KL which will open up new opportunitieslike bulk exports and is strategically located interms of proximity to customers.
Planned capex to expand PowerCable capacity to cater toincreasing demand.
* After adjusting open period forex
Apar Industries Limited Earnings Presentation | Q4 & FY16
4
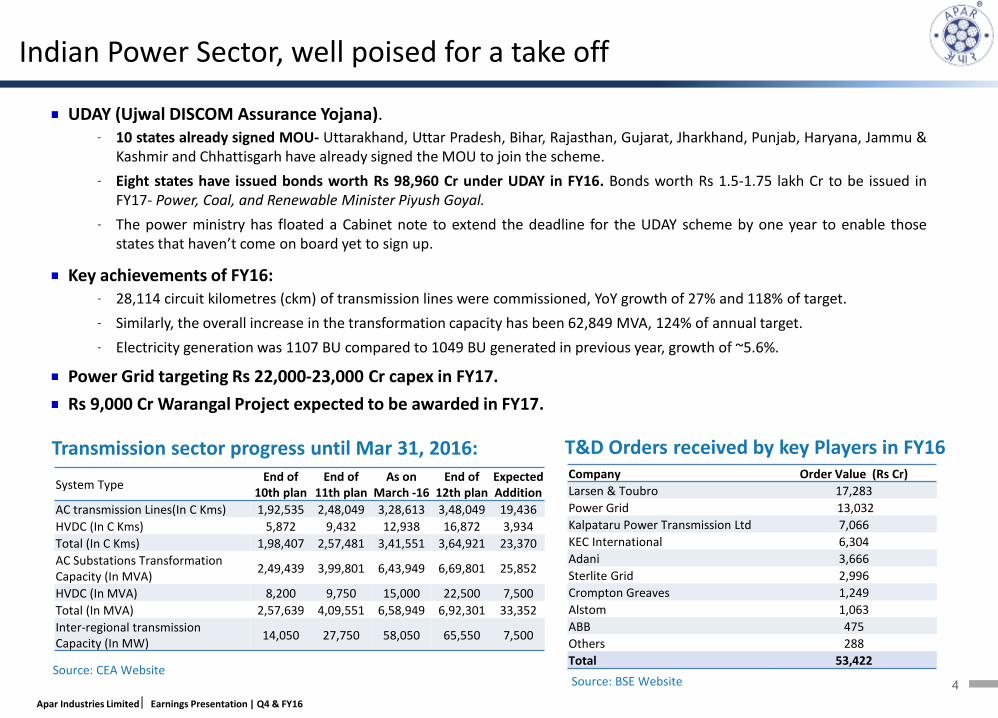
UDAY (Ujwal DISCOM Assurance Yojana).- 10 states already signed MOU- Uttarakhand, Uttar Pradesh, Bihar, Rajasthan, Gujarat, Jharkhand, Punjab, Haryana, Jammu &
Kashmir and Chhattisgarh have already signed the MOU to join the scheme.
- Eight states have issued bonds worth Rs 98,960 Cr under UDAY in FY16. Bonds worth Rs 1.5-1.75 lakh Cr to be issued inFY17- Power, Coal, and Renewable Minister Piyush Goyal.
- The power ministry has floated a Cabinet note to extend the deadline for the UDAY scheme by one year to enable thosestates that haven’t come on board yet to sign up.
Key achievements of FY16:- 28,114 circuit kilometres (ckm) of transmission lines were commissioned, YoY growth of 27% and 118% of target.
- Similarly, the overall increase in the transformation capacity has been 62,849 MVA, 124% of annual target.
- Electricity generation was 1107 BU compared to 1049 BU generated in previous year, growth of ~5.6%.
Power Grid targeting Rs 22,000-23,000 Cr capex in FY17.
Rs 9,000 Cr Warangal Project expected to be awarded in FY17.
Transmission sector progress until Mar 31, 2016:
Source: BSE Website
T&D Orders received by key Players in FY16
Source: CEA Website
System TypeEnd of
10th planEnd of
11th planAs on
March -16 End of
12th planExpected Addition
AC transmission Lines(In C Kms) 1,92,535 2,48,049 3,28,613 3,48,049 19,436
HVDC (In C Kms) 5,872 9,432 12,938 16,872 3,934
Total (In C Kms) 1,98,407 2,57,481 3,41,551 3,64,921 23,370
AC Substations Transformation Capacity (In MVA)
2,49,439 3,99,801 6,43,949 6,69,801 25,852
HVDC (In MVA) 8,200 9,750 15,000 22,500 7,500
Total (In MVA) 2,57,639 4,09,551 6,58,949 6,92,301 33,352
Inter-regional transmission Capacity (In MW)
14,050 27,750 58,050 65,550 7,500
Indian Power Sector, well poised for a take off
Company Order Value (Rs Cr)
Larsen & Toubro 17,283
Power Grid 13,032
Kalpataru Power Transmission Ltd 7,066
KEC International 6,304
Adani 3,666
Sterlite Grid 2,996
Crompton Greaves 1,249
Alstom 1,063
ABB 475
Others 288
Total 53,422

Apar Industries Limited Earnings Presentation | Q4 & FY16
5
Financial Performance
Business performance
Company Overview
Annexure

Apar Industries Limited Earnings Presentation | Q4 & FY16
6
Figures in Rs Cr
Revenue marginally impacted due to effect of decline in crude oil prices on Specialty Oils’
revenue. However, growth in Cables and Conductors of 20% & 10%, respectively, helps revenue.
Volumes increased across all segments with each segment at historically highest levels.
EBITDA up 44% YoY; EBITDA Margin expands by 226bps driven by increased profitability across all
businesses due to growth in range of new generation high margin products.
PAT up from Rs 50 Cr in FY15 to Rs 120 Cr, PAT Margin at 2.4% compared to 1.0% in FY15.
• Excludes exceptional gain of Rs 43 Cr on the sale of treasury shares.
1% 30%
Revenue EBITDA (Margin %) PAT* (Margin %)
FY15
FY16
Consolidated
5,122
5,080
1%
367 (7.2%)
254 (5.0%)
44%
50 (1.0%)
120 (2.4%)
* After adjusting exceptional gains
142%
FY16 (Consol): Margins up & volumes at record levels across segments
Apar Industries Limited Earnings Presentation | Q4 & FY16
7
9%
Revenue EBITDA (Margin %) PAT (Margin %)
Q4 FY15
Q4 FY16
Consolidated
Figures in Rs Cr
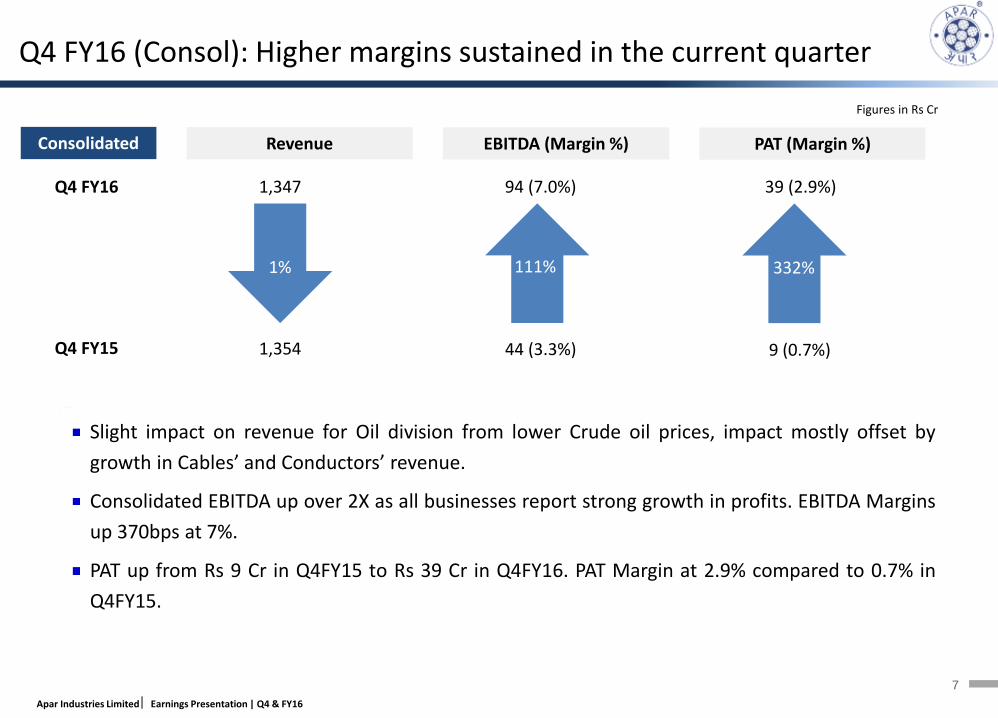
1,354
1,347
1%
94 (7.0%)
44 (3.3%)
111%
9 (0.7%)
39 (2.9%)
332%
Q4 FY16 (Consol): Higher margins sustained in the current quarter
Slight impact on revenue for Oil division from lower Crude oil prices, impact mostly offset by
growth in Cables’ and Conductors’ revenue.
Consolidated EBITDA up over 2X as all businesses report strong growth in profits. EBITDA Margins
up 370bps at 7%.
PAT up from Rs 9 Cr in Q4FY15 to Rs 39 Cr in Q4FY16. PAT Margin at 2.9% compared to 0.7% in
Q4FY15.

Apar Industries Limited Earnings Presentation | Q4 & FY16
8
Financial Performance
Segmental Overview
Company Overview
Annexure
Business Performance
Apar Industries Limited Earnings Presentation | Q4 & FY16
9
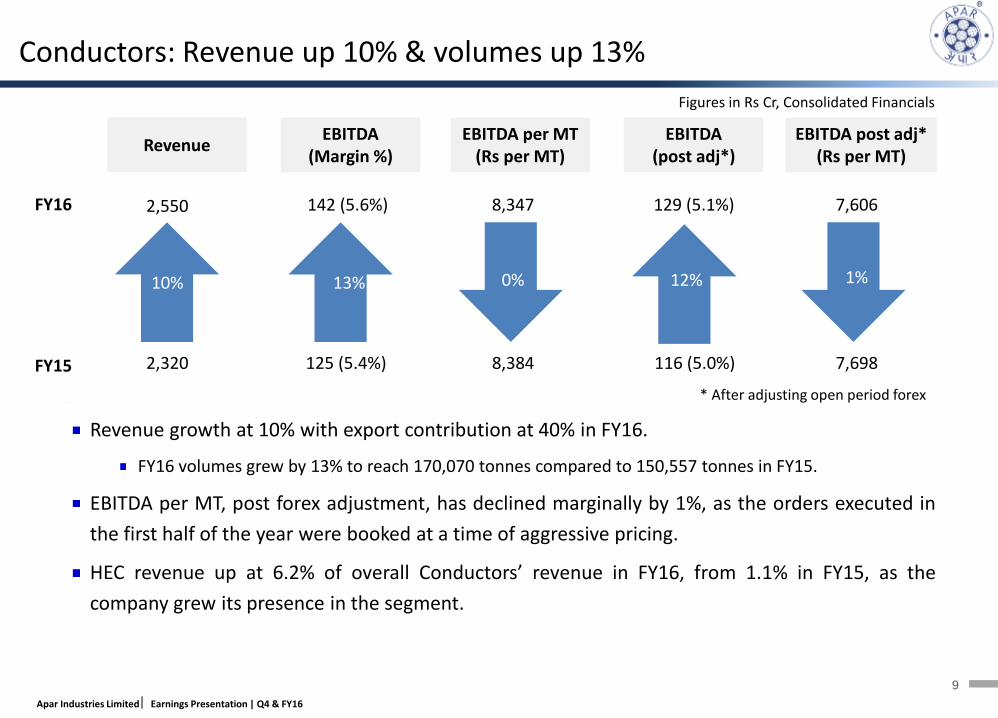
* After adjusting open period forex
Figures in Rs Cr, Consolidated Financials
2,320
2,550
Revenue EBITDA
(Margin %)EBITDA per MT
(Rs per MT)
10%30%30%
EBITDA (post adj*)
EBITDA post adj* (Rs per MT)
125 (5.4%)
142 (5.6%)
13%
8,384
8,347
0%
116 (5.0%)
129 (5.1%)
7,698
7,606
1%
FY15
FY16
12%
Conductors: Revenue up 10% & volumes up 13%
Revenue growth at 10% with export contribution at 40% in FY16.
FY16 volumes grew by 13% to reach 170,070 tonnes compared to 150,557 tonnes in FY15.
EBITDA per MT, post forex adjustment, has declined marginally by 1%, as the orders executed in
the first half of the year were booked at a time of aggressive pricing.
HEC revenue up at 6.2% of overall Conductors’ revenue in FY16, from 1.1% in FY15, as the
company grew its presence in the segment.
Apar Industries Limited Earnings Presentation | Q4 & FY16
10
* After adjusting open period forex
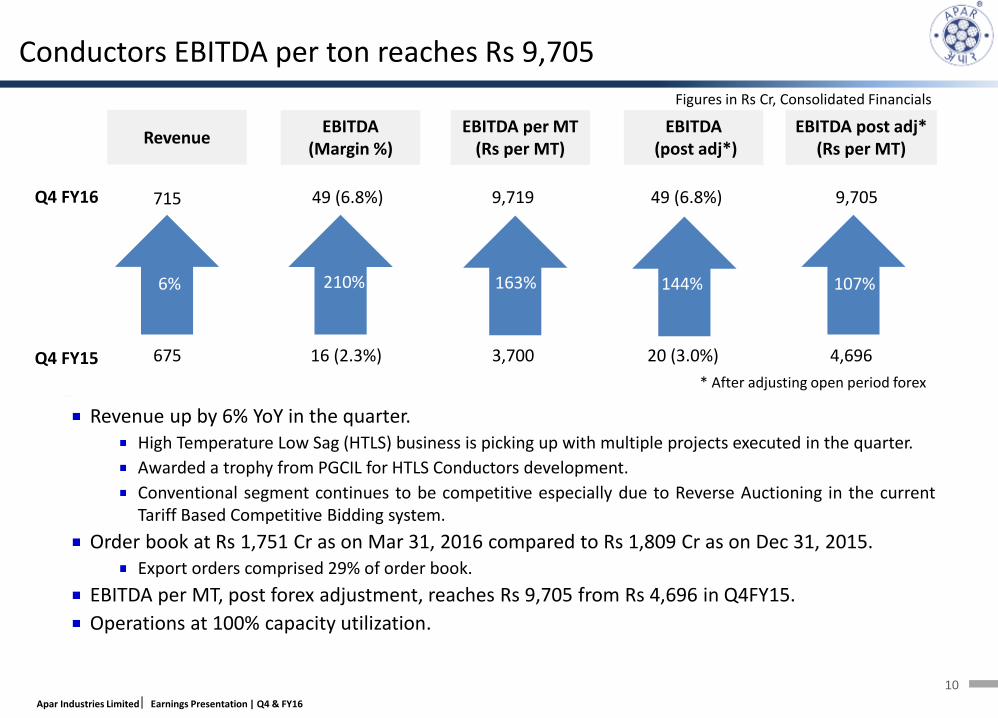
675
715
Revenue EBITDA
(Margin %)EBITDA per MT
(Rs per MT)
6% 30%30%
EBITDA(post adj*)
EBITDA post adj* (Rs per MT)
16 (2.3%)
49 (6.8%)
210%
3,700
9,719
163
20 (3.0%)
49 (6.8%)
4,696
9,705
107%
Q4 FY15
Q4 FY16
144%
Conductors EBITDA per ton reaches Rs 9,705
163%
Revenue up by 6% YoY in the quarter.High Temperature Low Sag (HTLS) business is picking up with multiple projects executed in the quarter.
Awarded a trophy from PGCIL for HTLS Conductors development.
Conventional segment continues to be competitive especially due to Reverse Auctioning in the currentTariff Based Competitive Bidding system.
Order book at Rs 1,751 Cr as on Mar 31, 2016 compared to Rs 1,809 Cr as on Dec 31, 2015.Export orders comprised 29% of order book.
EBITDA per MT, post forex adjustment, reaches Rs 9,705 from Rs 4,696 in Q4FY15.
Operations at 100% capacity utilization.
Figures in Rs Cr, Consolidated Financials

Apar Industries Limited Earnings Presentation | Q4 & FY16
11
* After adjusting open period forex
2,251
1,841
Revenue EBITDA
(Margin %)EBITDA (Rs per
KL)
FY15
FY16
18%30%30%
Volume (KL)EBITDA (post
adj*)EBITDA post
adj* (Rs per KL)
108 (4.8%)
204 (11.1%)
89%
3,300
6,067
84%
89 (4.0%)
182 (9.9%)
104%
2,722
5,407
99%
328,123
336,526
2.6%
Specialty Oils: Significant improvement in margins
Revenue impacted on account of falling crude oil prices (lowering realizations) and sluggishmarket conditions.
Export market impacted by delayed T&D orders from cash strapped commodity driven emergingeconomies.
Domestic market depicting positive signs, however lacks consistency.
Volumes for FY16 at 336,526 KL, up 2.6% from 328,123 in FY15.
EBITDA per KL, after forex adjustment for the year, increased significantly, driven by lower baseoil costs, sale of richer product mix, disciplined pricing and good client mix.
Figures in Rs Cr, Consolidated Financials

Apar Industries Limited Earnings Presentation | Q4 & FY16
12
* After adjusting open period forex
505
437
Revenue EBITDA
(Margin %)EBITDA (Rs per
KL)
Q4FY15
Q4FY16
14%30%30%
Volume (KL)EBITDA (post
adj*)EBITDA post
adj* (Rs per KL)
22 (4.3%)
42 (9.6%)
93%
2,530
4,719
87%
26 (5.2%)
41 (9.3%)
55%
3,048
4,561
50%
86,063
89,004
3.4%
Specialty Oils: Margins continue to be higher in Q4FY16
Revenue declined due to falling raw material prices.
However, volumes for the quarter up 3.4% at 89,004 KL, from 86,063 KL in Q4FY15, driven byrubber processing oil, auto lubricants and white oils.
EBITDA per KL, after forex adjustment for the quarter, increased 50% to reach Rs 4,561 per KL.Margins have normalised down through the year.
Setting up a port-based plant at Hamriyah, Sharjah, of 100,000 KL capacity at an investment of ~Rs 100 Cr . This will add new opportunities like bulk exports and is strategically located in terms ofproximity to customers.
Figures in Rs Cr, Consolidated Financials
Apar Industries Limited Earnings Presentation | Q4 & FY16
13
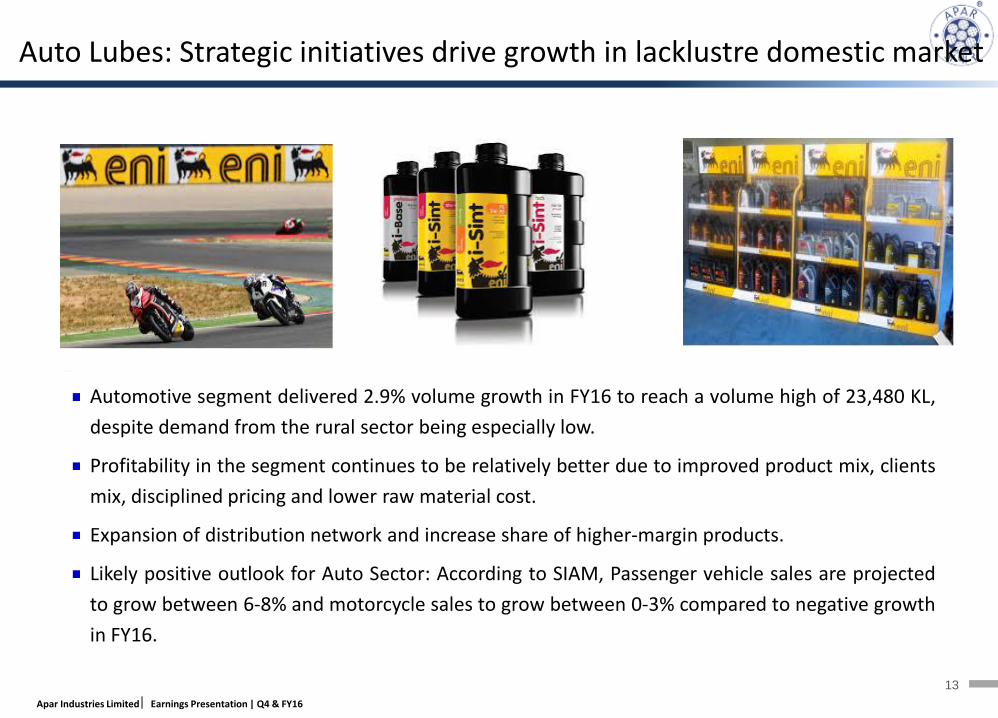
Auto Lubes: Strategic initiatives drive growth in lacklustre domestic market
Automotive segment delivered 2.9% volume growth in FY16 to reach a volume high of 23,480 KL,
despite demand from the rural sector being especially low.
Profitability in the segment continues to be relatively better due to improved product mix, clients
mix, disciplined pricing and lower raw material cost.
Expansion of distribution network and increase share of higher-margin products.
Likely positive outlook for Auto Sector: According to SIAM, Passenger vehicle sales are projected
to grow between 6-8% and motorcycle sales to grow between 0-3% compared to negative growth
in FY16.

Apar Industries Limited Earnings Presentation | Q4 & FY16
14
* After adjusting open period forex
FY15
FY16
Revenue
560
675
20%
EBITDA (Margin %)
34 (6.1%)
42 (6.2%)
22%
38 (5.7%)
31 (5.5%)
EBITDA (post adj*)
25%
Cables maintain strong growth with improved profitability
Revenue up 20% at Rs 675 Cr driven by Elastomeric and Power Cables segments. These segmentsgrew by 68% and 24%, respectively.
EBITDA margins post forex adjustment up 20 basis points from 5.5% in FY15 to 5.7% in FY16.
Apar strengthened its leadership position emerging as the largest manufacturer of wind and solarcables with increased ordering.
Power, Railways and Defence along with Wind and Solar sectors, will be the key drivers of futuregrowth.
Larger provisioning in books to address legacy residual contract execution issues.
Figures in Rs Cr, Consolidated Financials

Apar Industries Limited Earnings Presentation | Q4 & FY16
15
* After adjusting open period forex
Revenue EBITDA (Margin %) Order Book
Q4 FY15
Q4 FY16
172
195
13%
10 (6.1%)
9 (4.7%)
184
199
8%
9 (4.8%)
12 (6.8%)
EBITDA (post adj*)
13% 20%
Cables revenue up 13%, planning capex to fuel further growth
Revenue up 13% led by 52% & 35% growth in Elastomeric and Power Cables, respectively.
EBITDA margin, post forex adjustment, impacted due to one time write off of bad debts. EBITDAMargin excluding the one time write off is at 7%.
Order book as on March 31, 2016 up 8% to reach Rs 199 Cr versus Rs 184 Cr in the previous year.
With improving demand in power cables, Apar is operating at full capacity and is planning a capexinvestment to cater to the increasing demand and further increase the profitability.
Optical Fibre cable segment has subdued demand as the offtake from BSNL, BBNL and privatetelcos remains low.
Figures in Rs Cr, Consolidated Financials

Apar Industries Limited Earnings Presentation | Q4 & FY16
16
Financial Performance
Business Performance
Power Sector Overview
Annexure
Company Overview

Apar Industries Limited Earnings Presentation | Q4 & FY16
17
Dominating global presence in power transmission & distribution• 4th largest transformer oil manufacturer and among top 5 conductors manufacturer in the world
Diverse Portfolio• Over 400 types of specialty and automotive oils; largest range of conventional and new
generation conductors and a comprehensive range of power and telecommunication cables
Driving growth through innovation• Pioneer in adoption of new technologies and development of value added products creating new
market segments through in-house research & development programmes
Trusted by prominent customers• Multi-year relationships with Indian and global majors. Exports to 100 countries; plants
strategically located close to ports in India
Strong Alliances• Brand and manufacturing alliance with global energy leader ENI S.P.A Italy and technical alliance
with CTC Global (USA) for manufacture of new generation carbon composite conductors
Expanding growth canvas on the back of robust financials• Successfully entering and expanding new markets and business segments• 11% 5-year CAGR in revenues, 11% 5-year CAGR in EBITDA
Conductors
Transformer & Sp Oil
Cables
Auto Lubes
Global leader in Conductors & Transformer Oils

Apar Industries Limited Earnings Presentation | Q4 & FY16
18
Conductors Specialty Oils
Since 1969Since 1958
23% market shareTotal Capacity: 150,000MTASilvassa : 82,629MTUmbergaon : 20,868MTAthola : 46,000MT 50% revenue contribution
Transformer oil 45% market shareTotal Capacity:4,42,000KLRabale : 222,000KLSilvassa : 220,000 KL
36% revenue contribution
Cables
Since 2008
Acquired Uniflex in 2008Grew sales from Rs 129 Cr to Rs 675 Cr
13% revenue contribution 5% revenue contribution
Auto Lubes
Licensing Agreement with ENI, Italy for ENI brandSuccessful national rolloutRegistered sales of Rs 263 Cr in FY16
Since 2007
With established presence across diverse businesses

Apar Industries Limited Earnings Presentation | Q4 & FY16
19
Market Leader in key segments
Best in class technology &
diversified products
Strong relationships with large clientele
Strong export market
• Top 5 largest producer in conductors and Sp Oil in the world.
• 60% market share in power transformer oil and 40% in distribution transformer oil in India.
• Among largest bare overhead aluminum conductor manufacturers in India with market share of 23%.
• Technology tie up with CTC-Global, USA for ACCC conductors.
• Pioneer in Aluminum alloy rod and conductors in India.
• Manufactures over 400 different types of Specialty Oils.
• Launched India’s most advanced E-beam facility; will help make superior cables.
• Among first to test successfully 765KV & 800KV conductors in India.
• Best in class in-house R&D center and NABL accredited QC labs.
• Preferred supplier to over 80 % of its speciality oil customers in India.
• Product & plant approvals from many large clients across the globe.
• Supplies conductors to all top 25 global turnkey operators and leading utilities.
• Exports to over 100 countries across the world.
• Exports at 34% of total sales in FY16.
• Developed green field conductor plant in Athola with focus on exports.
• Largest Indian conductor exporter.
• Developing export market in new territories. Exported conductors to USA, EU, middle east, Africa and Latin America.
Diversified into new business for growth
• Entered Auto lubes in 2007 under ENI brand through Licensing Agreement with ENI Italy.
• Acquired Uniflex to enter Cables business.
• Has setup Electron Beam irradiation facility for cables and other products.
Competitive strengths

Apar Industries Limited Earnings Presentation | Q4 & FY16
20
Figures in Rs CrAchieved 11% Revenue CAGR driven by strong growth in Cables and Conductors business. .
1,326 1,363
2,195
1,650
2,318 2,550
FY11 FY12 FY13 FY14 FY15 FY16
14% CAGR
1,544
1,958 2,037
2,395 2,224
1,841
FY11 FY12 FY13 FY14 FY15 FY16
4% CAGR
315 355 404
569 556 675
FY11 FY12 FY13 FY14 FY15 FY16
16% CAGR
Consolidated Revenue
Conductors CablesSpecialty Oils
Maintained strong revenue growth over the years
Export, 34%
Domestic, 66%
Exports grew at 16% CAGRRevenue Geographic Break-up
3,0333,595
4,651 4,6325,122 5,080
FY11 FY12 FY13 FY14 FY15 FY16
11% CAGR
8141,095
1,400 1,570 1,825 1,7442,219
2,500
3,251 3,062 3,297 3,336
FY11 FY12 FY13 FY14 FY15 FY16
Exports Domestic
Apar Industries Limited Earnings Presentation | Q4 & FY16
21
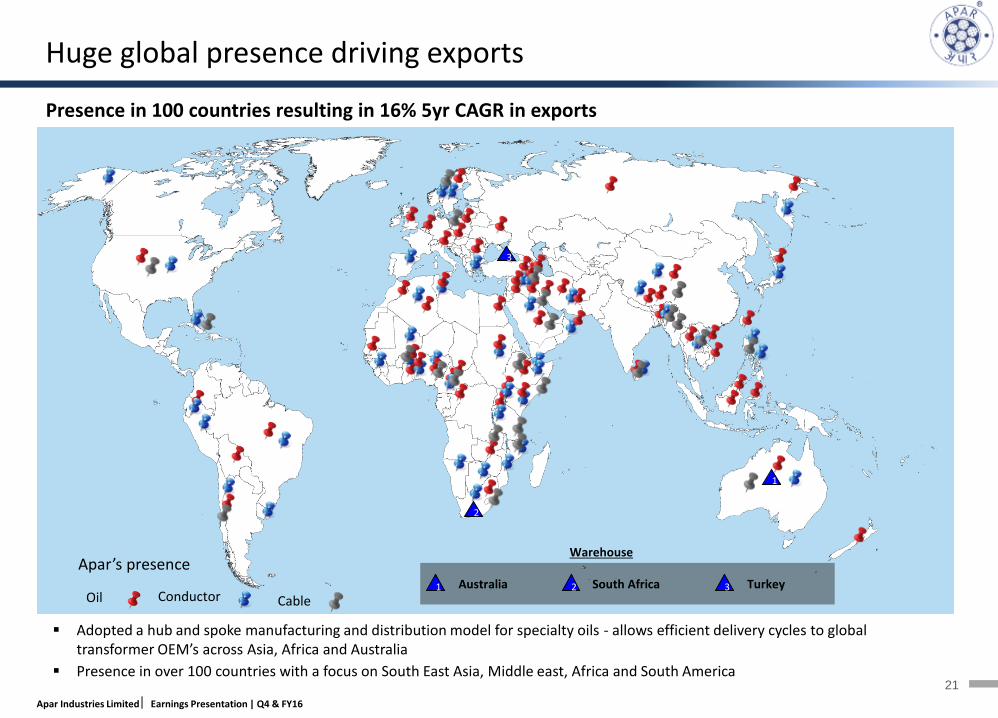
Presence in 100 countries resulting in 16% 5yr CAGR in exports
Warehouse
1 Australia 2 South Africa 3 Turkey
1
2
3
Apar’s presence
Oil Conductor
Adopted a hub and spoke manufacturing and distribution model for specialty oils - allows efficient delivery cycles to global transformer OEM’s across Asia, Africa and Australia
Presence in over 100 countries with a focus on South East Asia, Middle east, Africa and South America
Cable
Huge global presence driving exports

Apar Industries Limited Earnings Presentation | Q4 & FY16
22
Financial Performance
Business Performance
Company Overview
Financial OverviewAnnexure

Apar Industries Limited Earnings Presentation | Q4 & FY16
23
Q4 & FY16 : Profit & Loss Statement
Standalone Consolidated
Particulars (Rs Cr) Q4 FY16 Q4 FY15 % Chg
YoY Q3 FY16 % Chg QoQ FY16 FY15 % Chg YoY FY16 FY15 % Chg YoY
Net sales 1,316.8 1,323.8 (0.5%)
1,179.7 11.6% 4,978.3 4,968.7 0.2% 5,046.8 5,078.8 (0.6%)
Other Operating Income 8.2 14.2 (42.1%) 6.5 26.2% 31.6 42.3 (25.2%) 33.2 43.0 (22.8%)
Total Operating Income 1,325.0 1,338.0 (1.0%) 1,186.2 11.7% 5,010.0 5,011.0 (0.0%) 5,080.0 5,121.9 (0.8%)
Total Expenditure 1,234.2 1,293.6 (4.6%) 1,104.2 11.8% 4,654.3 4,769.7 (2.4%) 4,716.7 4,869.9 (3.1%)
Cost of Raw Materials 1,022.5 1,096.5 (6.7%) 878.3 16.4% 3,824.4 3,985.9 (4.1%) 3,881.8 4,085.1 (5.0%)
Employees Cost 22.5 17.5 28.6% 22.6 (0.4%) 90.7 70.0 29.6% 91.4 79.4 15.1%
Other Expenditure 189.5 179.6 5.5% 203.4 (6.8%) 739.7 713.8 3.6% 744.0 705.4 5.5%
Transfer to Capital Asset 0.3 0.0 NM 0.1 200.0% 0.5 0.0 NM 0.5 0.0 NMProfit from operations before other income, finance costs and exceptional items
90.8 44.4 104.4% 82.0 10.7% 355.6 241.2 47.4% 363.3 252.0 44.1%
Other Income 0.4 0.1 300.0% 1.7 (76.5%) 3.4 8.4 (59.5%) 3.4 1.8 88.9%
EBITDA 91.2 44.5 104.8% 83.7 8.9% 359.0 249.6 43.8% 366.7 253.8 44.5%
Depreciation 10.0 8.2 21.9% 9.5 5.3% 37.7 31.0 21.6% 37.8 31.2 21.0%
EBIT 81.2 36.3 123.8% 74.2 9.5% 321.3 218.6 47.0% 328.9 222.6 47.8%
Interest & Finance charges 21.1 16.4 28.7% 25.8 (18.2%) 83.8 65.4 28.0% 83.6 65.2 28.2%
Applicable net loss on foreign currency transactions and translation
7.2 5.5 30.9% 10.4 (30.8%) 67.8 84.7 (19.9%) 67.8 84.7 (19.9%)
Profit from ordinary activities after finance costs but before exceptional items
52.9 14.4 267% 38.0 39.2% 169.8 68.5 147.9% 177.5 72.7 144.1%
Exceptional items - 0.3 NM -43.2 NM -43.2 0.3 NM -43.2 0.2 NM
PBT 52.9 14.1 275.0% 81.2 (34.8%) 212.9 68.2 212.0% 220.7 72.5 204.4%
Tax Expense 16.0 5.0 220.0% 13.1 22.1% 55.9 20.4 174.0% 57.1 23.1 147.2%
Net Profit 36.9 9.2 301.1% 68.0 (45.8%) 157.0 47.9 228.0% 163.6 49.4 231.0%
Minority Interest (profit)/loss - - - - - - - - (0.8) 0.1 NM
Net Profit after taxes, minority interest
36.9 9.2 301.1% 68.0 (45.8%) 157.0 47.9 228.0% 162.8 49.5 228.9%

Apar Industries Limited Earnings Presentation | Q4 & FY16
24
Q4 & FY16 Key Ratios
Standalone Consolidated
Key Ratios (%) Q4 FY16 Q4 FY15 Q3 FY16 FY16 FY15 FY16 FY15
EBITDA Margin 6.9% 3.3% 7.1% 7.2% 5.0% 7.2% 5.0%
Net Margin 2.8% 0.7% 5.7% 3.1% 1.0% 3.2% 1.0%
Total Expenditure/ Total Operating Income 93.1% 96.7% 93.1% 92.9% 95.2% 92.8% 95.1%
Raw Material Cost/ Total Operating Income 77.2% 82.0% 74.0% 76.3% 79.5% 76.4% 79.8%
Staff Cost/ Total Operating Income 1.7% 1.3% 1.9% 1.8% 1.4% 1.8% 1.5%
Other Expenditure/ Total Operating Income 14.3% 13.4% 17.1% 14.8% 14.2% 14.6% 13.8%

Apar Industries Limited Earnings Presentation | Q4 & FY16
25
Consolidated Balance Sheet Statement – FY16
Balance Sheet FY16 FY15
LiabilitiesTotal Shareholder's Funds 859.3 729.8 Minority Interest 1.7 1.2
Non-current Liabilities:(a) Long-term borrowings 83.7 94.8 (b) Deferred tax liabilities (net) 31.3 27.4 (c) Other-long term liabilities 2.3 2.2 (d) Long-term provisions 3.5 4.0 Total Non-Current Liabilities 120.8 128.4
Current Liabilities:(a) Short-term borrowings 263.8 386.7 (b) Trade payables 1,405.5 1,573.0 (c) Other current liabilities 139.1 121.0 (d) Short-term provisions 2.4 15.8 Total Current Liabilities 1,810.8 2,096.5 Total Liabilities 2,792.6 2,955.9
AssetsTotal Non-Current Assets 530.5 449.6
Current Assets:(a) Current investments 109.1 5.3 (b) Inventories 774.9 944.3 (c) Trade receivables 1,088.8 1,267.0 (d) Cash and bank balances 137.0 100.5 (e) Short-term loans and advances 147.2 150.7 (f) Other current assets 5.1 38.6 Total Current Assets 2,262.1 2,506.3 Total Assets 2,792.6 2,955.9

Apar Industries Limited Earnings Presentation | Q4 & FY16
26
Q4 & FY16 : Segment Analysis
Standalone Consolidated
Segment (Rs Cr) Q4 FY16 Q4 FY15 %YoY Q3 FY16 % QoQ FY16 FY15% Chg
YoYFY16 FY15
% Chg YoY
Revenue Conductors 714.9 674.6 6.0% 542.0 31.9% 2,550.5 2,320.1 9.9% 2,550.5 2,320.1 9.9%Transformer & Specialty Oils 415.2 487.3 (14.8%) 434.8 (4.5%) 1,770.6 2,115.2 (16.3%) 1,840.6 2,251.0 (18.2%)Power & Telecom Cables 195.0 171.9 13.5% 205.9 (5.3%) 674.7 560.1 20.5% 674.7 560.1 20.5%
Others/Unallocated 5.6 5.8 (3.6%) 7.1 (21.1%) 28.4 23.4 21.4% 28.4 23.4 21.4%Total 1,330.8 1,339.6 -0.7% 1,189.8 11.9% 5,024.2 5,018.8 0.1% 5,094.2 5,154.6 (1.2%)Less: Inter - Segment Revenue 5.8 1.6 262.5% 3.6 61.1% 14.2 7.8 81.8% 14.2 32.7 (56.6%)Revenue from Operations 1,325.0 1,338.0 (1.0%) 1,186.2 11.7% 5,010.0 5,011.0 (0.0%) 5,080.0 5,121.9 (0.8%)Segment Results before Interest and Tax - - 0.0% - 0.0% - - 0.0% - - 0.0%Conductors 45.6 14.0 226.5% 25.1 81.9% 130.9 117.4 11.5% 130.9 117.4 11.5%Transformer & Specialty Oils 37.0 20.3 82.3% 41.4 (10.7%) 187.2 98.1 90.9% 194.8 102.1 90.8%Power and Telecom Cables 5.4 6.3 (14.3%) 13.5 (59.8%) 27.7 20.1 37.8% 27.7 20.1 37.8%
Others/Unallocated 0.7 0.5 40.0% 0.6 16.7% 2.3 2.1 9.5% 2.3 2.1 9.5%Total 88.7 41.1 115.9% 80.5 10.1% 348.1 237.6 46.5% 355.6 241.6 47.2%Less : Finance costs (net) 28.3 21.9 29.2% 36.2 (21.8%) 151.6 150.1 1.0% 151.4 149.9 1.0%Less : Unallocable expenditure net of income 7.5 5.0 50.0% -36.8 NM -16.4 19.3 NM -16.4 19.3 NMProfit before Tax 52.9 14.2 272.5% 81.2 (34.8%) 212.9 68.2 212.0% 220.6 72.5 204.5%Segment Results – % to Segment Revenue Conductors 6.4% 2.1% 4.6% 5.1% 5.1% 5.1% 5.1%Transformer & Specialty Oils 8.9% 4.2% 9.5% 10.6% 4.6% 10.6% 4.5%Power and Telecom Cables 2.8% 3.7% 6.5% 4.1% 3.6% 4.1% 3.6%Total 6.7% 3.1% 6.8% 6.9% 4.7% 7.0% 4.7%
Segment contribution- as % to total revenue
Q4 FY16 Q4 FY15 Q3 FY16 FY16 FY15 FY16 FY15
Conductors 53.7% 50.4% 45.6% 50.8% 46.2% 50.1% 45.0%Transformer & Specialty Oils 31.2% 36.4% 36.5% 35.2% 42.1% 36.1% 43.7%Power and Telecom Cables 14.7% 12.8% 17.3% 13.4% 11.2% 13.2% 10.9%
Apar Industries Limited Earnings Presentation | Q4 & FY16
27
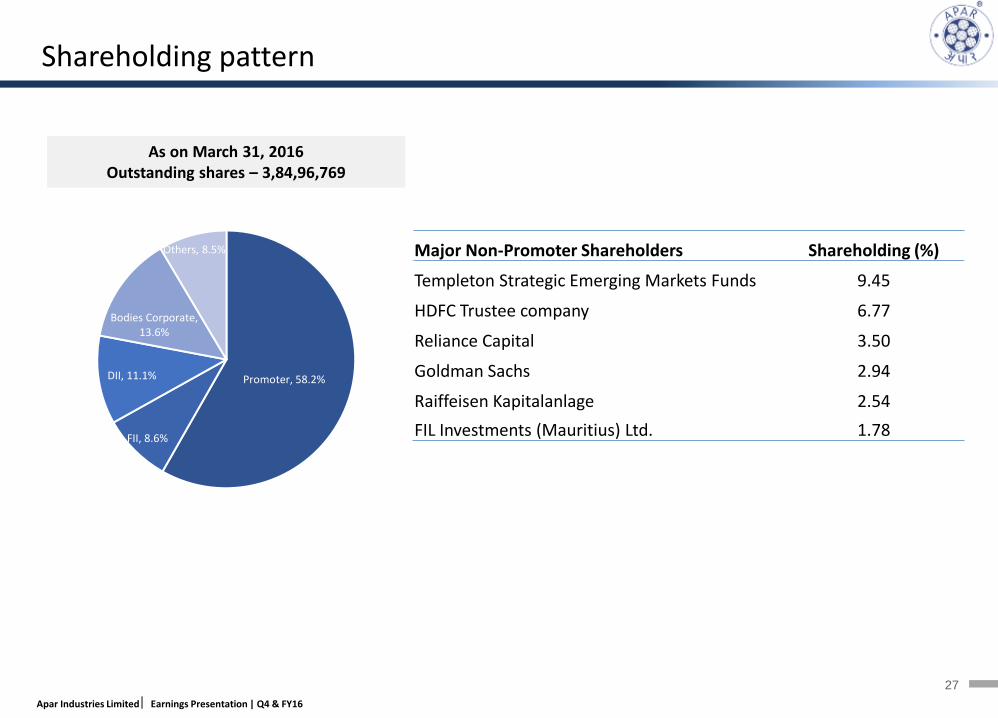
As on March 31, 2016Outstanding shares – 3,84,96,769
Promoter, 58.2%
FII, 8.6%
DII, 11.1%
Bodies Corporate, 13.6%
Others, 8.5% Major Non-Promoter Shareholders Shareholding (%)
Templeton Strategic Emerging Markets Funds 9.45
HDFC Trustee company 6.77
Reliance Capital 3.50
Goldman Sachs 2.94
Raiffeisen Kapitalanlage 2.54
FIL Investments (Mauritius) Ltd. 1.78
Shareholding pattern

Apar Industries Limited Earnings Presentation | Q4 & FY16
28
Contact us
For any Investor Relations queries, please contact:
Sanjaya KunderApar industries LtdPhone: +91 22 67800400Email: [email protected]
Nisha KakranPhone: +91 [email protected]
This presentation may have certain statements that may be “forward looking” including those relating to general business plans and strategy of Apar Industries
Ltd., its future outlook and growth prospects. The actual results may differ materially from these forward looking statements due to a number of risks and
uncertainties which could include future changes or developments in Apar Industries Ltd.(Apar), the competitive environment, the company’s ability to
implement its strategies and initiatives, respond to technological changes as well as sociopolitical, economic and regulatory conditions in India.
All financial data in this presentation is obtained from the audited financial statements and the various ratios are calculated based on these data. This
presentation does not constitute a prospectus, offering circular or offering memorandum or an offer, invitation or a solicitation of any offer, to purchase or sell,
any shares of Apar and should not be considered or construed in any manner whatsoever as a recommendation that any person should subscribe for or
purchase any of Apar’s shares. None of the projection, expectations, estimates or prospects in this presentation should be construed as a forecast implying any
indicative assurance or guarantee of future performance, nor that the assumptions on which such future projects, expectations, estimates or prospects have
been prepared are complete or comprehensive .
This presentation is for information purposes only. This document and its contents should not forwarded or delivered or transmitted in any manner to any
person other than its intended recipients, and should not be reproduced in any manner whatsoever. The recipients further represents and warrants that : (i) It is
lawfully able to receive this presentation under the laws of the jurisdiction in which it is located, and / or any other applicable laws, (ii) It is not a U.S. person,
(iii) This presentation is furnished to it, and has been received, outside of the United States, and (iv) It will not reproduce, publish, disclose, redistribute or
transmit this presentation, directly or indirectly, into the United States or to any U.S. person either within or outside of recipient’s organisation.
Safe Harbor:
Seema ShuklaPhone: +91 124 425 1443Gurgaon [email protected]