tomtom annual report and accounts 2020
TRANSCRIPT

Annual report and accounts 2019
TOMTOM
Annual report and accounts 2020

WE ARE TOMTOMMessage from the CEO . . . . . . . . . . . . . . . . . . . . . . . . . . . . . 3
At a glance . . . . . . . . . . . . . . . . . . . . . . . . . . . . . . . . . . . . . . . 5
Value creation model . . . . . . . . . . . . . . . . . . . . . . . . . . . . . . 6
Business model . . . . . . . . . . . . . . . . . . . . . . . . . . . . . . . . . . . . 7
Core technologies . . . . . . . . . . . . . . . . . . . . . . . . . . . . . . . . 11
Market trends and growth opportunities . . . . . . . . . . . .18
People and culture . . . . . . . . . . . . . . . . . . . . . . . . . . . . . . . .24
Corporate responsibility . . . . . . . . . . . . . . . . . . . . . . . . . . .29
Privacy and data governance . . . . . . . . . . . . . . . . . . . . . .36
Financial review . . . . . . . . . . . . . . . . . . . . . . . . . . . . . . . . . .37
Operational review . . . . . . . . . . . . . . . . . . . . . . . . . . . . . . .40
GOVERNANCECorporate governance . . . . . . . . . . . . . . . . . . . . . . . . . . . .42
Management Board . . . . . . . . . . . . . . . . . . . . . . . . . . . . . . .46
Supervisory Board . . . . . . . . . . . . . . . . . . . . . . . . . . . . . . . .49
Risk management and control . . . . . . . . . . . . . . . . . . . . .53
Investor relations . . . . . . . . . . . . . . . . . . . . . . . . . . . . . . . .59
Management Board statements . . . . . . . . . . . . . . . . . . .60
Supervisory Board report . . . . . . . . . . . . . . . . . . . . . . . . . .62
Remuneration report . . . . . . . . . . . . . . . . . . . . . . . . . . . . .67
Supervisory Board statements . . . . . . . . . . . . . . . . . . . . .79
FINANCIALSCONSOLIDATED FINANCIAL STATEMENTSConsolidated statement of income . . . . . . . . . . . . . . . . .81
Consolidated statement of comprehensive income . . .82
Consolidated balance sheet . . . . . . . . . . . . . . . . . . . . . . . .83
Consolidated statement of cash flows . . . . . . . . . . . . . .84
Consolidated statement of changes in equity . . . . . . . .85
Notes to the consolidated financial statements . . . . .86
COMPANY FINANCIAL STATEMENTSCompany statement of income . . . . . . . . . . . . . . . . . . . .119
Company balance sheet . . . . . . . . . . . . . . . . . . . . . . . . . .120
Notes to the company financial statements . . . . . . . .121
OTHER INFORMATIONOther information . . . . . . . . . . . . . . . . . . . . . . . . . . . . . . .123
Independent auditor's report . . . . . . . . . . . . . . . . . . . . .124
SUPPLEMENTARY INFORMATIONQuarterly overview 2020 . . . . . . . . . . . . . . . . . . . . . . . . .130
Definitions and abbreviations . . . . . . . . . . . . . . . . . . . . .132
Non-GAAP measures . . . . . . . . . . . . . . . . . . . . . . . . . . . . .133
Forward-looking statements . . . . . . . . . . . . . . . . . . . . . .134
1
Table of contents

Message from the CEO . . . . . . . . . . . . . . . . . . . . . . . . . . . . . 3
At a glance . . . . . . . . . . . . . . . . . . . . . . . . . . . . . . . . . . . . . . . 5
Value creation model . . . . . . . . . . . . . . . . . . . . . . . . . . . . . . 6
Business model . . . . . . . . . . . . . . . . . . . . . . . . . . . . . . . . . . . . 7
Core technologies . . . . . . . . . . . . . . . . . . . . . . . . . . . . . . . . 11
Market trends and growth opportunities . . . . . . . . . . . .18
People and culture . . . . . . . . . . . . . . . . . . . . . . . . . . . . . . . .24
Corporate responsibility . . . . . . . . . . . . . . . . . . . . . . . . . . .29
Privacy and data governance . . . . . . . . . . . . . . . . . . . . . .36
Financial review . . . . . . . . . . . . . . . . . . . . . . . . . . . . . . . . . .37
Operational review . . . . . . . . . . . . . . . . . . . . . . . . . . . . . . .40
WE ARE TOMTOM
2

DEAR STAKEHOLDERS, 2020 has been a turbulent year for most people around the world . COVID-19 continues to impact people's daily lives and has disrupted the global economy . The pandemic's consequences will remain a challenge for many industries including our own .
The health and safety of our employees and partners has been our highest priority throughout the year . At the beginning of the outbreak, we acted swiftly and decisively to enable remote working . As a global company that is used to working across multiple locations and time zones, we quickly embraced this new way of doing business . I am proud of how our employees were able to handle this situation . We experienced no material loss in productivity and continued to offer the same high customer service levels that our customers expect .
Throughout the pandemic, traffic information revealed insights into the spread of, and recovery from, COVID-19 . By looking at traffic patterns using the TomTom Traffic Index, cities and governments were able to analyze how populations reacted to lockdowns and better plan for the longer-term effects on mobility . Having received hundreds of requests for traffic data, I am pleased we are able to play an important role in shaping the future of mobility .
To improve our competitive position, we maintained our engineering capacity and kept our commitment to research and development; continued developing our connected navigation products; implemented improvements to our Maps APIs; and invested further in our mapmaking platform to produce and deliver better maps, faster and at a lower cost per edit – cementing our position as a leading mapmaker now and into the future .
€392 million Location Technology revenue (2019: €426 million)
€1 .8 billion Automotive backlog (2019: €1 .8 billion)
€372 million Net cash position (2019: €437 million)
3
MESSAGE FROM THE CEO
“ I am proud of what we achieved in 2020, and of our resilience as we maintained our course through a year of uncertainties.”HAROLD GODDIJNCHIEF EXECUTIVE OFFICER, TOMTOM NV

FOR MORE INFORMATIONOur companytomtom .com/company
In addition to our location technologies and reputation for delivering a strong user experience, our independent nature as a global mapmaker continues to differentiate us from the competition . Being independent enables us to work with companies across the automotive and technology industries, paving the way for more partnerships in an increasingly complex and competitive ecosystem . Importantly, we uphold strong data governance and an uncompromising commitment to data privacy in everything we do .
I am proud of what we achieved in 2020, and of our resilience as we maintained our course through a year of uncertainties . I would like to thank all our stakeholders: our shareholders for their continued support and confidence in TomTom; our customers for their loyalty and valuable feedback that helps us further improve our services; and our employees for quickly adapting to new ways of working, and for contributing with passion, creativity, and energy to make our business successful .
Even though this year launched the world into many new directions, our mission remains to create the most innovative location technologies for a safer, cleaner, congestion-free world .
HAROLD GODDIJNCHIEF EXECUTIVE OFFICER, TOMTOM NV
We successfully grew our Enterprise revenue, extending our relationships with Verizon and Uber . In Automotive, we announced new agreements with carmakers such as Fiat Chrysler Automobiles (FCA) and Subaru, further expanding our footprint . We continue to see a trend of location technologies being offered online, allowing for faster cycle times, ease of integration, and flexibility . This creates opportunities to broaden our reach in Enterprise and improve our offering in Automotive even further . The competition we face in both markets is intensifying, but we have gained good traction with our online products in 2020 – a clear sign that our customers see us as a partner for a truly connected future .
With the launch of TomTom RoadCheck, we became the first to offer carmakers a complete mapping service for safer automated driving . RoadCheck is a first-of-its-kind product for automated vehicles, enabling carmakers to control where automated driving functions can be activated safely .
4
MESSAGE FROM THE CEO CONTINUED

TomTom technologies help to solve the challenges of climate change and road-related accidents by changing the way people move . That’s what motivates us to create and refine products that are designed to accelerate the adoption of automated, connected and electric driving .
We are founder-led and headquartered in Amsterdam with offices in 26 countries . Every day, our talented team of 4,500 diverse individuals are creating the location technologies relied upon by hundreds of millions of drivers, businesses, governments and authorities around the world .
Today, from cloud to mobility, analytics and smart cities, we harness location data to empower businesses, governments and developers to create groundbreaking location-aware technologies .
Our technologies are a vehicle for us to take on bigger challenges . Rather than accept road accidents, emissions and traffic congestion as facts of life, we are actively working to solve these issues that affect us all .
We have become a trusted partner for innovative and future-proof navigation technology for the global automotive and technology industry .
OUR AMBITIONOur ambition is to be a leading location technology specialist, shaping mobility with location-based products and services, including maps, navigation software, real-time traffic and other services .
OUR STRATEGYOur strategy is to provide our customers and their users with a location platform with the most up-to-date and relevant geographic content and mobility technologies, including maps, navigation software, connected services and APIs, for their applications .
TomTom offices
COUNTRIES
26OFFICES
35
Asia PacificEMEAAmericas
7% 66% 27%
TomTom HQ, Amsterdam
EMPLOYEES BY REGION
4 .5 thousand employees
OUR HISTORYFounded in 1991, we have grown from a Dutch-based start-up into the world's leading independent location technology specialist .
What started with software development for business-to-business mobile applications and personal digital assistants for consumers led to the creation of a new product: the portable navigation device (PND) .
The PND became the fastest-selling consumer technology device in history meeting a demand for an all-in-one, easy-to-use, portable navigation solution .
5
Accelerating the future of mobility
AT A GLANCE
4,500 employees in 37 countries17,500 learning modules offered
2,500 employees in R&D in 28 locations45 applications for new patents and designs€318m research and development cash spend
People
Intellectual
8 hours per Netherlands employee availablePublicly available traffic information databaseProducts aimed at electric vehiclesProducts aimed at road safety
Social and environmental
€437m net cash position at the beginning of the year
FinancialLocation Technology revenue of €392m
Automotive backlog of €1.8 billion (2019: €1.8 billion)Equity FCF yield of -2.4% (2019: 5.3%)
Total free cash flow -€26.5m
Input Output
Creating location technologies for a safer, cleaner, congestion-free
world
better maps, faster at lower cost
accelerate
onlin
e
empl
oyer
of choice
Improving road safety
Reducing emissions
Fostering equalit
y
Giv
ing
back
to so
ciety
Ethical business
2,051 patents and designs at year-end (2019: 1,921)172 patents granted in 2020 (2019: 245)
321 patents and designs pending at year-end (2019: 401)
Over 2,500 media coverage of TomTom Traffic IndexLaunched TomTom Hazard Warnings
Launched TomTom RoadCheck
Partnered with Delphi Technologies to reduce emissions
9% voluntary turnover (2019: 6%)18% job offers accepted by internal canditates (2019: 15%)
28% female workforce (2019: 29%)15,705 hours viewed on LinkedIn Learning (2019: 24,000)
80 nationalities in workforce (2019: 80)
People
Intellectual
Social and environmental
Financial
enhance product portfolio
How we create valuePeople
CustomersSuppliersSociety
Shareholders
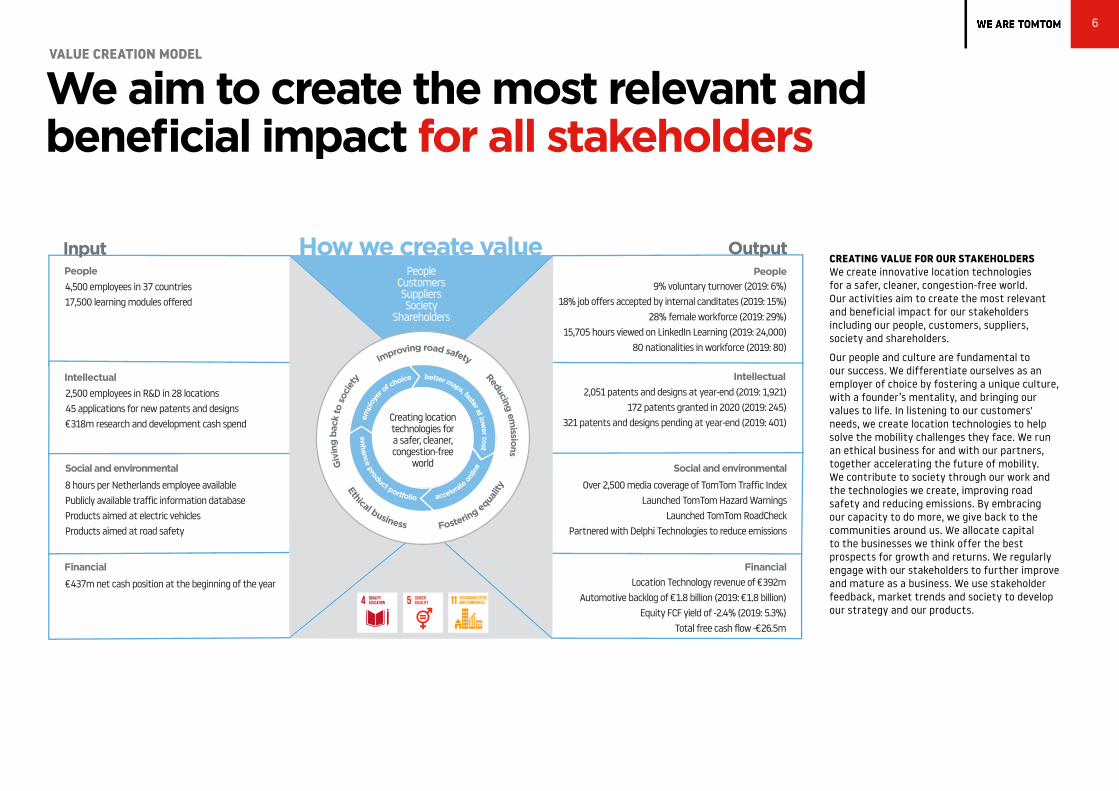
CREATING VALUE FOR OUR STAKEHOLDERSWe create innovative location technologies for a safer, cleaner, congestion-free world . Our activities aim to create the most relevant and beneficial impact for our stakeholders including our people, customers, suppliers, society and shareholders .
Our people and culture are fundamental to our success . We differentiate ourselves as an employer of choice by fostering a unique culture, with a founder’s mentality, and bringing our values to life . In listening to our customers' needs, we create location technologies to help solve the mobility challenges they face . We run an ethical business for and with our partners, together accelerating the future of mobility . We contribute to society through our work and the technologies we create, improving road safety and reducing emissions . By embracing our capacity to do more, we give back to the communities around us . We allocate capital to the businesses we think offer the best prospects for growth and returns . We regularly engage with our stakeholders to further improve and mature as a business . We use stakeholder feedback, market trends and society to develop our strategy and our products .
6
We aim to create the most relevant and beneficial impact for all stakeholders
VALUE CREATION MODEL

OUR CORE ACTIVITIESAs a leading independent location technology specialist, we roll decades of experience into the world’s most innovative mobility technologies – navigation software for multiple car brands, APIs and SDKs for leading technology companies, maps for navigation, and traffic and hazards data for all .
By combining our products and experience with leading business and technology partners, we power connected vehicles, smart mobility and automated driving .
Location data is central to all our products and services, and our data comes from multiple sources . Dealing with big data to develop our products and services requires advanced, scalable and state-of-the-art technology . We power our mapmaking with a proprietary transactional mapmaking platform .
Our platform supports the whole process of collecting, analyzing, fusing and editing data, as well as developing and distributing our products through various formats .
7
Solving the world’s mobility challenges
BUSINESS MODEL

OUR TARGET MARKETSOur activities are organized in two segments: Location Technology and Consumer . These segments leverage our brand, insights and common location technology assets to provide businesses, consumers, governments and local authorities with industry-leading location-based products and services .
Location TechnologyWithin our Location Technology segment we provide maps, navigation software and services to be integrated into customers’ applications, through two sales channels: Automotive and Enterprise .
We offer our products in a flexible way and, when combined, they create the most advanced navigation system available today .
Our products hold the same promise for customers as for their end-users: uncompromising quality, continuous innovation, ease of use and reduced complexity .
> Automotive licenses data, software and service components to automotive customers – both carmakers, known as original equipment manufacturers (OEMs), and hardware vendors, known as Tier 1 suppliers . These components are integrated in embedded and online navigation systems, mobile applications, advanced driver assistance systems and automated driving .
> Enterprise licenses maps and traffic data and service components such as APIs and SDKs for location-enabled applications to some of the world’s most innovative companies, including fleet and logistics software providers, on-demand service providers, web and mobile application developers, cloud service providers, and location-intelligence platforms .
ConsumerOur Consumer business offers drivers navigation, including: directions, guidance, and information about the road ahead .
Our consumer products are offered in the form of portable navigation devices and mobile applications, which help people make smarter decisions while driving, getting them to where they want to be effortlessly, quickly and safely .
8
BUSINESS MODEL CONTINUED

OUR STRATEGIC PRIORITIESOur strategy is to provide our customers and their users with a location platform that provides the most up-to-date and relevant geographic content and mobility technologies, including maps, navigation software, and connected services, for their applications .
We will do this by focusing on the following strategic priorities .
Better maps faster, at lower costThe productivity and cost efficiency of our map production platform is crucial to our future, as even more data will be collected and faster processing will be mandatory in order to meet the demands of an ever-expanding connected world, with users demanding online maps that are more accurate and always up-to-date .
We need to create and maintain our location data in near real-time and in the most cost-efficient way without compromising on quality . This can be achieved by scaling operations by collecting data from more global and standardized sources and by accelerating automation in applying and processing quality checks . This approach will result in faster cycle times and lower operational costs .
We aim to further develop the automation aspect of our transactional mapmaking platform through our investments in artificial intelligence and machine learning, which will enable us to create better content, faster and at a lower cost .
Accelerate onlineMore and more, drivers demand connected in-vehicle services that are from a user experience perspective, at least on par with smartphone apps . In order to be truly mobile competitive we need to ensure that our services are easily accessible . An increasingly online future allows us to react and move faster, to build better products, and to deliver innovations to our customers sooner .
We need to ensure that our products and services are running efficiently in cloud-based platforms, making them easy to access .
Enhance product portfolioWe have built a leading proprietary mapmaking platform . In order to create operating leverage and maximize the value of this platform, we need to continue to develop innovative products that our customers need to use in their applications .
These innovative products need to be supplied in standard formats to enable easy integration by customers for their uses, and the variety and quality of the products on offer needs to be at the correct level to promote customer satisfaction .
Employer of choiceAs innovation is at the heart of what we do, our priority is to ensure that we attract and retain the right people we need to innovate and grow our business .
We need to differentiate ourselves as an employer of choice by fostering a unique culture with a founder's mentality, bringing our values to life and keeping our edge in the highly competitive world of tech-talent acquisition .
9
BUSINESS MODEL CONTINUED

OUR COMPETITIVE ADVANTAGESWe are a truly independent global mapmaker .
Since changing the way people drive, we have never stopped thinking about how we can improve how the world moves . This has allowed us to further build on our expertise in big data and offer ever better products and services related to maps, navigation software and services .
IndependentWe are one of the few independent location technology companies in the market, uniquely positioned to work with any partner, across both the automotive and technology industries .
The independent nature of our company allows us to put our customers first, giving them the freedom to innovate . The data we collect is used solely to improve our products and services; it is not used to feed alternative business models which may be in competition with our customers .
With our maps, navigation software and services, we enable our customers to deliver best-in-class location and navigation products that meet the demand in their own markets .
Strong data governanceOur long-term success depends on capturing data to continuously improve our products and services . User trust is therefore paramount . We adhere to the strictest data protection laws and apply a privacy-by-design approach that ensures that the full life-cycle of our products and services designed to enable user privacy and control over their personal data . We are committed to creating great products and a better future – without compromising personal data .
Extensive market expertise in location dataThe process of mapmaking at scale is complex and in order to make good quality location-based products, large amounts of location data is needed .
We have been collecting, processing and maintaining large volumes of data for decades . Our experience dealing with big data, combined with our proprietary transactional mapmaking platform enables us to provide an extensive database of geographical data that is constantly updated at a high level of quality .
Strong user experience knowledgeWe disrupted the industry and created a new market category when we introduced the portable navigation device – one of the most influential products of all time – establishing in the process a powerful technology brand with strong user experience knowledge in the driver navigation space .
Over the decades we have built a massive community of drivers across the globe . This community informs everything we do today, allowing us to put drivers' needs at the heart of everything we create .
Multiple collaborations in complex ecosystemsWe have paved the way for significant collaborations with leading technology and automotive companies .
In the last few years, we have established collaborations with, among others, Apple, Chrysler, Delphi, Denso, Fiat, Microsoft, Uber and Verizon . We also work directly with the research and development departments of OEMs, such as Groupe PSA and FCA for advanced use cases that include ADAS and electric vehicles .
10
BUSINESS MODEL CONTINUED

MAP PRODUCTION PLATFORMOur state-of-the-art transactional map production platform is capable of handling enormous amounts of data, allowing us to rapidly close the loop between detecting changes in the real world and updating our maps .
We believe in a multi-source approach to mapmaking, as having a broad range of data sources contributes to more accurate and up-to-date location content .
Examples of global data sources are: high-resolution satellite data, input from survey vehicles, point of interest (POI) data from global online business partners, probe data and crowdsourced data derived from TomTom and partner applications . We have also increased the application of advanced vehicle sensor data for change detection and validation .
Partners such as Uber collaborate with us to contribute to our platform through map editing partnerships (MEPs) .
Partnerships like these create a flywheel effect as our customers can feed back their real-world observations from driving with our products directly into our platform, further enhancing the freshness of our data and improving the customer experience . We provide the map editing tools and training needed for this .
Our platform deploys automation and artificial intelligence, such as machine learning, to achieve shorter map update cycle times, enhancing efficiency and quality . We continue to invest and further develop our platform to achieve even greater gains in efficiency and quality .
Research and Development (R&D) remains essential for our long-term aspirations . In 2020, cash R&D spend totaled €318 million . Over 50% of our employees work in technology roles, distributed in 28 locations globally .
> >600 million connected devices contributing to location data .
> 3 .5 billion km of live trip data collected every day, equivalent to 70 million driving hours .
> 2 .8 trillion km of trip data archived since 2008, equivalent to 580 billion driving hours .
KEY FIGURES
11
Our mission is to create technologies that help shape tomorrow’s mobility
CORE TECHNOLOGIES

GEOGRAPHICAL DATAHigh-quality, comprehensive location data is key in building the next generation of location-based applications .
Location data is also central to all our products and services . In nearly three decades of mapmaking, we have created our own extensive digital geographical database which contains our own proprietary map data .
Our location data includes location data used in Standard Definition (SD), Advanced Driver Assistance (ADAS) and High Definition (HD) maps as well as traffic and speed camera data . All of this can be combined to create products and services for business customers with a variety of location-based applications .
RoadDNAOne of the challenges facing automated driving is accurately determining the exact location of a vehicle on a roadway in a sufficient level of detail . Traditional GPS solutions fail to deliver the accuracy and robustness needed for automated driving, therefore, TomTom developed RoadDNA, an innovative product that addresses the localization challenge .
Our RoadDNA suite is a set of localization data, tailored to each type of sensor . This allows a vehicle to correlate RoadDNA data with data obtained by its own sensors in real-time to position itself on the road with centimeter level accuracy, even while traveling at high speeds .
By offering a broad suite of RoadDNA localization data, we give our customers the freedom to use different sensors and different localization techniques, enabling OEMs to achieve precise localization in a robust and scalable manner .
DATA COVERAGE
> Our global SD Map covers over 72 million km of roads, over 517 million address points and over 139 million POIs .
> Our ADAS Map covers over 6 .7 million km of roads across all continents .
> Our HD Map covers over 500 thousand km of roads across Europe, the US and East Asia .
12
CORE TECHNOLOGIES CONTINUED

LOCATION-BASED PRODUCTS AND SERVICESIn order to maximize value from our proprietary map production platform and geographical data, we have built a suite of products and services around four key categories:
APIs
CONNECTED SERVICES
NAVIGATION
MAPS
13
CORE TECHNOLOGIES CONTINUED

DIFFERENT MAPS FOR DIFFERENT NEEDS
MapsBased on our global geographical database, we provide SD maps for navigation, ADAS maps for assisted driving and HD maps for automated driving .
We also license uncompiled map data and provide customers easy online access to this data through our Maps APIs suite . We offer Maps SDKs that allow customers and developers to easily integrate our Maps APIs into their products and services for web and mobile applications .
SD maps for navigation Our SD map is built for navigation and consists of layers of information, starting with a navigable road network . The map data also includes routing guidance, speed limits, components for search, such as addressing and points of interest, and display .
> Used in infotainment systems for search, routing, visualization and turn-by-turn navigation .
> Features road geometry, restrictions, POIs, addresses, including house number ranges and address points, speed limits, and small scale and large scale features to enhance the visualization .
> A complete set of physical restrictions (i .e ., width, length, weight, etc .) relevant for truck navigation, traffic flow restrictions, truck city bans, regulations regarding transportation of dangerous goods, etc .
> Built using mobile mapping vans, field surveys, data sourced from partners and governments, and probe data .
> Data accuracy: ±1 to 20 meters .
ADAS maps for assisted drivingOur map for assisted driving includes map attributes such as road gradient, curvature, speed limit and other traffic signs . These attributes fulfill a broad range of applications that increase comfort, safety and fuel efficiency today . Current customer use cases include Predictive Powertrain Control, Highway Pilot and Intelligent Speed Assist .
> Used in advanced driver assistance systems for increased safety, comfort and fuel efficiency .
> Features road curvature, gradient, lane information, traffic signs and speed limits .
> Built using vehicle sensor data, mobile mapping vans and government sources .
> Data accuracy: centimeter-level accuracy .
HD maps for automated drivingOur map for automated driving allows self-driving vehicles to safely and precisely locate themselves on the road, build a detailed model of the surrounding environment together with the vehicle sensors, and plan the path to their destination .
> Used in automated driving for precise localization, smoother path planning and improved sensor perception .
> Features lane level geometry, localization features, road markings, road edges and barriers, and road and traffic signs .
> Built using vehicle sensor data, mobile mapping vans and government sources .
> Data accuracy: centimeter-level accuracy .
To make automated driving (AD) safer and more widespread, carmakers need to overcome several key challenges . One of the biggest challenges is defining the list of conditions under which their automated vehicle can safely operate . This is referred to as the operational design domain (ODD) .
TomTom RoadCheck is a tool designed for carmakers to overcome the challenge of managing the ODD by determining when, where and under what conditions their vehicles can safely activate automated driving functions . It is an industry first, using highly detailed TomTom HD Map data to help define the ODD of an automated vehicle, ultimately making roads safer for all drivers .
CONTRIBUTING TO A SAFER WORLD
AUTOSTREAMChanges on roads happen every day . We developed TomTom AutoStream to deliver the most up-to-date map from the cloud to the vehicle in real-time .
TomTom AutoStream is on demand, with minimal latency and bandwidth . It comes as a full solution, including an on-board software component with smart logic to reduce complexity, and shorten development time for OEMs and Tier 1 suppliers .
MAPS
14
CORE TECHNOLOGIES CONTINUED

NavigationWe provide a complete portfolio of navigation services, designed to benefit both drivers and carmakers . Leading automotive companies around the world choose us to power their vehicles’ in-vehicle navigation systems .
Our services are easy to integrate and can be configured to fit any car . Moreover, through our customization options we enable carmakers around the globe to secure their brand identities by enabling them to create a unique look and feel for their solutions . At the same time, through driver-focused design, we give end-users everything they need thanks to a comfortable and safe navigation experience .
NavKit, our navigation engine, is the foundation of many of our products, serving customers across our organization . We have been providing connected navigation for years and have now taken it to the next level by moving our services fully online, ensuring drivers always have the most up-to-date map and software .
NavKit offers a seamless driver experience that combines extensive cloud capability with smart on-board logic . As a result our navigation remains reliable independent of connectivity status . When necessary, the system falls back to onboard software and maps .
The driver experience is enriched by our real-time traffic and connected services providing drivers with the most reliable information for worry-free journeys .
NAVIGATION
15
CORE TECHNOLOGIES CONTINUED

Connected servicesOur extensive portfolio of cloud-based services provide a real-time value-added layer to our mapping technology . These services include:
> real-time traffic;
> speed cameras;
> electric vehicle charging stations;
> parking;
> fuel price information; and
> weather .
These connected services are widely used across automotive and smartphone manufacturers, smart mobility platforms, application developers, government organizations, and a wealth of additional customers . Our comprehensive product portfolio also offers road data analytics to help improve mobility through products and services that enable better decision-making on the road and the ability to plan ahead .
REAL-TIME TRAFFICOur industry-leading traffic service, TomTom Traffic, provides drivers with highly accurate, real-time measurements of traffic jams and delays for better route calculation, Estimated Time of Arrival (ETA), and dynamic safety content such as jam tail warnings .
We use a wide range of sources to generate traffic information . Our growing community of over 600 million connected devices highlights the success of our services . These data sources generate over 60 billion anonymous location measurements every day . We fuse the community input’s source data to provide precise, up-to-date traffic information for all major road classes on a global scale .
Our traffic technology combines both traffic flow and incident data from all available sources into a single database, equipping road users with the most relevant and up-to-date information .
ELECTRIC VEHICLE CHARGING STATIONSThis service is dedicated to supporting car manufacturers' transition towards electric vehicles (EV) . The service gives drivers an overview of available charging stations, and can be integrated into an embedded navigation system or any web or smartphone app . This reduces range anxiety, one of the main barriers of purchasing an electric vehicle . We source EV charging station information data from leading third parties and integrate it with our maps to offer one globally consistent database .
Hazards come in all forms . In a rural area, there might be a tree blocking the road around the next corner . In the city, a traffic jam three kilometers up the road may have a jam tail that isn’t registered on the map .
Our new TomTom’s Hazards Service, launched in 2020, uses real-time information to notify both drivers and automated vehicles about potentially dangerous upcoming traffic, road and weather conditions .
With TomTom Hazard Warnings, drivers can safely navigate the road ahead, no matter what types of incidents they come across . Using a market first push service, the highest feature set and largest probe network on the market – we are creating a safer road for all . The first equipped series production vehicles will already be on the road in 2021 .
CONTRIBUTING TO A SAFER WORLD
CONNECTED SERVICES
16
CORE TECHNOLOGIES CONTINUED

CONTRIBUTING TO A WORLD WITH LESS EMISSIONS
APIsHigh-quality, comprehensive location data is key in building the next generation of location-based applications . We give customers easy access to a wide array of services through our suite of APIs . This allows users to easily gain access to bits and pieces of content as needed online, to launch their applications with speed .
Our SDKs allow customers and developers to easily integrate our APIs into their products and services for web and mobile application . We have a suite of APIs available in the following product categories:
APIs
A main barrier to wide-scale EV adoption is range anxiety, the fear of running out of power on a journey and not being able to find a charging point .
Elevation, weather, traffic and most of all, speed, all play a role in an EV’s achievable range on a single charge . When planning a route, it is vital to know the driving conditions on the day and the style of the driver sitting behind the wheel . Knowing this information in advance is vital to strategic and safe route planning .
> Maps Maps includes our Map Display API and Map Styler, where users can add static and interactive, customizable maps to be displayed with reliable and extensive map coverage .
> Traffic Our Traffic API enables users to display and visualize traffic flow, traffic jams, incident type, road closures and additional traffic details .
> Directions Directions includes our Routing API and Extended Routing API, which enable users to plan multiple routes and get directions and accurate ETAs based on historical and real-time traffic conditions for cars, trucks and electric vehicles .
> Tracking Tracking includes our Geofencing API, Location History API and Notification API, allowing users to define virtual boundaries and check if tracked assets are inside or outside of them, store and retrieve the location and movements of assets being tracked and get alerts whenever an asset passes through a geofence .
> Places Places include our Search API and Extended Search API where users can add a search box to their app or website and get access to millions of places globally . Users can easily get longitude and latitude information from an address or vice versa and add millions of detailed points of interest information such as reviews, ratings, price ranges and photos .
Our Extended Routing API and Extended Search API are designed to help EV drivers forget about range-related worries . We do this by providing the best way to reach any destination, within or beyond a vehicle’s range . Through our EV Charging Stations Availability API we help the driver choose the best time and place for charging, based on availability, charging speed and user preferences .
Providing accurate range information is therefore essential to accelerate EV adoption and removing barriers to EV adoption contributes to achieving a future with less emission from driving .
> Real-time traffic information service available in 79 countries .
> Over 380 thousand EV charging points in 54 countries .
> Weather information available in 158 countries .
> On-Street Parking information available in 114 cities in 21 countries .
> Off-Street Parking information available in more than 80 countries .
KEY FIGURES
17
CORE TECHNOLOGIES CONTINUED

Technological innovation is driving a mobility revolution . Major shifts towards a fully automated, connected and electrified mobility landscape are generating great market opportunities . Our strategy is to grow our business by providing our customers and end-users with the most up-to-date and relevant map content for their applications or to simply find their way on the road . To achieve this, we continue to develop our best-in-class mapmaking platform, and strengthen and expand our product portfolio . TomTom is well-positioned to generate value from the main market trends shaping our industry:
18
CONNECTED AUTOMATED SHARED AND ELECTRIC (CASE)
SAFETY
INTERNET OF THINGS (IoT)
MARKET TRENDS AND GROWTH OPPORTUNITIES
We are excited about the trends that are shaping our industry and which provide us with significant growth opportunities

CASEThe way in which we move within urban areas will change in the future . We will see more Connected, Automated, Shared mobility and Electric services, and other intermodal methods of transportation . All of which require highly detailed and accurate maps .
CONNECTEDDrivers demand increasingly connected, online in-vehicle services that are on par with smartphones and apps . The market is shifting in response to this need, with connectivity, enabling drivers to expand their connected digital lives to their vehicles through in-vehicle navigation and infotainment systems .
More than a quarter of new car sales today are from connected vehicles – with close to 100 million new cars produced every year, 40 million in Europe and North America alone .
AUTOMATEDAutomated driving technology is generating interest in new, detailed maps that will help transform the way we drive .
The journey to fully automated driving is developing along a six-level scale, evolving from level 0, where the driver is in full control, to level 5, where the vehicle is in full control . Across all levels from 1 to level 5, vehicles require maps that are significantly different from the maps used for driver navigation .
As the driving task shifts from the driver to the vehicle, the map must shift to serve a machine instead of a human .
SHAREDMobility is increasingly shared and being offered as a service . This change in consumer preference is driven by a variety of factors, including lower costs, increased convenience and a desire to reduce pollution .
Individuals can now participate in mobility-as-a-service business models and benefit from the convenience of having a private vehicle without the associated cost and responsibilities of vehicle ownership .
Shared mobility also has a potential to reduce congestion within cities, as the number of cars per commuter decreases .
ELECTRICRising pollution levels and the need to reduce dependence on fossil fuels have prompted governments around the world to embrace a shift to vehicles powered by electric motors . Governments are encouraging the adoption of electric vehicles by offering environmental subsidies and introducing low emission zones that will heavily penalize vehicle manufacturers who break carbon dioxide and nitrogen oxide emission limits .
The science behind EV’s environmental benefit is irrefutable . Road transport pollution is responsible for 17% of all CO2 emissions caused by humans . Electric vehicles reduce harmful vehicle emissions by up to 30%, when operating with energy generated from fossil fuels, and up to 70% with renewable energy .
The global pandemic in 2020 cut traffic flow dramatically and with it emissions, demonstrating the benefits and importance of a sustainable and cleaner way of moving .
GROWTH OPPORTUNITY CONNECTED IN-VEHICLE NAVIGATIONAUTOMATED DRIVINGELECTRIFICATION SERVICESAPIs SAFETY FEATURES
CONNECTED IN-VEHICLE NAVIGATIONAUTOMATED DRIVINGELECTRIFICATION SERVICESAPIs SAFETY FEATURES
CONNECTED IN-VEHICLE NAVIGATIONAUTOMATED DRIVINGELECTRIFICATION SERVICESAPIs SAFETY FEATURES
CONNECTED IN-VEHICLE NAVIGATIONAUTOMATED DRIVINGELECTRIFICATION SERVICESAPIs SAFETY FEATURES
19
MARKET TRENDS AND GROWTH OPPORTUNITIES CONTINUED

SafetyMore than 3,000 people die in road accidents every day . Excessive speed, last-minute lane changes and harsh braking are the leading factors . Governments are looking for ways to improve road safety, with some introducing legislation specifically targeting minimum safety requirements .
In Europe, New Car Assessment Program (NCAP) rewards better safety ratings to vehicles with Intelligent Speed Assist (ISA) functions . Upcoming EU legislation aims to make ISA mandatory for all new vehicles starting in 2022, and mandatory for all existing carlines per 2024 . ISA can be based on a combination of camera and/or ADAS Map content .
This push for safer driving is leading automakers to look for ways to improve their NCAP safety ratings and comply with new legislation .
GROWTH OPPORTUNITY CONNECTED IN-VEHICLE NAVIGATIONAUTOMATED DRIVINGELECTRIFICATION SERVICESAPIs SAFETY FEATURES
20
MARKET TRENDS AND GROWTH OPPORTUNITIES CONTINUED

Internet of ThingsAs the reliability of cloud computing increases and the costs associated with connectivity decreases, location-as-a-service via APIs transforms from a virtual accessory into an industry standard .
Maps APIs are increasingly becoming mainstream for our customers and developers, who are accessing more and more maps, navigation software and other location-based applications in the cloud .
GROWTH OPPORTUNITY CONNECTED IN-VEHICLE NAVIGATIONAUTOMATED DRIVINGELECTRIFICATION SERVICESAPIs SAFETY FEATURES
21
MARKET TRENDS AND GROWTH OPPORTUNITIES CONTINUED

Connected in-vehicle navigation Enabling drivers to expand their connected digital life to their vehicles through in-vehicle navigation and infotainment is rapidly becoming a key requirement for success .
We see continued growth in connected in-vehicle navigation, as we continue innovating to position ourselves as a trusted full-stack navigation system provider with the best end-user experience across all geographic regions .
Our navigation solutions work across brands, car models and geographies, while meeting stringent demands around cost, speed, quality and simplicity . The market is shifting in response . Connectivity is enabling us to further monetize new services, while we capitalize on our software, over-the-air map updates and sensor data .
We have been providing connected navigation for years and have now taken it to the next level by moving our services fully online, ensuring drivers always have the most up-to-date map and software .
Our connected services including real-time traffic, speed cameras and hazard warnings, further enrich the driver experience by providing drivers with the most reliable information for worry-free journeys .
Automated drivingOEMs are progressing rapidly in adopting ADAS features, with numerous manufacturers having already launched level 1- and level 2-enabled vehicles . Our ADAS maps now power three million vehicles on the road, up from 1 .5 million at the end of 2019 . We expect this number to continue to grow over the next few years . As ADAS becomes mainstream, it plays a crucial role in preparing the technology for higher degrees of automation, eventually leading to fully automated vehicles .
While mass-adoption of fully automated vehicles is a longer-term opportunity, automated driving functions are increasingly becoming more sophisticated . Our expectation is that as these features develop and more control is handed over to automated vehicle control systems, safe activation of automated features will require a high definition map (HD map) . An HD map improves sensor perception, enabling precise localization and improving path planning to safely execute every automated maneuver .
The industry continues developing in support of more automated driving functions . Our maps support manual and automated driving, leaving us well-positioned to capture value from all driving autonomy levels (L0-L5) .
Electrification servicesElectrification leads to higher in-vehicle navigation take rates .
As environmental considerations play a larger factor in consumer purchasing behavior, buoyed by governmental incentives for greener transportation, demand for EVs is increasing .
EVs have a higher attachment rate than traditional combustion engines because of consumer tendency to experience range anxiety . Range anxiety is the fear of running out of power on a journey and not being able to find a charging point, a barrier to greater EV adoption .
Range anxiety can be solved with electrification services provided through in-vehicle navigation systems . Having in-dash navigation systems with connected services technology provides the best user experience . This tells the drivers if their favorite destinations can be reached without having to recharge and shows the charging options available to them – incorporating compatibility with their vehicles and real-time availability .
GROWTH OPPORTUNITIES > Connected in-vehicle navigation
> Automated driving
> Electrification services
> APIs
> Safety features
3 .0 millionvehicles are powered by our ADAS maps
22
MARKET TRENDS AND GROWTH OPPORTUNITIES CONTINUED

Every single feature in our ADAS Map has its own unique advantages that contribute to safer driving:
> Leveraging curvature information from the TomTom ADAS Map, a vehicle can anticipate a sharp turn . This avoids harsh braking that would happen when relying only on sensors and ultimately provides a safer and more comfortable ride .
> For advanced guidance, lane information is used to guide the vehicle to the correct lane and avoid last-minute lane changes – a key cause of accidents .
> Traffic signs and speed limit data from the TomTom ADAS Map improve safety (and NCAP vehicle safety ratings) . TomTom ADAS Map speed limits fulfill NCAP accuracy requirements today whereas many cameras cannot interpret conditional speed limit signs .
CONTRIBUTING TO A SAFER WORLDAPIsRapid change in the location APIs market has created a significant area of growth for us, as many start-ups and businesses are looking for providers .
Instead of accessing uncompiled maps and having to manage large databases, companies with smaller engineering teams and developers of startups can access bits and pieces of content as needed, gaining speed to launch their applications .
We have taken critical steps to advance the adoption of our Maps APIs . These include enhancing our product offering and building our own developer community via our Developer Portal, where users can easily access our APIs and SDKs for our entire product line . A variety of enterprises and start-ups, from fleet and logistics software, and on-demand service, providers, web and mobile application developers, cloud service providers and location-intelligence platforms already use our Maps APIs and SDKs .
Our strategy to grow market reach also includes offering our location technology in third-party cloud platforms . This approach was initiated through a partnership with Microsoft, which allowed Microsoft and its Azure customers to have direct access to our Maps APIs . We natively integrated our location technologies into the Microsoft Azure cloud platform to allow a more fluid and flexible platform for developers to build and manage their location-based applications .
Safety featuresThe need for safer driving is an opportunity for higher in-dash navigation take rates, and increased services per vehicle .
Within our suite of location-based products and services, we have a number of products that contribute to driver safety .
In its most basic form, embedded navigation is proven to increase safety and accident rates dropped the moment these systems became mainstream .
Driving automation is taking these safety gains even further, relying on ADAS maps that help the driver or the vehicle look ahead and around the corner .
Our connected services work to provide drivers with information, such as traffic and hazard prediction, allowing for better routes and reliable ETAs to get them where they are going on time, reducing driver anxiety .
23
MARKET TRENDS AND GROWTH OPPORTUNITIES CONTINUED

Our people strategy aims to create an incredible employee experience, inspiring TomTom’ers to learn and continuously enhance their skills.
At TomTom, we are about movement – about leading progress as we help people and the world move into a better future . Innovation is not only in our technology; it’s part of who we are, both as individuals and a global collective of around 4,500 people across 35 offices .
Our priority is to ensure that we attract and retain the people we need to innovate and grow our business .
We differentiate ourselves as an employer of choice by fostering a unique culture, with a founder's mentality, and bringing our values to life . To keep our edge in the highly competitive world of tech-talent acquisition we offer a competitive rewards program while encouraging employee learning and development, facilitating world class leadership and championing diversity, inclusion and belonging .
24
PEOPLE AND CULTURE
People are at the heart of TomTom, driving innovation every day
> Great communication is a key to uniting our global workforce around the company vision and strategy, celebrating success stories and learning from each other .
> Actionable insights are a prerequisite for providing personal employee experiences across our locations . We launch initiatives to help us better understand the needs and drivers of our people and creating decentralized action plans for greater impact . We have implemented a best-in-class digital engagement platform which delivers insights, combined with team-specific action plans, that managers can use to directly boost engagement on their teams . Our latest people engagement survey has placed us in the top 10% of technology companies (based on the GLINT benchmark) .
> Giving back to our local communities is important at TomTom . Aligned with our 'we care' value, we gave employees paid time off to volunteer for causes they care about . In the Netherlands, we have partnered with an online platform to make it easier for TomTom'ers to find, sign up and take part in local initiatives .
> Working at TomTom (W@TT) is our new initiative to transform the way we work, with an activity-based philosophy at its core . We want to enable TomTom'ers to choose the workspace that best fits the activity they need to do – to achieve their goals and TomTom's .
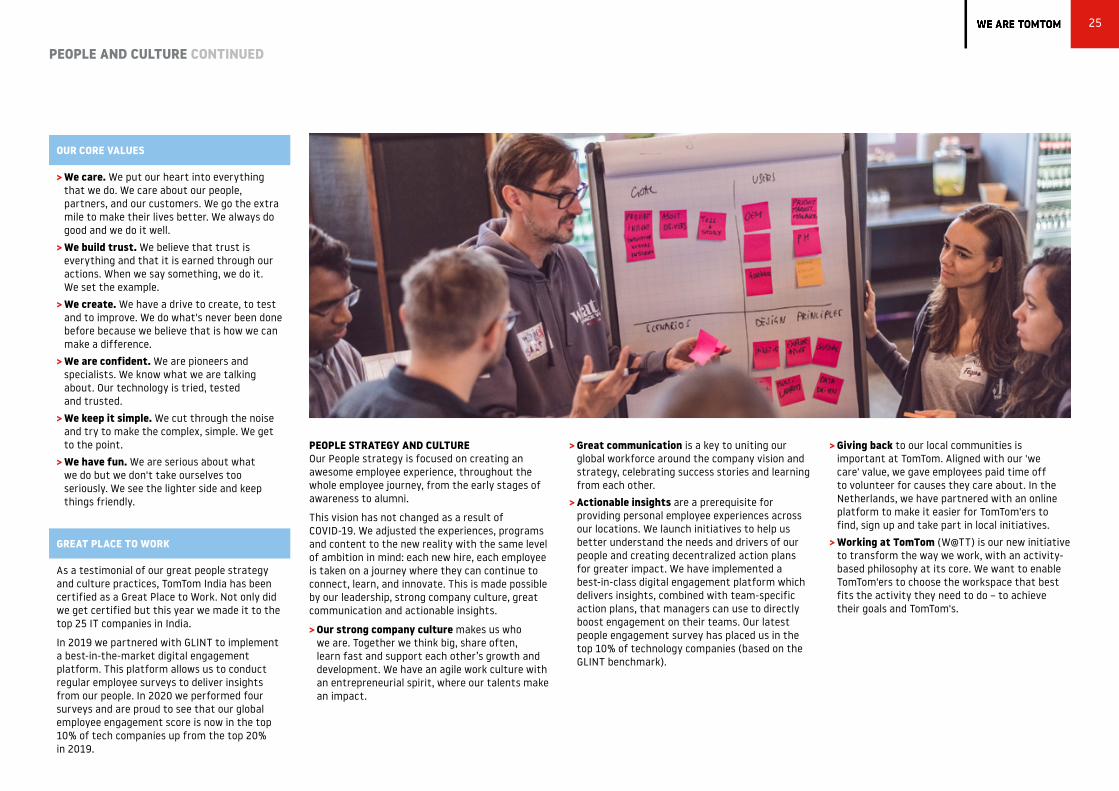
PEOPLE STRATEGY AND CULTURE Our People strategy is focused on creating an awesome employee experience, throughout the whole employee journey, from the early stages of awareness to alumni .
This vision has not changed as a result of COVID-19 . We adjusted the experiences, programs and content to the new reality with the same level of ambition in mind: each new hire, each employee is taken on a journey where they can continue to connect, learn, and innovate . This is made possible by our leadership, strong company culture, great communication and actionable insights .
> Our strong company culture makes us who we are . Together we think big, share often, learn fast and support each other’s growth and development . We have an agile work culture with an entrepreneurial spirit, where our talents make an impact .
OUR CORE VALUES
> We care. We put our heart into everything that we do . We care about our people, partners, and our customers . We go the extra mile to make their lives better . We always do good and we do it well .
> We build trust. We believe that trust is everything and that it is earned through our actions . When we say something, we do it . We set the example .
> We create. We have a drive to create, to test and to improve . We do what's never been done before because we believe that is how we can make a difference .
> We are confident. We are pioneers and specialists . We know what we are talking about . Our technology is tried, tested and trusted .
> We keep it simple. We cut through the noise and try to make the complex, simple . We get to the point .
> We have fun. We are serious about what we do but we don't take ourselves too seriously . We see the lighter side and keep things friendly .
GREAT PLACE TO WORK
As a testimonial of our great people strategy and culture practices, TomTom India has been certified as a Great Place to Work . Not only did we get certified but this year we made it to the top 25 IT companies in India .
In 2019 we partnered with GLINT to implement a best-in-the-market digital engagement platform . This platform allows us to conduct regular employee surveys to deliver insights from our people . In 2020 we performed four surveys and are proud to see that our global employee engagement score is now in the top 10% of tech companies up from the top 20% in 2019 .
25
PEOPLE AND CULTURE CONTINUED

LEADERSHIPThe right kind of leadership enables the brightest minds to do their best work, attracts talent, and is the cornerstone of our mission: to create the most innovative technologies to help shape tomorrow’s mobility .
Our leaders play a key role in driving TomTom strategy and employee engagement . Our Senior Leadership Team, consisting of leaders of our technology, commercial, product, development and people units, drives stronger governance and faster decision-making . We also continuously adjust our organization to reflect a simpler and more transparent operating model that fosters improved collaboration and alignment between teams .
We design programs to support our leaders and managers to become the best version of themselves so that they can lead in the best possible way . In addition to our Executive, Acceleration and People Manager programs, this year we have focused more on managing in challenging times, team effectiveness and change management . We put emphasis on open dialogue, both between managers and team members and within the teams . We set clear objectives and expectations and allow as much flexibility as possible .
Underlining our belief in great communication, trust and transparency amid the pandemic and our new way of working, we organized more than 20 Leadership 'Ask Me Anything' sessions . In these sessions we invite the entire TomTom organization to ask any and all questions on their minds to our leaders . This increases awareness and understanding throughout the organization of what is on our TomTom'ers' minds and enables our leaders to address those questions directly .
INNOVATIONWe encourage a continuous learning culture, where our people have the room to develop, implement new ideas and maximize their skills . This increases engagement and creativity throughout the organization .
Next to a large learning offering, we are always implementing innovation-focused initiatives such as:
> TomTom Lab is our company-wide innovation program . The program encourages TomTom'ers to come up with their own project ideas – that are currently not on the roadmap but could have a significant impact on our product and services offering – and work on them through unified, cross-office and cross-unit collaboration . TomTom Lab includes EIT Urban Mobility and the global TomTom annual hackathon, What the Hack (the sixth edition took place online in 2020) .
> TomTom Boost is our company-wide knowledge-sharing program . It runs alongside TomTom Lab and, through workshops, talks, platforms and more, gives TomTom'ers an opportunity to connect with colleagues, share their expertise and experiences, and learn from one another . The program covers a wide range of topics, including coding, testing, releasing, engineering and product management, software architecture, as well as soft skills .
> Technical skills initiatives offer training and certification to support our online strategy through furthering Azure technical competency in partnership with Microsoft . Training is available at different levels, from Azure Fundamentals to Azure Solution Architect and is available for both technical and non-technical professionals .
> TomTalks is a recurring event series where TomTom’ers and thought leaders from various disciplines are invited to share their knowledge and experience with our organization, livestreamed to our offices around the world .
26
PEOPLE AND CULTURE CONTINUED

COMPETITIVE HIRINGTechnology hires account for 72% of our total hiring numbers, a trend that we have seen increase over the last few years . As demand for tech talent begins to outweigh supply worldwide, attracting the right talent in a highly competitive landscape becomes imperative .
Our hiring strategy is aimed at attracting the best people in the talent pool, as well as finding innovative ways to build an engineering talent pipeline .
During COVID-19, we continued hiring for our engineering community . By adjusting our recruitment strategy we were able to attract great talent across all markets . In our key markets, we are now running always-on digital campaigns to position ourselves as a great place to work . These campaigns are proving to be successful, bringing in great talent that may not have engaged with TomTom in the past .
We need great people that will be impactful to the organization through the skills and behaviors that are critical to our success . We constantly improve our processes based on insights we get from candidate experience and hiring manager satisfaction surveys .
We have designed our global recruitment process, Hiring@TomTom to be consistent, predictable, unbiased, efficient, scalable (up and down) enabling a more data-driven approach for continuous improvement of recruitment .
Our objective is to provide competitive, fair and responsible compensation, as well as establishing initiatives that enable the flexibility needed for our employees to thrive both personally and professionally . Our new work from home benefits are a reflection of these objectives .
Our competitive rewards program offers attractive compensation and benefits packages, and is key for attracting and retaining talent . Long-term incentives for senior management and key individuals are part of our remuneration policy . We encourage share ownership among our employees through our restricted stock unit (RSU) plan . This also aligns our long-term incentives with our long-term objectives as the grant is conditional on continued employment until the time of vesting . The selection of employees eligible for these programs is based on a combination of their estimated talent potential, performance rating and salary range .
FOR MORE INFORMATIONCareer opportunities at TomTomtomtom .com/careers
Safety and employee well-being has been the primary driver of our response during the pandemic .
Following the recommendations of the governments and health authorities of the countries in which we operate, we transitioned all of our employees to working from home . As a global technology company our employees are used to collaborating across multiple locations and time zones with colleagues who are not in the same physical place . This, along with an efficient response by a dedicated team, meant we were able to collaborate effectively and continue delivering on our strategic priorities . Our employees demonstrated great adaptability and resilience, showing a strong sense of commitment towards each other and the organization .
EMPLOYEE WELL-BEING DURING COVID-19
Even though we all experienced the impact of this global pandemic, we all did this in different ways . During this time we placed additional emphasis on the well-being of our employees . We launched mechanisms to support our employees including workshops, webinars, information on best practices from experts as well as advice on various topics directly from other TomTom'ers .
We organized TomTalks with external speakers and improved our assistance offering in multiple countries . We put in place a Buddy program, to help our employees maintain contact with one another, as well as multiple other initiatives to promote a sense of community .
As part of our new activity-based working initiative (W@TT), and the transition to working more from home, we introduced new benefits such as a one-time home office setup for all TomTom'ers . We also introduced a recurring monthly contribution to compensate all TomTom'ers for their home office costs, which will take effect in 2021 .
27
PEOPLE AND CULTURE CONTINUED

DIVERSITY, INCLUSION AND BELONGINGAs a global multinational and multicultural company, we thrive on each other’s differences, encourage individuality and embrace self-expression .
We have set a target of 34% female representation at TomTom by 2024 . As our workforce is increasingly composed of highly technical roles, we acknowledge the complexities involved in reaching this target .
In 2020, we created a dedicated Corporate Social Responsibility team to align and support global activation of our responsible business initiatives . This team developed a global TomTom Diversity and Inclusion strategy which emphasizes:
> diverse hiring through inclusive recruitment, selection and interview processes;
> fair and equal growth and career opportunities for all TomTom’ers;
> promotion of an inclusive work culture where all TomTom'ers can thrive and be their authentic selves; and
> conscious, proactive and transparent embedding of Diversity, Inclusion and Belonging in everything that we do .
We will continue to strengthen our efforts to attract and hire more diverse talent into technology and leadership roles . We continue to test new approaches and strongly advocate for equality .
Hiring and representation targets have been established and implemented to foster a more gender balanced organization in support of our vision of increasing diversity in our workforce . For example, in key locations we implemented specific goals for team composition . In our graduate programs, we ensured that equal representation of applicants and hires were met .
Our leadership acceleration program, together with Cambridge Judge Business School, accelerates female participants’ entry into senior leadership roles . Participants are being trained, mentored and coached to better position themselves as leaders both internally and externally .
Global unconscious bias workshops were held (online) in 2020 to overcome one of the hurdles to creating an inclusive culture . Even those of us with very pronounced beliefs in equality and inclusion can carry bias at an unconscious level . Together we can work towards recognizing, facing and overcoming these biases . These workshops were open to everyone at TomTom and more than 700 individual TomTom’ers have participated, with many managers holding private workshops for their teams .
We are diversifying the local tech talent pool in the Netherlands through a partnership with TechConnect, supporting a four-year initiative by the Amsterdam Economic Board to bring 50,000 people from unrepresented groups into the workforce .
We regularly host campaigns to bring awareness around diversity, inclusion and belonging topics .
> International Women’s Day was celebrated by organizing more than 50 on-site and online thought-provoking learning sessions . At TomTom, we believe that skill, learning and progress have no gender . In the 100% female-led sessions, TomTom’ers and invited guests embraced the theme #EachforEqual and discussed topics ranging from product marketing and thought leadership, to user experience (UX) design .
> ‘On this journey together’ campaign was launched globally in support of Pride month focusing on education, empowerment and allyship . The campaign included a variety of initiatives ranging from a new TomTom Pride Buddy program to hosting a TomTalk called ‘LGBTQ+: Yes, It’s Natural’ . TomTom’ers shared how they celebrated Pride on the Virtual Pride Parade to drive positive change and raise money for the Kaleidoscope Trust .
28
PEOPLE AND CULTURE CONTINUED
72%MALE
28%FEMALE
80We employ over 80 nationalities across our global offices .

At TomTom, corporate responsibility isn’t an afterthought or about checking a box . We are guided by our desire to create a better world . Our values and vision come through in our products and services, people and communities, and our business operations .
As a global business, we embrace our responsibility to not only minimize our negative impact, but also maximize the positive one . We do so by giving back to the communities in which we are present .
In 2020, we took time to determine the targets of the three Sustainable Development Goals (SDGs) that best align with TomTom's vision (SDG 4 Quality education, SDG 5 Gender equality, and SDG 11 Sustainable cities and communities) and to understand the steps needed to translate the targets to TomTom’s operations . The chosen respective SDG targets are as follows:
> Target 4 .4: By 2030, substantially increase the number of youth and adults who have relevant skills, including technical and vocational skills, for employment, decent jobs and entrepreneurship .
> Target 5 .5: Ensure women’s full and effective participation and equal opportunities for leadership at all levels of decision-making in political, economic and public life .
> Target 11 .6: By 2030, reduce the adverse per capita environmental impact of cities, including by paying special attention to air quality and municipal and other waste management .
In 2021, we will set concrete operational targets which will contribute to achieving the long-term SDG targets, firstly focusing on SDG 5 with our newly developed Diversity and Inclusion strategy .
29
Building a better world is core to our business
CORPORATE RESPONSIBILITY

Our people and culture support our behavior as a responsible business, guided by five impact areas . These areas drive us toward our vision of a safer, cleaner world, free of congestion and emissions .
IMPROVING ROAD SAFETY More than 3,000 people die in road accidents every day . We are creating technologies that make driving safer – for both human drivers and self-driving cars:
> Embedded navigation, consisting of SD maps and navigation software, enhances driver concentration on the road ahead .
> ADAS map features for more advanced automated vehicle safety features (speed limits, tail gate warnings, automatic braking and gear shifting) .
> Navigation and routing provides accurate arrival time estimates allowing drivers to get where they are going on time reducing driver anxiety .
> Traffic information services provide early warnings about traffic incidents such as upcoming jams, allowing drivers to slow down gradually rather than needing to brake sharply .
Our ambition is to create a better world for all through our products and services, our business practices and our community involvement
CONTRIBUTING TO A SAFER WORLD
At TomTom, we are committed to investing in technologies that make roads safer for all . Speeding has been one of the leading factors in road deaths since the invention of the car .
In 2020 we ran a marketing campaign to raise awareness of the impact of speeding on road safety . We also improved our ADAS Map speed limit content which has many benefits such as greater road safety for all, increased driver comfort, vehicles that meet new EU safety legislation, and better vehicle safety NCAP ratings .
For more information, have a look at this blog post and at the webinar we hosted with our partner Delphi Technologies .
Our people and culture
Improvingroad safety
Reducing environmental
impact
Fostering equality
Giving back to society
Upholdingethical
businesspractices
Creating innovativetechnologies
Helping the worldmove forward
Supporting growthand learning
A safe and connected, autonomous world, free of congestion and emissions
30
CORPORATE RESPONSIBILITY CONTINUED

REDUCING ENVIRONMENTAL IMPACTClimate change is one of the biggest challenges facing the world today . Our products and services inherently contribute to a cleaner world and thereby address climate change issues . We help everyone – people, cities, governments and businesses – make smarter decisions and move into a world with less emissions from driving .
Our traffic information service, for example, provides drivers with highly accurate measurements of traffic jams and delays for better route calculation . Using traffic information can ease traffic congestion and reduce emissions as a result .
Further, and based on our Environmental Policy, we are continually taking steps to reduce our environmental impact through our responsible internal business practices: our materials and energy Go Green office sustainability programs, our waste recycling efforts, and driving a responsible supply chain .
Achieving our vision requires industry partnerships able to co-create the right kind of pre-integrated solutions to improve all aspects of a driver’s journey .
We partnered with Delphi Technologies to combine driver-assistance systems with advanced powertrain software to develop a significantly more efficient powertrain system . This system increases driver comfort and achieves fuel savings greater than 10%, without additional travel time .
With the TomTom ADAS Map, the Delphi Technologies Intelligent Driving system can 'see' the road ahead, enabling the vehicle to anticipate upcoming curves, hills and speed limits to slow down or accelerate for smoother and more efficient driving .
TECHNOLOGIES TO REDUCE EMISSIONS
31
CORPORATE RESPONSIBILITY CONTINUED

Office sustainability In the beginning of 2020, we set the goal to become Building Research Establishment Environmental Assessment Method (BREEAM) certified by the end of the year for our headquarter office in Amsterdam . BREEAM is the most innovative and sustainable standard for building and facilities management . A similar certification system is Leadership in Energy and Environmental Design (LEED) . It forms the foundation for setting specific targets on the following topics like energy, water, waste, land use and ecology, pollution, health and transport .
We successfully reached our target of achieving BREEAM-NL certification for our headquarter office in Amsterdam in 2020, rewarding our internal sustainability initiatives and reflecting our commitment to a world free of emissions .
We will continue with our initiatives, replicating them to other strategic locations . Our aim is to have our other two locations in the Netherlands and our Ghent office BREEAM certified and our Pune office LEED certified .
Management of resources, efficiency and consumptionWe set an objective to develop and implement an energy management system in the first quarter of 2020 . While our efforts were put on hold in order to deliver necessary COVID-19 office arrangements, we made progress during the year with the selection of a state-of-the-art platform for environmental energy reporting and monitoring .
In 2021, we aim to complete the implementation of the energy management system globally thereby increasing transparency and raising awareness of the environmental impact of our offices to employees, visitors and other interested stakeholders .
In 2020, we made progress towards more renewable sources and have had a 100% reduction (relative to the previous year) of CO2 emissions (scope 2) through the purchase of certified local wind energy in our Amsterdam offices . Our Berlin and Harsum offices will be next to adopt this approach in 2021 .
In 2021, we aim to take the next steps in responsible sourcing of wood products like furniture and construction materials by selecting vendors with FSC, PEFC or equivalent certifications . To preserve forests around the world, we accept three types of certification trademarks only – those that guarantee a 100% responsible chain of custody, products from a mixed origin (70% responsibly sourced and 30% recycled) or 100% recycled products .
Global recycling and waste take-backWe set a goal for 2020 to introduce recycling in all TomTom offices worldwide, focusing on increasing recycled waste and reducing non-recyclable waste . The program entails separating waste at the source and making sure each waste type is processed properly by our suppliers . Currently 32 out of our 35 office locations worldwide have implemented recycling . Our San Jose and Farmington Hills offices are up next to complete the program in 2021 .
Environmental policyOur Environmental Policy gives guidance to our employees, suppliers, customers and other relevant stakeholders on how we uphold our environmental standards in everything we do, and helps us keep track of our goals, specific targets and continuous progress .
Our Environmental Policy and associated activities are part of our integrated quality management system (QMS), which helps us in our efforts to continuously improve our responsible business practices and supports our vision . Our QMS is compliant with the requirements of the International Organization for Standardization (ISO) 14001:2015 and the Responsible Business Alliance (RBA) . Regular audits are performed by both QMS internal auditors and Group Internal Audit as a control mechanism .
Our QMS includes the performance of an environmental risk assessment concluding that, given the nature of our business, the environmental risks associated with it are not deemed to be significant . Nevertheless our aim is to create a working environment where sustainability is seamlessly integrated into the design, maintenance and use of our real estate and internal facilities throughout the world .
TomTom is planning to get ISO 14001 re-certified in March 2021 . Our efforts to integrate environmental management into our quality management system, as well as changes stemming from COVID-19, presented challenges to a certification in 2020 .
32
CORPORATE RESPONSIBILITY CONTINUED

Considering the impact of COVID-19The pandemic brings more opportunities to lower our environmental impact . Utility statistics for all offices were heavily influenced by low office occupancy during the ongoing COVID-19 crisis and needs to be base lined in 2021 before we are able to set and accomplish new reduction targets . Alternatively, we are considering an occupancy-based measurement system .
Driving a responsible supply chainOur Supplier Code sets out the standards and behaviors we require from our suppliers and is based on the Responsible Business Alliance (RBA) Code of Conduct and covers areas like labor, health and safety, environment and ethics . We ask our major suppliers to sign and comply with this code, to acknowledge our environmental policy and to support our plans and efforts to reduce the environmental footprint of our business activities and improve social, environmental and ethical practices .
Outsourcing is a key element of our business model . The assembly of our PNDs, accessories and (reverse) logistics is entirely outsourced . It is of great importance that our suppliers recognize and observe fundamental human rights, safety and the environment in their operations .
In 2020, we carried out risk assessments for our major suppliers using the RBA tools and concluded that there were no high risk findings . As a result, we did not conduct any independent supplier audits .
FOSTERING EQUALITY We strive to create a diverse, open and inclusive company culture that thrives on people's differences, where everyone feels connected and valued . It is important that everyone in TomTom feels they can bring their 'whole self' to work and feel safe . This has always been core to our culture, however, our diversity and inclusion (D&I) commitments haven't moved far enough past good intentions because we did not have a comprehensive strategy in place .
The recent creation of the Corporate Social Responsibility team is a significant step towards ensuring we embed D&I in all that we do . The D&I strategy will translate our good intentions into strategic action and create accountability within the organization .
GIVING BACK TO SOCIETY We know that our impact on creating a better world goes beyond our technologies and we take this responsibility seriously .
During 2020, we focused on providing support to our local communities impacted by COVID-19 through various partnerships . We also leveraged our position as a leading location technology company to make an impact in the area of tech education, and more specifically creating equal opportunities for women in tech . Through our efforts, we aim to foster a new, gender-balanced generation equipped with in-demand skills .
TomTom Traffic IndexCreated to help cities around the world combat severe mobility challenges, the TomTom Traffic Index provides free access to live and historical traffic data .
It offers drivers, city planners, auto manufacturers and policy makers with statistics and information about congestion levels in 416 cities across 57 countries on six continents . In 2020, the ninth edition of the Index gave even more insights into congestion in urban centers and contributed to TomTom's mission for a congestion-free world by offering advice on how people can travel smarter .
33
CORPORATE RESPONSIBILITY CONTINUED

TRAFFIC DATA AND COVID-19
The COVID-19 pandemic has dramatically changed the way we live, work and move . Lockdowns, remote working and other restrictions on movement have transformed patterns of movement and reduced traffic congestion in most cities .
TomTom’s traffic data is such an accurate indicator of people movement, trade, and economic activity that since March, our traffic insights have been used by analysts, corporations, and the media to explain a world in flux due to the pandemic .
Helping patients in rural areas stay on the mapWe partnered with ADCi and Code 3 Consulting to ensure equal access for all emergency service providers, regardless of size or location .
By combining base data from TomTom and ADCi with local sources, Code 3 Consulting was able to provide agencies with quality, up-to-date maps, customized to their specific need and CAD system . The greater quality of maps leads to greater accuracy when locating the citizen in need .
Medical411 donationTomTom provided one million Maps APIs credits to Medical411, a community COVID-19 symptom tracker with server side reporting capabilities . With the help of our APIs, medical411 .net could support government institutions in tackling the ongoing pandemic .
Vagmi Foundation collaborationOur TomTom India team created a location mapping and tracking site for the Vagmi Foundation, a local non-governmental organization which supports the provision of food to people in need . The site uses Points of interest (POIs), such as the addresses of where food was being delivered, based on the information from Vagmi's call center and map data from tracking deliveries . Since the start of the pandemic, Vagmi Foundation has been feeding more than 100,000 needy people on a daily basis .
Employee initiativesOur employees organized and sponsored numerous initiatives across the globe to give back to their communities . We encourage and help enable TomTom'ers to take the initiative to give back . In the Netherlands, we do so through our 'Take time to make a difference' volunteering program giving one paid day off to volunteer in a year . An expansion of this program to our Belgium office is set for 2021 .
34
CORPORATE RESPONSIBILITY CONTINUED

ETHICAL BUSINESS PRACTICES Our ethical business practices reflect our commitment to transparency and accountability, allowing us to build a relationship of trust with our stakeholders .
Data privacyWe are a data-driven company that separates itself from the competition through strict data privacy practices . We use de-identified data, by removing identifiable elements, purely to improve our products . We are not interested in where people have been, are, or plan to go – we care about helping them move safely, freely, efficiently while using aggregated location data to protect their personal data . To enforce our beliefs, we provide a no-ad guarantee with our products . The data we collect is solely used to improve our technology, and not to feed alternative business models . See the Privacy and Data Governance section for more information .
Code of ConductOur Code of Conduct integrates the RBA standards, and describes our business principles, guiding our employees both inside the company and in their interactions with external stakeholders .
Our Code of Conduct training and awareness program and control mechanisms play a pivotal role in preventing bribery and corruption and other misconduct at TomTom . The program is designed to permanently instill an awareness of everyone’s responsibility to uphold TomTom’s business principles and to speak up in case of any misconduct . The program includes online gamified training, virtual localized and interactive refreshment sessions, tailored communication and custom-made campaigns on specific topics like human rights, safe working environment, anti- bribery and corruption, security and confidential information and our Open Ears Procedure . Our business principles and corporate policies and procedures are an integral and mandatory part of our global induction program for all employees . No Anti-Bribery key performance indicators (KPIs) were set for 2020 .
Our labor principles outline our commitment to human rights and covers, among others, freely chosen employment, respect for age requirements, non-discrimination and freedom of association . The principles are reflected in the way we treat our employees and are included in our policies, employment agreements and recruitment procedures .
We also published a Slavery and Human Trafficking Statement under the UK Modern Slavery Act that summarizes our actions to address the risk of modern slavery within our own operations and those of our suppliers . No Human Rights KPIs were set for 2020 .
In our effort to improve our practices continuously, also part of our QMS, we will further develop and articulate our policies, risk management processes and KPIs in relation to matters like our environmental impact, human rights and anti-corruption and bribery .
Our employees and external stakeholders are provided the opportunity to (anonymously) speak up about any (potential) misconduct, without the fear of retaliation . We received eight reports through our Open Ears Procedure in 2020 . The reports related to claims of breaches of internal procedures, fraudulent activities, harassment, discrimination and bullying . All reports were duly investigated and of the eight claims, five were found to be substantiated .
FOR MORE INFORMATION Corporate governancetomtom .com/company/corporate-governance
Tax principlesTomTom’s contribution to society includes the payment of taxes . The taxes we pay help fund public services provided by governmental institutions in the countries where we operate . Annual internal trainings on tax dilemmas are organized to keep internal stakeholders aware of relevant tax legislation and to ensure compliance herewith . Our approach to tax is formulated and published on our corporate governance website .
35
CORPORATE RESPONSIBILITY CONTINUED

We’ve always made it a priority to give everyone the right to personal privacy when using our technologies . To this end, we follow a privacy and security-by-design approach that ensures that the full life-cycle of our products and services is designed to enable user privacy, control and security over their personal data . We take data privacy, security, and the proper management of data into consideration, right from the start of design and throughout the entire engineering and operations process .
Our Information Security Management System (ISMS) ensures that we meet the security demands of our customers in a standardized and holistic manner . Our security capabilities protect the privacy of our customers and our products .
We use big data to drive continued innovation and product improvements, processing billions of anonymous ('de-identified') global data points every day . People using products and services based on our technology contribute to a continuous feedback loop that we use to improve our technology, making driving safer and more comfortable . We do not use any data for advertising purposes .
We apply the EU General Data Protection Regulation (GDPR) on a global scale . GDPR is considered to be the most extensive privacy regulation in the world . It supports us in offering a high level of protection to our users worldwide by allowing us to use their data only when strict regulations are met .
FOR MORE INFORMATION How we use our customers’ datatomtom .com/company/privacy
TOMTOM PRIVACY PRINCIPLES
Protecting personal identityWe embed aggregated location data in our products, protecting individual details .
We never sell personal dataPersonal data is only used to improve our technology .
User control We enable people to remain in control of their data . At any time, people can opt-out or opt-in when using our technologies .
No adsOur products are intended to guide people, with no ads creating distractions on the road .
TOMTOM SECURITY PRINCIPLES
Security mindsetWe view security as one of the main features of our business . Security is part of everybody’s daily work, ensuring safe and secure products for our customers and a safe and secure working environment within TomTom .
Security by design We embrace doing the right things and doing things right from the start – whatever TomTom builds, buys, or does . We do risk-based protection of information together with our customers .
Transparency We will be transparent if our customers' data or products are ever at risk . TomTom will proactively inform and involve customers as early as possible to minimize any adverse impact resulting from said risk .
36
Protecting people’s privacy and securing our products is built into our products, services and business model
PRIVACY AND DATA GOVERNANCE

(€ in millions, unless stated otherwise) 2020 2019 YoY change
Location Technology 392 .2 426 .0 -8%Consumer 136 .0 274 .8 -51%Revenue 528.2 700.8 -25%Gross profit 423.4 515.2 -18%Gross margin (%) 80% 74%EBITDA1 -2.1 61.0EBITDA margin (%)1 0% 9%Net result2 -257.6 632.9Free cash flow (FCF)1 -26.5 65.8Free cash flow as a % of revenue -5% 9%
1 This is a non-GAAP measure and is further explained on page 133 .2 Net result in 2019 represents total operations and includes the net result of Telematics which was sold effective
1 April 2019 .
REVENUE2020 was a turbulent year as the COVID-19 pandemic disrupted the global economy, impacting people’s daily lives as well as travel behaviors . From a revenue perspective, the pandemic had a negative impact on our Automotive and Consumer businesses . Group revenue was €528 million, which is 25% lower compared with €701 million in 2019 . Location Technology revenue declined year on year by 8% driven by 14% decline in Automotive, partly offset by an increase in Enterprise revenue of 3% . Consumer revenue for the year was €136 million, 51% lower compared with last year, as retail closures and changes in travel patterns significantly impacted the sales of our consumer products .
From a regional perspective, 63% of 2020 revenue was generated in Europe (2019: 72%), 26% in North America (2019: 19%) and 11% in the rest of the world (2019: 9%) .
Gross profitThe gross margin for the year increased to 80% compared with 74% last year, mainly reflecting a higher proportion of high margin Location Technology revenue in our product mix . The gross profit for the year was €423 million, 18% lower compared with 2019 .
Operating expensesTotal operating expenses (OPEX) for 2020 were €711 million compared with €746 million in 2019 . The lower operating expenses to some extent reflect the impact of discretionary measures we took to counter the decline of revenue following the pandemic .
In research and development (R&D) we maintained our investment and continue executing on our investment strategy for our mapping and application platforms and in-vehicle technology . Nevertheless total R&D cash spend during the year, including capital expenditures and capitalized contract costs, showed a year on year decline (2020: €318 million; 2019: €347 million) . This decline is mainly the result of discretionary cost savings (e .g . employee bonus and travel) and the inclusion of a one-off severance amount in 2019 . R&D operating expenses decreased by €12 million (2020: €311 million; 2019: €323 million) .
Marketing expenses and selling, general and administrative (SG&A) expenses decreased respectively by €6 million and €13 million year on year, mainly due to discretionary cost savings .
Total depreciation and amortization (D&A) expenses were €286 million in 2020 compared with €292 million in 2019 . The majority of the amortization results from the amortization of our capitalized map content .
As the decline in revenue in Automotive and Consumer was only partly offset by an increased gross margin and lower operating expenses, 2020 EBITDA decreased year on year to -€2 million (2019: €61 million) .
37
FINANCIAL REVIEW
In 2020 Location Technology revenue impacted by COVID-19, in 2021 growth expected of around 10%

Net resultThe total net result for the year was a loss of €258 million (2019: profit of €633 million) . The 2019 net result included an €807 million gain from the divestment of our Telematics business .
Balance sheetTotal assets decreased by €331 million, from €1 .3 billion at the start of the year to €1 .0 billion in December 2020 . The decrease reflects further amortization of our map database and a decrease in cash (including fixed term deposits) . The decrease in the cash balance reflects the higher net cash consumed caused by the COVID-19 impact on Automotive and Consumer revenues . Other working capital items such as trade receivables, trade payables, accruals and other liabilities decreased year on year reflecting lower revenue and expenses .
Deferred revenue increased from €369 million at the beginning of the year to €404 million mainly driven by payments received from Automotive customers which are required to be deferred . This increase is partly offset by decreases in Consumer deferred revenue due to declining PND sales .
Cash flowTotal cash flows from operating activities in 2020 was an outflow of €20 million, a decrease of €114 million compared with an inflow of €94 million in 2019 . The year on year trend is the result of lower revenue following the implications of COVID-19 .
Total cash flow from investing activities in 2020 was an inflow of €74 million compared with an inflow of €627 million in 2019 . Excluding the movements of cash placed in fixed term deposits and proceeds from the Telematics divestment in 2019, the cash flow used in investing activities decreased by €18 million year on year to €6 million (2019: €24 million) . The decline is due to lower capitalized R&D expenditures as well as lower investments in property, plant and equipment this year .
Free cash flow from continuing operations is an outflow of €26 million compared with a €66 million inflow in 2019 .
Cash, liquidity and debt financingThe cash flow from financing activities for the year was an outflow of €30 million (2019: outflow of €759 million) . 2020 included €17 million related to a share buyback program, while 2019 cash outflow included a €751 million return of capital to shareholders following the divestment of Telematics . The 2020 share buyback program was suspended at the end of March 2020 following the COVID-19 outbreak .
In 2020, 0 .6 million options (2019: 1 .6 million options) were exercised resulting in a €2 million cash inflow for the year (2019: €7 million) .
At year-end 2020, TomTom had zero utilization of its available credit facility of €75 million and reported a net cash position of €372 million (2019: €437 million) .
OUTLOOK 2021
(In € millions unless stated otherwise) Outlook 2021 Actual 2020
Revenue 520-570 528Of which Location Technology 420-450 392FCF1 as % of revenue Around 6% -5%
1 Free cash flow (FCF) is a non-GAAP measure and is further explained on page 133 .
> In 2021 Location Technology revenue is expected to grow by around 10% year-on-year, based on our expectation that car production in 2021 will not reach 2019 levels and a USD foreign exchange rate of 1 .20 .
> In the mid-term we expect Location Technology to grow to around €550 million revenue in 2023 .
> We will continue to invest to improve our competitive position and capture market opportunities . We forecast a limited increase in our cash spend in 2021 compared with 2020 .
> We expect FCF as a percentage of group revenue to be around 6% in 2021, with a mid-term target of around 10% .
> The total number of employees in 2021 is expected to be comparable with 2020 .
38
FINANCIAL REVIEW CONTINUED

LOCATION TECHNOLOGY > We maintained an Automotive backlog of €1 .8 billion, equal to the backlog reported at the end of 2019 . The order intake offset revenue recognized during the year and the negative impact of our customers' lower near-term car production forecasts .
> Location Technology generated revenue of €392 million in 2020, an 8% decrease year-on-year .
> Automotive revenue was €227 million in 2020, 14% lower compared with last year .
> Automotive operational revenue in 2020 was €282 million compared with €381 million in 2019, a decrease of 26%, explained by lower car production following the COVID-19 pandemic . Operational revenue is IFRS revenue adjusted for deferred and unbilled revenue movement of €55 million (2019: €115 million) .
> The deferred revenue position of Automotive increased to €336 million at the end of 2020 from €278 million at the end of 2019 .
> Enterprise revenue for the year was €165 million, 3% higher compared with 2019 due to extension and expansions of some partnerships, partly offset by foreign exchange movements, as around 80% of Enterprise revenue is in US Dollars .
> EBITDA declined year on year reflecting lower revenue, which was only partly offset by lower discretionary spend .
(€ in millions, unless stated otherwise) 2020 2019 YoY change1
Automotive 227 .2 265 .7 -14%Enterprise 165 .0 160 .3 3%Total revenue 392.2 426.0 -8%EBITDA2,3 -15.0 -3.4EBITDA margin (%) -4% -1%Operating result (EBIT)3 -299.4 -293.6EBIT margin (%) -76% -69%
1 Change percentages and totals calculated before rounding .2 D&A relates mainly to the map database (including acquisition-related amortization) .3 The EBIT and EBITDA measure and the reconciliation to the income statement is further explained in note 5 of the
consolidated financial statements .
CONSUMER > Consumer generated revenue of €136 million in 2020, a 51% decrease year on year . This sharp decline in revenue was caused by a decline in demand arising from retail stores being closed and people driving less during the COVID-19 pandemic .
> EBITDA showed a sharp year on year decrease as a result of lower revenue which was only partly offset by lower operating expenses .
(€ in millions, unless stated otherwise) 2020 2019 YoY change1
Consumer products 122 .0 238 .8 -49%Automotive hardware 14 .0 36 .0 -61%Total revenue 136.0 274.8 -51%EBITDA2 19.1 72.1EBITDA margin (%) 14% 26%Operating result (EBIT)2 17.9 70.3EBIT margin (%) 13% 26%
1 Change percentages and totals calculated before rounding .2 The EBIT and EBITDA measure and the reconciliation to the income statement is further explained in note 5 of the
consolidated financial statements .
39
FINANCIAL REVIEW CONTINUED
2020 financial performance highlights of our business units

AUTOMOTIVE DEALS > Fiat Chrysler Automobiles (FCA) chose TomTom as its global supplier for maps, navigation, traffic and other live services for the all-new Uconnect 5 in-vehicle infotainment system which will power new models from Abarth, Alfa Romeo, Chrysler, Dodge, Fiat, Jeep, Lancia and Ram trucks .
> The Maserati Intelligent System in-vehicle infotainment system will be powered by our maps, traffic and connected services and found in all the latest Maserati models across the globe .
> Alfa Romeo selected our navigation and our maps with advanced driver assistance attributes for the new Giulia and Stelvio models .
> Daimler Trucks uses the TomTom ADAS Map to help automate its trucks’ critical driving functions on highways and inter-urban roads .
> Subaru selected our global maps and navigation software for the 2020 Subaru Outback and Legacy models .
> Ford selected our real-time traffic service to power its next-generation SYNC® infotainment system around the world .
> Mitsubishi Motors chose TomTom’s navigation, maps and real-time traffic services to power the infotainment systems of the Eclipse Cross, the Outlander, the ASX/Outlander Sport/RVR, and the Pajero Sport .
ENTERPRISE DEALS > Uber expanded its deal with us by integrating our Maps APIs in addition to our map and traffic data across the entire Uber global platform .
> Verizon also expanded its deal with us by choosing to integrate our Maps APIs and SDKs into its location services offering .
> Huawei selected our maps and traffic to power Petal Maps, its own maps application .
> Targa Telematics chose our Maps APIs to enhance the vehicle management and smart mobility solutions it offers to its customers .
> Michelin Travel Partner extended its global deal with us for our maps and traffic data .
NEW TECHNOLOGIES > RoadCheck, an industry-first technology, allows carmakers to manage where it is safe for drivers to activate automated driving functions .
> Hazard Warnings is a service that creates time-critical signals that alert drivers and automated vehicles to hazards as they happen .
> TomTom launched the POI Details API and POI Photos API for developers, helping them to build applications with even more detailed location information for their end-users .
COLLABORATIONS > We collaborated with Hitachi on the development of a new real-time hazard service for navigation and automated driving .
> Together with Toyota Research Institute – Advanced Development, Inc. and DENSO we collaborated on advanced mapmaking method for automated driving .
> TomTom partnered with Amazon to power the Alexa Auto SDK .
> Together with Delphi Technologies, we demonstrated in real-world drive tests that our ADAS map can help deliver fuel savings of more than 10% in passenger cars .
> Uber joined TomTom’s Map Editing Partnership program .
> We continue to partner with local and global companies, like FourSquare, to provide users with high-quality POI data around the world .
> TomTom partnered with Cerence to power the new Fiat 500’s voice control .
> TomTom’s collaboration with the EU Commission backed Data for Road Safety initiative has resulted in a ready-to-deploy system to warn drivers about dangerous driving conditions .
OTHER NEWS > TomTom recognized as Innovation Supplier of the Year by FCA .
> TomTom’s maps power over three million ADAS-equipped vehicles on roads around the world today .
FOR MORE INFORMATIONtomtom .com/company/press-releases
40
OPERATIONAL REVIEW
2020 operational performance highlights

Corporate governance . . . . . . . . . . . . . . . . . . . . . . . . . . . .42
Management Board . . . . . . . . . . . . . . . . . . . . . . . . . . . . . . .46
Supervisory Board . . . . . . . . . . . . . . . . . . . . . . . . . . . . . . . .49
Risk management and control . . . . . . . . . . . . . . . . . . . . .53
Investor relations . . . . . . . . . . . . . . . . . . . . . . . . . . . . . . . .59
Management Board statements . . . . . . . . . . . . . . . . . . .60
Supervisory Board report . . . . . . . . . . . . . . . . . . . . . . . . . .62
Remuneration report . . . . . . . . . . . . . . . . . . . . . . . . . . . . .67
Supervisory Board statements . . . . . . . . . . . . . . . . . . . .79
41
GOVERNANCE

At TomTom we foster sound corporate governance . Our governance framework is driven by five themes .
Soundcorporate
governance
Corporateresponsibility
Risk managementand internal controlframework
Culture
Long-termvalue creation
Compliancewith laws andregulations
Long-term value creationWe aim to create the most relevant and beneficial impact for all stakeholders in everything that we do through a successful sustainable value creation model . Together with our people, customers and partners we are leading progress . We strive to make the most innovative technologies that help drive progress towards our vision of a safer, cleaner, congestion-free world . We allocate capital to the businesses we think offer the best prospects for growth and returns .
CultureOur people and culture are fundamental for our success . Innovation is not only in our technology; it is also part of who we are, both as individuals and as a global collective of around 4,500 people . Together we think big, share, learn fast and support each other’s growth and development . We have an agile work culture with an entrepreneurial spirit, where our talents make an impact .
Risk management and internal control frameworkRisk management forms an integral part of how we govern and manage business . Our risk management processes are designed to identify and evaluate opportunities and risks as early as possible . We take appropriate measures in order to seize opportunities and limit business losses with an aim to avoid risks that pose a threat to our
future, thus, strengthening our ability to create value . Our Internal Control framework is designed to maintain integrated management control over the company’s operations with a primary aim of ensuring integrity of financial reporting and compliance with laws and regulations .
Corporate responsibilityAs a global business, we contribute to society through our technologies . We embrace our responsibility to not only minimize our negative impact, but also maximize the positive one . We do so by giving back to the communities in which we are present . We uphold ethical business practices, including strict data privacy practices . We are committed to a high degree of transparency . We engage with stakeholders to understand their standpoints and interests .
Compliance with laws and regulationsOur governance structure is predominantly based on our Articles of Association, Dutch Civil Code (DCC) requirements, the most recent Dutch Corporate Governance Code (the Code) and complemented by our Code of Conduct, internal policies and procedures . We monitor and assess our corporate governance structure to ensure compliance with the Code, applicable laws and regulations, and relevant developments .
42
We are committed to conducting business in a transparent, ethical and accountable way
CORPORATE GOVERNANCE
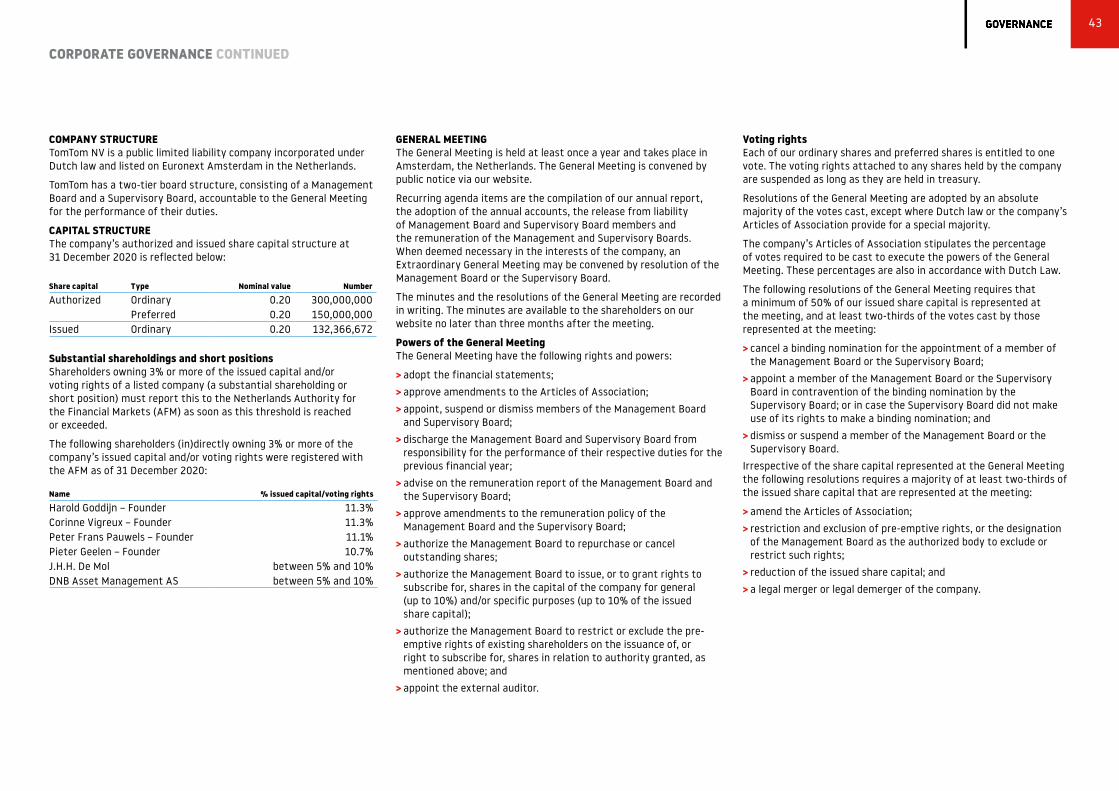
COMPANY STRUCTURETomTom NV is a public limited liability company incorporated under Dutch law and listed on Euronext Amsterdam in the Netherlands .
TomTom has a two-tier board structure, consisting of a Management Board and a Supervisory Board, accountable to the General Meeting for the performance of their duties .
CAPITAL STRUCTUREThe company’s authorized and issued share capital structure at 31 December 2020 is reflected below:
Share capital Type Nominal value Number
Authorized Ordinary 0 .20 300,000,000Preferred 0 .20 150,000,000
Issued Ordinary 0 .20 132,366,672
Substantial shareholdings and short positionsShareholders owning 3% or more of the issued capital and/or voting rights of a listed company (a substantial shareholding or short position) must report this to the Netherlands Authority for the Financial Markets (AFM) as soon as this threshold is reached or exceeded .
The following shareholders (in)directly owning 3% or more of the company’s issued capital and/or voting rights were registered with the AFM as of 31 December 2020:
Name % issued capital/voting rights
Harold Goddijn – Founder 11 .3%Corinne Vigreux – Founder 11 .3%Peter Frans Pauwels – Founder 11 .1%Pieter Geelen – Founder 10 .7%J .H .H . De Mol between 5% and 10%DNB Asset Management AS between 5% and 10%
GENERAL MEETINGThe General Meeting is held at least once a year and takes place in Amsterdam, the Netherlands . The General Meeting is convened by public notice via our website .
Recurring agenda items are the compilation of our annual report, the adoption of the annual accounts, the release from liability of Management Board and Supervisory Board members and the remuneration of the Management and Supervisory Boards . When deemed necessary in the interests of the company, an Extraordinary General Meeting may be convened by resolution of the Management Board or the Supervisory Board .
The minutes and the resolutions of the General Meeting are recorded in writing . The minutes are available to the shareholders on our website no later than three months after the meeting .
Powers of the General MeetingThe General Meeting have the following rights and powers:
> adopt the financial statements;
> approve amendments to the Articles of Association;
> appoint, suspend or dismiss members of the Management Board and Supervisory Board;
> discharge the Management Board and Supervisory Board from responsibility for the performance of their respective duties for the previous financial year;
> advise on the remuneration report of the Management Board and the Supervisory Board;
> approve amendments to the remuneration policy of the Management Board and the Supervisory Board;
> authorize the Management Board to repurchase or cancel outstanding shares;
> authorize the Management Board to issue, or to grant rights to subscribe for, shares in the capital of the company for general (up to 10%) and/or specific purposes (up to 10% of the issued share capital);
> authorize the Management Board to restrict or exclude the pre-emptive rights of existing shareholders on the issuance of, or right to subscribe for, shares in relation to authority granted, as mentioned above; and
> appoint the external auditor .
Voting rightsEach of our ordinary shares and preferred shares is entitled to one vote . The voting rights attached to any shares held by the company are suspended as long as they are held in treasury .
Resolutions of the General Meeting are adopted by an absolute majority of the votes cast, except where Dutch law or the company’s Articles of Association provide for a special majority .
The company’s Articles of Association stipulates the percentage of votes required to be cast to execute the powers of the General Meeting . These percentages are also in accordance with Dutch Law .
The following resolutions of the General Meeting requires that a minimum of 50% of our issued share capital is represented at the meeting, and at least two-thirds of the votes cast by those represented at the meeting:
> cancel a binding nomination for the appointment of a member of the Management Board or the Supervisory Board;
> appoint a member of the Management Board or the Supervisory Board in contravention of the binding nomination by the Supervisory Board; or in case the Supervisory Board did not make use of its rights to make a binding nomination; and
> dismiss or suspend a member of the Management Board or the Supervisory Board .
Irrespective of the share capital represented at the General Meeting the following resolutions requires a majority of at least two-thirds of the issued share capital that are represented at the meeting:
> amend the Articles of Association;
> restriction and exclusion of pre-emptive rights, or the designation of the Management Board as the authorized body to exclude or restrict such rights;
> reduction of the issued share capital; and
> a legal merger or legal demerger of the company .
43
CORPORATE GOVERNANCE CONTINUED

Issue of shares The Management Board is authorized by a resolution of the General Meeting to issue shares, or grant rights to subscribe for shares, subject to the approval of the Supervisory Board and limited to 10% of the issued share capital . No resolution of the General Meeting is required for the issuance of shares pursuant to this previously granted right .
The Management Board continues to believe it is in the company’s best interests to be in a position to react promptly when business opportunities arise that require the issuance of ordinary shares .
The Management Board wishes to be authorized to issue ordinary, or grant rights to subscribe for, shares should such an occasion arise, without the need to obtain prior approval from the shareholders at an Extraordinary General Meeting . Such meetings take time to convene and could generate disruptive market speculation .
Repurchase by the company of its own sharesOn 2 March 2020, TomTom announced the start of a Share Buyback Program to repurchase ordinary TomTom shares on Euronext Amsterdam for an amount up to EUR 50 million to cover the company’s commitments for its stock option and share plans . It was decided to suspend this share buyback program as of 31 March 2020, as a result of the COVID-19 pandemic’s impact on our revenue and cash flow . The total number of shares repurchased under the program up to and including 31 March 2020, was 2,354,433 shares for a total aggregate consideration of €16 .6 million .
At 31 December 2020, the remaining number of treasury shares outstanding was 2,103,853 equal to a capital interest of 1 .6% of TomTom NV . Details of the share buyback transactions can be found on our corporate website .
Preferred sharesStichting Continuïteit TomTom (referred to as the Foundation) has been granted a call option entitling it to subscribe for preferred shares up to 100% of the aggregate nominal value of the outstanding ordinary shares at the time of issue, up to a maximum of the number of preferred shares included in the authorized capital at the time of issue . The Foundation shall subscribe for the preferred shares at par value . Immediately after subscribing for preferred shares, the Foundation shall proceed to pay one-quarter of the nominal value of the preferred shares at the time of issue .
Three-quarters of the nominal amount shall only need to be paid upon call by the company, without prejudice to the provisions of article 2:84 of DDC . The Foundation is entitled to exercise the option right in one or more tranches . The possible issuance of preferred shares to the Foundation will be temporary and subject to the Articles of Association and the legislation on takeovers .
Unless the preferred shares have been issued pursuant to a resolution of the General Meeting, the Articles of Association require that a General Meeting be held within one year after the issue of preferred shares to consider their purchase or withdrawal . If no resolution on the purchase or withdrawal of the preferred shares is adopted at such a General Meeting, a General Meeting will be held every year thereafter for as long as the preferred shares remain outstanding .
The Foundation was established in 2005, with a board independent of TomTom . The purpose of the Foundation is to safeguard the company’s interests and all of its stakeholders, and prevent influences that may threaten its continuity, or identity .
To date, no preferred shares have been issued .
44
CORPORATE GOVERNANCE CONTINUED

2020 AGMDuring 2020, two General Meetings were held .
Following the extraordinary circumstances relating to the COVID-19 pandemic, the 2020 Annual General Meeting was postponed from 15 April to 15 June . The meeting was held fully virtually in accordance with the emergency bill (Tijdelijke wet COVID-19 Justitie en Veiligheid), which entered into force on 24 April 2020 .
EY was appointed as external auditor by the 2018 General Meeting for a term of three years, up to and including the financial year 2020 . It is decided to propose to the General Meeting in 2021 to extend EY’s appointment for another three-year term (2021-2023) .
An Extraordinary General Meeting was held on 13 October 2020 for the purpose of appointing a new Supervisory Board member .
The following table includes a list of key resolutions passed by the General Meeting . The complete list of resolutions passed is available on our corporate website .
Topic Resolutions adopted in 2020 Period (if applicable)
Appointment Re-appointment of Alain De Taeye as a member of the Management Board
Appointment of Hala Zeine as a member of the Supervisory Board1
4 years, until 2024 AGM
4 years, until 2024 AGMManagement Board authorization
Extension of authorization to resolve to acquire shares in the capital of the Company on the stock exchange or otherwise, under certain conditions .
Extension of authorization to issue or to grant rights to subscribe for shares in the capital of the company up to 10% of the issued share capital for general purposes
Extension of authorization to issue or to grant rights to subscribe for shares in the capital of the company up to 10% of the issued share capital for mergers, acquisitions or (strategic) alliances
18 months, until 15 Dec 2021
18 months, until 15 Dec 2021
18 months, until 15 Dec 2021
Articles of Association Amendment to facilitate shareholder participation through electronic means and electronic voting at a general meeting and brought in line with (new) legislation
n/a
Remuneration Adjustment of the Remuneration Policy of the Management Board and Supervisory Board in line with article 2:135a sub 2 of DCC
Favourable advisory vote cast on the 2019 Remuneration Report in line with article 2:135b sub 2 of DCC2
Once every four year period
Every year
1 Adopted at the Extraordinary General Meeting .2 This vote was cast for the first time in 2020 .
FOR MORE INFORMATIONtomtom .com/company/ corporate-governance
45
CORPORATE GOVERNANCE CONTINUED

ALAIN DE TAEYEMEMBER OF THE MANAGEMENT BOARDNationality BelgianYear of first appointment 2008Term of office 2020–2024Age 63
Current positionsNon-Executive Director of Cyient Ltd
Former positionsAlain founded Informatics and Management Consultants (I&M), where, next to IT Consultancy, he continued his research work on digital map databases and routing . In 1989, I&M was integrated into the Dutch Tele Atlas Group . From 1990, Alain headed Tele Atlas, which was acquired by TomTom in 2008 . The same year, Alain became a member of TomTom’s Management Board
EducationGraduated as engineer-architect, University of Ghent
TACO TITULAERCHIEF FINANCIAL OFFICERNationality DutchYear of first appointment 2015Term of office 2019–2023Age 49
Current positionsMember of the Executive Master of Finance and Control Advisory Board, University of Amsterdam
Former positionsTaco joined TomTom in 2005, holding various senior management positions in Group Control, Treasury and Investor Relations before his appointment as CFO in 2015 . Prior to TomTom, Taco spent eight years with KPN, holding various senior management roles in Finance and Investor Relations
EducationMaster’s degree in Business Economics, University of Groningen
HAROLD GODDIJNCHIEF EXECUTIVE OFFICERNationality DutchYear of first appointment 2001Term of office 2017–2021Age 60
Current positionsMember of the Supervisory Board of Coolblue
Former positionsHarold began his career with a venture capital firm . In 1989, he founded and led Psion Netherlands BV, a joint venture with Psion PLC . He also served on the board of Psion PLC . In 1991, he co-founded TomTom together with Corinne Vigreux, Peter-Frans Pauwels and Pieter Geelen . Harold has been the CEO of TomTom since 2001
EducationMaster’s degree in Economics, University of Amsterdam
46
The Management Board is responsible for the day-to-day management of TomTom’s operations . Our Management Board consists of three members:
Management Board

Composition and appointmentPer our Articles of Association, the Management Board must consist of at least two members, and is jointly (two members acting jointly) authorized to represent the company . Each member is appointed for a maximum period of four years, with the possibility of re-appointment for consecutive four-year terms in accordance with the Code .
No member holds more than two supervisory positions at Dutch ‘large companies’ in accordance with article 2:132a of DCC .
The General Meeting appoints the members of the Management Board, subject to the right of the Supervisory Board to make a binding nomination as described under the powers of the General Meeting .
DiversityThe Management Board’s composition is based on diversity of experience, background, skills, knowledge and insights . Currently, TomTom has no women in the Management Board and as such it does not presently comply with upcoming Dutch legislation .
TomTom believes in the strength of diversity and will, when a vacancy in the Management Board arises, consider all diversity aspects, including gender diversity . Currently, TomTom does not have any plans to change the composition of the Management Board . Information on diversity and inclusion at TomTom is available online on our corporate governance website .
Responsibilities The Management Board is responsible for the day-to-day management of TomTom’s operations and is herewith guided by the company’s interests and considers the interests of all stakeholders .
Management Board’s responsibilities involve, among others:
> create long-term value by establishing and achieving strategic objectives;
> manage an adequate risk management and internal control framework; and
> manage legal compliance and sustainability matters .
The Management Board consults with the Supervisory Board on important matters and submits important decisions to the Supervisory Board for its preapproval, as further described in the company’s Articles of Association, which are available on our corporate governance website page .
The Management Board is accountable for its actions to the Supervisory Board and the General Meeting .
Risk management and internal control frameworkWe have a Risk Management and Internal Control Framework in place . Our risk management is designed to identify and evaluate opportunities and risks as early as possible and to take appropriate measures in order to seize opportunities and limit business losses . The strategic risks and opportunities are monitored continuously over the year by our Product Office department .
The operational, financial and legal and compliance risks are monitored by our corporate risk management function, which also has regular meetings with the Product Office to ensure complete reporting on the overall risk profile of TomTom . The group risk profile is taken into account when establishing our strategy, annual business plans and budgets . The internal controls are contained and maintained in the Internal Control Framework .
The Audit Committee assists the Supervisory Board in its responsibility to oversee the system of internal control and risk management, including the effectiveness of the internal auditors . For more information reference is made to the Audit Committee activities included in the Supervisory Board Report .
A full overview of the Risk Management and Internal Control Framework is included in the Risk Management and Control section .
47
MANAGEMENT BOARD CONTINUED

Conflicts of interestMembers of the Management Board must report any (potential) conflict of interest to the Chairman of the Supervisory Board . The Supervisory Board shall decide whether a conflict of interest exists .
The member of the Management Board who has a (potential) conflict of interest shall not participate in discussions and decision-making on a subject or transaction in relation to which the member has a conflict of interest with the company . Decisions to enter into transactions under which members of the Management Board have conflicts of interest that are of material significance to the company and/or to the relevant member(s) of the Management Board, require the approval of the Supervisory Board . No such transactions have been concluded in 2020 .
RemunerationThe Supervisory Board determines each Management Board member’s remuneration in line with the Remuneration Policy . The Remuneration Policy is subject to a binding vote of the General Meeting once every four years . This vote occurred for the first time in 2020 .
The application of the Remuneration Policy over 2020 is described in the Remuneration Report and is subject to an advisory vote of the General Meeting in 2021 .
The remuneration of individual members of the Management Board can be found in the Remuneration Report . The Remuneration Policy can be found on the corporate website .
CommitteesThe Management Board is supported by committees in their day-to-day management responsibility .
Committees Composition Responsibilities
Senior Leadership Team1 Chief Technology Officer, Chief Product Officer, SVP Engineering, Heads of Sales (Automotive, Enterprise, Consumer), Chief Marketing Officer, Chief HR Officer and Chief of Staff
Supports the Management Board members with expertise and advice in executing the company’s strategy and business priorities .
Disclosure Committee Representatives of Legal, Group Control, Investor Relations and Corporate Communications
(i) Ensure compliance with the disclosure requirements under applicable laws and regulations;
(ii) assist and inform the Management Board on the maintenance and evaluation of disclosure controls and procedures; and
(iii) gather all relevant financial and non-financial information and assess materiality, timelines and necessity for disclosure of such information .
1 Not deemed to be an Executive Committee, as referred to in best practice provision 2 .1 .3 of the Code .
48
MANAGEMENT BOARD CONTINUED

DERK HAANKCHAIRMANNationality DutchDate of first appointment 28 September 2018Term of office 2018–2022Age 67
Current positionsVice Chairman of the Supervisory Board of KPN
Former positionsCEO of Springer Science+Business Media, CEO of Elsevier Science and member of the Executive Board of Reed Elsevier PLC
CommitteesRemuneration Committee Selection and Appointment Committee (Chairman)
ExpertiseBusiness leadership, commercial, transformation
JACQUELINE TAMMENOMS BAKKER DEPUTY CHAIRMANNationality DutchDate of first appointment 1 May 2014Term of office 2018–2022Age 67
Current positionsNon-Executive Director of CNH Industrial NV, Supervisory Board member of Royal Boskalis Westminster NV and Groupe Wendel
Former positionsNon-executive Director of Tesco PLC, Vivendi and Unibail Rodamco Westfield, Chairman Van Leer Group Foundation, Director General at the Dutch Ministry of Transport (Civil Aviation and Freight Transport), Chairman of the High-Level Group for the future of aviation regulation in Europe, consultant at McKinsey & Company, and several positions at Shell and Quest International
CommitteeRemuneration Committee (Chairman) Selection and Appointment Committee
ExpertiseGovernance, remuneration and international business
JACK DE KREIJNationality DutchDate of first appointment 1 January 2017Term of office 2017–2021Age 61
Current positionsNon-Executive board member of Oranje Fonds, Supervisory Board member and Chairman of the Audit Committee of Corbion NV and Wolters Kluwer NV, Vice Chairman of the Supervisory Board and Chairman of the Audit Committee of Royal Boskalis Westminster NV, Global Advisory Board member of Metyis
Former positionsVice Chairman of the Executive Board and CFO of Royal Vopak NV, Senior Partner & Transaction services Territory Leader PricewaterhouseCoopers NV (PwC), and formerly employed with the Dutch Ministry of Finance
CommitteesAudit Committee (Chairman)
ExpertiseFinance, audit and risk management, governance and international business
49
Supervisory BoardThe Supervisory Board supervises the Management Board and TomTom’s general affairs and supports the Management Board by providing advice . Our Supervisory Board consists of five members:

HALA ZEINENationality GermanDate of first appointment 13 October 2020Term of office 2020–2024Age 41
Current positionsChief Product Officer of Celonis and Board of Advisors member of Holtzbrinck Publishing Group
Former positionsPresident of Digital Supply Chain and various management positions at SAP SE
CommitteesAudit committee
ExpertiseTechnology, innovation, and transformation
MICHAEL RHODINNationality AmericanDate of first appointment 24 April 2017Term of office 2017–2021Age 60
Current positionsIndependent Director of Openbank (subsidiary of Santander), Board of Directors member of HZO, Inc ., Board of Directors member of Precisely (formerly known as SyncSort Inc .), and advisory board member of Arboretum Ventures
Former positionsSenior Vice President of IBM
CommitteesAudit committee
ExpertiseTechnology, innovation, and transformation
50
SUPERVISORY BOARD CONTINUED

Composition and appointmentThe Supervisory Board shall consist of a minimum of three members . The Supervisory Board appoints a Chairman and a Deputy Chairman from amongst its members .
DiversityThe Supervisory Board has determined a profile regarding its size and composition, taking into account the nature of TomTom’s business, its activities and the desired experience and expertise .
Currently, the Supervisory Board has two women members and, as such, presently complies with upcoming Dutch legislation .
The General Meeting appoints the Supervisory Board members, subject to the right of the Supervisory Board to make a binding nomination . The full procedure of appointment and dismissal of members is explained in article 17 of the company’s Articles of Association .
In accordance with the Code, members may be appointed for a maximum period of 12 years; after four years, re-appointment for another four-year period is possible and subsequently again for a period of two years, which appointment may be extended by at most two years .
Members may retire periodically in accordance with a rotation plan, which can be downloaded from our corporate governance website page .
Bernd Leukert stepped down from the Supervisory Board on 7 April 2020 as the German banking regulator did not allow him to combine his duties at Deutsche Bank with his Supervisory Board position at TomTom . On 13 October 2020, Hala Zeine was appointed as a member of the Supervisory Board .
Role and responsibilitiesThe Supervisory Board oversees the Management Board in how it executes its strategic objectives and operations . It regularly discusses the strategy and the associated risks and supports the Management Board by providing advice . It acts in the interest of the company and all stakeholders: employees, shareholders, customers and society, including the environment .
According to our Articles of Association certain decisions of the Management Board are subject to the approval of the Supervisory Board . This includes resolutions of the Management Board to issue, or grant rights to acquire, shares or restrict or exclude pre-emptive rights . Reference in this respect to article 14 of our Articles of Association .
A description of the activities of the Supervisory Board in 2020 is given in the Supervisory Board Report section .
Objectives
An equal number of men and women during a search, selection and appointment procedure
At least one woman in the Management Board
At least two women in the Supervisory Board
A Supervisory Board Chairman living in the Netherlands
At least one member in the Supervisory Board from outside the EU
At least two members in the Supervisory Board with a technology/software background
Legend:
Achieved
More to do
Legend:
Chairman
Member
Term
CommitteesAC RemCo SelCo Date of initial appointment 2020 2021 2022 2023 AGM 2024
Derk Haank (Chairman) 26 September 2018
Jacqueline Tammenoms Bakker (Deputy Chairman) 1 May 2014
Jack de Kreij 1 January 2017
Michael Rhodin 24 April 2017
Hala Zeine 13 October 2020
2
1
1
1
1
51
SUPERVISORY BOARD CONTINUED

CommitteesIn line with the Code, the Supervisory Board has established an Audit Committee, a Remuneration Committee and a Selection and Appointment Committee . Each of these committees is staffed by members of the Supervisory Board and at least one of the members of the Audit Committee is a financial expert according to the criteria of the Corporate Governance Code .
A description of the activities performed by each of the committees during 2020 is given in the Supervisory Board Report .
AUDIT COMMITTEEThe Audit Committee (AC) undertakes preparatory work for the Supervisory Board’s decision-making regarding the supervision of the integrity and quality of the company’s financial reporting and the effectiveness of the company’s internal risk management and control systems . The AC monitors the performance and observations of the external auditor and the effectiveness of the external audit process, as well as its independence .
For its composition and the way in which the AC discharges its duties, reference is made to the AC Charter .
SELECTION AND APPOINTMENT COMMITTEEThe Selection and Appointment Committee (SelCo) is responsible for the size and composition of the Supervisory Board, its succession planning and the functioning of its members . It also pays strong attention to the company’s talent management and succession planning for key positions .
For its composition and the way in which the SelCo discharges its duties, reference is made to the SelCo Rules .
REMUNERATION COMMITTEEThe Remuneration committee (RemCo) prepares the Supervisory Board’s decision-making regarding the remuneration of the individual Management Board members and the remuneration of the Supervisory Board . The RemCo oversees the effectiveness, relevance and implementation of the Remuneration Policy .
For its composition and the way in which the RemCo discharges its duties, reference is made to the RemCo Rules .
Conflicts of interestMembers of the Supervisory Board (excluding the Chairman) must report any (potential) conflict of interest to the Chairman of the Supervisory Board . If the (potential) conflict of interest involves the Chairman of the Supervisory Board, it must be reported to the Deputy Chairman of the Supervisory Board . The Supervisory Board shall decide whether a conflict of interest exists .
The member who has a (potential) conflict of interest shall not participate in discussions and decision-making on a subject or transaction in relation to which the member has a conflict of interest with the company . Decisions to enter into transactions under which members of the Supervisory Board have conflicts of interest that are of material significance to the company and/or to the relevant member(s) of the Supervisory Board, require the approval of the Supervisory Board . No such transactions have been concluded in 2020 .
In addition, in accordance with provision 2 .7 .5 of the Code, we report that no transactions occurred in 2020 between the company and legal or natural persons who hold at least 10% of the shares in the company .
RemunerationThe General Meeting determines the remuneration of the members of the Supervisory Board including the members of its committees . The Supervisory Board Remuneration Policy is subject to a binding vote of the General Meeting once every four years . This vote occurred for the first time in 2020 .
The application of the Remuneration Policy over 2020 is described in the Remuneration Report (also available on our corporate website) which report is subject to an advisory vote of the General Meeting in 2021 .
The remuneration of individual members of the Supervisory Board can be found in the Remuneration Report . The Remuneration Policy can be found on the corporate website .
FOR MORE INFORMATION:Corporate governance-related documents are available on our website, including, amongst others:
> Articles of Association
> Management Board Remuneration Policy
> Supervisory Board Remuneration Policy
> Supervisory Board Rotation Plan
> Code of Conduct
> Open Ears procedure
> Diversity and Inclusion Policy
> Policy on bilateral and other contacts with shareholders
> Inside Information Policy
52
SUPERVISORY BOARD CONTINUED

Risk management forms an integral part of how TomTom is being governed and managed . Our approach is represented by the underlying methodology which is based on criteria of the Committee of Sponsoring Organizations of the Treadway Commission (COSO) .
TomTom’s risk management approach is designed to identify and evaluate opportunities and risks as early as possible and to take appropriate measures in order to seize opportunities and limit business losses . The aim is to avoid risks that pose a threat to TomTom’s future and to strengthen our ability to create long-term value .
Establish a strong risk managementenvironment
Define risk appetite
Assess risks and risk response
Report on risks andrisk trends
ESTABLISH A STRONG RISK MANAGEMENT ENVIRONMENTTomTom aims to establish a strong risk management environment . Our risk management framework is designed to address the strategic risks related to the development of new products and our core markets as well as our operational, financial and legal and compliance risks .
The strategic risks and opportunities are discussed regularly when we review the product roadmap of our core technologies whereby critical developments are monitored continuously over the year . This process is facilitated by our Product Office department . The operational, financial and legal and compliance risks are monitored by our corporate risk management function . The corporate risk management function meets regularly with the Product Office to ensure overall alignment and knowledge sharing .
When taking decisions, the risk management function considers its risk appetite and seeks to manage risks consistently with the risk appetite . The identified risks and mitigating actions are expanded and cascaded to specific units . Trends on impact and likelihood are monitored over the year .
A single owner is assigned responsibility for each identified risk topic, which helps to ensure clear accountability for mitigating actions .
The output from the risk management process is input to our annual budgets and longer-term planning .
Our risk management approach enables a controlled framework for managing material risks while thoughtfully considering the relevant entrepreneurial spirit and behavior drivers within the organization .
DEFINE RISK APPETITEOur willingness to assume calculated risks and uncertainties (the risk appetite) differs for each category . The level of the company’s risk appetite gives guidance as to what detailed level TomTom will take measures to control such uncertainties .
The Risk Overview table highlights the appetite and the potential impact on the group’s strategic, operational and financial objectives if one or more of the main risks and uncertainties were to materialize . The expected likelihood of a risk occurring is also disclosed . The risk severity shown relates to residual risk . This means that the risks are described after taking all mitigating risk responses into consideration .
ASSESS RISKS AND RISK RESPONSEThe objective of our internal control framework is to maintain integrated management control of the company’s operations in order to ensure the integrity of the financial reporting, as well as compliance with laws and regulations . Assurance on the effectiveness of controls is obtained through, among others, management reviews, monitoring dashboards, self-assessments, internal audits and testing of certain aspects of our internal financial control systems . Our systems are designed to manage, rather than eliminate, the risk that we fail to achieve our business objectives and can provide reasonable, but not absolute, assurance against financial loss or material misstatements in the financial statements .
53
RISK MANAGEMENT AND CONTROL
Our innovative and entrepreneurial culture is supported by a risk management and internal control framework
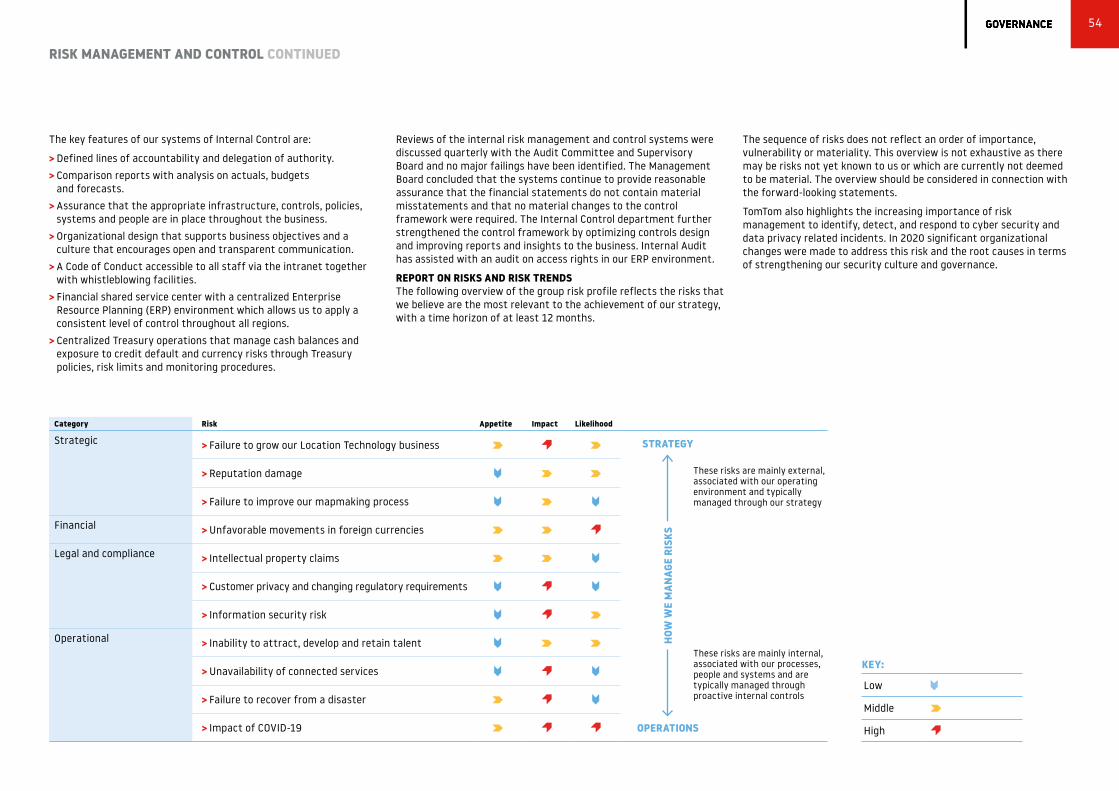
The key features of our systems of Internal Control are:
> Defined lines of accountability and delegation of authority .
> Comparison reports with analysis on actuals, budgets and forecasts .
> Assurance that the appropriate infrastructure, controls, policies, systems and people are in place throughout the business .
> Organizational design that supports business objectives and a culture that encourages open and transparent communication .
> A Code of Conduct accessible to all staff via the intranet together with whistleblowing facilities .
> Financial shared service center with a centralized Enterprise Resource Planning (ERP) environment which allows us to apply a consistent level of control throughout all regions .
> Centralized Treasury operations that manage cash balances and exposure to credit default and currency risks through Treasury policies, risk limits and monitoring procedures .
Reviews of the internal risk management and control systems were discussed quarterly with the Audit Committee and Supervisory Board and no major failings have been identified . The Management Board concluded that the systems continue to provide reasonable assurance that the financial statements do not contain material misstatements and that no material changes to the control framework were required . The Internal Control department further strengthened the control framework by optimizing controls design and improving reports and insights to the business . Internal Audit has assisted with an audit on access rights in our ERP environment .
REPORT ON RISKS AND RISK TRENDSThe following overview of the group risk profile reflects the risks that we believe are the most relevant to the achievement of our strategy, with a time horizon of at least 12 months .
Category Risk Appetite Impact Likelihood
Strategic > Failure to grow our Location Technology business
> Reputation damage
> Failure to improve our mapmaking process
Financial > Unfavorable movements in foreign currencies
Legal and compliance > Intellectual property claims
> Customer privacy and changing regulatory requirements
> Information security risk
Operational > Inability to attract, develop and retain talent
> Unavailability of connected services
> Failure to recover from a disaster
> Impact of COVID-19
These risks are mainly external, associated with our operating environment and typically managed through our strategy
STRATEGY
These risks are mainly internal, associated with our processes, people and systems and are typically managed through proactive internal controls
OPERATIONS
HOW
WE
MAN
AGE
RISK
SKEY:
Low
Middle
High
The sequence of risks does not reflect an order of importance, vulnerability or materiality . This overview is not exhaustive as there may be risks not yet known to us or which are currently not deemed to be material . The overview should be considered in connection with the forward-looking statements .
TomTom also highlights the increasing importance of risk management to identify, detect, and respond to cyber security and data privacy related incidents . In 2020 significant organizational changes were made to address this risk and the root causes in terms of strengthening our security culture and governance .
54
RISK MANAGEMENT AND CONTROL CONTINUED

New risk N
Unchanged U
Increased I
Decreased D
Category: Strategic
Risk Trend Description Impact Response
Failure to grow our Location Technology business
I We are in a market with continuously changing market needs and technology developments . We might be unable to pursue new opportunities and may lose market share versus competition . Also, new map and navigation providers are entering the automotive market, which will increase the level of competition we face .
There could be additional operational and technical challenges (successful development of new products and investing in the right technologies) in growing our Location Technology business and maintaining profitability over the longer term in such a rapidly evolving environment . If we are unsuccessful in maintaining and growing a profitable business, our financial condition, operational result and liquidity may be materially adversely affected .
We believe TomTom is well positioned to address the future needs of our customers and to successfully pursue Automotive and Enterprise opportunities . We are focused on cementing our position as a leading location technology specialist . With our technological innovation, we continuously develop new product and service offerings in the areas of driver navigation and automated driving . We believe these and other innovations will allow us to remain competitive .
Reputation damage U All our products and services are brought to market under one brand . This leads to brand concentration risk . Brand value can be severely damaged, even by isolated incidents affecting the reputation of our business or our products and services .
Some of these incidents may be beyond our ability to control and can erode customer confidence in our products or services . Factors that negatively affect our reputation or brand image, such as adverse consumer publicity, not meeting service level agreements, inferior product quality or late delivery of customer commitments, could have a material adverse effect on our financial condition and results of operation .
TomTom has a process in place that reviews each new opportunity and monitors whether we can deliver upon the customers’ expectations . Next, we employ a rigorous quality management process for our products and services before they are launched . Also, internal policies, governance teams and our Code of Conduct are designed to further mitigate the risk of incidents that could result in reputation or brand damage . Lastly, TomTom’s Customer Care department aims to provide quality, responsive customer service and proactively monitors various digital platforms for customer feedback and issues .
Failure to improve our mapmaking process
D The competitive environment requires continuous investment in new technology for creating and updating map databases . All our map content needs to be constantly updated for changes in the environment and we are constantly adding new geographies and attributes to our map database to enable us to meet the needs of existing and new customers, bring out new products and expand into new markets .
If we are unable to innovate sufficiently to compete with other global map providers in terms of quality, costs, coverage and cycle times and to modernize our map creation, maintenance and delivery platforms, our map-based business may be materially adversely affected .
We aim to continuously improve our overall mapmaking process which is evidenced amongst others by investments in our Content Production Platform as well as partnerships we have established with our customers to further develop our content base .
55
RISK MANAGEMENT AND CONTROL CONTINUED

Risk Trend Description Impact Response
Unfavorable movements in foreign currencies
U The group operates internationally and conducts business in multiple currencies . Revenue is earned in EUR, USD and other currencies, and does not necessarily match cost of sales and other costs which are largely in EUR, USD and PLN and to a lesser extent in other currencies .
Foreign currency exposures on commercial transactions relate mainly to estimated purchases and sales transactions that are denominated in currencies other than our reporting currency (EUR) .
Unfavorable foreign currency movements will have a negative impact on our profitability .
We manage foreign currency transaction risk through options and forward contracts to cover forecasted net exposures . All such transactions are carried out within the guidelines set by our Corporate Treasury Policy, with appropriate risk limits and controls defined . Furthermore, we try to temper any negative foreign currency effect by conscious and calculated pricing of TomTom products and services to combat the negative impact of the exchange rate movement . Note 28 of the consolidated financial statements provides further information on other financial risks .
New risk N
Unchanged U
Increased I
Decreased D
Category: Financial
56
RISK MANAGEMENT AND CONTROL CONTINUED

Risk Trend Description Impact Response
Intellectual property claims U We rely on a combination of trademarks, trade names, patents, confidentiality and non-disclosure agreements, copyrights and design rights, to defend and protect our trade secrets and the intellectual property in our expanding range of products . We may be faced with claims that we have infringed in the intellectual property rights or patents of others .
Should claims be asserted against us, these may result in us being ordered to pay substantial damages or forced to stop or delay the development, manufacturing or sale of infringing products . Any such outcome could have a material adverse effect on our financial condition, results of operations and liquidity . Furthermore, even if we were to prevail, any litigation could be costly and time-consuming .
We have a dedicated Intellectual Property team responsible for the protection of our products and services against unauthorized use by third parties . By investing in R&D and obtaining and enforcing intellectual property rights, such as patents and trademarks (see page 6), we can prevent the competition from reproducing our unique products and services . Over time, we have developed a reputation for strongly defending our position in all intellectual property litigation, including against non-practicing entities (NPEs) .
Customer privacy and changing regulatory requirements
U We provide location-based products and services to individual customers . As there is growing public awareness and increased scrutiny by regulatory authorities, this means that compliance with privacy regulations and customer expectations is increasingly important in maintaining our competitive position . Next to this, various governments across the globe have implemented or are in the process of implementing legislation allowing law enforcement and intelligence services bodies direct access to data held by businesses . Depending on country and cultural background, this could raise additional concerns regarding the use of our products and services .
Our reputation and brand may suffer and regulatory sanctions may be imposed if we fail to comply with privacy laws and regulations or otherwise fail to meet our customers’ expectations in relation to privacy matters .
Inherent in the design and operations of our products and services we apply ‘privacy by design’ to ensure that our Privacy Principles, as well as obligations from applicable privacy laws and regulations, are structurally adhered to in the design of our products and services and throughout our operations . Refer to section Privacy and Data Governance for more information .
Information security risk I Our business operations and reputation are substantially dependent on our ability to maintain confidentiality, integrity and availability of information regarding customers, employees, suppliers, proprietary technologies, intellectual property and business processes .
Additionally, the volume and sophistication of information security (‘cybersecurity’) threats as well as regulatory requirements continue to grow .
The inadvertent disclosure of confidential information, unauthorized access to our systems and networks, defective products and sanctions potentially imposed by regulators could adversely affect our business, our reputation and could have a material adverse effect on our financial conditions, results of operations and liquidity .
We deploy and maintain information security governance, controls, processes and tools in our engineering, operations and products using a risk-based approach, based on ISO information security standards . In 2020 we further increased the capacity of the information security team, which helps to continuously update our defenses in a changing environment .
New risk N
Unchanged U
Increased I
Decreased D
Category: Legal and compliance
57
RISK MANAGEMENT AND CONTROL CONTINUED

Risk Trend Description Impact Response
Inability to attract, develop and retain talent
U Our markets are characterized by rapid technological change, which challenges us to deliver highly competitive products and services on an ongoing basis . In order to be a market leader in our industry, we need to have talented people working effectively together .
We aim to employ highly talented people in our organization, which enables us to create and deliver highly innovative products and services to our customers . If we are unable to attract, develop and retain the right people, our ability to operate our business successfully could be significantly impaired .
In our ambition to be the employer of choice in technology, our rigorous recruitment process aims to attract the best talents . We monitor the organizational health of the company and have programs in place to retain and keep employees engaged .
During the pandemic employee well-being has always been top of mind . We have therefore made tremendous efforts to understand what our employees needs are, and to see if we can offer customized experiences . In 2020 we have taken significant efforts following the COVID-19 situation to continue to invest in our workforce and ensure strong communication to be the employer of choice in order to attract and retain the talent we need . Also, we carefully consider our long-term strategy in relation to working from home to create the most optimal balance for our workforce . Refer to section People and Culture for more information .
Unavailability of connected services
U We provide a variety of customer-facing connected services on a 24/7 basis . These include live traffic information, location-based services and sales via our website .
To provide these services to our customers we rely on our own, as well as outsourced, information technology, telecommunications and other infrastructure systems .
A significant disruption to the availability of these systems could cause interruptions in our service to customers that may cause reputational damage and could trigger contractual penalties, which could in turn, have a material adverse effect on our financial condition and results of operations .
We have established a process for business continuity in regards to our internal infrastructure, including full redundancy for key services such as location-based services and some traffic delivery platforms . We have also transitioned most of our services to the cloud, which should further improve both availability and quality of our systems .
Failure to recover from a disaster
U Unforeseen business disruptions could affect our service to customers and cause loss of, or delays in TomTom’s critical business systems, our research and development work and/or product shipments .
Any permanent or temporary loss of these systems could result in reputational damage, loss of revenue and liabilities with our clients . In the case of a catastrophic disaster, our company’s success rests on our ability to restore our critical data and rebuild our IT business systems .
We have business continuity and disaster recovery planning in place for business-critical systems and various eventualities . However, we are unable to plan for every possible disaster or incident . A major failure of a business-critical system from which we are not able to quickly recover, could have a material adverse effect on our financial condition, results of operations and liquidity .
Impact of COVID-19 N The COVID-19 outbreak and its disruptive effects on society and the economy have adversely affected our Automotive and Consumer business in 2020 . While we expect to see recovery in 2021 this pandemic’s scale and duration remain uncertain .
While mitigating actions are being taken, this pandemic may further negatively impact our future revenue (e .g . due to lower car sales and slow-down in Consumer demand), results, cash flow from operations, and the valuation of assets as well as our workforce and supply chain .
TomTom has a strong cash position and we continue to execute upon our strategy and invest in our mapmaking platform, connected navigation product and our Maps APIs, laying the foundations for future success . Also we have started many initiatives to enable efficient working from home .
New risk N
Unchanged U
Increased I
Decreased D
Category: Operational
58
RISK MANAGEMENT AND CONTROL CONTINUED

We engage and maintain open dialogue with investors and analysts and have an extensive communication program, which includes the General Meeting, roadshows, investor conferences, presentations, webcasts and in-house meetings . Related events are reported and regularly updated on the Investor Relations website .
TomTom strictly adheres to applicable rules and legislation on fair disclosure . Our goal is to inform investors about the company and its management, strategy, goals and expectations in a transparent, timely and consistent manner . Contact with (potential) shareholders and analysts are at all times conducted in compliance with applicable rules and regulations, in particular those concerning market abuse, inside information and equal treatment .
For more information, please see Policy on bilateral and other contacts with shareholders on TomTom’s corporate website .
The company’s Investor Relations website contains up-to-date financial information about TomTom . Investors and analysts are encouraged to visit the Investor Relations website regularly for detailed and up-to-date coverage of the share price, shareholder meetings, quarterly and annual results, press releases, presentations, webcasts and investor relations-related events .
CLOSED PERIODDuring a closed period prior to the publication of the quarterly results, we do not engage in discussions with analysts, investors and financial journalists or make presentations at investor conferences .
FINANCIAL CALENDAR 2021Our financial calender can be found on our investor relations website . The scheduled dates for earnings releases are as follows:
Date Event
4 February 2021 Publication Q4 and FY 2020 results14 April 2021 Publication Q1 2021 results15 April 2021 Annual General Meeting15 July 2021 Publication Q2 2021 results14 October 2021 Publication Q3 2021 results
DIVIDEND POLICYTomTom’s dividend policy is not to distribute dividends . The company gives priority to increasing technology investments to strengthen its capabilities and competitive position . The company believes that allocating its cash resources to these priorities serves shareholders’ interests and the company’s objective of long-term value creation .
SHAREHOLDER STRUCTUREAn overview of the company’s shareholders with a holding (voting rights) of 3% or more of the issued capital can be found in the Corporate Governance section .
LISTINGTomTom NV shares are traded on Euronext Amsterdam in the Netherlands under the symbol TOM2 . The company is included in the Amsterdam Small Cap Index (AScX) .
The following table shows the company’s ordinary shareholder structure as at 31 December 2020:
# shares % of total
Harold Goddijn 15,023,609 11 .3%Corinne Vigreux 14,894,217 11 .3%Peter-Frans Pauwels 14,702,531 11 .1%Pieter Geelen 14,140,030 10 .7%Total founders 58,760,387 44.4%Free float 71,502,432 54 .0%Treasury shares1 2,103,853 1 .6%Total shares outstanding 132,366,672 100%
1 Treasury shares are related to the share buyback program held in 2020 .
SHARE PRICEThe graph below shows TomTom’s share price development during 2020 .
Traded volume Closing price
Jan 2020 Mar 2020 Jun 2020 Sep 2020 DEC 2020
SHA
RE
PR
ICE V
OLU
ME
2,000k
1,500k
1,000k
500k
00
2
4
6
8
10
12
59
We are committed to consistency and transparency in our reporting
INVESTOR RELATIONS

The Management Board report (consisting of pages 3 up to and including 61) and such parts of the financial statements as referred to in the Management Board report, comprise ‘Bestuursverslag’, within the meaning of article 2:391 of DCC .
IN CONTROL AND RESPONSIBILITY STATEMENTThe Management Board states, in accordance with best practice provision 1 .4 .3 of the Code, that:
> the Management Board report provides sufficient insight into any important deficiencies in the effectiveness of the internal risk management and control systems that may have been detected during the 2020 financial year and no major failings have been detected;
> the risk management and control systems provide a reasonable assurance that the 2020 financial statements do not contain any errors of material importance . Details are set out in the section Risk Management and Control;
> based on TomTom’s current state of affairs, it is justified that the financial reporting is prepared on a going concern basis . This is based upon the strong cash position and expected free cash flow generation of the company, the available (undrawn) credit facility and the risks facing the company . Commentary on the company’s cash flow, liquidity and financial position is set out in the Financial Review . The financial risk management is set out in note 28 of our consolidated financial statements; and
> the Management Board report discloses all material risks and uncertainties that are relevant regarding the expectation as to the continuity of TomTom for the 12-month period after the date of issue of this Management Board report .
The risk management and control section of the Management Board report provides a clear substantiation of the above mentioned statement .
With reference to section 5 .25c paragraph 2c of the Financial Markets Supervision Act, the Management Board states that, to the best of its knowledge:
> The annual financial statements give a true and fair view of the assets, liabilities, financial position and loss of the company and the undertakings included in the consolidation taken as a whole .
> The Management Board report provides a fair view of the development and performance of the business and the position of the company and the undertakings included in the consolidation taken as a whole, together with a description of the principal risks and uncertainties that the company faces .
CORPORATE GOVERNANCE STATEMENTThe information required to be included in this Corporate Governance Statement as described in articles 3, 3a and 3b of the Dutch Decree on the contents of Directors’ Report (the Decree) are incorporated in the Management Board Report and the Supervisory Board Report sections .
The main characteristics of the company’s internal risk management measures and control systems connected to its financial reporting process, as required by article 3a sub a of the Decree, are described in the In Control and Responsibility Statement, in the Management Board report section .
OUR COMPLIANCE WITH THE CODETomTom complies with all the relevant best practice provisions of the Code, with the exception of best practice provisions 3 .1 .2 (v) and 4 .3 .3 . The nature of and reasons for these deviations are explained below .
Best Practice Provision 3.1.2 (v)Best practice provision 3 .1 .2 (v) provides that the variable remuneration component shall be linked to measurable performance criteria determined in advance, which shall be predominantly long-term in character .
TomTom deviates from best practice provision 3 .1 .2 (v) to the extent that it does not link its long-term incentive to pre-defined performance criteria . All RSUs granted under the Management Board Restricted Stock Unit Plan shall be granted conditional to continued employment of the Management Board members only . These grants have a vesting period of three years, with a subsequent two-year shareholding requirement . In addition, share ownership requirements has been set to encourage future shareholding for all Management Board members . The Supervisory Board reserves the right to decide not to award RSUs in a given year in case of exceptional market or business circumstances . The reason for this deviation is that it has proven difficult to set long-term performance targets in our rapidly evolving, dynamic market environment .
60
Management Board statements

Best Practice Provision 4.3.3Best practice provision 4 .3 .3 provides that the General Meeting may pass a resolution to cancel the binding nature of a nomination for the appointment of a member of the Management Board or the Supervisory Board and/or a resolution to dismiss a member of the Management Board or of the Supervisory Board by an absolute majority of the votes cast . It may be provided that this majority should represent a given proportion of the issued capital, the proportion of which may not exceed one-third .
Our Articles of Association provide that a binding nomination for the appointment of Management Board or Supervisory Board members may only be set aside by a resolution of the General Meeting passed with a two-thirds majority representing more than 50% of its issued share capital . The same provision applies to any resolution to dismiss a member of the Management Board or of the Supervisory Board .
The reason for this deviation is that the company believes that maintaining continuity in its Management Board and Supervisory Board is critical for delivering long-term value creation .
The company would like to protect its stakeholders against a sudden change in management by maintaining the qualified majority and voting quorum requirement, which is consistent with Dutch law .
INFORMATION PURSUANT TO THE DECREE ARTICLE 10 TAKEOVER DIRECTIVEThe Management Board states that all information, which must be disclosed pursuant to the Decree Article 10 Takeover Directive (‘Besluit artikel 10 overnamerichtlijn’), is included in the Corporate Governance section, the Supervisory Board report and the notes referred to herein, to the extent that it is applicable to TomTom .
NON-FINANCIAL STATEMENTDirective 2014/95/EU on the disclosure of non-financial information requires companies to publish a non-financial statement . The relevant provision has been implemented into Dutch law through the Decree disclosure on non-financial information (‘Besluit bekendmaking niet-financiele informatie’) . The information regarding environmental, anti-corruption and bribery matters and respect for human rights, as required by this Decree, is incorporated in the Responsible Business section . The information regarding social and employee matters, as required by this Decree, is incorporated in the People and Culture section .
Amsterdam, 4 February 2021
THE MANAGEMENT BOARD
HAROLD GODDIJNChief Executive Officer
TACO TITULAERChief Financial Officer
ALAIN DE TAEYEMember of the Management Board
61
MANAGEMENT BOARD STATEMENTS CONTINUED

TomTom is a leading independent location technology specialist . Its product portfolio and supportive technologies are innovative and competitive . In a fast-moving industry where heightened competition and rapid technology developments are constant, we ensure that the company pursues a growth strategy that positions it for future growth . We provide oversight, evaluate progress and performance, and maintain an adequate system of checks and balances, advising the Management Board as appropriate . In doing this, the Supervisory Board considers long-term value creation, the company’s culture, the interests of the company and its stakeholders, and management of a sustainable business model .
Our decision-making process is assisted by the Audit Committee, the Remuneration Committee, and the Selection and Appointment Committee . Each of these committees is staffed by members of the Supervisory Board .
The agile and entrepreneurial work culture, where talents learn fast, have impact and support each other’s growth and development, enables the company to continue creating the most innovative technologies to help shape tomorrow’s mobility .
We greatly appreciate the efforts and commitment of TomTom’s employees and its Management Board and we look forward to further successful execution of TomTom’s growth strategy .
SUPERVISORY BOARD MEMBERS TomTom’s Supervisory Board consists of five members . A member is appointed for a period of four years and may then be reappointed once for another four-year period . Subsequently, a member may be reappointed again for a period of two years, which appointment may be extended by, at most, two years .
Biographies of the members of the Supervisory Board, as well as the information on the members as prescribed by the Corporate Governance Code (Code) can be found in the Supervisory Board section, which also provides details of the Supervisory Board’s committees and its members . All current members are independent within the meaning of best practice provision 2 .1 .7 to 2 .1 .9 of the Code .
MEETINGS AND ATTENDANCEAll meetings as of the second quarter took place virtually due to the outbreak of COVID-19 . The Supervisory Board met monthly to discuss financial updates and recent developments within the company . Once per quarter the Supervisory Board had its regular meeting to review the quarter in detail and to be provided with an operational update by the Management Board . The Management Board members attended all those meetings . The Supervisory Board members accomplished a nearly 100% attendance rate .
All members had sufficient time available for their duties relating to their membership of the Supervisory Board as demonstrated by their availability for ad hoc calls, prompt responses to emails, good meeting preparation and active participation in meeting discussions .
Meeting agendas were prepared through consultation with the Chairman, the Management Board and the Company Secretary . In addition to regular meetings, the Supervisory Board Chairman had regular contact with TomTom’s
CEO . Further and outside the regular meeting frequency, Supervisory Board members held informal consultations with members of the Management Board and senior management to remain closely informed about the business .
Supervisory Board meetings are preceded by committee meetings . The committees’ chairs work closely together with senior management and conduct regular meetings to set agendas and prepare relevant information for the committee meetings .
SvB1 AC RemCo SelCo
Derk Haank2 11/11 3/3 6/6 4/4Jacqueline Tammenoms Bakker 11/11 6/6 4/4Jack de Kreij 10/11 4/4Michael Rhodin 11/11 4/4Hala Zeine3 3/3 0/0Bernd Leukert4 2/2 1/1
1 Six regular meetings and five monthly update calls . 2 Derk Haank joined the AC when Bernd Leukert stepped down .3 First appointed on 13 October 2020 .4 Stepped down on 7 April 2020 .
62
We aspire to live up to the highest standards of good corporate governance
SUPERVISORY BOARD REPORT

STRATEGIC OVERSIGHT The Supervisory Board devoted considerable time to reviewing TomTom’s strategy and progress in the execution thereof . Regular discussions were held with the Management Board on the strategic priorities of the Location Technology business . During these sessions, the Supervisory Board ensured that the Management Board’s ideas were challenged and tested in order to reach decisions that would underpin the company’s strategy .
Ample time was spent reviewing the constantly changing technology landscape within which TomTom operates as well as the impact thereof on the company’s strategy . Each quarter, updates were provided to the Supervisory Board on market trends (such as connected in-vehicle navigation, the pace of development in automated driving and vehicle electrification) and the impact thereof on the company’s strategic priorities . The Supervisory Board engaged an external expert in the automotive industry to obtain an outside-in perspective of industry trends and developments .
From the second quarter onwards the Supervisory Board paid special attention to the impact of COVID-19 on the company’s people, operations, financial performance and strategy .
The Audit Committee kept the Supervisory Board informed of the company’s strategic, financial, legal and compliance, and operational risks, as well as the actions taken, and internal control and management systems in place, to manage these risks .
Business review and financial oversightThe Management Board regularly updated the Supervisory Board on commercial opportunities, deals, and partnerships . Every quarter, reports were provided by senior management that outlined the developments, achievements, challenges and opportunities in each market segment, HR and our technology department .
The Supervisory Board was frequently updated on the progress made within our mapmaking, traffic and navigation technology, and the positioning and traction of these technology components in the marketplace .
The company’s financial results, its operating result and its cash generation from operations were presented and closely supervised throughout the year . The level of investment (both OPEX and CAPEX) in the company's core technologies were thoroughly assessed every quarter . The Supervisory Board reviewed and approved the budget for 2021 .
Every quarter, the Supervisory Board was updated on the company’s Investor Relations activities, such as share price developments, analysts’ research and communication with shareholders . The quarterly updates and the press releases regarding the full- and half-year results were all reviewed and approved by the Supervisory Board .
Culture and engagementThe Supervisory Board continued to meet talent from within the company, staying in touch with the TomTom culture, dynamics and operational challenges . For this purpose, among other things, quarterly sessions were organized to facilitate a ‘Meet and Greet’ between the Selection and Appointment Committee and selected talent . In an open and transparent setting, they held a group dialogue on relevant matters .
The Supervisory Board and the Dutch Works Council held two meetings .
The Supervisory Board was regularly updated on the company’s governance and organizational structure .
Succession planningThe Supervisory Board discussed its own succession planning and concluded that, with the appointment of Hala Zeine on 13 October 2020, the current composition suffices the company’s current needs . Ample time was spent with the Management Board on the yearly talent review of senior management within the organization, including succession planning .
Corporate responsibility An update was provided on the company’s progress on its Corporate Responsibility program, reflecting the five pillars contributing to the company’s vision and creating sustainable value for its stakeholders .
The Supervisory Board was updated on the company’s efforts to meet its commitments reflected in their Diversity and Inclusion goals .
REMUNERATION The remuneration of the members of the Supervisory Board and the additional remuneration of the Chairman and the members of its committees is determined by the General Meeting, last amended in 2020 . For more information, see the Remuneration Report .
EVALUATION In principle, the Supervisory Board engages with a third party to assess its functioning every three years, the next time in 2022 .
The Supervisory Board and its committees reviewed and discussed its own function, the functioning of its individual members, committees and the functioning of the Management Board and its members . While in 2019 the Supervisory Board engaged with an external consultant to perform the evaluation, in 2020 it was decided that all members of the Supervisory Board and Management Board completed a questionnaire followed up by an individual interview with the Chairman of the Supervisory Board .
The outcome was discussed among the Supervisory Board members in an evaluation session . It was concluded that the Supervisory Board performs well and is run efficiently even though almost all meetings took place virtually . However, it was empathically recognized that (informal) physical meetings were missed . The board dynamics are healthy; there is an open speak-up culture and great willingness to collaborate and share information . The Supervisory Board appreciated the time spent on further increasing its knowledge and understanding of (technology) developments relevant to TomTom and its industry, and will continue to do this .
63
SUPERVISORY BOARD REPORT CONTINUED

AUDIT COMMITTEE On 7 April 2020, Bernd Leukert stepped down from the Supervisory Board and as a member of the Audit Committee (AC) after which Derk Haank was temporarily appointed to ensure that the AC consists of at least three members . Upon her appointment to the Supervisory Board, Hala Zeine became a member of the AC, replacing Derk Haank .
Meetings and attendanceThe AC met four times during the course of 2020, with an overall attendance rate of 100% . All four meetings were held prior to the publication of the financial results . All meetings were attended in full by the CFO and the Head of Corporate Accounting and Internal Audit .
The other members of the Management Board attended the meetings as required (for instance, where group risks and internal controls were discussed) .
The external auditor attended each of the four AC meetings in full to report on its audit plan, quarterly procedures and management letter . The AC and the external auditor also met separately, without the Management Board present, in order to facilitate free and open discussions on other relevant topics such as quality of risk assessments and the collaboration with the Management Board and the organization .
Other heads of departments (e .g . Treasury, Tax, Investor Relations, Group Control, Business Finance, Legal and Compliance, Privacy and Security, Financial Shared Service Center and IT) were invited when the AC deemed it necessary and appropriate .
Financial oversightThe AC assisted the Supervisory Board in its responsibility to oversee the system of internal control and risk management, the effectiveness of the internal auditors, the company’s financing, financial statements and financial reporting process . In relation to the external auditor, the AC monitored its performance and the effectiveness of the external audit process, as well as its independence .
A core task of the AC was to extensively review the financial reports before consideration by the full Supervisory Board . Throughout the year, the AC monitored and reviewed the quarterly financial results and full-year financial statements as presented under IFRS (as adopted by the EU and in accordance with Part 9 of Book 2 of the Dutch Civil Code), including the respective disclosures prior to their release . Guidance to the financial markets was also discussed . Special attention was paid to revenue recognition including the deferred revenue position, the impairment review of goodwill and other intangibles, and the operational and financial implications of COVID-19 .
The AC also discussed topics related to TomTom’s third-party cloud platforms, cybersecurity, new financial system implementations, legal and regulatory compliance and whistleblowing reports .
Other areas of attention were significant estimates, the share buyback program, the global tax position and the status of legal claims and proceedings .
Monitoring of internal controlsDuring all quarterly meetings, updates were provided on the company’s management reporting and the maintenance and effectiveness of the system of internal controls and risk management relating to strategic, financial, operational, commercial, tax, control and compliance matters . The company monitors its internal controls through a systematic approach that is supported by tools, a risk management process and the Internal Audit team . The Head of Internal Audit reports functionally to the AC and administratively to the CFO .
Policy and compliance oversightThe AC further discussed items including the company’s policies related to financing, cash and foreign exchange management . In relation to tax, the AC discussed the status of ongoing tax audits, tax risk management, tax transparency, and the tax strategy/policy . Regular updates were received by the AC on TomTom’s compliance program (including fraud and whistleblower reporting) . The AC was provided with quarterly updates on the company’s ongoing effort to maintain the appropriate level of a risk-based information security management program . Time was also dedicated to the Code of Conduct awareness program .
Effectiveness reviewThe effectiveness of the AC was reviewed as part of the 2020 overall evaluation of the Supervisory Board which confirmed that the AC continues to function in line with the requirements in this respect . During 2020, Jack de Kreij continued to act as financial expert . The role and functioning of the Internal Audit function, including its independence, were regularly discussed and the internal audit plan was approved by the AC . This plan considers the key risk areas of the business, important IT projects, information security and data privacy, as well as the geographical spread of TomTom offices, including local compliance (e .g . finance, HR and tax controls) and the core activities performed there .
In consultation with senior management, Internal Audit (IA) selects the areas of the business to be audited during the year . Members of the AC and the Management Board may at any time request IA or a special consulting service to carry out an internal audit . The follow-up on the recommendations made by IA were observed by the AC . The Head of Internal Audit reported to the AC each quarter .
64
SUPERVISORY BOARD REPORT CONTINUED

Evaluation of external auditorThe external audit plan, including the scope, approach, key audit risks and materiality applied, were approved by the AC . Reviews and discussions were held between the AC and the Management Board on the findings of the external auditor in its management letter and the actions taken by management to address the recommendations and observations made by the external auditor .
EY was appointed as the external auditor by the General Meeting of Shareholders in 2018, for a term of three years up to and including the financial year 2020 . The performance of the external auditor was assessed based on a satisfaction survey conducted among the business units and the global corporate departments . The assessment also included a consideration of the quality of the audit work, the audit team’s expertise and composition, the audit fee and the quality control within the audit firm . Following this thorough assessment, the AC has decided to propose to the General Meeting of Shareholders in 2021 to extend the agreement with EY for another three-year period (2021-2023) .
Auditor independenceThe policy on External Auditor Independence prescribes that the auditor appointed by TomTom is not allowed to perform non-audit services that would i) compromise its independence, or ii) violate any other requirements or regulations affecting its external audit function . The provision of non-audit services by the external auditor that do not conflict with auditor’s independence, is always subject to pre-approval by the AC .
The AC reviewed the independence of the external auditor EY, taking into account qualitative and quantitative factors, and concluded that EY had sufficient objectivity and independence to perform the external audit function . EY confirmed its independence and compliance with this policy to the AC .
SELECTION AND APPOINTMENT COMMITTEE Meetings and attendanceThe Selection and Appointment Committee (SelCo) met four times during the course of 2020, with an overall attendance rate of 100% . Each meeting was also attended by Alain De Taeye, the Head of Rewards and Operations, the Chief HR Officer and the Company Secretary .
HR strategy reviewThe HR strategy within the company was shared with the SelCo and quarterly updates were provided by the Chief HR Officer . Topics shared included management initiatives regarding career development, management and leadership, employee engagement surveys on culture, surveys on the impact of COVID-19 on employees, and compensation and benefits .
The SelCo focused on the company’s progress in its succession planning for key positions within the company . On a quarterly basis, the committee was updated on the recruitment status of vacant key positions .
Succession planningWith the resignation of Bernd Leukert, the SelCo searched for a new Supervisory Board member (while observing the Supervisory Board profile) which resulted in the nomination and appointment of Hala Zeine on 13 October 2020 .
Culture and engagement The impact of COVID-19 on TomTom’s employees was a topic of discussion during every meeting as of the second quarter . The Selco provided full oversight of the programs introduced by TomTom to ensure continuous connection and collaboration amongst employees and also with senior leadership and the Management Board .
The SelCo spent ample time on the outcome of the four employee engagement surveys, three of which were organized specifically to assess the impact of COVID-19 on TomTom employees and to rate the actions taken by TomTom in this respect . The fourth survey was an annual survey on company culture and employee engagement .
A summary is provided below of services performed by EY, its network affiliates and the fees earned .
(€ in thousands) 2020 % of total 2019 % of total
Audit – group 540 90% 520 86%Audit – statutory 61 10% 58 10%Tax compliance1 0 0% 24 4%Total fees 601 602
1 Tax compliance comprises foreign tax compliance services .
65
SUPERVISORY BOARD REPORT CONTINUED

REMUNERATION COMMITTEE Meetings and attendanceThe Remuneration Committee (RemCo) met six times in the course of 2020, with an overall attendance rate of 100% . Each meeting was also attended by Alain De Taeye, the Head of Rewards Operations, the Chief HR Officer and the Company Secretary .
Peer group and benchmark The RemCo reviewed the peer group and decided to update the composition supported by Focus Orange, a remuneration advisory expert . Expectations from ISS and Eumedion regarding peer group composition were specifically considered e .g . peer size and geographic distribution . This new peer group formed the basis for the performance of a benchmark study . The outcome was discussed by the RemCo and recommendations were made to the Supervisory Board . The conclusions are reflected in the Remuneration Report .
Scenario analysis and pay ratio A scenario analysis was carried out to evaluate the variable components of the remuneration packages of the Management Board members . The RemCo reviewed the pay ratio .
Variable Remuneration At the beginning of 2020 the RemCo proposed, and the Supervisory Board agreed, targets for revenue and free cash flow (weighted equally at 50% each) to determine the 2020 short-term incentive (STI) for the Management Board .
From the second quarter onwards the RemCo considered the impact of COVID-19 on the Management Board remuneration . Although COVID-19 is clearly an exceptional event, the Supervisory Board decided that the impact on TomTom’s business — both as of April 2020 and looking forward — did not provide clear reasons to withhold or reduce the 2020 RSU grant .
Variable pay metrics were applied as set at the beginning of the year and the RemCo regularly reviewed the Management Board members’ progress against those metrics, which resulted in a zero bonus payout for 2020 .
The deliberations underlying the decisions made regarding the STI and the LTI are described in the Remuneration Report .
Stakeholder engagement At the Annual General Meeting a positive advisory vote was cast for the 2019 Remuneration Report and the Remuneration Policy for the Management Board and the Supervisory Board were approved . The RemCo evaluated and considered the feedback received from stakeholders during the Annual General Meeting and defined actions . It continued to have an open dialogue with Eumedion, VEB and ISS . The response to this feedback is included in the Remuneration Report .
2020 Remuneration ReportFor a full outline of the Remuneration Policy, its application in 2020 and outlook for 2021, reference is made to the 2020 Remuneration Report .
66
SUPERVISORY BOARD REPORT CONTINUED

This report provides an overview of the Remuneration Policy for TomTom’s Management Board and Supervisory Board . The Remuneration Policies have been adopted by the General Meeting in 2020 .
The Remuneration Policy at TomTom is designed to attract and retain talent, and to provide fair, competitive and responsible remuneration for all employees, including the Management Board members, in a simple and transparent manner . The policy supports our strategy, operational and financial results, and the delivery of long-term value creation to all stakeholders . The policy provides a company-wide framework for results-driven remuneration, linked to the achievement of strategic objectives .
Our Remuneration Policy shapes the nature and positioning of remuneration for Management Board members and senior management within TomTom and reflects the following principles:
> alignment with, and underpinning behavior towards, the achievement of TomTom’s vision and strategy and the creation of long-term value;
> alignment of pay structures throughout TomTom;
> remuneration is competitive with companies with whom we compete for talent;
> consideration of stakeholders’ perspectives and the level of support in society; and
> aspiration to live up to the highest standards of good corporate governance and enhanced transparency .
> REMUNERATION OF THE MANAGEMENT BOARDThe Supervisory Board ensures that the policy and its implementation are linked to the company’s strategic priorities and decides how to reward the successful delivery of the company’s strategy by the Management Board .
Our strategy balances growth objectives, financial stability and investments to position TomTom competitively in the evolving field of location technologies . The remuneration of Management Board members is intended to encourage behaviors that drive the generation of both short-term results to ensure ongoing progress and financial stability, and long-term value by pursuing growth and partnership opportunities through our location technologies and innovative services .
The Remuneration Policy of the Management Board is summarized below:
Policy summary
Base salary > Median market level of peer group benchmark (conducted at least every three years) > Reviewed annually considering market environment and any planned adjustments for other employees
Pension benefits > Maximum contribution: 20% of gross annual base salary > Opportunity to opt out of the pension provisions
Short-term incentive > At-target variable pay CEO: 80% of base salary > At-target variable pay other Management Board members: 64% of base salary > Maximum level: CEO 120%, other Management Board members 96% > Aligned with company variable pay structure > Payout in cash based on annual targets, typically financial in nature
Long-term incentive > Restricted Stock Unit (RSU) plan only > Annual grant of RSU vests after three years, followed by a two-year holding requirement > Vesting is conditional upon employment only > Target level CEO: 140% of base salary > Target level other Management Board members: 100% of base salary > Actual grant levels do not deviate from target unless underpin conditions are not met
67
REMUNERATION REPORT
We strive to enhance the transparency of our remuneration

INTERNAL ALIGNMENTThe Remuneration Committee reviews the alignment of pay structures throughout the organization by considering the consistency in the approach to setting remuneration components, performing a scenario analysis and evaluating the pay ratio .
Each individual Management Board member shares his view of his own remuneration package with the Chairman of the Remuneration Committee at least once per year . The feedback is shared with the other Remuneration Committee member, who together consider all feedback when discussing and evaluating the Remuneration Policy, including its components and outlook .
Scenario analysisA scenario analysis of the possible outcomes of the variable components and the impact on the Management Board members’ remuneration is conducted annually to minimize the risk that the performance criteria leads to inappropriate outcomes .
Pay ratioThe pay ratio reflects the average total compensation of the total global employee workforce, relative to the total remuneration package of the CEO and the total Management Board . Social security is excluded from the measure of compensation .
The effect of different performance scenarios on the level and composition of remuneration has been analyzed and the outcome has been taken into consideration by the Supervisory Board when reviewing the Management Board members’ remuneration . These scenarios include minimum (0%), target (100%) and maximum (150%) variable pay achievement and share price decrease of 20%, no change to the TomTom share price, and a share price increase of 20% . Under all scenarios (minimum, target, and maximum performance levels), the Supervisory Board has assessed that the range of potential remuneration is within outcomes that are appropriate for that level of performance .
This calculation of the pay ratio has resulted in the following outcome:
Pay ratio1 2016 2017 2018 2019 2020
CEO 19 .3 25 .0 28 .9 27 .1 20 .1Management Board 14 .6 19 .2 22 .8 22 .2 17 .0
1 Excluding the cost of social security .
The decrease of the pay ratio in 2019 continued to further decline in 2020 as a result of the investments made in employee salaries in the company’s key markets as well as the zero bonus payout for Management Board members .
The Supervisory Board deems the pay ratio for TomTom of 20 .1 to be at the low end and at an acceptable level . This is justified by the company’s global presence, including in countries with lower labor costs, and by the company performance in 2020 .
Annually, we review the livable wage and local competitive dynamics in each of TomTom’s operating locations . If needed adjustments are made to ensure employees compensation are above those levels as part of TomTom’s efforts to be a good employer . This contributes positively to our pay ratio .
APPLICATION AND OUTCOME
68
REMUNERATION REPORT CONTINUED

EXTERNAL ALIGNMENTAt TomTom, talent is key to the delivery of our vision and strategy . It is therefore imperative that our remuneration is competitive with the companies with whom we compete for talent and consideration is given to the international markets in which we compete for that talent .
Peer group and benchmarkIn principle, the remuneration is benchmarked with a peer group every three years and reviewed annually . This helps to determine the overall competitiveness of our Management Board remuneration and gives appropriate insights into relevant competitive markets . The Supervisory Board considers the appropriateness of any changes to the base salary based on the market environment as well as on the average salary adjustments for our employees in the Netherlands .
Potential TomTom hiresTomTom is witnessing a market trend where LTI becomes a more and more significant part of senior management remuneration packages . It has been observed in benchmarks delivered by external consulting companies, and in expectations expressed by candidates for TomTom leadership and key positions . As a consequence of these market changes and in order to be able to attract and retain the talent we need to realize our strategic objectives, TomTom has planned to substantially increase its RSU allocation for the levels below the Management Board . This will reduce the gap in salary levels between the Management Board and senior leadership .
The Remuneration Committee performed a review of the peer group in 2020, supported by Focus Orange, an external advisor . The Remuneration Committee sought to balance the fact that many direct competitors and sources of talent are based in the US with more moderate compensation levels in Europe and the Netherlands .
The review resulted in a list of 17 reference group companies of similar size and a high business relevance and/or deploying software/technology-driven activities, reflecting a geographical spread of Europe (including the Netherlands) and the US, with TomTom positioning around the median . The new peer group excludes several business-relevant labor market competitors, in order to accommodate balance and size comparability . This new peer group composition reflects both the company’s ambition for the future and the situation it is currently in .
Company Country Business activity
Adesso SE DE SaaS solutionsAdyen NV NL SaaS solutionsAlteryx Inc US SaaS solutions — Data analyticsAVEVA Group PLC UK SaaS solutions — General EnterpriseFirst Derivatives PLC UK SaaS solutions — Data volume and streamingHERE International BV NL Location technologyIgenico Group SA FR SaaS solutions — FinancialJust Eat Takeaway .com NV NL Online retailKudelski SA CH SaaS solutions — MediaPitney Bowes Inc US General technologySDL PLC UK SaaS solutions — LanguageSimcorp A/S DK SaaS solutions — FinancialTelenav Inc US Location TechnologyTripadvisor Inc US Software Platform — TravelTrivago NV DE Software Platform — TravelWorkday Inc US SaaS solutions — Enterprise cloud applicationsZalando SE DE Online retail
APPLICATION AND OUTCOME
A remuneration benchmark analysis was performed based on this new peer group . The 2020 benchmark showed that Management Board total remuneration levels are below the median of the reference group, with the difference largely stemming from relatively low long-term incentives . Additionally, in the case of the CEO, the base salary remains under the median market level .
The Remuneration Policy aims to reward at third quartile levels and the Remuneration Committee noted the discrepancy with the benchmark outcome . Given the current market and business context, the Remuneration Committee decided not to propose any adjustments to the Supervisory Board as a result of the performed benchmark .
69
REMUNERATION REPORT CONTINUED

OVERVIEW OF REMUNERATIONBelow follows a detailed overview of the Management Board Remuneration Policy, its application in 2020 and the outcome of variable pay targets . The table below is an overview of the actual remuneration of the Management Board in 2020:
Year
FIXED VARIABLETotal
remuneration3
Ratio of fixed to variable
remunerationBase
salaryFringe
benefits PensionOther items1
Short-term incentive
Long-term incentive2
Harold Goddijn 2020 493,701 — — 10,004 — 657,757 1,161,462 43% | 57%2019 474,166 — — 10,005 459,372 617,861 1,561,404 31% | 69%
Taco Titulaer 2020 406,068 — 81,214 10,004 — 364,451 861,737 58% | 42%2019 390,000 — 78,000 10,005 302,266 324,890 1,105,161 43% | 57%
Alain De Taeye 2020 411,418 21,000 82,284 10,004 — 392,402 917,108 57% | 43%2019 395,138 25,320 79,028 10,005 306,248 366,390 1,182,129 43% | 57%
1 Other items includes social security .2 Expenses recognized for stock compensation awards are determined in accordance with IFRS 2 and do not represent the amounts paid or payable to Management Board members .
For additional information about the stock compensation plans, including employee plans, refer to note 9 Stock compensation in the consolidated financial statements . 3 Remuneration of the Management Board is directly paid by TomTom NV and not allocated to any of its subsidiaries .
Base salaryThe Supervisory Board, upon the recommendation of the Remuneration Committee, determines the base salary for each of the members of the Management Board . Benchmark data from peer group companies is used as a guide to the competitiveness of the base salary . The internal relativity to total remuneration levels within the company is also considered to ensure alignment throughout the organization .
Unless otherwise determined by the Supervisory Board, base salary levels are increased annually in line with the expected average annual increase in the fixed salary of the employees of the company based in the Netherlands .
PensionThe company’s pension plan is a Defined Contribution plan with age defined contribution percentages and a salary cap at €110,111 in 2020 . Employee contribution is fixed at 6 .1% of pensionable salary .
Pension can be received through contributions to the company’s plan, as a gross pension allowance, or a combination thereof . Members may elect to waive their pension rights .
Pension contributions for the Management Board are capped at 20% of gross annual base salary .
Fringe benefitsThe Management Board members receive remuneration for items such as medical insurance, death and disability insurance and car allowances . They also benefit from Directors’ and officers’ liability insurance coverage . These benefits are in line with market practice . The company does not provide loans, advanced payments or guarantees to members of the Management Board .
For 2020, the Management Board members’ salaries were assessed against the adjustments for other employees and were adjusted by 4 .12% in line with the 2-year market movement for employees in the Netherlands .
Harold Goddijn opted to waive his pension rights . Taco Titulaer’s pension is received as a combination gross pension allowance and contributions to the company pension plan . Alain de Taeye receives a gross pension allowance . Refer to the overview of actual remuneration for pension amounts paid in 2020 .
APPLICATION AND OUTCOME
70
REMUNERATION REPORT CONTINUED

Short-term incentiveManagement Board members participate in the short-term, annual incentive plan which is aligned with incentive schemes throughout the company . The annual incentive has an at-target payout level of 80% of base salary for the CEO and 64% of base salary for other members of the Management Board .
On an annual basis at the beginning of the year the Supervisory Board determines the performance criteria (financial and/or other quantitative/qualitative criteria) for the Management Board based on the company’s strategic agenda and sets challenging yet realistic target levels for each performance criteria .
The performance criteria provide the framework for employee incentive schemes which are cascaded down by the Management Board to the rest of the organization aligning the bonus structure throughout the company .
According to our policy, financial criteria may include, but are not limited to, one or more of the following: (operational) revenue; (adjusted) EBITDA; EBITDA minus CAPEX; and free cash flow .
The performance criteria for the 2020 short-term incentive plan have been aligned with the financial guidance given to the financial markets . Each Management Board member’s performance is assessed against these criteria . The targets reflect the balance between targeted growth in key areas (Location Technology revenue) and overall profitability (free cash flow) .
The revenue metric is specific to Location Technology and excludes revenue from Consumer aligning with the strategic direction of the company . Location Technology revenue directly reflects progress in meeting growth and value creation objectives .
In 2020 the performance targets, levels and relative weighting were set as follows:
Performance metric Weighting Target 2020Minimum
performanceMaximum
performance
Location Technology revenue 50% €464 million 0% 150%Free cash flow (as a % of revenue) 50% €50 million 0% 150%
APPLICATION AND OUTCOMEOnce targets are set, they do not change during the year . Performance is reviewed each quarter and the final assessment against the targets takes place at the end of the year, based on the audited financial results, with any potential payout occurring during the first quarter of the next financial year . A minimum level of performance must be achieved before any payment under the plan will be made and payout is capped at an outstanding level of performance, known as the maximum .
The assessment of performance is done based on an evaluation of the past financial year prepared by the Management Board . The Remuneration Committee investigates, deliberates and determines the annual incentive of each Management Board member . The Supervisory Board assesses whether the outcome of the calculated payout is justified by the overall business performance and considers its fairness in light of provision 2:135 sub 6 of DCC . In preparation for that assessment, the Chairs of the Remuneration Committee and the Audit Committee review the final outcomes, including any quality of earnings elements and relevant aspects of operational business performance .
At a profitability level, the free cash flow of the group is considered . As such, Consumer segment is included in the performance profitability target .
During 2020, the COVID-19 pandemic led to widespread automotive factory closures, closure of physical retail locations and restricted movement of consumers . These events negatively affected the revenue of Location Technology (specifically Automotive revenue) and free cash flow (specifically Automotive and Consumer) . As a result, the targets set at the beginning of the year, were not met and the measured performance outcome is 0% . The Supervisory Board did not adjust the calculated payout based on the performed fairness test .
The following table summarizes the performance of the Management Board and the corresponding short-term incentive award based on minimum, maximum and actual performance:
Base salaryTarget % of base salary
AT TARGET PERFORMANCE MAXIMUM PERFORMANCE ACTUAL PERFORMANCE OUTCOME1
Actual award 20201
Performance outcome
Corresponding award
Performance outcome
Corresponding award
Location Technology revenue Free cash flow
Harold Goddijn 493,701 80% 100% 394,961 150% 592,441 Target not met Target not met —Taco Titulaer 406,068 64% 100% 259,884 150% 389,825 Target not met Target not met —Alain De Taeye 411,418 64% 100% 263,308 150% 394,961 Target not met Target not met —
1 Location Technology revenue was €392 million and free cash flow was an outflow of €26 million . This achievement is below the minimum target level resulting in an actual performance outcome of zero .
71
REMUNERATION REPORT CONTINUED

Long-term incentiveTomTom’s long-term incentive plan is based on restricted stock units (RSUs) which were introduced in 2019 . RSUs are a simple and transparent instrument with relatively predictable grant outcomes for both recipients and shareholders . This predictability makes RSUs a superior retention instrument attractive to top managers reflecting the competitive environment for technology talent . Internal consistency is facilitated as RSUs are the prevalent long-term incentive plan instrument for senior leadership within TomTom .
RSUs build alignment with shareholders . The three-year vesting period, conditional on continued employment, is supported by an extended two-year holding period . Vesting is not dependent on performance conditions; this does not comply with best practice provision 3 .1 .2 v) of the Code . The reason for this deviation is that it has proven difficult to set long-term performance targets in our rapidly evolving, market environment . The Supervisory Board has the discretion to not award RSUs in case of exceptional market or business circumstances (performance underpin) . At the time of allocation,
the Remuneration Committee and Supervisory Board assess whether there are circumstances that would justify adjusting the RSU grant . In addition to the overall financial performance of the company, non-financial aspects are taken into consideration for example whether there have been any major risk management failures, reputational issues or compliance issues . Additionally, the external context and overall shareholder experience are considered .
The RSU grant target value is 140% of base salary for the CEO and 100% for the other Management Board members .
Share ownership requirements have been set to encourage further shareholding by all Management Board members . The mandatory holding period of RSUs together with the share ownership requirements align Management Board remuneration with shareholder interests .
The main conditions for the long-term incentive plans, and details of movements in grants to the Management Board, are detailed in the tables that follow . Refer to note 9 of the consolidated financial statements for further information about the stock compensation plans, including employee plans .
APPLICATION AND OUTCOME
The annual grants are set as a percentage of the fixed salary of the Management Board and the following table provides an overview of the RSU allocation in 2020:
(€) Base salaryTarget % of gross
annual salaryValue at
grant date1Number of RSU
granted
Harold Goddijn 493,701 X 140% / 8 .27 = 83,620Taco Titulaer 406,068 X 100% / 8 .27 = 49,130Alain De Taeye 411,418 X 100% / 8 .27 = 49,770
1 The number of RSUs granted is determined on the basis of the average of the closing prices of TomTom NV shares in the 60 days preceding the grant date .
When considering the RSU allocation in April 2020, the Supervisory Board carefully considered the impact of COVID-19 pandemic on the performance of the company and the implications for the remuneration of the Management Board members .
Specifically, with reference to the performance underpin conditions of exceptional market or business circumstances, the Remuneration Committee examined in detail whether the market conditions were such that the award should be adjusted . The Remuneration Committee also considered whether the reduction in share price around grant date justified reducing the level of the award .
Although COVID-19 is clearly an exceptional event, the Supervisory Board decided that the impact on TomTom’s business — both as of April 2020 and looking forward — did not provide clear reasons to withhold or reduce the 2020 RSU grant . TomTom has a strong debt-free balance sheet, and the resilience to maintain its course including investments in value-creating R&D, despite the current uncertain environment . TomTom did not make use of financial public support . The Remuneration Committee looked carefully at the timing of the RSU grant . The number of RSUs granted is determined on the basis of the average of the closing prices of TomTom NV shares in the 60 days preceding the grant date . The Remuneration Committee concluded that there was no reason to deviate from the standard calculation .
Details of the restricted stock units of the Management Board:
MAIN CONDITIONS OF THE RSU PLANS INFORMATION REGARDING THE REPORTED FINANCIAL YEAR
Market value of award at year-end
(€)2Plan Grant date Vesting dateEnd of
holding period1
Opening Movement during the year ClosingAt beginning
of the year Awarded VestedOutstanding at end
of the yearSubject to a
holding period1
Harold Goddijn RSU 2019 3-May-19 3-May-22 3-May-24 87,630 — — 87,630 — —RSU 2020 29-Apr-20 29-Apr-23 29-Apr-25 — 83,620 — 83,620 — —
Taco Titulaer RSU 2019 3-May-19 3-May-22 3-May-24 51,480 — — 51,480 — —RSU 2020 29-Apr-20 29-Apr-23 29-Apr-25 — 49,130 — 49,130 — —
Alain De Taeye RSU 2019 3-May-19 3-May-22 3-May-24 52,160 — — 52,160 — —RSU 2020 29-Apr-20 29-Apr-23 29-Apr-25 — 49,770 — 49,770 — —
191,270 182,520 — 373,790 —
1 Once vested, RSUs are subject to a two-year holding period .2 The market value of an award at year-end is calculated using the closing share price on 31 December 2020 of €8 .44 multiplied by the number of vested outstanding units .
72
REMUNERATION REPORT CONTINUED

Details of the stock options of the Management Board:
MAIN PLAN CONDITIONS INFORMATION REGARDING THE REPORTED FINANCIAL YEAR
Market value of award at
year-end2 (€)Plan Grant date1 Vesting date Expiry dateExercise price (€)
Opening Movement during the year ClosingAt beginning
of the year Awarded Vested ExercisedOutstanding at end
of the yearOutstanding
and vested
Harold Goddijn Option 2013 8-May-13 8-May-16 8-May-20 3 .53 155,000 — — 155,000 — — —Option 2014 13-May-14 13-May-17 13-May-21 5 .28 300,000 — — — 300,000 300,000 948,000Option 2015 7-May-15 7-May-18 7-May-22 7 .83 210,000 — — — 210,000 210,000 128,100Option 2016 10-May-16 10-May-19 10-May-23 7 .58 112,500 — — — 112,500 112,500 96,750Option 2017 10-May-17 10-May-20 10-May-24 9 .57 165,000 — 165,000 — 165,000 165,000 —Option 2018 2-May-18 2-May-21 2-May-25 8 .13 201,500 — — — 201,500 — —
Taco Titulaer Option 2013 8-May-13 8-May-16 8-May-20 3 .53 50,000 — — 50,000 — — —Option 2014 13-May-14 13-May-17 13-May-21 5 .28 34,600 — — — 34,600 34,600 109,336Option 2015 7-May-15 7-May-18 7-May-22 7 .83 39,200 — — — 39,200 39,200 23,912Option 2016 10-May-16 10-May-19 10-May-23 7 .58 48,500 — — — 48,500 48,500 41,710Option 2017 10-May-17 10-May-20 10-May-24 9 .57 85,000 — 85,000 — 85,000 85,000 —Option 2018 2-May-18 2-May-21 2-May-25 8 .13 102,800 — — — 102,800 — —
Alain De Taeye Option 2013 8-May-13 8-May-16 8-May-20 3 .36 155,000 — — 155,000 — — —Option 2014 13-May-14 13-May-17 13-May-21 4 .93 150,000 — — — 150,000 150,000 526,500Option 2015 7-May-15 7-May-18 7-May-22 7 .83 110,000 — — — 110,000 110,000 67,100Option 2016 10-May-16 10-May-19 10-May-23 7 .58 56,500 — — — 56,500 56,500 48,590Option 2017 10-May-17 10-May-20 10-May-24 9 .57 100,000 — 100,000 — 100,000 100,000 —Option 2018 2-May-18 2-May-21 2-May-25 8 .13 120,000 — — — 120,000 — —
2,195,600 — 350,000 360,000 1,835,600 1,411,300
1 RSUs were introduced in 2019 . There has been no grant of stock options to Management Board members since 2018 .2 The market value of an award at year-end is calculated as the closing share price on 31 December 2020 of €8 .44, less the strike price to be paid, multiplied by the number of vested outstanding options that are in-the-money .
All options that have a strike price higher than the year-end share price are considered to be out-of-the-money at 31 December 2020 and are assumed to have no market value .
The following overview details the current share ownership guidelines for the Management Board and their current holding of ordinary shares:
Board memberShare ownership
guidelines Current shareholding
(number of shares)Current value of shares (€)
Base salary (€)
Number of times base salary
Harold Goddijn 3x base salary 15,023,609 126,799,260 493,701 257xTaco Titulaer 2x base salary — — 406,068 0xAlain De Taeye 2x base salary 311,737 2,631,060 411,418 6x
73
REMUNERATION REPORT CONTINUED

Target compensation mix The Remuneration Committee believes that the target compensation mix of Management Board members aligns with the long-term interests of shareholders . The chart below illustrates the target pay that is at risk for the respective Management Board member represented as percentage of the total potential compensation package designed to reward based on company performance .
OutlookAfter having considered the economic market circumstances, Dutch and European governance context and internal pay relatives, no adjustments to the Remuneration Policy are proposed for implementation in 2021 .
The base salary levels will be increased in line with the average annual increase in fixed salary of the employees of the company based in the Netherlands, as described in the Remuneration Policy, which is 1 .86% .
No changes are anticipated for the 2021 short-term incentive scheme and/or performance criteria .
No changes are anticipated for the 2021 long-term incentive scheme .
Taco Titulaer (58% at risk)
Alain De Taeye (58% at risk)
Harold Goddijn (69% at risk)
FOR MORE INFORMATIONManagement Board Remunerationtomtom .com/company/boards- and-committees/#management- board--remuneration
74
REMUNERATION REPORT CONTINUED

COMPARATIVE INFORMATIONFor the purpose of reviewing the five-year development of Management Board remuneration and company performance, the Remuneration Committee has decided to take the metrics of Location Technology revenue, group free cash flow generation and the year-end share price as appropriate measures of company performance .
The following table shows the remuneration and company performance over the last five reported years:
2016 2017 2018 2019 2020Management Board remuneration1
(€ in thousands)
Harold Goddijn 1,001 1,389 1,579 1,551 1,151Taco Titulaer 502 786 975 1,095 852Alain De Taeye 771 1,036 1,183 1,172 907Total 2,274 3,211 3,736 3,819 2,910
Average remuneration1 per FTE (€ in thousands)
Global employees 52 56 55 57 57
Company performance measures (€ in millions, unless stated otherwise)
Location Technology revenue 269 333 372 426 392Free cash flow2 27 68 145 70 -26Share price (€) 7 .37 9 .78 7 .90 9 .42 8 .44
1 Excluding the cost of social security .
2 Free cash flow includes cash flows relating to the Telematics segment up to 31 March 2019, the effective date of sale .
The information is represented in the following table in a comparative form where the annual development is expressed as a percentage compared with the immediately preceding year:
as % compared to previous year 2016 v 2015 2017 v 2016 2018 v 2017 2019 v 2018 2020 v 2019Management Board remuneration1
Harold Goddijn -5% 39% 14% -2% -26%Taco Titulaer2 -2% 57% 24% 12% -22%Alain De Taeye -10% 34% 14% -1% -23%Total -6% 41% 16% 2% -24%
Average remuneration1 per FTE
Global employees -10% 7% -2% 5% 0%
Company performance measures
Location Technology revenue 8% 24% 12% 14% -8%Free cash flow3 142% 155% 112% -52% -138%Share price -37% 33% -19% 19% -10%
1 Excluding the cost of social security .2 Taco Titulaer was appointed CFO in 2015 . For comparative purposes his salary has been annualized in 2015 when
comparing Management Board remuneration in 2015 to 2016 .3 Free cash flow includes cash flows relating to the Telematics segment up to 31 March 2019, the effective date of sale .
In the period 2016-2020, the company performance showed an overall positive trend as reflected by Location Technology revenue and FCF generation . The total remuneration of the Management Board developed in line with this . The remuneration per employee remained relatively stable over this period, as the change in the mix of our workforce offset the increase in remuneration for individual employees .
In 2020, Management Board remuneration decreased corresponding to a decrease in company performance as a result of a bonus payout of zero, as further explained in the section detailing short-term incentives . The average remuneration for global employees remained stable when compared to last year, as underlying increases in employee remuneration was offset by a lower bonus in 2020 .
DEVIATION FROM REMUNERATION POLICYThe Remuneration Committee did not deviate from its decision-making process in relation to the implementation of the Remuneration Policy nor derogate from clauses 6 up to and including 11 of the policy . Though, it was concluded from the outcome of the benchmark performed in 2020 that the total compensation of each of the Management Board members is not in line with the objective to gear total compensation around the third quartile of comparable practices .
75
REMUNERATION REPORT CONTINUED

The following table provides an overview of the actual remuneration of the Supervisory Board in 20201:
(€) 2020 2019
Derk Haank2 64,733 56,000Jacqueline Tammenoms Bakker 51,000 51,000Bernd Leukert2 12,664 47,000Jack de Kreij 50,000 50,000Michael Rhodin 50,602 62,000Hala Zeine 10,183Peter Wakkie 27,000Total 239,182 293,000
1 The remuneration has not changed over the last five years, except for the intercontinental travel allowance approved in 2019 . This has had limited application in 2020 as meetings took place virtually .
2 Bernd Leukert stepped down during 2020, following which Derk Haank joined the Audit Committee increasing his remuneration .
APPLICATION AND OUTCOME
FOR MORE INFORMATIONSupervisory Board Remunerationtomtom .com/company/boards- and-committees/#supervisory- board--remuneration
> REMUNERATION OF THE SUPERVISORY BOARD This section provides an overview of the Remuneration Policy for TomTom’s Supervisory Board . This Remuneration Policy was adopted by the General Meeting in 2020 .
The objective of the Remuneration Policy for the Supervisory Board is to provide remuneration in a manner that:
> qualified and expert persons can be recruited and retained as members of the Supervisory Board with the right balance of personal skills, competences and experience required to oversee the (execution of the) company’s strategy and performance;
> intends to reward Supervisory Board members for utilizing their skills and competences to the maximum extent possible to execute the tasks delegated to them including but not limited to tasks and responsibilities imposed by the Dutch Civil Code, Dutch Corporate Governance Code and the Articles of Association;
> as guiding principle, should reflect the median of the AEX pay practice for comparable roles; and
> reflects the company’s size and complexity, as well as the responsibilities of the role and the time spent .
OVERVIEW OF REMUNERATIONGiven the nature of the responsibilities of the Supervisory Board as an independent body, remuneration of the Supervisory Board is not tied to the performance of the company and only comprises fixed remuneration, delivered in cash .
In addition to a fixed fee, the members of the Supervisory Board are provided with a committee fee and intercontinental travel compensation . Payment of the remuneration is done in Euro . Currency conversion risks are for the account of the member of the Supervisory Board . The rates of compensation for 2020 are as follows:
(€) Chairman Member
Supervisory Board 50,000 40,000Audit Committee 10,000 7,000Remuneration Committee 7,000 4,000Selection and Appointment Committee 7,000 4,000Intercontinental travel allowance* 3,000
Members of the Supervisory Board are not authorized to receive any payments under the company’s pension or variable pay schemes or under any long-term incentive plan . No shares or rights to shares were granted to a Supervisory Board member by way of remuneration . At present, none of the Supervisory Board members own any shares in the company . Members of the Supervisory Board are not entitled to any benefits upon the termination of their appointment and no loans are made to any members of the Supervisory Board .
OutlookNo adjustments to the Remuneration Policy for the Supervisory Board are proposed for implementation in 2021 .
76
REMUNERATION REPORT CONTINUED
STAKEHOLDER ENGAGEMENT AND GOVERNANCEThe perspectives of TomTom stakeholders and the overall social and business context are taken into consideration by the Remuneration Committee when developing and reviewing the Remuneration Policy for TomTom’s Management Board and the Remuneration Policy for TomTom's Supervisory Board . The Remuneration Committee is committed to continuously improving the dialogue and transparency regarding Management Board remuneration .
Works Council Both the Management Board and the Supervisory Board have an open relationship with the Dutch Works Council . Members of the works council have the opportunity to raise and discuss matters, including the Remuneration Policies and its application or any other matter that requires attention, both within and outside the regular meeting schedule (bi-annually with the Supervisory Board and quarterly with management) .
Shareholders Input provided directly by shareholders and remuneration voting outcomes are always considered carefully by the Supervisory Board . As with all diverse interests and perspectives, opinions will differ, but TomTom endeavors to consider as many as possible .
Investor organizations/proxy advisorsIn 2020, the Remuneration Committee continued its engagement with representatives of several stakeholders (VEB, Eumedion) and proxy advisors (ISS) to facilitate a transparent and constructive dialogue about Management Board remuneration . The feedback of all three stakeholders was generally similar .
Recommendations in relation to the Remuneration Policy and the Remuneration Report included, among others, i) decrease of the number of the US companies present in peer group, and ii) greater disclosure on STI targets, and iii) insights into the Supervisory Board’s considerations resulting in decisions .
TomTom has implemented above recommendations . The representation of US companies in the peer group has decreased from eight to five . To address items ii) and iii), TomTom has considered the tables as suggested by the Guidelines on the standardized presentation of the remuneration report issued by the European Commission . With this year’s report, the Supervisory Board has aimed to provide greater transparency on its deliberations underlying the decisions made regarding the STI and the LTI .
Concerns were also raised . Firstly, Eumedion and ISS disagree on the absence of a discount on LTI-targets with the introduction of RSUs in 2019 . The RemCo appreciates the exchange of arguments and perspectives but does not see grounds to justify a discount . The benchmark performed this year, shows that the existing 140%-100% target allocation place all three TomTom’s Management Board members close to first quartile of the peer group in terms of LTI . Also, the Remuneration Committee considers that the outcome of the total compensation including LTI is moderate compared to the market .
Secondly, all three stakeholders addressed the absence of performance measures driving RSUs grants . The Supervisory Board acknowledges that this is an ongoing concern raised by shareholders . However, it strongly believes that the implementation of a non-performance based LTI-plan is still the most effective and justifiable instrument to steer the Management Board towards long-term value creation and justifies its existence because of the inability to set viable long-term performance conditions . The performance underpin ensures that grants will be reduced or withheld if circumstances justify this . The Remuneration Committee seeks to report clearly on its considerations prior to the RSU grant, especially the performance against TomTom’s strategic goals .
Public perceptionThe Supervisory Board follows the societal implications of general remuneration trends and perspectives globally and locally . In the Dutch context, the Supervisory Board closely monitors the analysis and reporting on remuneration and particularly the reporting of TomTom in any media .
Management Board remuneration at TomTom specifically is not deemed to be a topic that is debated . It has not been raised as a concern by (potential) institutional investors . When remuneration has been discussed in that context, it has been from the perspective of being seen to be modest compared to other organizations in the global tech industry .
77
REMUNERATION REPORT CONTINUED

Shareholder Rights Directive IIThis Remuneration Report aims to reflect the reporting requirements as provided by article 2:135b of DCC, implementing the EU Shareholder Rights Directive II (SRD II) . One of the key objectives of the SRD II is to provide greater transparency for company stakeholders . Transparency has always been important at TomTom; initiatives like the SRD II and its implementation into Dutch law are welcome .
In accordance with article 2:135a sub 2 of DCC and article 2:145 sub 2 of DCC, the Supervisory Board proposes for adoption the Remuneration Policy for TomTom’s Management Board respectively Supervisory Board to the General Meeting of Shareholders once every four-year period, the next time at the 2024 Annual General Meeting (AGM) . The decision for adoption of the Remuneration Policies require at least 75% of the cast votes in favor . Our Remuneration Policy for the Management Board has been approved at our 2020 AGM with 80 .18% votes cast in favor . Our Remuneration Policy for the Supervisory Board has been approved with 99 .94% votes cast in favor .
This Remuneration Report describes the process which has been followed by the Remuneration Committee in relation to the implementation of the Remuneration Policies over the given financial year, and, if applicable, any proposed revision of the Remuneration Policies .
Every year, the implementation of the Remuneration Policies, through the Remuneration Report, is put forward for an advisory vote to the AGM (in line with article 2:135b sub 2 of DCC) . At our 2020 AGM, 87 .12% votes cast in favor for our 2019 Remuneration Report .
Revision and claw back of variable payThe claw back provision as reflected in the Remuneration Policy is in accordance with Dutch law and forms an integral part of Management Board members’ employment . The Supervisory Board can revise the amount of the variable pay to an appropriate amount if payment of the bonus would be unacceptable according to standards of reasonableness and fairness .
In addition, the Supervisory Board is entitled, at its discretion, to recover on behalf of the company any variable pay awarded on the basis of incorrect financial data or other data underlying the bonus or about the circumstances that the bonus was made subject to .
This right of recovery exists irrespective of whether the Management Board member has been responsible for the incorrect financial data or other data, or was aware or should have been aware of this incorrectness . No variable remuneration has been clawed-back in 2020 .
Change of controlIn case of a change of control, the Supervisory Board may determine that any long-term incentives, granted to a Management Board member, shall be (deemed to be) vested, and exercisable if applicable, immediately prior to and conditional upon such change of control, or during such period after the change of control as the Supervisory Board may specify . Failing exercise in such change of control event, previously granted stock options will lapse .
Severance compensationIn the event that a Management Board member’s employment is terminated by, or on the initiative of, the company, the Management Board member is entitled to a severance payment limited to 50% of one year’s base salary, unless a higher statutory severance compensation applies .
These terms will not apply if the Management Board member’s employment is terminated for any reason as set out in articles 7:677 (1) and 7:678 of DCC . In such situations, the Management Board member will not be entitled to any severance compensation . A member of the Management Board will not be entitled to severance compensation if employment is terminated by himself, or on his own initiative .
78
REMUNERATION REPORT CONTINUED

The Remuneration Report forms an integral part of the Supervisory Board report and is prepared in accordance with the requirements as laid down in the Dutch Civil Code and best practice provision 3 .4 .1 of the Code . The Supervisory Board has approved the Supervisory Board report .
TomTom’s annual financial statements for 2020, prepared by the Management Board, have been audited by EY . The financial statements, independent auditor’s report and management letter of the external auditor were discussed extensively with the auditors by the Audit Committee in the presence of the Management Board, and by the full Supervisory Board with the Management Board .
The Supervisory Board believes the 2020 financial statements of TomTom NV meet all requirements for correctness and transparency . The Supervisory Board has approved the financial statements for 2020 . All members of the Supervisory Board and members of the Management Board have signed the financial statements for 2020 pursuant to the statutory obligations under article 2:101 (2) of DCC .
The Supervisory Board recommends to the General Meeting to adopt the financial statements for 2020, and requests that the General Meeting discharges the Management Board members’ responsibility for the conduct of business in 2020 and the Supervisory Board members’ supervision in 2020 . The Annual Report for 2020 is available at the company’s offices on request and on the company’s website: corporate .tomtom .com/annuals .cfm
The Supervisory Board would like to thank TomTom’s shareholders for their trust in the company and its management and express its appreciation to all employees and the Management Board for the continued dedication and commitment to the company .
Amsterdam, 4 February 2021
THE SUPERVISORY BOARD
DERK HAANK
JACQUELINE TAMMENOMS BAKKER
JACK DE KREIJ
MICHAEL RHODIN
HALA ZEINE
79
Supervisory Board statements

80
CONSOLIDATED FINANCIAL STATEMENTSConsolidated statement of income . . . . . . . . . . . . . . . . .81
Consolidated statement of comprehensive income . . .82
Consolidated balance sheet . . . . . . . . . . . . . . . . . . . . . . . .83
Consolidated statement of cash flows . . . . . . . . . . . . . .84
Consolidated statement of changes in equity . . . . . . . .85
Notes to the consolidated financial statements . . . . .86
COMPANY FINANCIAL STATEMENTSCompany statement of income . . . . . . . . . . . . . . . . . . . .119
Company balance sheet . . . . . . . . . . . . . . . . . . . . . . . . . .120
Notes to the company financial statements . . . . . . . .121
OTHER INFORMATIONOther information . . . . . . . . . . . . . . . . . . . . . . . . . . . . . . .123
Independent auditor's report . . . . . . . . . . . . . . . . . . . . .124
FINANCIALS

(€ in thousands) Notes 2020 2019
Revenue 6 528,185 700,759Cost of sales 7 104,794 185,557Gross profit 423,391 515,202
Research and development expenses 310,878 322,785Amortization of technology and databases 256,512 261,194Marketing expenses 23,643 29,436Selling, general and administrative expenses 120,068 132,744Total operating expenses 8-11 711,101 746,159
Operating result -287,710 -230,957
Interest income 1,082 1,184Interest expense -1,956 -2,287Other financial result and result of associate 30 -6,433 -2,330Financial result and result of associate1 -7,307 -3,432
Result before tax -295,017 -234,389
Income tax gain 12 37,378 41,424Net result from continuing operations -257,639 -192,965
Result after tax from discontinued operations 0 18,615Result on business disposal 0 807,237Net result from discontinued operations 13 0 825,852
Net result -257,639 632,887
Attributable to equity holders of the parent: -257,639 632,887
Earnings per share (€) 27Basic -1 .97 3 .70Diluted -1 .97 3 .66
Earnings per share from continuing operations (€) 27Basic -1 .97 -1 .13Diluted -1 .97 -1 .13
1 Interest income and expenses were reported as part of ' Financial result and result of associate' in 2019 . This line has been disaggregated to align with 2020 presentation .
The notes on pages 86 to 118 are an integral part of these consolidated financial statements .
81
CONSOLIDATED STATEMENT OF INCOME FOR THE YEAR ENDED 31 DECEMBER

(€ in thousands) Notes 2020 2019
Net result -257,639 632,887Other comprehensive incomeItems that will not be reclassified to profit or lossActuarial loss on defined benefit plans1 8 -381 -5,878Fair value remeasurement of financial instruments1 775 0
Items that may be subsequently reclassified to profit or lossCurrency translation differences -6,997 3,603Recycled currency translation differences 551 -793Remeasurement/non-recognition of deferred tax in equity 12 -6,976 1,070
Other comprehensive loss for the period -13,028 -1,998
Total comprehensive (loss)/income for the period -270,667 630,889
Attributable to equity holders of the parent -270,667 630,889Total comprehensive (loss)/income for the period -270,667 630,889
1 The items in the statement above are presented net of tax of €0 .2 million for 2020 (2019: €2 .1 million) .
The notes on pages 86 to 118 are an integral part of these consolidated financial statements .
82
CONSOLIDATED STATEMENT OF COMPREHENSIVE INCOME FOR THE YEAR ENDED 31 DECEMBER

(€ in thousands) Notes 2020 2019
Goodwill 14 192,294 192,294Other intangible assets 15 117,475 380,160Property, plant and equipment 16 22,220 28,588Lease assets 17 43,609 32,667Other contract-related assets 6 19,130 2,489Other investments 18,29 8,733 4,573Deferred tax assets 12 4,273 5,626Total non-current assets 407,734 646,397
Inventories 19 26,146 25,315Trade receivables 20 79,661 99,776Unbilled receivables 6 58,313 34,374Other contract-related assets 6 6,950 21,434Other receivables and prepayments 21-22 26,765 45,351Fixed-term deposits 23 140,930 222,579Cash and cash equivalents 23 231,520 213,941Total current assets 570,285 662,770
Total assets 978,019 1,309,167
Equity attributable to equity holders of the parent 26 387,616 665,932Total equity 387,616 665,932
Lease liabilities 17 28,801 22,531Deferred tax liability 12 1,344 27,283Provisions 31 41,014 46,746Deferred revenue 6 238,793 216,378Total non-current liabilities 309,952 312,938
Trade payables 24 21,998 47,085Lease liabilities 17 14,872 11,737Provisions 31 7,918 8,274Deferred revenue 6 164,913 152,939Other contract-related liabilities 6 19,084 26,745Income taxes 12 1,893 14,701Accruals and other liabilities 25 49,773 68,816Total current liabilities 280,451 330,297
Total equity and liabilities 978,019 1,309,167
The notes on pages 86 to 118 are an integral part of these consolidated financial statements .
83
CONSOLIDATED BALANCE SHEET FOR THE YEAR ENDED 31 DECEMBER

(€ in thousands) Notes 2020 2019
Operating result from continuing operations -287,710 -230,957Operating result from discontinued operations 13 0 19,016Operating result -287,710 -211,941
Financial losses -4,887 -319Depreciation and amortization 10 285,609 291,985Change in provisions 31 -4,336 -28,132Equity-settled stock compensation expenses 9 6,437 4,533Changes in working capital:
Change in inventories -2,932 3,461Change in receivables and prepayments 13,741 -5,353Change in liabilities (excluding provisions)1 -17,215 52,369
Cash flow from operations -11,293 106,603
Interest received 30 1,082 1,186Interest paid 30 -1,956 -2,311Corporate income taxes paid 12 -8,013 -11,799Cash flow from operating activities -20,180 93,679
Investments in intangible assets 15 0 -11,416Investments in property, plant and equipment 16 -6,298 -12,644Net cash inflow from business disposal 13 0 873,439Dividends received 18 162 287(Increase)/decrease in fixed-term deposits 79,650 -222,579Cash flow from investing activities 73,514 627,087
Payment of lease liabilities 17 -15,595 -15,615Repayment of capital 9 0 -750,949Proceeds on issue of ordinary shares 26 2,484 7,448Purchase of treasury shares 26 -16,569 0Cash flow from financing activities -29,680 -759,116
Net increase/(decrease) in cash and cash equivalents 23,654 -38,350Cash and cash equivalents at the beginning of period 213,941 252,112Exchange rate changes on cash balances held in foreign currencies -6,075 179Cash and cash equivalents at the end of the period 23 231,520 213,941
1 Includes movements in the non-current portion of deferred revenue presented under non-current liabilities .
The notes on pages 86 to 118 are an integral part of these consolidated financial statements .
84
CONSOLIDATED STATEMENT OF CASH FLOWS FOR THE YEAR ENDED 31 DECEMBER

(€ in thousands) NotesShare
capitalShare
premiumTreasury
sharesOther
reserves1Retained earnings
Shareholders’ equity
Balance as at 1 January 2019 47,064 1,066,201 -37,707 251,799 -553,248 774,109
Comprehensive incomeResult for the year 0 0 0 0 632,887 632,887Other comprehensive incomeCurrency translation differences2 0 0 0 3,603 0 3,603Actuarial loss on defined benefit obligations 8 0 0 0 0 -5,878 -5,878Recycled currency translation differences 0 0 0 -793 0 -793Remeasurement of deferred tax in equity 12 0 0 0 0 1,070 1,070Total other comprehensive income 0 0 0 2,810 -4,808 -1,998
Total comprehensive income 0 0 0 2,810 628,079 630,889
Transactions with ownersStock compensation related movements 9 0 2,281 19,370 -2,956 -6,812 11,883Capital repayment and share consolidation 26 -20,591 -730,358 10,899 0 -10,899 -750,949Other movementsTransfers between reserves 0 0 0 -63,145 63,145 0Balance as at 31 December 2019 26,473 338,124 -7,438 188,508 120,265 665,932
Comprehensive incomeResult for the year 0 0 0 0 -257,639 -257,639Other comprehensive incomeCurrency translation differences2 0 0 0 -6,997 0 -6,997Actuarial loss on defined benefit obligations 8 0 0 0 0 -381 -381Fair value remeasurement of financial instruments 18 0 0 0 775 0 775Recycled currency translation differences 0 0 0 551 0 551Remeasurement/non-recognition of deferred tax in equity 0 0 0 0 -6,976 -6,976Total other comprehensive income 0 0 0 -5,671 -7,357 -13,028
Total comprehensive income 0 0 0 -5,671 -264,996 -270,667
Transactions with ownersStock compensation related movements 9 0 0 9,695 1,375 -2,150 8,920Repurchase of shares 26 0 0 -16,569 0 0 -16,569Other movementsTransfers between reserves 0 0 0 -56,614 56,614 0Balance as at 31 December 2020 26,473 338,124 -14,312 127,598 -90,267 387,616
1 Other reserves include Legal reserve, Currency translation reserve, Fair value reserve and the Stock compensation reserve .2 Currency translation differences arise on the translation of foreign currencies relating to foreign operations .
The notes on pages 86 to 118 are an integral part of these consolidated financial statements .
85
CONSOLIDATED STATEMENT OF CHANGES IN EQUITY FOR THE YEAR ENDED 31 DECEMBER

SECTION 1:GENERAL INFORMATION AND BASIS OF REPORTING1 General . . . . . . . . . . . . . . . . . . . . . . . . . . . . . . . . . . . . . .87
2 Basis of preparation . . . . . . . . . . . . . . . . . . . . . . . . . . .87
3 Accounting estimates . . . . . . . . . . . . . . . . . . . . . . . . .88
4 COVID-19 considerations . . . . . . . . . . . . . . . . . . . . . . .88
SECTION 2:RESULTS OF THE YEAR5 Segment reporting . . . . . . . . . . . . . . . . . . . . . . . . . . . .89
6 Revenue from contracts with customers . . . . . . . .90
7 Cost of sales . . . . . . . . . . . . . . . . . . . . . . . . . . . . . . . . .93
8 Personnel expenses . . . . . . . . . . . . . . . . . . . . . . . . . . .93
9 Stock compensation . . . . . . . . . . . . . . . . . . . . . . . . . .95
10 Depreciation and amortization . . . . . . . . . . . . . . . . .97
11 Government grants . . . . . . . . . . . . . . . . . . . . . . . . . . .97
12 Income tax . . . . . . . . . . . . . . . . . . . . . . . . . . . . . . . . . . .98
13 Discontinued operations and assets held for sale . . . . . . . . . . . . . . . . . . . . . .100
SECTION 3:NON-CURRENT ASSETS AND INVESTMENTS14 Goodwill . . . . . . . . . . . . . . . . . . . . . . . . . . . . . . . . . . . .101
15 Other intangible assets . . . . . . . . . . . . . . . . . . . . . . .102
16 Property, plant and equipment . . . . . . . . . . . . . . . .104
17 Lease assets and lease liabilities . . . . . . . . . . . . . . .105
18 Other investments / Investments in associates . . . . . . . . . . . . . . . . . . . .106
SECTION 4:WORKING CAPITAL19 Inventories . . . . . . . . . . . . . . . . . . . . . . . . . . . . . . . . . .107
20 Trade receivables . . . . . . . . . . . . . . . . . . . . . . . . . . . .107
21 Other receivables and prepayments . . . . . . . . . . . .108
22 Other financial assets and liabilities . . . . . . . . . . .108
23 Cash and cash equivalents and fixed term deposits . . . . . . . . . . . . . . . . . . . . . .108
24 Trade payables . . . . . . . . . . . . . . . . . . . . . . . . . . . . . .109
25 Accruals and other liabilities . . . . . . . . . . . . . . . . . .109
SECTION 5:FINANCING, FINANCIAL RISK MANAGEMENT AND FINANCIAL INSTRUMENTS26 Shareholders' equity . . . . . . . . . . . . . . . . . . . . . . . . .110
27 Earnings per share . . . . . . . . . . . . . . . . . . . . . . . . . . . 111
28 Financial risk management . . . . . . . . . . . . . . . . . . .112
29 Financial instruments . . . . . . . . . . . . . . . . . . . . . . . .114
30 Financial result and result of associate . . . . . . . . .115
SECTION 6:OTHER DISCLOSURES31 Provisions . . . . . . . . . . . . . . . . . . . . . . . . . . . . . . . . . . .116
32 Commitments, contingent assets and liabilities . . . . . . . . . . . . . . . . . . . . . . . . . . . . . . . .117
33 Related party transactions . . . . . . . . . . . . . . . . . . .118
34 Auditor's remuneration . . . . . . . . . . . . . . . . . . . . . . .118
35 Subsequent events . . . . . . . . . . . . . . . . . . . . . . . . . .118
The notes are grouped into six sections . The notes contain the relevant financial information as well as a description of accounting policy applied for the topic of the individual notes .
86
NOTES TO THE CONSOLIDATED FINANCIAL STATEMENTS

1 | GENERAL TomTom NV (the company) has its statutory seat and headquarters in Amsterdam, the Netherlands (registered under trade registration number of 34224566 in the Chamber of Commerce in Amsterdam) . The activities of the company includes the development and sale of navigation and location-based products and services which includes maps, traffic, navigation software and personal navigation devices (PNDs) .
The consolidated financial statements comprise the company and its subsidiaries (the group) .
The financial statements have been prepared by the Management Board and were authorized for issue on 4 February 2021 . The financial statements will be submitted for approval to the General Meeting on 15 April 2021
2 | BASIS OF PREPARATION The consolidated financial statements have been prepared in accordance with International Financial Reporting Standards (IFRS) and IFRIC interpretations as adopted by the European Union as effective from 1 January 2020 and with Part 9 of Book 2 of the Dutch Civil Code . The financial statements have been prepared on the historical cost basis, except for financial instruments (including derivatives) classified at fair value through profit or loss or other comprehensive income, which are stated at fair value . Income and expenses are accounted for on an accrual basis .
SUMMARY OF SIGNIFICANT ACCOUNTING POLICIESThe general accounting policies applied to the consolidated financial statements as a whole are described below, while other significant accounting policies related to specific items are described under the relevant note .
The description of accounting policies in the notes forms an integral part of the description of the accounting policies in this section . Unless otherwise stated, these policies have been consistently applied to all the years presented .
NEW ACCOUNTING STANDARDS AND DEVELOPMENTSTo the extent relevant, all IFRS standards, interpretations and amendments that were in issue and effective from 1 January 2020 have been adopted by the group . All other standards and interpretations or amendments with future effective dates have not been early adopted . These standards and interpretations had no material impact to the group .
BASIS OF CONSOLIDATIONThe consolidated financial statements incorporate the financial statements of the company and entities controlled either directly, or indirectly, by the company .
Section 1: General information and basis of reporting This section introduces the basis of preparation and the general accounting policies applied to the consolidated financial statements as a whole, as well as a summary of the areas that involve significant judgments and estimates .
Control is achieved when the parent is exposed to, or has rights to variable returns from its involvement with the investee and has the ability to affect those returns through its power over the investee . Where necessary, adjustments are made to the financial statements of subsidiaries to bring their accounting policies in line with the group .
All intercompany transactions and balances, including unrealized gains and losses, arising from transactions between group companies are eliminated .
FOREIGN CURRENCIESThe company’s primary activities are denominated in EUR . Accordingly, EUR is the company’s functional currency, which is also the group’s presentation currency . Items included in the financial information of individual entities in the group are measured using the individual entity’s functional currency, which is the currency of the primary economic environment in which the entity operates .
Transactions and balancesForeign currency transactions are translated into the functional currency using the exchange rates prevailing on the dates of the transactions . At each balance sheet date, monetary items denominated in foreign currencies are translated at the rates prevailing at each balance sheet date . Non-monetary items that are measured in terms of historical cost in a foreign currency are not retranslated .
Foreign exchange gains and losses resulting from the settlement of such transactions and from the translation at year-end exchange rates of monetary assets and liabilities denominated in foreign currencies are recognized under ‘Other financial result and result of associate’ in the income statement, except for gains and losses that arise from intercompany borrowings that form part of net investment in subsidiaries which are recognized in ‘Other comprehensive income’ .
Group companies and foreign operationsFor consolidation purposes, the assets and liabilities of entities that have a functional currency other than the group’s presentation currency are translated at the closing rate at the date of the balance sheet, whereas the income statement is translated at the average exchange rate for the period . Translation differences arising thereon are recognized in ‘Other comprehensive income’ .
INCOME STATEMENTThe group presents its statement of income based on functional categories of expenses namely, research and development, marketing and selling general and administrative costs . Included in selling general and administrative costs are amounts of other business income received which are incidental in nature . Amortization of technology and databases is disclosed as a separate line item, to provide additional insight, as it is a material non-cash expense .
CASH FLOW STATEMENTCash flow statements are prepared using the indirect method . Cash flows from derivative instruments are classified consistently with the nature of the instruments . Dividend income is presented under investing activities .
87
NOTES TO THE CONSOLIDATED FINANCIAL STATEMENTS CONTINUED

3 | ACCOUNTING ESTIMATES The preparation of these financial statements requires management to make certain assumptions, estimates and judgments that affect the reported amounts of assets, liabilities and disclosure of contingent assets and liabilities, as of the date of the consolidated financial statements and the reported amounts of revenue and expenses during the reporting period . Actual results may differ from those estimates .
The estimates and underlying ass umptions are reviewed on an ongoing basis . Revisions to accounting estimates are recognized in the period in which the estimate is revised if the revision affects only that period, or in the period of revision and the future periods if the revision affects both current and future periods .
SIGNIFICANT ESTIMATESThe table below presents the areas that involve a higher degree of judgment or areas where assumptions and estimates are significant to the financial statements:
Note
Revenue-related estimates 6Income tax 12Impairment of non-financial assets 14-16Internally generated intangible assets 15Provisions and contingent assets/liabilities 31-32
Detailed explanations of the degree of judgment and assumptions used are included under each of the respective sections in the notes to the financial statements as referenced above .
4 | COVID-19 CONSIDERATIONSThe COVID-19 pandemic has developed into a global crisis in 2020 impacting our societies and the wider global economy . For TomTom, the pandemic not only impacted the demand of our products but also changed our way of working . With government lockdown measures in place, impacting most of our locations, we acted swiftly to enable our employees to work remotely . As a global company that is used to working across multiple locations and time zones, we quickly embraced this new way of working and were able to sustain our productivity and service level towards our customers .
From a business perspective, the pandemic particularly impacted our Automotive and Consumer business performance .
For Automotive, revenue is negatively impacted by factory closures resulting in fewer cars produced and revision of estimates related to some contracts for which the revenue recognition depends on the estimated total transaction price . There is limited sensitivity in estimating the impacted contracts as the contracts that are most relevant in this respect have a royalty period that ended in 2020 .
In Consumer, the closure of retail channels and travel restrictions resulted in lower demand for our products and hence accelerated the revenue decline in an already declining PND market .
Where possible we took discretionary cost control measures in some areas of the business such as personnel related bonus, travel expenses and events . The year on year decline in our operating expenses (excluding depreciation & amortization) as the result of these cost control measures is estimated at around 10% . Despite the year on year decline in R&D expenses, we were able to sustain our engineering and development activities to enable us to continue executing on our strategy . As a precautionary measure, we also temporarily suspended our share buyback program at the end of March 2020 . We intend to resume the program during the first quarter of 2021 .
Given the decline in revenue and profitability our cash balance (including fixed term deposits) declined year on year . Nevertheless, given our strong debt-free balance sheet and cash position, we are confident that we will have the resilience to maintain our strategic course despite the current uncertainties . The year on year decline in revenue and expenses are also reflected in lower trade receivables, trade payables, accruals and other contract related liabilities .
Given the adverse developments we also assessed the valuation of our assets and liabilities, including goodwill, on our balance sheet .
As part of this assessment we recognized an additional credit loss allowance on our trade receivables, the impact of which is not material to the group . While the amount of credit loss allowance remained comparable in absolute amount compared with last year, credit loss allowance as a percentage of outstanding trade receivables balance increased from 2 .3% to 2 .9% .
Our trigger-based and year-end goodwill impairment test did not result in any impairment . More details on our goodwill impairment test can be found in note 14 . The pandemic did not impact our assessment on the non-recognition of deferred tax assets on tax loss carry forward as the outcome of this assessment remained the same as before the pandemic .
The longer-term impact of COVID-19 pandemic remains uncertain and may further affect our business . This is further detailed in the risk section . For implication of COVID-19 on the Management Board’s remuneration, reference is made to Remuneration report on page 67 .
88
NOTES TO THE CONSOLIDATED FINANCIAL STATEMENTS GENERAL INFORMATION AND BASIS OF REPORTING CONTINUED

Section 2: Results of the year This section presents the notes related to items in the income statement (except for financial income and expenses) and disclosure of operating segments . If applicable, relevant notes on balance sheet items, which also relate to items in the income statement, are also presented in this section . A detailed description of the results for the year is provided in the business and financial review and group financial review sections in the Management Board report .
5 | SEGMENT REPORTING The operating segments are identified and reported on the basis of internal reports about components of the group that are regularly reviewed by the Management Board to assess the performance of the segments .
The Group’s internal management reporting is structured primarily based on the nature of the business of each segment and comprise two distinct segments: Location Technology and Consumer . Location Technology is engaged in developing and selling location-based application components such as maps, services (e .g . traffic and travel information) and navigation software to customers in different market segments . Consumer generates revenue mainly from the sale of consumer electronic devices such as PNDs .
Management assesses the performance of segments based on the measures of revenue, operating result (EBIT) and EBITDA, whereby the EBIT and EBITDA measure include allocations of expenses from supporting functions within the group . Such allocations have been determined based on relevant measures that reflect the level of benefits of these functions to each of the operating segments . The effects of non-recurring items are excluded from management’s measurement basis . Interest income and expenses and tax are not allocated to the segments .
There is no measure of segment (non-current) assets and/or liabilities provided to the Management Board . The non-current assets within the group include a significant portion of the carrying value of the step up resulting from the Tele Atlas acquisition in 2008 . As this step up is not geographically allocated to the respective regions for internal management reporting, we believe that disclosure of geographic allocation would be highly judgmental and would not give a true representation of geographical spread of the group’s assets .
(€ in thousands) 2020 2019
Location Technology 404,239 441,415External customers 392,161 425,982Inter-segment 12,078 15,433
Consumer 136,024 274,777Eliminations -12,078 -15,433Total revenue by segment 528,185 700,759
The EBIT of each segment is as follows:Location Technology1 -299,421 -293,557Consumer2 17,909 70,335Total segment operating result (segment EBIT)3 -281,512 -223,222
The EBITDA of each segment is as follows:Location Technology -15,026 -3,367Consumer 19,086 72,101Total segment EBITDA3 4,060 68,734
1 Location Technology EBIT includes an impact of €1 .3 million in restructuring charges (2019: includes €10 million impact of restructuring charges) .
2 Consumer EBIT includes an impact of €2 .8 million in restructuring charges (2019: nil) .3 The difference between EBIT and EBITDA for each segment is explained by the depreciation and amortization charge
of the respective segment . A reconciliation of the segment performance measure (EBIT) to the group’s result before tax is provided below .
(€ in thousands) 2020 2019
Total segment EBIT -281,512 -223,222Unallocated expenses -6,198 -7,735Financial result and result of associate -7,307 -3,432Result before tax and discontinued operations -295,017 -234,389
89
NOTES TO THE CONSOLIDATED FINANCIAL STATEMENTS CONTINUED

6 | REVENUE FROM CONTRACTS WITH CUSTOMERS Group revenue consists solely of revenue from contracts with customers . For disaggregation of revenue by operating segments, reference is made to note 5 ‘Segment reporting’ . The table below shows a disaggregation of revenue by types of products and services, timing of revenue recognition and by geographical areas:
(€ in thousands) 2020 2019
External revenue by products and servicesLicense revenue 283,202 343,279Rendering of services 157,092 142,636Sale of goods 87,891 214,844
528,185 700,759
Revenue by timing of revenue recognitionGoods and services transferred at a point in time 127,967 274,921Goods and services transferred over time 400,218 425,838
528,185 700,759
External revenue by geographical areasEurope1 332,522 504,224North America2 135,762 132,998Rest of World 59,901 63,537
528,185 700,759
1 Germany, France and the United Kingdom accounted for respectively 19%, 16% and 5% of 2020 revenue (22%, 15% and 6% of 2019 revenue) .
2 The North American revenue in 2020 and in 2019 was generated mainly in the United States of America .
The geographical split of the group’s revenue from sale of goods and content and services is based on the location of the customers, while the split of revenue from licensing arrangements is based on the coverage of the group’s geographical map data and other content .
Total revenue generated in the Netherlands in 2020 amounted to €19 million (2019: €32 million) . Within Location Technology, there are two customers that each accounted for slightly more than 10% of total group revenue in 2020 .
CONTRACT BALANCESContract related asset balances consist of trade receivables, unbilled receivables, and other contract related assets as follows:
(€ in thousands) 2020 2019
Capitalized contract costs 25,530 23,032Other deferred cost of sales 550 891Other contract related assets 26,080 23,923
Other contract related assets are disclosed as:Current 6,950 21,434Non-current 19,130 2,489
Unbilled receivables is presented net of expected credit losses of €0 .3 million (2019: €0 .4 million) . For details regarding the balance of trade receivables and expected credit losses refer to note 20 .
Revenue of €150 million (2019: €124 million) was recognized from amounts included in contract liabilities at the beginning of the year . An amount of €18 million (2019: €20 million) was recognized relating to performance obligations satisfied in previous years .
Contract related liability balances are as follows:
(€ in thousands) 2020 2019
Deferred revenue 403,706 369,317Other contract-related liabilities1 19,084 26,745Total contract related liabilities 422,790 396,062
Of which:Current 183,997 179,684Non-current 238,793 216,378
1 Other contract related liabilities comprise of items such as accrued rebates, sales return allowance and stock protection accrual .
Deferred revenue amounted to €404 million at the end of the year (2019: €369 million) . Deferred revenue per segment is as follows:
(€ in thousands) 2020 2019
Location Technology 363,981 301,610Consumer 39,725 67,707Total deferred revenue 403,706 369,317
90
NOTES TO THE CONSOLIDATED FINANCIAL STATEMENTS RESULTS OF THE YEAR CONTINUED

At balance sheet date, €336 million (2019: €278 million) of Location Technology’s deferred revenue related to Automotive and €28 million (2019: €23 million) related to Enterprise .
Automotive and Consumer deferred revenue is mostly driven by upfront payments by our customers for longer-term (multiple years) content and service deliveries (e .g . traffic and map updates) . The Enterprise deferred revenue is mostly related to some customers who prepay each year for their annual license to our content .
PERFORMANCE OBLIGATIONSIn Automotive, payments for the licenses and services are typically in the form of fixed royalty payments for each car produced by the automotive customer during the duration of the program which may range from 3 – 7 years (royalty period) . The obligation to deliver map updates and traffic services may extend for a number of years beyond the royalty period . Navigation software is typically delivered at the start date of the customer program .
For Enterprise, the payments typically take form of (annual) license fees/guaranteed royalties for larger customers or usage-based royalty payments for smaller customers . The payments typically correspond with the period the group is obliged to provide the license and/or services .
In Consumer, both B2B and end-customers make payments for (bundled) products and services which may require TomTom to deliver map update and/or traffic service during the (estimated) remaining lifetime of a hardware product or subscription period . Payments for such products and/or services are generally received at the time the products are delivered (subject to applicable payment term for B2B customers) or when services are activated .
As at 31 December 2020, the total of the transaction price allocated to the group’s (partially) unfulfilled performance obligations is estimated at €1 .2 billion (2019: €1 .2 billion), of which €404 million (2019: €369 million) is reflected in deferred revenue . This total excludes the (estimated) transaction price of:
> contracts where revenue recognition is based on right to invoice (as allowed by the practical expedient); and
> license and/or service contracts where each individual future activation is treated as a separate (subscription) contract .
The estimated future timing of revenue recognition for the above mentioned amount are as follows:
(€ in millions) 2020 2019
Less than 1 year 330 339Between 1-5 years 682 734More than 5 years 155 87Total unfulfilled performance obligations 1,167 1,160
ACCOUNTING POLICY
The revenue recognition policy for each type of revenue or combination is presented below .
License revenueLicense revenue is generated through licensing of digital map content and/or navigation software to B2B customers of Location Technology and through sale of map update services directly to the end-customers .
In the B2B license arrangements, the license of our navigation software is typically granted as ‘right to use’ license while the license of digital map content can either be granted as ‘right to access’ and/or ‘right to use’ . Right to access licenses provide the customer the right to access, over a certain period of time, TomTom’s map data which is continuously developed and enhanced during the contract period . Right to use licenses are those that only provides the customer the right to use certain map data or software as it exists at the moment the control passes to the customer . This does not give the customer the right to receive future updates or upgrades other than those that can be considered as minor enhancements or bug fixing .
Revenue from ‘right to access’ licenses is recognized over the (estimated) period during which TomTom is obliged to provide access to the customers . For royalty-based arrangements, the revenue is either recognized based on (estimated) reported royalties, as typically the royalties reflect the usage and benefits to the customers or based on time as progress measure but restricted to the amount of the (estimated) reported royalties . When restrictions in license terms result in multiple individual licenses in royalty-based arrangements, each reported unit of usage is treated as a separate license and the revenue is recognized on a straight-line basis over the applicable service period .
License revenue for ‘right to use’ licenses is recognized at the moment the control passes to the customer, except for the usage-based royalties, which are recognized when the usage has taken place based on royalties TomTom is entitled to for the period .
When license arrangements include a minimum guarantee, the excess of the reported royalties above the guaranteed amount is only recognized when cumulative reported royalties have exceeded the minimum guarantee, unless the expected total royalties is estimated to be above the minimum . In this case, the revenue is recognized based on the royalties TomTom is entitled to . When contracts include an annual minimum instead of a contract minimum, the excess of royalties above the annual minimum is recognized in the respective period when the royalties exceed the annual minimum .
To the extent possible, the group makes use of the practical expedient to use right to invoice as a measure of progress as long as the invoice reflects the benefits to the customer .
Service revenueService revenue includes revenue generated from the sale of traffic and travel information services to both B2B and/or end-customers, sale of online map and location-based services through hosted API solutions (Maps APIs) and providing connected navigation services .
The (estimated) revenue relating to the service element is recognized over the agreed or estimated service period on a straight-line basis or based on the invoiced amount if such invoice reflects the benefit of the services to the customer over the service period . The service period for life-time traffic and map update service offering within Consumer is estimated at three years .
91
NOTES TO THE CONSOLIDATED FINANCIAL STATEMENTS RESULTS OF THE YEAR CONTINUED

Sale of goodsRevenue from the sale of goods is generated primarily through the sale of Consumer navigation, Automotive hardware products and related accessories . Revenue from sale of goods is generally recognized at the moment the control passes to the customers .
Bundled goods and servicesWhen products and services are offered as a bundle under one agreement or under a series of agreements that are commercially linked, the (estimated) total transaction price of the agreement is allocated to each of the identified ‘distinct’ performance obligation based on the relative selling price of each element . Depending on their nature, the revenue from each of the ‘distinct’ performance obligations is recognized based on the applicable revenue recognition policy as described above .
Contract balancesThe group uses the terms ‘unbilled receivables’ and ‘deferred revenue’ to describe contract assets and contract liabilities . The term ‘Contract related assets’ is used to denote the aggregate balance of unbilled receivables and capitalized contract costs while ‘Contract related liabilities’ refers to the collective balance of deferred revenue and other contract related liabilities .
Contract costsContract costs are capitalized only to the extent they are recoverable . Internal development costs relating to customer-specific customization of software and/or other technology platforms are capitalized as contract costs if they have no alternative use . The group does not capitalize costs to obtain multi-year contracts as they are not deemed to be material .
Where the amortization period of an asset recognized for the costs to obtain a contract is one year or less, the costs are expensed .
SIGNIFICANT ESTIMATES
Significant revenue estimates include the estimates of various pricing allowances deducted from the revenue, estimates of the stand-alone selling price of various elements in bundled arrangements and the estimation of total transaction price for contracts with customers .
Price allowance deductionsThe estimated sales return deduction is based upon historical data on the return rates and information on the inventory levels in the distribution channel . For sales incentives including channel and end-user rebates, the reduction in revenue is based on the group’s historical experience, taking into account future expectations on rebate payments . If there is excess stock at retailers when a price reduction becomes effective, the group will compensate its customers on the price difference for their existing stock, provided certain criteria are met . To reflect the costs related to known price reductions in the income statement, an accrual is created against revenue at the time of sale based on an estimate of the inventory levels in the channel and future price reductions .
Relative stand-alone selling priceThe relative stand-alone selling price of each element in a bundled arrangement is based on the available stand-alone selling price or is estimated using methods allowed under IFRS, such as the cost plus reasonable margin method, residual method or a combination thereof . In making such estimates, management makes use of judgment and assumptions to arrive at an outcome that best reflects a transaction’s substance . Total deferred revenue balance relating to the elements deferred under bundled arrangements at 31 December 2020 amounted to €29 million (31 December 2019: €64 million) .
Total transaction priceThe (expected) total transaction price of certain contracts that include variable considerations needs to be estimated at the inception of the contract and each future reporting date . Such estimates are in particular relating to expected usage of our licenses and/or services which may be susceptible to factors outside our influence such as the developments in the market and industry in which our customer operates . In making such estimates management makes use of input from different sources such as historical experience, estimated sales volumes of customers as well as other relevant sources . The estimated variable consideration is only taken into account to the extent that management believes that it is highly probable that it will not be subject to significant reversal in the future .
92
NOTES TO THE CONSOLIDATED FINANCIAL STATEMENTS RESULTS OF THE YEAR CONTINUED

7 | COST OF SALES The group’s cost of sales includes material and fulfillment costs for goods sold to customers, costs of services, royalty costs and costs attributed to certain contracts with customers .
8 | PERSONNEL EXPENSES Personnel expenses for the group (including discontinued operations) can be broken down as follows:
(€ in thousands) 2020 2019
Salaries 215,306 213,947Social security costs 34,593 32,587Pensions 11,000 9,942Stock compensation 7,470 8,778Temporary employee expenses 13,649 18,264Other1 28,442 58,314Total personnel expenses 310,460 341,832
1 Other personnel expenses include costs of (secondary) benefits such as working from home allowance, health insurance, sales commissions and bonuses offset by capitalized personnel expenses in an amount of €11 million (2019: €14 million) .
In 2019, €11 million of the group personnel expenses was presented as part of discontinued operations .
The average number of employees (in FTE equivalents) in 2020 was 4,465 (2019: 4,712-including discontinued operations) spread across the following functional areas:
(€ in thousands) 2020 2019
Research and development 3,604 3,697Marketing 119 100Sales, general and administrative 742 915Total FTE 4,465 4,712
At 31 December 2020, the group had a headcount of 4,477 (2019: 4,575) employees . During 2020, 3,336 (2019: 3,461) full-time equivalent (FTE) employees worked outside the Netherlands .
PENSIONSThe group’s pension plans primarily comprise defined contribution plans, limiting the employer’s legal obligation to the amount it agrees to contribute during the period of employment .
In Italy, employees are paid a leaving indemnity on termination of their employment . This is a statutory payment based on Italian civil law . An amount is accrued each year based on the employee’s remuneration and previously revalued accruals . The indemnity has the characteristics of a defined contribution obligation and is an unfunded, but fully provided liability . This liability is included as part of ‘Employee benefits provision’ .
Employees in the United States are offered the opportunity to participate in the 401K pension plan, which involves no contribution or obligation from the group besides withholding and paying the employee’s contribution .
In addition, the group has defined benefit plans in Germany and Belgium .
The total pension costs of €11 .0 million (2019: €9 .9 million) consists of the costs of the defined contribution plans of €8 .7 million (2019: €8 .5 million) and of the defined benefit plan of €2 .3 million (2019: €1 .4 million) .
93
NOTES TO THE CONSOLIDATED FINANCIAL STATEMENTS RESULTS OF THE YEAR CONTINUED

BelgiumThe Belgian defined benefit plan is a (guaranteed) insurance plan . The plan is funded by fixed monthly contributions from both the employer and employees . It provides a lump-sum payment at retirement, based on the contributions made, as well as death-in-service benefits . Belgian law prescribes a variable minimum guaranteed rate of return . The group substantially insures these returns with the external insurance company that receives and manages the contributions to the plans . According to the relevant legislation, a short-fall only needs to be compensated by the employer at the point in time when the employee either retires or leaves . As these plans have defined benefit features (when the return provided by the insurance company is below the legally required minimum return), the group treats these plans as defined benefit plans .
(€ in thousands)2020 2019
Plan Assets Plan Liabilities Plan Assets Plan Liabilities
Present value as at 1 January 21,418 -29,128 10,691 -13,333Return on assets 147 581Current service cost 0 -2,023 0 -1,333Interest cost 0 -200 0 -450
21,565 -31,351 11,272 -15,116Remeasurements:Experience gains due to change in demographical assumptions 407 167 -461 -1,521Gains/losses from change in financial assumptions 0 -535 0 -3,906Other remeasurements 0 0 8,291 -8,291
407 -368 7,830 -13,718Benefits and taxes paid1 -279 279 -160 160Employer’s contributions1 1,141 0 2,022 0Employee contributions1 476 -476 454 -454Present value as at 31 December 23,310 -31,916 21,418 -29,128
Net defined benefit obligation -8,606 -7,710
1 In 2019, these lines were aggregated . The comparative figure has been disaggregated to align with current year presentation .
GermanyThe defined benefit plan in Germany is unfunded and has no plan assets . Management is of the opinion that the plan has limited risks to the group as the plan was frozen in 2007 . In the extraordinary event that the group is unable to meet its obligations, the participants will receive (partial) payments from a state-owned pension protection fund .
The following table presents the movement in the plan liabilities:
(€ in thousands) 2020 2019
Present value as at 1 January -10,636 -8,690Current service cost -81 -68Interest cost -94 -159
-10,811 -8,917Remeasurements:Experience (gains)/losses due to change in demographical assumptions -354 -1,524(Gains)/losses from change in financial assumptions 15 -380
-339 -1,904Benefits paid 220 185Present value as at 31 December -10,930 -10,636
The significant actuarial assumptions used in determining the pension obligations were as follows:
2020 2019Belgium Germany Belgium Germany
Discount rate 0 .5% 0 .7% 0 .7% 0 .9%Average life expectancy1 17 20 18 20
1 The above average life expectancy is the average actual value for males and females retiring at age 65 for the Belgium plan (2019: 65) in accordance with MR/FR -5 and 66 (2019: 66) for the Germany plan set in accordance with the common German mortality tables ‘Heubeck 2018G’ .
The table below indicates the sensitivity of the defined benefit obligation to changes in the discount rate:
(€ in thousands)
Impact on defined benefit obligation
Belgium Germany
Discount rate increases by 1% -2,209 -1,604Discount rate decreases by 1% 1,927 2,072
94
NOTES TO THE CONSOLIDATED FINANCIAL STATEMENTS RESULTS OF THE YEAR CONTINUED

ACCOUNTING POLICY
For defined contribution plans, the group pays contributions to publicly or privately administered pension insurance plans on a mandatory, contractual or voluntary basis . The group has no further payment obligations once the contributions have been paid . The contributions are recognized as employee benefit expenses when services have been rendered to the group . Prepaid contributions are recognized as an asset to the extent that a cash refund or reduction of future payments is available .
In relation to the defined benefit plan, the group recognizes a liability based on the present value of the defined benefit obligation at the end of the reporting period . The defined benefit obligation is calculated at least annually using the projected unit credit method . The present value of the defined benefit obligation is determined by discounting the estimated future cash outflows using interest rates of high-quality corporate bonds that are denominated in the currency in which the benefits will be paid, and for which the terms to maturity approximate the terms of the related pension obligation . The service cost and the interest cost are recognized as pension costs, while the actuarial gains/losses are credited/charged to ‘Other comprehensive income’ .
9 | STOCK COMPENSATION The group has stock compensation plans for members of the Management Board and certain employees as part of their remuneration . The group currently operates stock option plans, restricted stock unit plans and phantom share plans . The purpose of the stock compensation is to retain management and employees, and align the interests of management and eligible employees with those of shareholders, by providing additional incentives to improve the group’s performance on a long-term basis . The disclosure in this note relates to the total operations of the group .
In 2019, the group changed its long-term incentive plan . From 2019 the group no longer grants stock options and phantom shares and only grants restricted stock units . This change promotes share-ownership increasing alignment with our long-term value creation and shareholder interest .
EQUITY-SETTLED PLANSThe group’s stock option plans (options) and restricted stock unit plans (RSU) classify as equity-settled plans as these plans are settled with the company’s own equity instruments .
The equity-settled plans are for members of the Management Board and eligible employees . The General Meeting has extended the authority of the Management Board to grant, subject to the prior approval of the Supervisory Board, rights to employees to subscribe for shares under the respective equity plans . The instruments cannot be transferred, pledged or charged .
All equity-settled stock compensation will be covered at the time of exercise, firstly through the issue of treasury shares held by the company, and secondly through the issue of new shares .
The following table summarizes movements in the equity stock compensation reserve (included in other reserves) relating to the equity-settled plans during 2020 and 2019:
(€ in thousands) 2020 2019
Balance as at 1 January 15,109 18,065Stock compensation expense 6,437 4,533Transfer to retained earnings -220 -620Stock options exercised and settlement of restricted shares -4,842 -6,869Balance as at 31 December 16,484 15,109
Stock optionsOptions are exercised at the discretion of the holder, however, they may only be exercised after the completion of a three-year vesting period . Options expire and are considered to have lapsed after a period of seven years following the grant date .
Due to the impact of COVID-19, the expiration period of stock options granted in 2013 was increased from seven years to eight years following grant date . The impact of this modification is not material .The vesting period of options remained unchanged .
The following table summarizes information about the stock options outstanding at 31 December 2020:
Year of grant
Number outstanding at
31/12/2020Exercise price per share (€)
Weighted average remaining life
Number exercisable at
31/12/2020Weighted average exercise price (€)
2013 95,000 3 .53 0 .36 95,000 3 .532014 797,280 4 .93 – 5 .28 0 .36 797,280 5 .212015 711,700 7 .60 – 7 .83 1 .35 711,700 7 .812016 460,124 7 .50 – 7 .58 2 .35 460,124 7 .572017 645,340 7 .95 – 9 .60 3 .37 645,340 9 .532018 681,080 7 .52 – 8 .30 4 .35 0 8 .122019 61,538 10 .06 5 .79 0 10 .06
95
NOTES TO THE CONSOLIDATED FINANCIAL STATEMENTS RESULTS OF THE YEAR CONTINUED

A summary of the group’s stock option plans and the movements during the years 2020 and 2019 is presented below:
2020 2019
NumberWeighted average exercise price (€) Number
Weighted average exercise price (€)
Outstanding as at 1 January 4,130,272 6 .93 5,828,770 7 .28Granted 0 0 .00 78,178 9 .55Exercised -644,980 3 .85 -1,631,649 4 .56Expired -5,020 9 .57 -63,055 7 .95Forfeited -28,210 8 .90 -81,972 8 .54Outstanding as at 31 December 3,452,062 7.48 4,130,272 6.93
There was no new grant in 2020 . Options were exercised on a regular basis throughout the year . The average share price during the year was €7 .58 (2019: €9 .09) .
The fair value of the options granted up to 2019 is determined using the binomial tree model . This model contains the input variables, including the risk-free interest rate, volatility of the underlying share price, exercise price and share price at the date of grant .
2019
Share price at grant date (€) 10 .06Exercise price (€) 10 .06Expected volatility 41%Expected average option life in years 5 .30Weighted average risk-free rate 0 .50%Expected dividends Zero
The option valuation models require the input of highly subjective assumptions, including the expected share price volatility . Volatility is determined using industry benchmarking for listed peer group companies as well as the historic volatility of the TomTom NV’s share . The group’s employee stock options have characteristics that are significantly different from those of traded options, and changes in the subjective input assumptions can affect the fair value estimate . There are no market conditions applicable to the grant .
Restricted stock unitsAn RSU gives the holder the right to receive one TomTom share after the completion of the vesting period . After the vesting period Members of the Management Board are subject to a two-year holding period . For other employees, there is no minimum holding period after the vesting period .
RSUs vest either in total after a three-year vesting period (cliff vesting) or, in some cases, in equal tranches on an annual basis over a three-year period (graded vesting) . The fair value of the RSUs is determined with reference to the share price of TomTom NV at the date of grant .
The movement in the number of restricted stock units during the years 2020 and 2019 is summarized below:
2020 2019
Outstanding as at 1 January 1,300,438 856,852Granted 1,228,650 892,320Vested and settled -430,274 -424,397Forfeited -49,080 -24,337Outstanding as at 31 December 2,049,734 1,300,438
CASH SETTLED PLANCash-settled plans are settled through cash payments .
Phantom share planUnder this plan, eligible employees are entitled to receive a cash payment equal to the value of the number of shares that have vested . Phantom shares vest and are paid out after the completion of a three-year vesting period . No phantom shares were granted in 2020 as the phantom share plan was replaced with granting of RSUs since 2019 .
As at 31 December 2020, the outstanding liability with regard to the phantom share plan was €2 .7 million (2019: €4 .1 million) .
The following table provides the movement in the number of phantom shares .
2020 2019
Outstanding as at 1 January 636,100 1,269,180Vested and paid out -242,530 -512,722Forfeited -34,820 -120,358Outstanding as at 31 December 358,750 636,100
96
NOTES TO THE CONSOLIDATED FINANCIAL STATEMENTS RESULTS OF THE YEAR CONTINUED

ACCOUNTING POLICY
The fair value, as measured at the date of grant, of equity-settled stock compensation grants is expensed on a straight-line basis over the vesting period . For options, the fair value at grant date is measured using the binomial tree model . For restricted stock units, the fair value at grant date is equal to the share price at the date of grant .
Cash-settled stock compensation plans are initially measured at the fair value of the liability which is expensed on a straight-line basis over the vesting period . The liability is remeasured at each balance sheet date to its fair value, reflected by the share price at balance sheet date, with any changes recognized immediately through profit and loss .
All stock compensation expenses are based on the number of units that are expected to vest, the estimates of which are revised at each balance sheet date .
10 | DEPRECIATION AND AMORTIZATION Total depreciation and amortization for the year was €286 million (2019: €292 million) .
(€ in thousands) 2020 2019
Amortization 261,222 266,532Depreciation 24,387 25,453Total depreciation and amortization 285,609 291,985
Amortization charges totaling €261 million (2019: €267 million) are included in the following line items in the Income Statement:
(€ in thousands) 2020 2019
Amortization of technology and databases 256,512 261,194Research and development expenses 90 120Selling, general and administration expenses 4,620 5,218Total amortization 261,222 266,532
11 | GOVERNMENT GRANTS In 2020, the group received government grants amounting to €3 .3 million, in relation to the research and development activities performed by the group (2019: €4 .9 million) which mainly have been accounted as a deduction of wage tax expense in line with the nature of the grants . The group did not make use of governmental support relating to COVID-19 .
ACCOUNTING POLICY
Government grants are recognized at their fair value when there is reasonable assurance that the grants will be received and that the group will comply with the conditions attached to them . Government grants that are receivable as compensation for expenses or losses that are already incurred, or for the purpose of giving immediate financial support to the group with no related future costs, are recognized as a deduction of related expenses in the period in which the grants become receivable .
97
NOTES TO THE CONSOLIDATED FINANCIAL STATEMENTS RESULTS OF THE YEAR CONTINUED

12 | INCOME TAX Income tax comprises the following current tax expense as well as deferred tax (gain)/expense:
(€ in thousands) 2020 2019
Current tax -5,533 8,910Deferred tax -31,845 -50,334Total income tax -37,378 -41,424
CURRENT INCOME TAXThe current tax represents the tax charge on profit for current year as well as adjustments relating to prior periods . The tax paid in 2020 was €8 million (2019: €12 million - including discontinued operations) . The current income tax charge has a €0 .04 (2019: €0 .05) impact on our earnings per share .
The activities of the group are subject to corporate income tax in several countries, depending on presence and activity . The applicable statutory tax rates of the tax jurisdictions in which the group operates vary between 9% and 34% which may cause the group effective tax rate (ETR) to deviate from the Dutch corporate tax rate . The following table presents a numerical reconciliation between the tax charge on the basis of the Dutch tax rate and the ETR .
2020 2019
Dutch tax rate 25 .0% 25 .0%Higher/(lower) weighted average statutory rate of group activities 1 .6% 0 .8%Non-deductible expenses -1 .0% -1 .1%Current year losses not capitalized/non-recognition of previously capitalized losses -16 .1% -2 .2%Effect of prior years’ settlements and/or adjustments 4 .5% -0 .6%Remeasurement of deferred tax 0 .0% -1 .6%Elimination of discontinued operations 0 .0% -1 .0%Other -1 .4% -1 .5%Effective tax rate 12.7% 17.7%
The income tax gain of €37 million in 2020 represents an ETR of 12 .7% (2019: 17 .7%) . The ETR for 2020 is lower than 2019 due to the non-recognition of a vast majority of the deferred tax assets on tax loss carry-forward in combination with the effect of not capitalizing current year’s tax loss . This is partially offset by a gain from a release of a provision relating to prior years .
The income tax debited directly to equity in 2020 amounted to €7 .1 million (2019: credit of €2 million) which is mainly related to the deferred tax assets on pension liability and remeasurement/impairment of deferred tax assets on items that originate through equity .
ACCOUNTING POLICY
Current and deferred taxes are recognized as an expense or income in the profit and loss account, except when they relate to items that arise from the initial accounting for a business combination or items credited or debited directly to equity . For the latter, the tax is also recognized either in Other comprehensive income or directly in equity . The group’s income tax expense is calculated using tax rates that have been enacted or substantively enacted at the balance sheet date . Uncertain tax positions are included in current tax . The group recognizes uncertain tax provision when it is not probable that a particular tax treatment will be accepted by the tax authorities .
98
NOTES TO THE CONSOLIDATED FINANCIAL STATEMENTS RESULTS OF THE YEAR CONTINUED
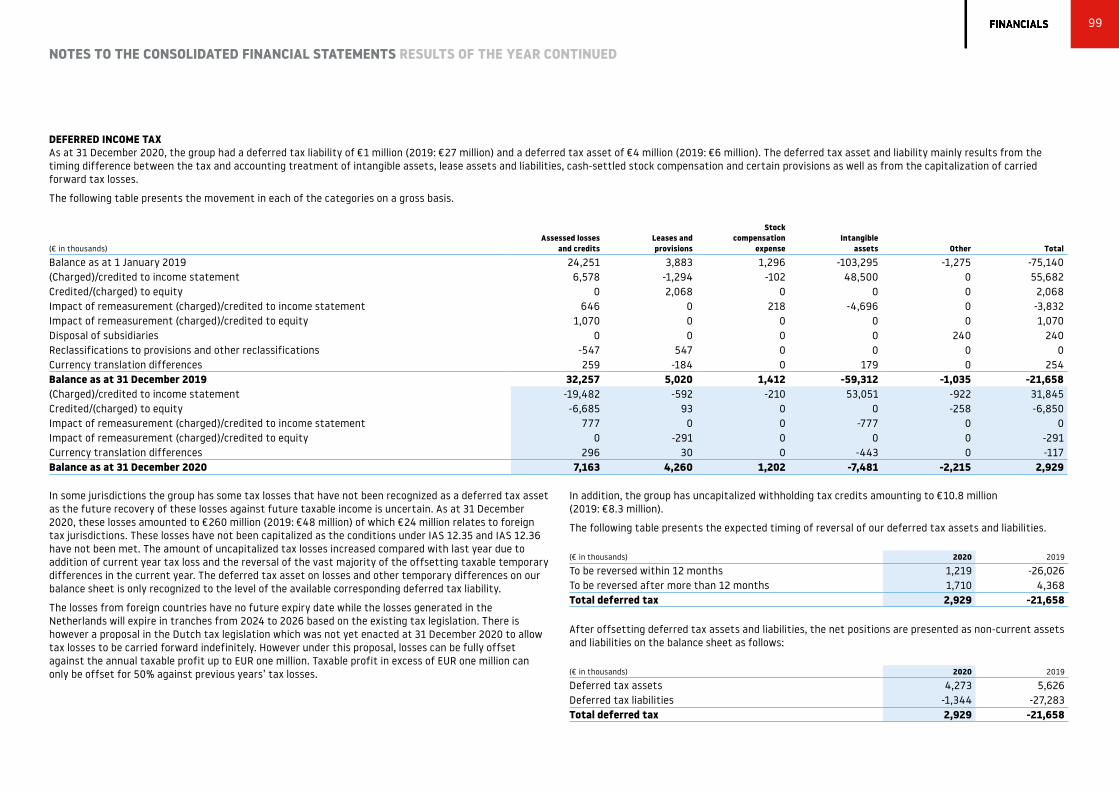
DEFERRED INCOME TAXAs at 31 December 2020, the group had a deferred tax liability of €1 million (2019: €27 million) and a deferred tax asset of €4 million (2019: €6 million) . The deferred tax asset and liability mainly results from the timing difference between the tax and accounting treatment of intangible assets, lease assets and liabilities, cash-settled stock compensation and certain provisions as well as from the capitalization of carried forward tax losses .
The following table presents the movement in each of the categories on a gross basis .
(€ in thousands)Assessed losses
and creditsLeases and provisions
Stock compensation
expenseIntangible
assets Other Total
Balance as at 1 January 2019 24,251 3,883 1,296 -103,295 -1,275 -75,140(Charged)/credited to income statement 6,578 -1,294 -102 48,500 0 55,682Credited/(charged) to equity 0 2,068 0 0 0 2,068Impact of remeasurement (charged)/credited to income statement 646 0 218 -4,696 0 -3,832Impact of remeasurement (charged)/credited to equity 1,070 0 0 0 0 1,070Disposal of subsidiaries 0 0 0 0 240 240Reclassifications to provisions and other reclassifications -547 547 0 0 0 0Currency translation differences 259 -184 0 179 0 254Balance as at 31 December 2019 32,257 5,020 1,412 -59,312 -1,035 -21,658(Charged)/credited to income statement -19,482 -592 -210 53,051 -922 31,845Credited/(charged) to equity -6,685 93 0 0 -258 -6,850Impact of remeasurement (charged)/credited to income statement 777 0 0 -777 0 0Impact of remeasurement (charged)/credited to equity 0 -291 0 0 0 -291Currency translation differences 296 30 0 -443 0 -117Balance as at 31 December 2020 7,163 4,260 1,202 -7,481 -2,215 2,929
In some jurisdictions the group has some tax losses that have not been recognized as a deferred tax asset as the future recovery of these losses against future taxable income is uncertain . As at 31 December 2020, these losses amounted to €260 million (2019: €48 million) of which €24 million relates to foreign tax jurisdictions . These losses have not been capitalized as the conditions under IAS 12 .35 and IAS 12 .36 have not been met . The amount of uncapitalized tax losses increased compared with last year due to addition of current year tax loss and the reversal of the vast majority of the offsetting taxable temporary differences in the current year . The deferred tax asset on losses and other temporary differences on our balance sheet is only recognized to the level of the available corresponding deferred tax liability .
The losses from foreign countries have no future expiry date while the losses generated in the Netherlands will expire in tranches from 2024 to 2026 based on the existing tax legislation . There is however a proposal in the Dutch tax legislation which was not yet enacted at 31 December 2020 to allow tax losses to be carried forward indefinitely . However under this proposal, losses can be fully offset against the annual taxable profit up to EUR one million . Taxable profit in excess of EUR one million can only be offset for 50% against previous years’ tax losses .
In addition, the group has uncapitalized withholding tax credits amounting to €10 .8 million (2019: €8 .3 million) .
The following table presents the expected timing of reversal of our deferred tax assets and liabilities .
(€ in thousands) 2020 2019
To be reversed within 12 months 1,219 -26,026To be reversed after more than 12 months 1,710 4,368Total deferred tax 2,929 -21,658
After offsetting deferred tax assets and liabilities, the net positions are presented as non-current assets and liabilities on the balance sheet as follows:
(€ in thousands) 2020 2019
Deferred tax assets 4,273 5,626Deferred tax liabilities -1,344 -27,283Total deferred tax 2,929 -21,658
99
NOTES TO THE CONSOLIDATED FINANCIAL STATEMENTS RESULTS OF THE YEAR CONTINUED

ACCOUNTING POLICY
Deferred taxes are calculated using the liability method . Deferred income taxes reflect the net tax effects of temporary differences between the carrying amounts of assets and liabilities for financial reporting purposes (accounting base) and the amounts used for income tax purposes (tax base) .
Deferred tax assets and liabilities are measured using the tax rates expected to apply to taxable income in the years in which those temporary differences are expected to be recovered or settled, using tax rates (and laws) that have been enacted or substantially enacted by the balance sheet date .
The measurement of deferred tax liabilities and deferred tax assets reflects the tax consequences that would follow from the manner in which the group expects, at the balance sheet date, to recover or settle the carrying amount of its assets and liabilities .
Deferred tax assets are recognized when it is probable that sufficient taxable income will be available against which the deferred tax assets can be utilized . The carrying amounts of deferred tax assets are reviewed at each balance sheet date and reduced to the extent that it is no longer probable that sufficient taxable profits will be available to allow all or part of the asset to be recovered .
Deferred income tax assets and liabilities are offset on the balance sheet when there is a legally enforceable right to offset current tax assets against current tax liabilities and when the deferred income taxes relate to income taxes levied by the same fiscal authority .
SIGNIFICANT ESTIMATES
The determination of the group’s provision for income tax as well as deferred tax assets and liabilities involves significant judgments and estimates on certain matters and transactions, for which the ultimate outcome may be uncertain .
The ultimate realization of deferred tax assets is dependent upon the generation of future taxable income in the countries where the deferred tax assets originated and the periods during which the tax losses or temporary differences become deductible . Management considers the scheduled reversal of deferred tax liabilities, projected future taxable income, and tax planning strategies in making this assessment .
If the final outcome or a new estimate differs from the group’s estimates, such differences will impact the current and deferred income tax assets and liabilities in the period in which such determination is made .
13 | DISCONTINUED OPERATIONS AND ASSETS HELD FOR SALEIn 2019 the group disposed of its Telematics business . The sale of Telematics, approved by shareholders on 18 March 2019, was completed on 1 April 2019 resulting in a net gain of €807 million and a net cash inflow of €873 million which are included in 2019 comparative income and cash flow statement .
The results and cash flows of discontinued operations (representing three months of operations in 2019 are presented below:
(€ in thousands) 2019
Revenue 44,582Cost of sales 8,945Gross result 35,637Operating expenses -16,621Financial income and expenses 663Result before tax from discontinued operations 19,679Income tax expense -1,064Result on business disposal 807,237Net result from discontinued operations 825,852
Earnings per share from discontinued operationsBasic 4 .83Diluted 4 .78
Cash flowsOperating 4,849Investing 872,456Financing -368Net cash inflow 876,937
ACCOUNTING POLICY
A discontinued operation is a component of the entity that has been disposed of or is classified as held for sale and that represents a separate major line of business or geographical area of operations and is part of a single coordinated plan of disposal . The results of discontinued operations are presented separately in the statement of profit or loss .
All notes to the financial statements represent amounts for continuing operations, unless indicated otherwise in the note .
100
NOTES TO THE CONSOLIDATED FINANCIAL STATEMENTS RESULTS OF THE YEAR CONTINUED

14 | GOODWILL
(€ in thousands) 2020 2019
Cost 1,881,901 1,881,901Accumulated impairment -1,689,607 -1,689,607Balance as at 31 December 192,294 192,294
Goodwill is wholly allocated to the Location Technology segment which represents the lowest level at which Goodwill is monitored in the group . Refer to note 5 for details on operating segments .
Our 2020 and 2019 impairment tests did not result in an impairment of Goodwill . Details of the assumptions and estimates made are presented under Significant estimates below .
ACCOUNTING POLICY
Goodwill represents the excess of the costs of an acquisition over the fair value of the group’s share of identifiable assets of the acquiree at the date of acquisition and is carried at cost less accumulated impairment losses . Goodwill is allocated to operating segments that are expected to benefit from the business combination in which the goodwill arose .
Impairment testingGoodwill and intangible assets that have an indefinite useful life are tested for impairment at least annually, or whenever management identifies conditions that may indicate a risk of impairment .
For the purposes of assessing impairment, assets are grouped at the lowest levels for which there are separately identifiable cash flows (cash-generating units) . An impairment loss is recognized for the amount by which the asset’s carrying amount exceeds its recoverable amount and is recognized immediately in the income statement . The recoverable amount is the higher of an asset’s fair value less costs of disposal and its value in use . In estimating the recoverable amount, management is required to make an estimate of the expected future cash flows from the cash-generating unit in the forecasted period and also to determine a suitable discount rate in order to calculate the present value of those cash flows . Such estimates are subject to a certain degree of judgment and uncertainty .
Impairments to goodwill are not subsequently reversed .
Section 3: Non-current assets and investments The notes in this section specify the group’s non-current assets (and directly related liabilities) including investments made during the year either through separate asset acquisitions or business combinations .
SIGNIFICANT ESTIMATES
Impairment test of goodwillWe set out below the methodologies as well as assumptions applied in performing our year-end goodwill impairment test for Location Technology .
The recoverable amount of a segment is determined based on the higher of the value in use or fair value less costs of disposal calculations . The fair value less costs of disposal calculation resulted in a higher recoverable amount . The calculations of fair value less costs of disposal for Location Technology uses post-tax cash flow projections based on financial forecasts approved by management covering a five-year period (forecasted period) including terminal value .
Management’s cash flow projections for Location Technology in the forecast period are based on management’s assumptions on the expected revenue developments, gross margin and operating margin after allocation of operating expenses from shared units, taking into account management’s expectation of market size and market share development .
Location Technology’s revenue, though impacted by COVID-19 in the short term, is projected to grow in line with management’s mid- and long-term plan in the forecast period . Given the limited visibility on the longer-term growth, the growth rates in the later years are more subject to uncertainty compared with the earlier years . Gross margin and operating margin projections of each of the segments are consistent with the expected revenue developments .
101
NOTES TO THE CONSOLIDATED FINANCIAL STATEMENTS CONTINUED

The growth rates after the forecast period as well as the discount rate used is presented in the table below . The input to the group’s key assumptions include those that are based on non-observable market data (level 3 input in accordance with IFRS 13) .
2020Location
Technology
Revenue – perpetual growth1 1 .0%Discount rate2 9 .5%
2019Revenue – perpetual growth1 1 .0%Discount rate2 8 .5%
1 Weighted average growth rate used to extrapolate cash flows beyond the forecasted period .2 Post-tax discount rate applied to the cash flow projections .
Discount rates used are post-tax and reflect specific risks relating to the relevant operating segments and market uncertainties in general .
Management considered the effects of applying a pre-tax approach and concluded that this will not materially change the outcome of the impairment test .
Expectations and input to the impairment calculation, as well as the overall outcome, have been compared with the available external information from various analysts, and to the extent available, with market information on recent comparable transactions (merger and acquisition activities of comparable companies) .
The sensitivity test for Location Technology showed that a reasonably possible change in any of the above-mentioned key assumptions as well as other assumptions in the forecasted period would not cause the fair value less costs of disposal to fall below the level of the carrying value . Also note that the carrying value of our Location Technology segment significantly decreased in 2019 and 2020 following the decrease in Other intangible assets (see note 15) .
15 | OTHER INTANGIBLE ASSETS The movements in the intangible assets are as follows:
(€ in thousands)
Map content and mapmaking
platform²
Internally generated
technology Other1 Total
Cost 1,197,121 202,732 126,833 1,526,686Accumulated amortization and impairment -602,125 -174,638 -115,195 -891,958Balance as at 1 January 2019 594,996 28,094 11,638 634,728Of which internally generated3 180,331 28,094 0 208,425
Additions 11,407 0 209 11,616Amortization charges -248,477 -12,218 -5,837 -266,532Currency translation differences 556 -70 -138 348Movements -236,514 -12,288 -5,766 -254,568
Cost 1,201,557 135,401 84,962 1,421,920Accumulated amortization and impairment -843,075 -119,595 -79,090 -1,041,760Balance as at 31 December 2019 358,482 15,806 5,872 380,160Of which internally generated3 148,080 15,806 0 163,886
Disposals (net) 0 0 -2 -2Amortization charges -245,237 -10,776 -5,209 -261,222Currency translation differences -1,449 0 -12 -1,461Movements -246,686 -10,776 -5,223 -262,685
Cost 1,198,192 135,370 59,822 1,393,384Accumulated amortization and impairment -1,086,396 -130,340 -59,173 -1,275,909Balance as at 31 December 2020 111,796 5,030 649 117,475Of which internally generated3 104,463 5,030 0 109,493
1 Other intangible assets in 2019 consists primarily of customer relationships with a book value of €5 million .2 The map content represents geographical content data used for the group’s digital map database .3 Internally generated technology includes technology in development for an amount of €0 million (2019: €0 .4 million) .
During the year the total gross amount of the assets disposed across all intangible asset classes was €25 million (2019: €116 million) . The disposed assets related to fully amortized mapmaking tools and technologies that are not being used anymore . As the group's technology matured, no internal development projects were capitalized in 2020 .
102
NOTES TO THE CONSOLIDATED FINANCIAL STATEMENTS NON-CURRENT ASSETS AND INVESTMENTS CONTINUED

ACCOUNTING POLICY
Other intangible assetsOther intangible assets includes assets that have been acquired, either through individual asset acquisitions or through business combinations, and assets that have been generated internally, such as the group’s core technology and geographical content database .
Internally generated intangible assetsInternal development costs for core technology are recognized as an intangible asset if, and only if, all of the following have been demonstrated:
> The technical feasibility to complete the project .
> The intention to complete the intangible asset, and use or sell it .
> The ability to use or sell the intangible asset .
> How the intangible asset will generate probable future economic benefits .
> The availability of adequate resources to complete the project .
> The cost of developing the asset can be measured reliably .
> Internally generated databases are capitalized until a certain level of map quality is reached and ongoing activities focus on maintenance .
Internal software costs relating to development of non-core software with an estimated average useful life of less than one year and engineering costs relating to the detailed manufacturing design of new products are expensed in the period in which they are incurred .
The amount initially recognized for internally generated intangible assets is the sum of the expenditure incurred from the date when the intangible asset first meets the recognition criteria listed above . All expenditures on research activities are expensed in the income statement as incurred .
Acquired intangible assetsIntangible assets acquired separately are initially recognized at cost, including directly attributable costs to bring the asset to its intended use . Intangible assets acquired in a business combination are identified and recognized separately from goodwill when they satisfy the definition of an intangible asset and their fair values can be measured reliably .
The cost of such intangible assets is their fair value at the acquisition date .
All intangible assets are subsequently carried at cost less accumulated amortization and accumulated impairment losses .
The amortization of other intangible assets is recorded on a straight-line basis over the following estimated useful lives as follows:
> Map content and mapmaking platform: 5-12 years .
> Internally generated core technology: 3-6 years .
> Acquired technology: 3-5 years .
> Customer relationships: 5-13 years .
> Computer software: 2-5 years .
ImpairmentIntangible assets which have an indefinite useful life and intangible assets not yet ready for use are tested for impairment at least annually, or whenever management identifies conditions that may indicate a risk of impairment . Assets that are subject to amortization are tested for impairment whenever events or changes in circumstances indicate that the carrying amount may not be recoverable .
Testing is conducted as per the policy outlined in note 14 .
Non-financial assets, other than goodwill, which have been subject to an impairment, are reviewed for possible reversal of the impairment at each reporting date .
SIGNIFICANT ESTIMATES
Management made use of assumptions and judgment in assessing the expected future economic benefits that can be attributed to the internally generated technology, databases and tools, as well as their expected useful lives . For internally generated databases, assumptions are also made on the level of completion, at which point the capitalization is discontinued and future activities are considered to be maintenance .
Such estimates are made on a regular basis, as they can be significantly affected by changes in technology and other factors .
Impairment of intangible assetsNo impairment charge has been recorded for other intangible assets in either period presented .
103
NOTES TO THE CONSOLIDATED FINANCIAL STATEMENTS NON-CURRENT ASSETS AND INVESTMENTS CONTINUED

16 | PROPERTY, PLANT AND EQUIPMENT
(€ in thousands)
Furniture and fixtures
Computer equipment
Leasehold improvements Other1 Total
Cost 10,213 65,688 15,780 4,053 95,734Accumulated depreciation -6,578 -49,094 -10,522 -3,160 -69,354Balance as at 1 January 2019 3,635 16,594 5,258 893 26,380
Additions 1,420 6,985 1,247 2,328 11,980Disposals (net)2 -189 -34 -5 -76 -304Depreciation charges -1,235 -7,815 -1,559 -501 -11,110Currency translation differences 411 641 589 1 1,642Movements 407 -223 272 1,752 2,208
Cost 10,535 46,072 16,373 5,217 78,197Accumulated depreciation -6,493 -29,701 -10,843 -2,572 -49,608Balance as at 31 December 2019 4,042 16,371 5,530 2,645 28,588
Additions 669 2,932 2,230 352 6,183Disposals (net)2 -71 -26 -105 -51 -253Reclassification between categories 0 1,119 0 -1,119 0Depreciation charges -1,281 -7,829 -1,741 -541 -11,392Currency translation differences -343 -352 -145 -64 -904Movements -1,026 -4,156 239 -1,423 -6,366
Cost 8,555 37,679 11,820 4,026 62,080Accumulated depreciation -5,540 -25,464 -6,053 -2,804 -39,860Balance as at 31 December 2020 3,015 12,215 5,767 1,222 22,220
1 Other property, plant and equipment includes vehicles, production tools and moulds .2 The total gross amount of the assets disposed across all asset classes was €22 million (2019: €30 million) .
No impairment has been recognized for Property, plant and equipment in 2020 or 2019 .
ACCOUNTING POLICY
Property, plant and equipment are stated at historical cost less accumulated depreciation and impairment charges . Depreciation is recorded on a straight-line basis over the estimated useful lives of the assets as follows:
> Furniture and fixtures: 4-10 years .
> Computer equipment and hardware: 2-7 years .
> Leasehold improvements: 2-5 years .
> Vehicles: 4 years .
> Service equipment: 5 years .
The estimated useful lives, residual values and depreciation methods are reviewed at each year-end, with the effect that any changes in estimate are accounted for on a prospective basis . The gain or loss arising on disposal or retirement of an item of property, plant and equipment is determined as the difference between the sales proceeds and the carrying amount of the asset, and is recognized in profit or loss .
ImpairmentFor the accounting policy relating to impairment refer to note 15 Other intangible assets .
104
NOTES TO THE CONSOLIDATED FINANCIAL STATEMENTS NON-CURRENT ASSETS AND INVESTMENTS CONTINUED

17 | LEASE ASSETS AND LEASE LIABILITIES The group leases assets including buildings, cars and, to a limited extent, certain office equipment .
LEASE ASSETSThe balances at year-end as well as key movements relating to lease assets are presented below:
(€ in thousands) Lease buildings Lease vehicles Total
2020Additions to leased assets 24,302 513 24,815Depreciation charges 10,953 2,042 12,995Balance as at 31 December 40,525 3,084 43,609
2019Additions to leased assets 7,369 3,166 10,535Depreciation charges 12,105 2,238 14,343Balance as at 31 December 28,043 4,624 32,667
Lease buildingsBuildings are leased for office space for periods of approximately of 2-5 years . Leases for office buildings typically include an option, exercisable by the group as lessee up to one year before the end of the cancellable lease term, to renew the lease for an additional period of the same duration after the end of the contract term .
At the end of the year, the group had options to extend lease contracts for leased buildings which represent potential discounted future lease payments not included in lease liabilities of €34 million (2019: €36 million) .
Most real estate leases include annual escalation clauses with reference to an index or contractual rate .
Other leasesThe group leases vehicles for qualifying employees with a standard lease term of four years . The group does not purchase or guarantee the value of lease vehicles .
In some cases the group leases furniture and office equipment with terms of 1-3 years . The group considers these assets to be of low-value or short-term in nature and therefore no right-of use assets and lease liabilities are recognized for these leases .
Expenses recognized relating to short-term leases and leases of low value during 2020 was €1 .4 million and €0 .6 million respectively (2019: €0 .3 million and €0 .4 million) .
LEASE LIABILITIESThe total interest expense on lease liabilities in 2020 was €0 .8 million (2019: €0 .4 million) and the total cash outflow for lease related payments was €16 million (2019: €16 million) . Lease liabilities have the following maturities:
(€ in thousands) 2020 2019
Less than 1 year 14,638 11,737Between 1-5 years 27,061 21,730More than 5 years 2,900 801Total undiscounted lease liabilities at 31 December 44,599 34,268
ACCOUNTING POLICY
Leases as a lesseeA contract is classified as a lease at the inception of the contract, if the contract conveys the right to control the use of an identified asset for a period in exchange for consideration .
The group recognizes a right-of-use asset (lease asset) and a lease liability at the lease commencement date . The asset is initially measured at cost, which comprises the initial amount of the lease liability adjusted for any lease payments made at or before the commencement date, plus any initial direct costs incurred and an estimate of costs to restore the underlying asset, less any lease incentives received .
The lease asset is subsequently depreciated using the straight-line method from the commencement date to the end of the useful life of the right-of-use asset, considered to be indicated by the lease term . The lease asset is periodically adjusted for certain remeasurements of the lease liability and impairment losses (if any) .
The lease liability is initially measured at the present value of outstanding lease payments, discounted using the interest rate implicit in the lease or, if that rate cannot be readily determined, the group’s incremental borrowing rate . Generally, the group uses its incremental borrowing rate as the discount rate . The group separates payments for lease cars into lease components and non-lease components .
The lease liability is measured at amortized cost using the effective interest method and is remeasured when there is a change in future lease payments arising from a change in an index or rate or if the group changes its assessment of whether it will exercise a purchase, extension or termination option . A corresponding adjustment is made to the carrying amount of the right-of-use asset with any excess over the carrying amount of the asset being recognized in profit or loss .
105
NOTES TO THE CONSOLIDATED FINANCIAL STATEMENTS NON-CURRENT ASSETS AND INVESTMENTS CONTINUED
Short-term leases and leases of low value assetsThe group has elected not to recognize lease assets and lease liabilities for short-term (term of 12 months or less) leases and leases of low-value assets, including IT equipment . The group recognizes the lease payments associated with these leases as an expense on a straight-line basis over the lease term .
Extension optionsExtension options are mainly applicable to leased buildings .
The group assesses whether it is reasonably certain to exercise the options at lease commencement and subsequently, if there is a change in circumstances within its control . Such assessment involves management judgment and estimate based on information at the time the assessments are made .
Extension options are included in the lease term when the group has an economic incentive to exercise the option . The group considers available evidence at the time of the assessment, including potential favorable terms upon extension, potential termination penalties, the relative costs associated with potential relocation or termination of the lease and the extent of leasehold improvements undertaken .
The size and the relative importance of the lease premises as well as the availability of easily substitutable assets is taken into consideration when assessing whether the group has an economic incentive to extend a lease for which it holds an option to do so .
18 | OTHER INVESTMENTS / INVESTMENTS IN ASSOCIATES The group held equity interest in Cyient Ltd . (Cyient) . Effective from 1 January 2020 the group changed the classification of its investment in Cyient Ltd . from an associate to a financial asset held at fair value as the conditions to treat this as an associate were no longer met . This change in classification resulted in a one-off gain of €3 .1 million included in 'Other financial result and result of associate' . The group has elected to account for future changes in fair value through other comprehensive income . Total amount of fair value changes recognized during 2020 in other comprehensive income amounted to €0 .8 million (net of tax) . The accounting policies for investments in associates as applied up to 2019 is included below . For accounting policies relating to financial assets at fair value, reference is made to note 29 .
ACCOUNTING POLICY
Associates are entities over which the group has significant influence but not control . This is generally evidenced by a shareholding of between 20% and 50% of the voting rights . In some cases, other factors can indicate significant influence . Investments in associates are initially recognized at cost and are subsequently accounted for using the equity method .
The group’s share of its associates’ post-acquisition profits or losses is recognized in the income statement, and its share of post-acquisition movements in ‘Other comprehensive income’ is recognized in ‘Other comprehensive income’ . The cumulative post-acquisition movements are adjusted against the carrying amount of the investment . When the group’s share of losses in an associate equals or exceeds its interest in the associate the group does not recognize further losses, unless it has incurred obligations or made payments on behalf of the associate . Unrealized gains on transactions between the group and its associates are eliminated to the extent of the group’s interest in the associates . Unrealized losses are also eliminated, unless the transaction provides evidence of an impairment of the asset transferred . Accounting policies of associates has been adjusted where necessary to ensure consistency with the policies adopted by the group .
106
NOTES TO THE CONSOLIDATED FINANCIAL STATEMENTS NON-CURRENT ASSETS AND INVESTMENTS CONTINUED
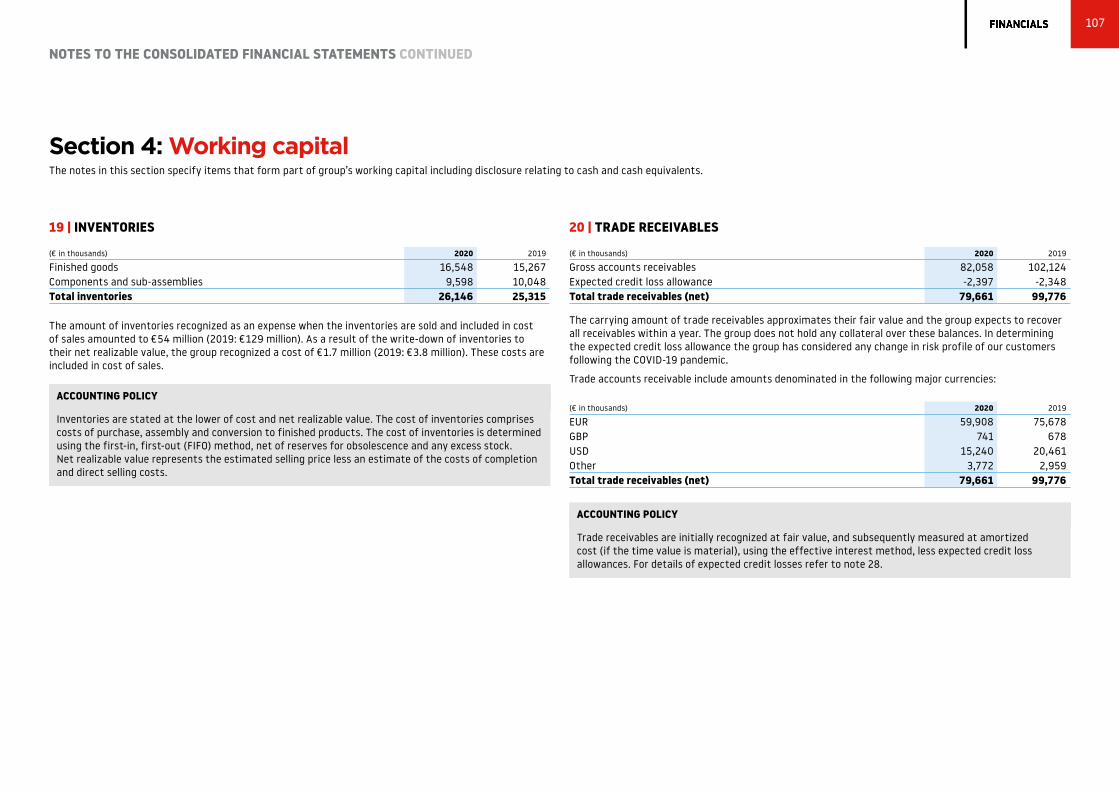
Section 4: Working capital The notes in this section specify items that form part of group’s working capital including disclosure relating to cash and cash equivalents .
19 | INVENTORIES
(€ in thousands) 2020 2019
Finished goods 16,548 15,267Components and sub-assemblies 9,598 10,048Total inventories 26,146 25,315
The amount of inventories recognized as an expense when the inventories are sold and included in cost of sales amounted to €54 million (2019: €129 million) . As a result of the write-down of inventories to their net realizable value, the group recognized a cost of €1 .7 million (2019: €3 .8 million) . These costs are included in cost of sales .
ACCOUNTING POLICY
Inventories are stated at the lower of cost and net realizable value . The cost of inventories comprises costs of purchase, assembly and conversion to finished products . The cost of inventories is determined using the first-in, first-out (FIFO) method, net of reserves for obsolescence and any excess stock . Net realizable value represents the estimated selling price less an estimate of the costs of completion and direct selling costs .
20 | TRADE RECEIVABLES
(€ in thousands) 2020 2019
Gross accounts receivables 82,058 102,124Expected credit loss allowance -2,397 -2,348Total trade receivables (net) 79,661 99,776
The carrying amount of trade receivables approximates their fair value and the group expects to recover all receivables within a year . The group does not hold any collateral over these balances . In determining the expected credit loss allowance the group has considered any change in risk profile of our customers following the COVID-19 pandemic .
Trade accounts receivable include amounts denominated in the following major currencies:
(€ in thousands) 2020 2019
EUR 59,908 75,678GBP 741 678USD 15,240 20,461Other 3,772 2,959Total trade receivables (net) 79,661 99,776
ACCOUNTING POLICY
Trade receivables are initially recognized at fair value, and subsequently measured at amortized cost (if the time value is material), using the effective interest method, less expected credit loss allowances . For details of expected credit losses refer to note 28 .
107
NOTES TO THE CONSOLIDATED FINANCIAL STATEMENTS CONTINUED

21 | OTHER RECEIVABLES AND PREPAYMENTS
(€ in thousands) 2020 2019
Prepayments 8,882 27,351Corporate income tax, VAT and other taxes 9,939 8,926Other receivables 7,944 9,074Total other receivables 26,765 45,351
The carrying amount of the other receivables and prepayments approximates their fair value .
For accounting policies related to 'Other receivables' reference is made to note 29 .
22 | OTHER FINANCIAL ASSETS AND LIABILITIES Other financial assets/liabilities includes derivative financial instruments carried at fair value through profit or loss . Derivative assets are disclosed as part of other receivables and prepayments and derivative liabilities are included in accruals and other liabilities .
2020 2019
(€ in thousands) Assets Liabilities Assets Liabilities
Derivatives at fair value through profit or loss 12 -217 201 -97
The notional principal amounts of the outstanding forward foreign exchange and option contracts as at 31 December 2020 were €13 .4 million (2019: €9 .4 million) . All the group’s outstanding options and forwards have a contractual maturity of less than one year .
ACCOUNTING POLICY
Derivatives are initially and subsequently measured at fair value . Gains or losses arising from changes in fair value of derivatives are recognized in the income statement . Transaction costs are expensed in the income statement .
The group does not apply hedge accounting .
23 | CASH AND CASH EQUIVALENTS AND FIXED TERM DEPOSITS Cash placed in accounts are classified based on the nature of the account and the length of time to maturity .
CASH AND CASH EQUIVALENTSCash and cash equivalents of €232 million (2019: €214 million) includes cash held in short-term bank deposits with an original maturity of three months or less . Cash and cash equivalents are predominantly denominated in euros and partly in US dollars .
The carrying amount of cash and cash equivalents approximates its fair value .
FIXED TERM DEPOSITSFixed term deposits are investments in term deposits with financial institutions of €141 million . Investments are made with institutions with investment grade credit ratings and are denominated in Euros €100 million (2019: €150 million) and US Dollars €41 million (2019: €73 million) .
Fixed term deposits have maturities of more than three but less than 12 months from the date of acquisition . The carrying amount of fixed-term deposits assets approximates their fair value .
ACCOUNTING POLICY
Cash and cash equivalentsCash and cash equivalents are stated at face value and comprise cash on hand, deposits held on call with banks, and other short-term highly liquid investments which have a maturity of three months or less from the date of acquisition . They are readily convertible to a known amount of cash and subject to an insignificant risk of changes in value .
Fixed term depositsFixed term deposits have insignificant interest rate risk and maturity dates longer than three months but less than 12 months at the date of acquisition .
108
NOTES TO THE CONSOLIDATED FINANCIAL STATEMENTS WORKING CAPITAL CONTINUED

24 | TRADE PAYABLES All trade payable balances have a contractual maturity of less than six months and the carrying amount approximates their fair value .
ACCOUNTING POLICY
Accounts payable include trade payables as well as amounts for orders which have been fulfilled and the goods have been received, but for which no invoice has yet been processed . The timing and amount of the obligation relating to these payables are certain .
25 | ACCRUALS AND OTHER LIABILITIES Accruals and other liabilities comprise the following:
(€ in thousands) 2020 2019
Personnel related accruals 30,999 49,579Operating expense accruals 10,576 10,800Taxes and social security 7,981 8,340Financial liabilities 217 97Total accruals and other liabilities 49,773 68,816
For accounting policies relating to financial liabilities and accruals reference is made to note 29 .
109
NOTES TO THE CONSOLIDATED FINANCIAL STATEMENTS WORKING CAPITAL CONTINUED

Section 5: Financing, financial risk management and financial instruments This section includes notes related to financing items such as equity and borrowings, including related items such as earnings per share, as well as financial risk management related items financial income and expenses, are included in this section .
26 | SHAREHOLDERS’ EQUITY
2020 2019Number (€ in thousands) Number (€ in thousands)
Authorised:Ordinary shares 300,000,000 60,000 300,000,000 60,000Preferred shares 150,000,000 30,000 150,000,000 30,000Total 450,000,000 90,000 450,000,000 90,000Issued and fully paid:Ordinary shares 132,366,672 26,473 132,366,672 26,473Of which held in Treasury 2,103,853 824,674
In 2020, the group initiated a share buyback program, whereby the company repurchased 2,354,433 shares for a total consideration of €16 .6 million at a weighted average share price of €7 .04 per share . This share buyback program was temporarily suspended at the end of March 2020 as precautionary measure in light of COVID-19 pandemic, however we intend to resume this program again in the first quarter of 2021 .
During the year 1,075,254 treasury shares were issued to cover the exercise of employee stock options and settlement of restricted stock units (2019: 2,056,046 treasury shares) . All shares have a par value of €0 .20 per share (2019:€0 .20 per share) . All issued shares have been fully paid . Further information on the rights, restrictions and other conditions attached to ordinary and preferred shares is provided in the Corporate Governance section in the Annual Report .
Reserves are freely distributable except for €111 million of legal reserves (2019: €173 million) . Note E . Other reserves in the company financial statements provides an overview of the non-distributable reserves .
The Corporate Governance section provides a detailed description regarding the use of Foundation Continuity TomTom as a protective measure . Management is of the opinion that the call option as described in the Corporate Governance section does not represent a significant value as meant in IAS 1, paragraph 31, due to the fact that the likelihood that the call option will be exercised is remote . In the remote event that the call option is exercised, the preferred shares that are issued temporarily are intended to be canceled within a one-year period . The option is therefore not accounted for, nor is further disclosure provided .
ACCOUNTING POLICY
Share capitalOrdinary shares are classified as share capital . Equity instruments are recorded at the proceeds received, net of direct issue costs .
Share premiumThe share premium represents the amount by which the fair value of the consideration received exceeds the nominal value of shares issued . Incremental costs directly attributable to the issue of new shares or options are shown in equity as a deduction, net of tax, from the proceeds .
Treasury sharesOwn equity instruments that are reacquired (treasury shares) are recognized at cost and deducted from equity . No gain or loss is recognized in profit or loss on the purchase, sale, issue or cancellation of the group’s own equity instruments . Upon reissue, any difference between the carrying amount, determined on a first-in, first-out basis, and the consideration, is recognized in the retained earnings .
110
NOTES TO THE CONSOLIDATED FINANCIAL STATEMENTS CONTINUED

27 | EARNINGS PER SHARE The calculation of basic and diluted earnings per share is based on the following data:
(€ in thousands) 2020 2019
Earnings attributable to ordinary equity holders Net result from continuing operations -257,639 -192,965Net result from discontinued operations 0 825,852Net result attributable to ordinary equity holders -257,639 632,887
Number of sharesWeighted average number of ordinary shares for basic earnings per share 130,562 170,973
Effect of dilutive potential ordinary sharesStock options and restricted shares 1,144 1,907Weighted average number of ordinary shares for diluted earnings per share 131,706 172,880
Earnings per share (€)Basic -1 .97 3 .70Diluted -1 .97 3 .66
Earnings per share from continuing operations (€)Basic -1 .97 -1 .13Diluted -1 .97 -1 .13
Adjusted earnings per shareThe group used to report adjusted earnings per share up to 2019 . The use of this measure has been discontinued in 2020 as we believe that Free cash flow better reflects the group's operational performance . For explanation of Free cash flow reference is made to the Non-GAAP measures section .
ACCOUNTING POLICY
Basic earnings per shareBasic earnings per share is calculated by dividing the profit attributable to equity holders of the company by the weighted average number of ordinary shares outstanding during the year . Treasury shares are deducted from the number of ordinary shares outstanding on a weighted average basis .
Diluted earnings per shareDiluted earnings per share is calculated by adjusting the weighted average number of ordinary shares outstanding to assume conversion of all dilutive potential ordinary shares arising from stock options and other equity-settled stock compensation plans . When the effect of the equity-settled stock compensation plans is anti-dilutive, the number is excluded from the calculation of diluted earnings .
111
NOTES TO THE CONSOLIDATED FINANCIAL STATEMENTS FINANCING, FINANCIAL RISK MANAGEMENT AND FINANCIAL INSTRUMENTS CONTINUED

28 | FINANCIAL RISK MANAGEMENT The group’s activities result in exposure to a variety of financial risks including credit, foreign currency, liquidity, interest rate and capital risk . Management policies have been established to identify, analyze and monitor these risks, and to set appropriate risk limits and controls . Financial risk management is carried out in accordance with our Corporate Treasury Policy . The written principles and policies are reviewed periodically to reflect changes in market conditions, the activities of the business and laws and regulations affecting the group’s business .
CREDITCredit risk arises primarily from cash and cash equivalents held at financial institutions and, to a certain extent, from trade receivables and contract assets .
Cash balances are held with counterparties that have a credit risk rating of at least BBB-, as rated by an acknowledged rating agency . Moreover, to avoid significant concentration of exposure to particular financial institutions, we ensure that transactions and businesses are properly spread among different counterparties .
The group’s exposure from its customers is managed through establishing proper credit limits and continuous credit risk assessments for each individual customer .
Procedures include aligning credit and trading terms and conditions with an assessment of the individual characteristics and risk profile of each customer . This assessment is made based on past experiences and independent ratings from external rating agencies whenever available .
The group’s exposure to credit risk is influenced mainly by the individual characteristics of each customer . Management actively monitors the credit risk related to these customers, also taking into account the effects of COVID-19 and takes proactive action to reduce credit limits if required .
The following table summarizes the movement in the expected credit loss allowances for both trade receivables and unbilled receivables:
(€ in thousands) 2020 2019
Balance as at 1 January -2,714 -2,266Additions to provision -1,239 -2,482Receivables written off during the year as uncollectible 52 54Unused amounts reversed 1,208 1,980Currency translation differences -10 0Balance as at 31 December -2,702 -2,714
To measure the expected credit losses, trade receivables and unbilled receivables have been grouped based on shared credit risk characteristics and the days past due as presented below:
(€ in thousands) 2020 2019
Gross unbilled receivables 58,619 34,740Gross trade receivables 82,058 102,124
140,677 136,864Of which:Not overdue 129,249 118,018Overdue less than 3 months 8,866 8,449Between 3-6 months 759 1,200More than 6 months 1,803 9,197Gross receivables 140,677 136,864
Not overdue represents balances for which payment terms specified in the terms and conditions established with the group’s customers have not been exceeded or balances which have not yet been invoiced .
As at 31 December 2020, the total expected credit loss allowance represented approximately 0 .5% of group revenue (2019: 0 .4%) .
ACCOUNTING POLICY
In determining the expected credit loss, the group applies the simplified approach to measuring expected credit losses, which uses a lifetime expected loss allowance for all trade and unbilled receivables . As unbilled receivables share the same risk characteristics as trade receivables for similar types of contracts, the expected loss rates for trade receivables are considered a reasonable approximation of the loss rates for unbilled receivables . The expected credit loss rates are measured by grouping trade and unbilled receivables based on shared credit risk characteristics and days passed due . When a trade receivable is uncollectible, it is written off against the allowance account for trade receivables . The expected loss allowances and any subsequent recoveries of amounts previously written off, are recognized in operating expenses within ‘Selling, general and administrative’ .
112
NOTES TO THE CONSOLIDATED FINANCIAL STATEMENTS FINANCING, FINANCIAL RISK MANAGEMENT AND FINANCIAL INSTRUMENTS CONTINUED

FOREIGN CURRENCYThe group operates internationally and conducts business in multiple currencies . Revenue is earned in EUR, GBP, USD and other currencies, and does not necessarily match the cost of sales and other costs which are largely in EUR and USD . Foreign currency exposures on commercial transactions relate mainly to estimated purchases and sales transactions that are denominated in currencies other than reporting currency – EUR (€) .
The group manages foreign currency transaction risk through options and forward contracts to cover forecasted net exposures . All such transactions are carried out within the guidelines set by Corporate Treasury Policy, which is reviewed annually by the Audit Committee .
A 2 .5% strengthening/weakening of EUR as at 31 December 2020 would have had the following impact (increase/(decrease)) on profit or loss, and equity:
(€ in thousands)
2020 2019
Strengthen Weaken Strengthen Weaken
USD 573 -537 1,747 -1,747GBP -555 555 658 -658
This analysis assumes that all other variables remain constant . The analysis was performed on the same basis as in 2019 .
A breakdown of receivables held in foreign currencies is provided in note 20 .
LIQUIDITYThe approach to managing liquidity is to ensure that sufficient funds are available to meet financial obligations when they fall due under both normal and stressed conditions, without incurring unacceptable losses or risking damage to the group’s reputation . To ensure there is sufficient cash to meet expected operational expenses, including the servicing of financial obligations, actual and future cash flow requirements are regularly monitored, taking into account the maturity profiles of financial assets and liabilities and the rolling forecast of the group’s liquidity reserve, which comprises cash and cash equivalents and a credit facility .
The credit facility, entered into in June 2019, is effective until 24 June 2024 and comprises a revolving credit facility for an amount of €75 million with an additional accordion option of €40 million (2019: a revolving credit facility of €75 million) .
Under the covenants of the facility, the group is required to meet certain performance indicators with regard to its leverage ratio (3 .0), which is tested quarterly .
The leverage ratio is defined as the ratio of total consolidated net debt as at the testing date to the consolidated LTM EBITDA in respect of the relevant period ending on that date . In case of a breach of these covenants, the banks are contractually entitled to request early repayment of the outstanding amount .
As at 31 December 2020, the group complied with the loan covenants and, based on the group’s plan for 2021, management expects to be able to comply with the loan covenants during 2021 .
Any borrowings from the credit facility have a one-month maturity period from the date of draw down . This can be continuously rolled-over up to the end date of the facility agreement at management’s discretion . The interest is in line with market rates and is based on Euribor plus a margin that depends on certain leverage covenants and the utilisation percentage .
No interest is paid on the facility during the periods presented as the facility was undrawn at the end of 2020 and 2019 . A commitment fee is paid on the undrawn amount, which is included in the interest expense line item .
INTEREST RATEInterest rate risk arises primarily from the exposure to interest income/expense on cash balances .
Our intention is to prioritize capital preservation and when possible we invest our surplus cash using approved investment instruments, such as bank deposits and money market fund investments . All transactions and counterparty risk limits are governed by Corporate Treasury Policy .
CAPITALThe group’s financing policy aims to maintain a capital structure that enables the group to achieve its strategic objectives and daily operational needs, and to safeguard the group’s ability to continue as a going concern .
In order to maintain or adjust the capital structure, the group may issue new shares, adjust its dividend policy, return capital to shareholders or sell assets to reduce debt, taking into account relevant interest cover and leverage covenants of external borrowings as disclosed above .
As at 31 December 2020, the group had a net cash position of €372 million (2019: €437 million) .
For further quantitative disclosures in respect of liquidity, interest rate and capital risks, reference is made to note 23 and note 26 .
113
NOTES TO THE CONSOLIDATED FINANCIAL STATEMENTS FINANCING, FINANCIAL RISK MANAGEMENT AND FINANCIAL INSTRUMENTS CONTINUED

29 | FINANCIAL INSTRUMENTS The group holds the following financial instruments for which additional disclosures are provided in the notes as indicated:
(€ in thousands) Note 2020 2019
Financial assetsFinancial assets at amortized costTrade receivables 20 79,661 99,776Fixed-term deposits 23 140,930 222,579Cash and cash equivalents 23 231,520 213,941Financial assets at fair value through profit or lossDerivative instruments 22 12 201Financial assets at fair value through other comprehensive incomeOther investments 8,733 0Total financial assets 460,856 536,497
Financial liabilitiesFinancial liabilities at amortized costTrade payables 24 21,998 47,085Lease liabilities 17 43,673 34,268Financial liabilities at fair value through profit or lossDerivative instruments 22 217 97Total financial liabilities 65,888 81,450
Refer to note 28 for disclosure of group’s exposure to risks associated with financial instruments .
ACCOUNTING POLICY
Financial assetsThe group classifies its financial assets, at initial recognition, as subsequently measured at amortized cost or at fair value through profit or loss or other comprehensive income . The classification depends on the purpose for which the financial assets were acquired .
Financial assets at amortized costFinancial assets measured at amortized cost are financial assets which are held for the objective of collecting contractual cash flows which are fixed and determinable and consist solely of payments of principal and interest . They are initially recognized at fair value and subsequently measured at amortized cost (if the effect of time value is material) using the effective interest method, less any expected credit losses . Financial assets are included in current assets, except for those with maturities greater than 12 months after the balance sheet date, which are classified as non-current assets . For further details regarding expected credit losses, refer to note 28 Financial risk management .
Financial assets at fair value through other comprehensive incomeFinancial assets at fair value through other comprehensive income (OCI) represents investment in equity instruments carried at fair value . The group elected to recognize the changes in fair value through OCI . Dividend income is recognized in the profit or loss when the group's right to receive payment is established . The fair value of such instrument is determined using level 1 input .
Financial assets and liabilities at fair value through profit or lossDerivatives are categorized at fair value through profit or loss unless they are designated as hedges . Derivatives are recorded as financial assets when the value of the derivative is positive in favor of the company; otherwise the derivative is classified as a financial liability . All derivative financial instruments are classified as current or non-current assets or liabilities based on their maturity dates and are accounted for at trade date . Financial assets are derecognized when the rights to receive cash flows from the investments have expired or have been transferred and the group has substantially transferred all risks and rewards of ownership .
The fair value of financial assets/liabilities carried at fair value through profit or loss is determined using valuation techniques that maximize the use of observable market data where it is available and which rely as little as possible on entity-specific estimates . In accordance with the fair value hierarchy established by IFRS 13, these types of inputs classify as level 2 inputs .
114
NOTES TO THE CONSOLIDATED FINANCIAL STATEMENTS FINANCING, FINANCIAL RISK MANAGEMENT AND FINANCIAL INSTRUMENTS CONTINUED

Financial liabilities at amortized costFinancial liabilities issued by the group are classified according to the substance of the contractual arrangements entered into, and the definitions of a financial liability . Financial liabilities are initially recognized and measured at fair value and subsequently at amortized cost .
Fair value estimationThe group classifies fair value measurements using a fair value hierarchy that reflects the significance of the inputs used in making the measurements .
The fair value hierarchy divides the inputs into the following levels:
> Level 1: quoted prices (unadjusted) in active markets for identical assets and liabilities .
> Level 2: inputs other than quoted prices that are observable for the asset or liability, either directly or indirectly (for example, derived from prices) .
> Level 3: inputs for the asset or liability that are not based on observable market data .
30 | FINANCIAL RESULT AND RESULT OF ASSOCIATE Other financial result and result from associates include the following items:
(€ in thousands) 2020 2019
Other financial result 2,695 14Foreign exchange result -9,129 -2,356Other financial result and result from associate -6,434 -2,342
The interest expense relates mainly to interest expense on cash balances, lease liabilities and commitment fees for the loan facility (see note 28 Financial risk management) .
Other financial results include a one-off gain of €3 .1 million from remeasuring the investment in Cyient to fair value as the investment no longer classified as an associate in 2020 . Refer to note 18 . The foreign exchange result (loss) includes results that mainly related to monetary balance sheet item revaluations (including deposits in foreign currency) and to a lesser extend hedging contracts . Hedging contracts are entered into to protect the group from adverse exchange rate fluctuations that may result from PLN and USD exposures .
ACCOUNTING POLICY
Interest income and expense are recognized using the effective interest method .
115
NOTES TO THE CONSOLIDATED FINANCIAL STATEMENTS FINANCING, FINANCIAL RISK MANAGEMENT AND FINANCIAL INSTRUMENTS CONTINUED

Section 6: Other disclosures This section includes the notes on provisions, commitments and contingent liabilities, remunerations of members of the Management Board and the Supervisory Board, related party transactions and auditor’s remuneration .
ACCOUNTING POLICY
Provisions are recognized when:
> The group has a present obligation as a result of a past event .
> It is probable that the group will be required to settle that obligation .
> The amount can be reliably estimated .
Provisions are measured at management’s best estimate of the expenditure required to settle the obligation at the balance sheet date, and are discounted to present value where the effect is material .
Warranty provisionThe group generally offers warranties for its products . Provisions for warranty costs are recognized at the date of sale of the relevant products, at management’s best estimate of the expenditure required to settle the group’s obligation . Warranty costs are recorded within cost of sales .
Claims and litigation provisionThe group made a provision for potential legal, tax penalties and other risks in various jurisdictions . The legal matters consist mainly of intellectual property infringement issues . In the normal course of business, the group receives claims relating to allegations that it has infringed intellectual property assets .
In such cases, the companies making the claims seek payments that may take the form of licenses and/or damages . While these claims will be resisted, some are likely to be settled by negotiation and others are expected to result in litigation .
The cases and claims against the group often raise difficult and complex factual and legal issues which are subject to many uncertainties and complexities, including but not limited to the facts and circumstances of each particular case and claim, the jurisdiction in which each suit is brought, and the differences in applicable law . In the normal course of business, management consults with legal counsel and certain other experts on matters related to such claims and litigation . The group accrues a liability when it is determined that an adverse outcome is more likely than not, and the amount of the loss can be reasonably estimated .
If the likelihood of an adverse outcome is reasonably possible or an estimate is not determinable, the matter is disclosed, provided it is material . Management is of the opinion that the provision is adequate to resolve these claims .
Employee benefits provisionEmployee benefits provision relates mainly to the defined benefit pension plan in Germany and Belgium as disclosed in note 8 .
Other provisionOther provision and its movement in 2020 related solely to provisions for expected restructuring expenses .
31 | PROVISIONS
(€ in thousands) 2020 2019
Non-current 41,014 46,746Current 7,918 8,274Total provisions 48,932 55,020
The movements in each category of provisions are as follows:
(€ in thousands) WarrantyClaims and
litigationEmployee benefits Other Total1
Balance as at 1 January 2019 29,866 24,702 13,091 6,753 74,412Increases in provisions 3,074 4,406 8,599 0 16,079Utilized -10,094 -475 -307 -4,358 -15,234Released -9,407 -8,435 0 -2,395 -20,237Balance as at 31 December 2019 13,439 20,198 21,383 0 55,020Increases in provisions 1,419 431 2,121 5,508 9,479Utilized -3,067 0 -610 -1,975 -5,652Released1 -3,750 -6,165 0 0 -9,915Balance as at 31 December 2020 8,041 14,464 22,894 3,533 48,932
1 Releases in claims and litigation mainly reflects the expiry of statute of limitations .
116
NOTES TO THE CONSOLIDATED FINANCIAL STATEMENTS CONTINUED

SIGNIFICANT ESTIMATES
Warranty provisionManagement estimates the related provision for future warranty claims based on historical warranty claim information, as well as evaluating recent trends that might suggest that past cost information may differ from future claims . From the total warranty provision of €8 million (2019: €13 million), it is estimated that an amount of €4 million (2019: €6 .7 million) will be utilized within 12 months while the remaining will be utilized between 1-3 years .
Claims and litigation provisionThe methodology used to determine the amount of the liability requires significant judgments and estimates regarding the costs of settling asserted claims . Due to the fact that there is limited historical data available, the estimated liability cannot be based upon recent settlement experience for similar types of claims .
Based on the best estimate, the portion of the claims and litigation provision expected to be settled in the coming 12 months amounts to approximately €0 .8 million (2019: €1 .2 million) .
32 | COMMITMENTS, CONTINGENT ASSETS AND LIABILITIES The group has long-term financial commitments, which are not shown in the group’s balance sheet as at 31 December 2020 . These commitments relate mainly to service contracts with suppliers .
Also included is open purchase commitments with contract manufacturers for certain products and components . Contract manufacturers order the requisite component parts from their suppliers on the basis of forecasts of the number of units required . In certain circumstances, the group has a contractual obligation to purchase these components from the manufacturers . The total commitments under these contracts are presented below:
(€ in thousands) 2020 2019
Less than 1 year 79,073 84,389Between 1-5 years 111,144 116,135More than 5 years 2,000 0Total commitments 192,217 200,524
Commitments in 2019 include a commitment to purchase services with a total value of €12 million from Cyient Ltd .
The group has a guarantee facility of €10 million, of which a total amount of €2 million has been issued (2019: €10 million and €3 million respectively) .
The group has also given a guarantee as described in section 479C of the UK Companies Act to TomTom Software Ltd . Accordingly, TomTom Software Ltd . is exempted from the requirements of the Companies Act 2006 relating to audit by virtue of section 479A . For the financial reporting period starting 1 January 2021, this exemption can no longer be applied following the departure of the United Kingdom from the European Union .
In addition, two German subsidiaries, TomTom Germany GmbH & Co . KG . and TomTom Location Technology Germany GmbH, which are included in these consolidated financial statements, apply the exemption as described in section 264b of the German Commercial Code (HGB) with regard to the publication of the annual financial statements and the drawing up of a management report and the notes to the financial statements .
CONTINGENCIESPlease refer to note 12 and note 31 for disclosures on tax and legal contingencies .
Based on legal advice, there were no other contingencies that management expects to have a material adverse effect on the group’s financial position as at 31 December 2020 .
117
NOTES TO THE CONSOLIDATED FINANCIAL STATEMENTS OTHER DISCLOSURES CONTINUED
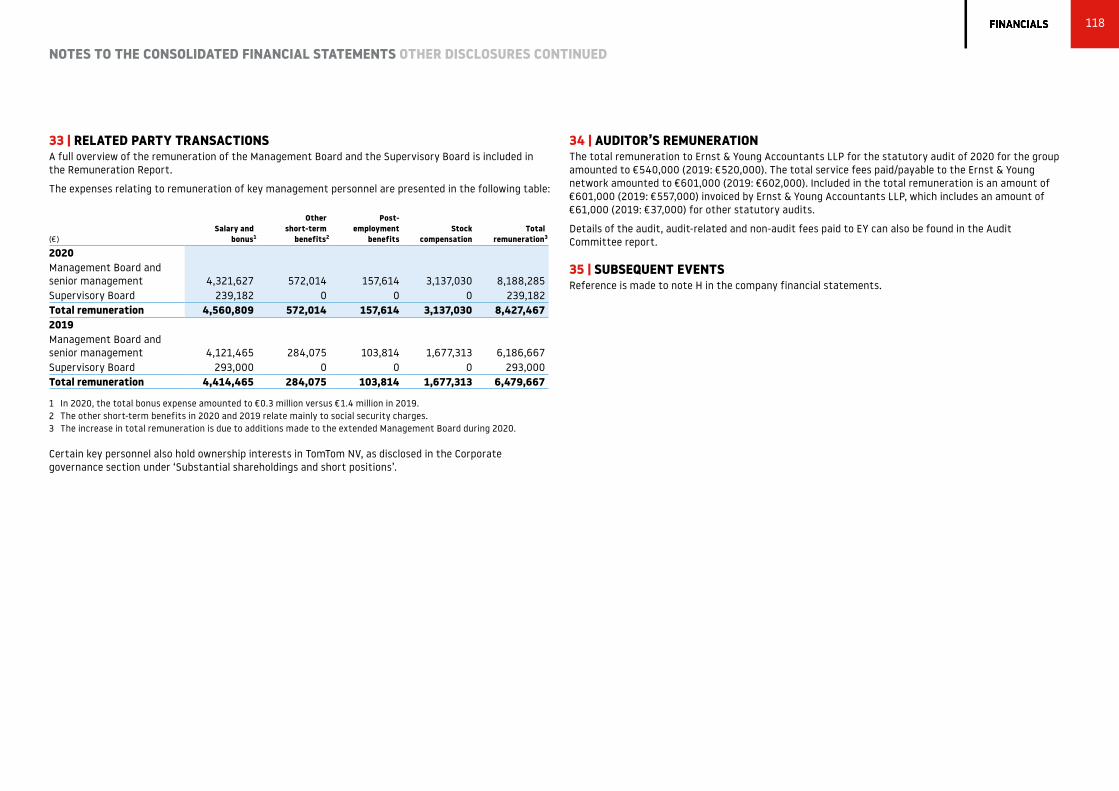
33 | RELATED PARTY TRANSACTIONS A full overview of the remuneration of the Management Board and the Supervisory Board is included in the Remuneration Report .
The expenses relating to remuneration of key management personnel are presented in the following table:
(€)Salary and
bonus1
Other short-term
benefits2
Post- employment
benefitsStock
compensationTotal
remuneration3
2020Management Board and senior management 4,321,627 572,014 157,614 3,137,030 8,188,285Supervisory Board 239,182 0 0 0 239,182Total remuneration 4,560,809 572,014 157,614 3,137,030 8,427,4672019Management Board and senior management 4,121,465 284,075 103,814 1,677,313 6,186,667Supervisory Board 293,000 0 0 0 293,000Total remuneration 4,414,465 284,075 103,814 1,677,313 6,479,667
1 In 2020, the total bonus expense amounted to €0 .3 million versus €1 .4 million in 2019 .2 The other short-term benefits in 2020 and 2019 relate mainly to social security charges .3 The increase in total remuneration is due to additions made to the extended Management Board during 2020 .
Certain key personnel also hold ownership interests in TomTom NV, as disclosed in the Corporate governance section under ‘Substantial shareholdings and short positions’ .
34 | AUDITOR’S REMUNERATION The total remuneration to Ernst & Young Accountants LLP for the statutory audit of 2020 for the group amounted to €540,000 (2019: €520,000) . The total service fees paid/payable to the Ernst & Young network amounted to €601,000 (2019: €602,000) . Included in the total remuneration is an amount of €601,000 (2019: €557,000) invoiced by Ernst & Young Accountants LLP, which includes an amount of €61,000 (2019: €37,000) for other statutory audits .
Details of the audit, audit-related and non-audit fees paid to EY can also be found in the Audit Committee report .
35 | SUBSEQUENT EVENTS Reference is made to note H in the company financial statements .
118
NOTES TO THE CONSOLIDATED FINANCIAL STATEMENTS OTHER DISCLOSURES CONTINUED

(€ in thousands) Notes 2020 2019
Result of disposal of subsidiaries C 0 807,237General and administrative expenses B 5,891 6,563Operating result -5,891 800,674
Interest expense -13,357 -13,805Other financial result 64 -173Result before tax -19,184 786,696
Income tax gain 4,443 8,013Result of subsidiaries after taxation C -242,898 -161,822Net result -257,639 632,887
119
COMPANY STATEMENT OF INCOME FOR THE YEAR ENDED 31 DECEMBER

(€ in thousands) Notes 2020 2019
Investments in subsidiaries C 2,215,621 2,466,523Total non-current assets 2,215,621 2,466,523
Receivables 40,137 41,028Cash and cash equivalents 18 8Total current assets 40,155 41,036
Total assets 2,255,776 2,507,559
Share capital 26,473 26,473Share premium 338,124 338,124Treasury shares -14,312 -7,438Other reserves E 127,598 188,508Accumulated result 167,372 -512,622Result for the year -257,639 632,887Total shareholders’ equity D 387,616 665,932
Intercompany payable F 1,867,696 1,840,010Total non-current liabilities 1,867,696 1,840,010
Other liabilities 464 1,617Total current liabilities 464 1,617
Total equity and liabilities 2,255,776 2,507,559
120
COMPANY BALANCE SHEET AS AT 31 DECEMBER

A | PRESENTATION OF FINANCIAL STATEMENTS AND RECOGNITION AND MEASUREMENT PRINCIPLES The description of the activities of TomTom NV (the company) and the company structure, as included in the notes to the consolidated financial statements, also applies to the company financial statements .
The company has prepared its company financial statements in accordance with Part 9 of Book 2 of the Dutch Civil Code and, specifically, in accordance with section 362 .8 of the Dutch Civil Code . In doing so, it has applied the principles of recognition and measurement as adopted in the consolidated financial statements (IFRS) . Investments in subsidiaries are accounted for using the equity method . For more information on the accounting policy applied, and on the notes, please refer to the notes to the consolidated financial statements .
B | GENERAL AND ADMINISTRATIVE EXPENSES The employees of the company comprise only the members of the Management Board . The General and Administrative expenses comprised mainly of the remuneration of the Management Board and the Supervisory Board and other general expenses such as the auditor’s fees . For the remuneration of the Management Board and Supervisory Board, reference is made to the Supervisory Board and the Remuneration Report in this annual report . The auditor’s fee is further disclosed in note 34 of the consolidated financial statements .
C | INVESTMENTS IN SUBSIDIARIES The movements in investments in subsidiaries were as follows:
(€ in thousands) 2020 2019
Balance as at 1 January 2,466,523 2,804,801Result of subsidiaries -242,898 -161,822Transfer to stock compensation reserve 5,066 3,205Dividend 0 -78,508Disposal of subsidiary 0 -100,953Currency translation differences -6,446 3,603Other direct equity movements -6,624 -3,803Balance as at 31 December 2,215,621 2,466,523
The disposal of subsidiary in 2019 relates to the disposal of the TomTom Telematics B .V . entities as explained in note 13 of the consolidated financial statements .
A list of subsidiaries and affiliated companies prepared in accordance with the relevant legal requirements (the Dutch Civil Code Book 2, Part 9, sections 379 and 414) is deposited at the office of the Chamber of Commerce in Amsterdam, the Netherlands .
D | SHAREHOLDERS’ EQUITY For the statement of changes in equity for the year ended 31 December 2020, please refer to Consolidated statement of changes in equity in the consolidated financial statements . Additional information on the shareholders’ equity is disclosed in note 26 of the consolidated financial statements .
121
NOTES TO THE COMPANY FINANCIAL STATEMENTS

E | OTHER RESERVES
(€ in thousands)Legal reserve participation
Cumulate translation
reserveTotal legal
reserve
Stock compensation
reserveTotal other
reserves
Balance as at 1 January 2019 220,417 13,317 233,734 18,065 251,799Currency translation differences 0 3,603 3,603 0 3,603Disposal of subsidiary 0 -793 -793 0 -793Stock compensation expenses 0 0 0 4,533 4,533Transfers between reserves -63,145 0 -63,145 -7,489 -70,634Balance as at 31 December 2019 157,272 16,127 173,399 15,109 188,508Currency translation differences 0 -6,997 -6,997 0 -6,997Recycled currency translation differences 0 551 551 0 551Fair value remeasurement of financial instruments 775 0 775 0 775Stock compensation expenses 0 0 0 6,437 6,437Transfers between reserves -56,614 0 -56,614 -5,062 -61,676Balance as at 31 December 2020 101,433 9,681 111,114 16,484 127,598
LEGAL RESERVELegal reserves are the non-distributable reserves that are recorded for an amount equal to the restricted reserves of the company’s subsidiaries and the cumulative translation reserve .
STOCK COMPENSATION RESERVEThe stock compensation reserve represents the cumulative expense of issued stock options that have been granted but not exercised and restricted stock units that have not yet vested .
F | INTERCOMPANY PAYABLES Intercompany payables comprises loans provided by subsidiaries . The interest rate on the loan during 2020 is based upon the applicable inter-bank offered rate plus a margin . Given that the current interbank rates are below zero, the margin charged is set at a rate of 1 .5% (2019: 0 .6%) . Although no repayment period has been agreed the loan has a long-term nature .
G | OFF-BALANCE SHEET COMMITMENTS The company has a guarantee facility of €10 million, of which a total amount of €2 .4 million has been issued (2019: €10 million and €2 .5 million respectively) .
The company has also issued several declarations of joint and several liability for various group companies, in compliance with section 403 of Part 9 of Book 2 of the Dutch Civil Code . Besides these declarations, TomTom NV has given a guarantee as described in article 479C of the UK Companies Act for UK subsidiary TomTom Software Ltd .
In addition, two German subsidiaries, TomTom Germany GmbH & Co . KG . and TomTom Location Technology Germany GmbH, apply the exemption as described in section 264b of the German Commercial Code (HGB) with regard to the publication of the annual financial statements .
The company forms a fiscal unity for corporate income tax and value added tax (VAT) purposes with several of its Dutch subsidiaries . Each company within the fiscal unity is jointly and severally liable for the fiscal liability of the fiscal unity .
H | SUBSEQUENT EVENTS There has been no subsequent events from 31 December 2020 to the date of issue of these financial statements .
I | PROPOSED APPROPRIATION OF RESULT The Management Board proposes to add the net loss in full to the Accumulated result .
TomTom NV Amsterdam, 4 February 2021
THE MANAGEMENT BOARD
HAROLD GODDIJN
TACO TITULAER
ALAIN DE TAEYE
Amsterdam, 4 February 2021
THE SUPERVISORY BOARD
DERK HAANK
JACQUELINE TAMMENOMS BAKKER
JACK DE KREIJ
MICHAEL RHODIN
HALA ZEINE
122
NOTES TO THE COMPANY FINANCIAL STATEMENTS CONTINUED

STATUTORY PROVISION WITH RESPECT TO APPROPRIATION OF RESULTSAccording to the company’s Articles of Association, the company’s result is freely at the disposal of the shareholders, provided that total shareholders’ equity exceeds the called-up and paid-up capital of the company, increased by legal and statutory reserves .
FOUNDATION CONTINUITY TOMTOMFor a description of the Foundation Continuity TomTom, refer to the Corporate Governance section in this Annual Report .
AUDITOR’S REPORTReference is made to the Independent auditor’s report section in this Annual Report .
123
OTHER INFORMATION
To: the shareholders and Supervisory Board of TomTom NV
REPORT ON THE AUDIT OF THE FINANCIAL STATEMENTS 2020 INCLUDED IN THE ANNUAL REPORT
OUR OPINIONWe have audited the financial statements 2020 of TomTom NV, based in Amsterdam . The financial statements comprise the consolidated and company financial statements .
In our opinion: > The accompanying consolidated financial statements give a true and fair view of the financial position of TomTom NV, as at 31 December 2020 and of its result and its cash flows for 2020 in accordance with International Financial Reporting Standards as adopted by the European Union (EU-IFRS) and with Part 9 of Book 2 of the Dutch Civil Code .
> The accompanying company financial statements give a true and fair view of the financial position of TomTom NV as at 31 December 2020 and of its result for 2020 in accordance with Part 9 of Book 2 of the Dutch Civil Code .
The consolidated financial statements comprise: > The consolidated balance sheet for the year ended 31 December 2020 .
> The following statements for the year ended 31 December 2020: the consolidated statement of income, the consolidated statement of comprehensive income, consolidated statement of changes in equity and the consolidated statement of cash flows .
> The notes to the consolidated financial statements comprising a summary of the significant accounting policies and other explanatory information .
The company financial statements comprise: > The company balance sheet as at 31 December 2020 .
> The company statement of income for the year ended 31 December 2020 .
> The notes comprising a summary of the accounting policies and other explanatory information .
BASIS FOR OUR OPINIONWe conducted our audit in accordance with Dutch law, including the Dutch Standards on Auditing . Our responsibilities under those standards are further described in the ‘Our responsibilities for the audit of the financial statements’ section of our report .
We are independent of TomTom NV in accordance with the EU Regulation on specific requirements regarding statutory audit of public-interest entities, the Wet toezicht accountantsorganisaties (Wta, Audit firms supervision act), the Verordening inzake de onafhankelijkheid van accountants bij assurance-opdrachten (ViO, Code of Ethics for Professional Accountants, a regulation with respect to independence) and other relevant independence regulations in the Netherlands . Furthermore we have complied with the Verordening gedrags- en beroepsregels accountants (VGBA, Dutch Code of Ethics) .
We believe the audit evidence we have obtained is sufficient and appropriate to provide a basis for our opinion .
OUR AUDIT APPROACHOur understanding of the businessTomTom NV develops and sells navigation and location-based products and services, such as maps, traffic, navigation software and personal navigation devices . The group is structured in components and we tailored our group audit approach accordingly . We paid specific attention in our audit to a number of areas driven by the operations of the group and our risk assessment .
124
INDEPENDENT AUDITOR’S REPORT

We start by determining materiality and identifying and assessing the risks of material misstatement of the financial statements, whether due to fraud, non-compliance with laws and regulations or error in order to design audit procedures responsive to those risks and to obtain audit evidence that is sufficient and appropriate to provide a basis for our opinion . The risk of not detecting a material misstatement resulting from fraud is higher than for one resulting from error, as fraud may involve collusion, forgery, intentional omissions, misrepresentations, or the override of internal control .
In 2020 we were forced to perform our procedures to a greater extent remotely due to the COVID-19 measures . This limits our observation and increases the risk of missing certain signals . In order to compensate for the limitations related to physical contact and direct observation, we performed alternative procedures, such as an intensified contact through use of video conferencing and remote reviews, to obtain audit evidence that is sufficient and appropriate to provide a basis for our opinion .
Materiality
MATERIALITY €4 .4 million (2019: €6 .45 million)BENCHMARK APPLIED 0 .85% of revenue (2019: 1 .50% of gross profit)EXPLANATION Based on our professional judgment, we determined that revenue, is the most
appropriate benchmark to determine materiality . In prior year we used gross profit as a benchmark . Following the sale of TomTom Telematics and the resulting change in composition of revenue we concluded that revenue is now a more appropriate measure .
We have also taken into account misstatements and/or possible misstatements that in our opinion are material for the users of the financial statements for qualitative reasons .
We agreed with the Supervisory Board that misstatements in excess of €220,000, which are identified during the audit, would be reported to them, as well as smaller misstatements that in our view must be reported on qualitative grounds .
Scope of the group auditTomTom NV is at the head of a group of entities . The financial information of this group is included in the consolidated financial statements of TomTom NV .
Because we are ultimately responsible for the opinion, we are also responsible for directing, supervising and performing the group audit . In this respect we have determined the nature and extent of the audit procedures to be carried out for group entities . Decisive were the size and/or the risk profile of the group entities or operations . As TomTom’s processes are highly centralized, we have applied a centralized audit approach . For the accounts which were of most significance for the audit, we have performed all audit procedures ourselves at group level .
Our audit coverage for total assets and revenues can be summarized as follows:
> For total assets our audit procedures achieved a coverage of 99% .
> For revenues our audit procedures achieved a coverage of 100% .
By performing the procedures mentioned above we have been able to obtain sufficient and appropriate audit evidence about the group’s financial information to provide an opinion about the consolidated financial statements .
Teaming and use of specialistsWe ensured that the audit team included the appropriate skills and competences which are needed for the audit of a listed client in this industry . We included specialists in the areas of IT audit, forensics, impairment testing, income tax and pensions .
OUR FOCUS ON FRAUD AND NON-COMPLIANCE WITH LAWS AND REGULATIONSOur responsibilityAlthough we are not responsible for preventing fraud or non-compliance and cannot be expected to detect non-compliance with all laws and regulations, it is our responsibility to obtain reasonable assurance that the financial statements, taken as a whole, are free from material misstatement, whether caused by fraud or error .
Non-compliance with laws and regulations may result in fines, litigation or other consequences for the company that may have a material effect on the financial statements .
125
INDEPENDENT AUDITOR’S REPORT CONTINUED

Our audit response related to fraud risks In order to identify and assess the risks of material misstatements of the financial statements due to fraud, we obtained an understanding of the entity and its environment, including the entity’s internal control relevant to the audit and in order to design audit procedures that are appropriate in the circumstances . As in all of our audits, we addressed the risk of management override of internal control . We do not audit internal control per se for the purpose of expressing an opinion on the effectiveness of the company’s internal control .
We considered available information and made enquiries of relevant executives, directors and the Supervisory Board . As part of our process of identifying fraud risks, we evaluated fraud risk factors with respect to financial reporting fraud, misappropriation of assets and bribery and corruption in close co-operation with our forensic specialists . In our risk assessment we considered the potential impact of performance based bonus schemes which the company has in place .
In our process of identifying fraud risks, we considered whether the COVID-19 pandemic gives rise to specific fraud risk factors resulting from a dilution in the effectiveness of controls as a result of the general disruption associated with remote working, supply chain challenges, and potential bias in the Management Board’s estimation process .
We evaluated the design and the implementation of internal controls that mitigate fraud risks . In addition, we performed procedures to evaluate key accounting estimates for management bias in particular relating to important judgment areas and significant accounting estimates as disclosed in Note 3 to the financial statements . We have also used data analysis to identify and address high-risk journal entries . Our audit procedures to address the assessed fraud risks did not result in a key audit matter . However, we describe the audit procedures responsive to the assessed fraud risk related to revenue recognition including the related risk of management override of controls in the description of our audit approach for the key audit matter on ‘Revenue recognition Location Technology’ .
We incorporated elements of unpredictability in our audit . We considered the outcome of our other audit procedures and evaluated whether any findings were indicative of fraud or non-compliance . If so, we reevaluate our assessment of fraud risk and its resulting impact on our audit procedures .
Our audit response related to risks of non-compliance with laws and regulations We assessed factors related to the risks of non-compliance with laws and regulations that could reasonably be expected to have a material effect on the financial statements from our general industry experience, through discussions with the Management Board, reading minutes, inspection of internal audit and compliance reports, and performing substantive tests of details of classes of transactions, account balances or disclosures .
We also inspected lawyers’ letters and correspondence with regulatory authorities and remained alert to any indication of (suspected) non-compliance throughout the audit . Finally we obtained written representations that all known instances of non-compliance with laws and regulations have been disclosed to us .
GOING CONCERN We performed the following procedures in order to identify and assess the risks of going concern and to conclude on the appropriateness of the management board’s use of the going concern basis of accounting . The Management Board made a specific assessment of the company’s ability to continue as a going concern and to continue its operations for at least the next 12 months . We discussed and evaluated the assessment with the management board exercising professional judgment and maintaining professional skepticism, and specifically focusing on the process followed by the management board to make the assessment, management bias that could represent a risk, the impact of current events (including the COVID-19 pandemic) and conditions have on the company’s operations and forecasted cash flows, with a focus on whether the company will have sufficient liquidity to continue to meet its obligations as they fall due .
We consider based on the audit evidence obtained, whether a material uncertainty exists related to events or conditions that may cast significant doubt on the company’s ability to continue as a going concern . If we conclude that a material uncertainty exists, we are required to draw attention in our auditor’s report to the related disclosures in the financial statements or, if such disclosures are inadequate, to modify our opinion .
Our conclusions are based on the audit evidence obtained up to the date of our auditor’s report . However, future events or conditions may cause a company to cease to continue as a going concern .
GENERAL AUDIT PROCEDURESOur audit further included among others:
> Performing audit procedures responsive to the risks identified, and obtaining audit evidence that is sufficient and appropriate to provide a basis for our opinion .
> Evaluating the appropriateness of accounting policies used and the reasonableness of accounting estimates and related disclosures made by the Management Board .
> Evaluating the overall presentation, structure and content of the financial statements, including the disclosures .
> Evaluating whether the financial statements represent the underlying transactions and events in a manner that achieves fair presentation .
OUR KEY AUDIT MATTERSKey audit matters are those matters that, in our professional judgment, were of most significance in our audit of the financial statements . We have communicated the key audit matters to the Supervisory Board . The key audit matters are not a comprehensive reflection of all matters discussed .
The key audit matter ‘Discontinued operations Telematics’ which was included in our last year’s auditor’s report, is not considered a key audit matter for this year as this was a one-off transaction which has been fully completed during 2019 . The key audit matter ‘Impairment of goodwill and other intangible assets’ is also not considered a key audit matter for this year, as the intangible asset balance decreased further due to regular amortization and because there is significant headroom, whereby the recoverable amount significantly exceeds the carrying amount of goodwill and intangibles of the cash generating units .
These matters were addressed in the context of our audit of the financial statements as a whole and in forming our opinion thereon, and we do not provide a separate opinion on these matters .
126
INDEPENDENT AUDITOR’S REPORT CONTINUED

REVENUE RECOGNITION LOCATION TECHNOLOGY, INCLUDING THE IMPACT OF COVID-19(Reference is made to Notes 4, 5 and Note 6 of the consolidated financial statements)Risk TomTom’s Location Technology segment includes sales contracts where revenue
recognition is based on estimates and assumptions that are complex and require significant management judgment . This applies particularly to determining the relative stand-alone selling prices of the elements included in the contracts and the estimation of total contract values .
Inherent to the nature of estimates and assumptions is that these could be influenced by the management board and consequently we identified the risk of management override of controls in relation to revenue recognition, specifically relating to the aforementioned total contract values, and the allocation of transaction prices to performance obligations .
Furthermore, the developments around the Corona (COVID-19) pandemic impacted the operational and financial performance of TomTom, which has been disclosed in Note 4 of the consolidated financial statements . The impact may continue to evolve, causing complexity and inherent uncertainty . One of the consequences of the pandemic were a revision of estimates, particularly for contracts where revenue recognition depends on the estimated total transaction price .
Our audit approach
Our audit procedures included an assessment of the appropriateness of the company’s revenue recognition policies, understanding the internal control environment, and performing procedures on revenues using data analytics . Furthermore, we discussed and evaluated the impact of the COVID-19 pandemic on the financial statements of TomTom N .V . and focused on the revenue related estimates . For relevant contracts we have assessed the contractual terms and conditions including the appropriate accounting thereof, and we have performed substantive procedures relating to the estimated total contract value, including the back testing of previous estimates .
For a sample of contracts containing multiple performance obligations, we assessed the allocation of revenue to the individual performance obligations based on the estimated stand-alone selling prices of each performance obligation . For this sample, we’ve also assessed the company’s estimated values, if this was relevant for the revenue recognition .
In performing our audit procedures we maintained our professional skepticism and remained alert for any possible impact of the COVID-19 pandemic on the financial statements and revenue related estimates . We analyzed events subsequent to 31 December 2020 to determine whether any events require adjusting amounts recognized in the financial statements .
We also assessed the adequacy of the Company’s disclosure around revenues as included in Note 6 and evaluated the overall view of the financial statements including the disclosures, and in particular Note 4, related to the impact of the COVID-19 pandemic .
Key observations The management board has updated the assumptions and estimates used based on the latest available (historic) data and expectations, including the management board’s assessment of the impact of the COVID-19 pandemic . We agree with the assumptions and estimates used by the management board .
Based on our procedures performed we did not identify errors that require adjustment of the financial statements including revenue related disclosures in accordance with EU-IFRS and Part 9 of Book 2 of the Dutch Civil Code .
REPORT ON OTHER INFORMATION INCLUDED IN THE ANNUAL REPORTIn addition to the financial statements and our auditor’s report thereon, the annual report contains other information that consists of:
> The Management Board report .
> The Supervisory Board report .
> The Remuneration report .
> Other information as required by Part 9 of Book 2 of the Dutch Civil Code .
> Supplementary information .
Based on the following procedures performed, we conclude that the other information:
> Is consistent with the financial statements and does not contain material misstatements .
> Contains the information as required by Part 9 of Book 2 and Sections 2:135b and 2:145 sub-section 2 of the Dutch Civil Code .
We have read the other information . Based on our knowledge and understanding obtained through our audit of the financial statements or otherwise, we have considered whether the other information contains material misstatements . By performing these procedures, we comply with the requirements of Part 9 of Book 2 and section 2:135b sub-section 7 of the Dutch Civil Code and the Dutch Standard 720 . The scope of the procedures performed is substantially less than the scope of those performed in our audit of the financial statements .
The Management Board is responsible for the preparation of the other information, including the Management Board report in accordance with Part 9 of Book 2 of the Dutch Civil Code, other information required by Part 9 of Book 2 of the Dutch Civil Code and the remuneration report in accordance with Sections 2:135b and 2:145 sub-section 2 of the Dutch Civil Code .
127
INDEPENDENT AUDITOR’S REPORT CONTINUED

REPORT ON OTHER LEGAL AND REGULATORY REQUIREMENTSENGAGEMENTWe were engaged by the Supervisory Board as auditor of TomTom NV on 24 April 2015 as of the audit for the year 2015 and have operated as statutory auditor since that date .
NO PROHIBITED NON-AUDIT SERVICESWe have not provided prohibited non-audit services as referred to in Article 5(1) of the EU Regulation on specific requirements regarding statutory audit of public-interest entities .
DESCRIPTION OF RESPONSIBILITIES FOR THE FINANCIAL STATEMENTSRESPONSIBILITIES OF MANAGEMENT AND THE SUPERVISORY BOARD FOR THE FINANCIAL STATEMENTSThe Management Board is responsible for the preparation and fair presentation of the financial statements in accordance with EU-IFRS and Part 9 of Book 2 of the Dutch Civil Code . Furthermore, the Management Board is responsible for such internal control as it determines is necessary to enable the preparation of the financial statements that are free from material misstatement, whether due to fraud or error .
As part of the preparation of the financial statements, the Management Board is responsible for assessing the company’s ability to continue as a going concern . Based on the financial reporting frameworks mentioned, the Management Board should prepare the financial statements using the going concern basis of accounting unless the Management Board either intends to liquidate the company or to cease operations, or has no realistic alternative but to do so . The Management Board should disclose events and circumstances that may cast significant doubt on the company’s ability to continue as a going concern in the financial statements .
The Supervisory Board is responsible for overseeing the company’s financial reporting process .
OUR RESPONSIBILITIES FOR THE AUDIT OF THE FINANCIAL STATEMENTSOur objective is to plan and perform the audit engagement in a manner that allows us to obtain sufficient and appropriate audit evidence for our opinion .
Our audit has been performed with a high, but not absolute, level of assurance, which means we may not detect all material errors and fraud during our audit .
Misstatements can arise from fraud or error and are considered material if, individually or in the aggregate, they could reasonably be expected to influence the economic decisions of users taken on the basis of these financial statements . The materiality affects the nature, timing and extent of our audit procedures and the evaluation of the effect of identified misstatements on our opinion .
We have exercised professional judgment and have maintained professional skepticism throughout the audit, in accordance with Dutch Standards on Auditing, ethical requirements and independence requirements . The Our audit approach section above includes an informative summary of our responsibilities and the work performed as the basis for our opinion .
COMMUNICATIONWe communicate with the Supervisory Board regarding, among other matters, the planned scope and timing of the audit and significant audit findings, including any significant findings in internal control that we identify during our audit . In this respect we also submit an additional report to the Audit Committee in accordance with Article 11 of the EU Regulation on specific requirements regarding statutory audit of public-interest entities . The information included in this additional report is consistent with our audit opinion in this auditor’s report .
We provide the Supervisory Board with a statement that we have complied with relevant ethical requirements regarding independence, and to communicate with them all relationships and other matters that may reasonably be thought to bear on our independence, and where applicable, related safeguards .
From the matters communicated with the Supervisory Board, we determine the key audit matters: those matters that were of most significance in the audit of the financial statements . We describe these matters in our auditor’s report unless law or regulation precludes public disclosure about the matter or when, in extremely rare circumstances, not communicating the matter is in the public interest .
The Hague, 4 February 2021
Ernst & Young Accountants LLP
SIGNED BY: T. DE KUIJPER
128
INDEPENDENT AUDITOR’S REPORT CONTINUED

Quarterly overview 2020 . . . . . . . . . . . . . . . . . . . . . . . . .130
Definitions and abbreviations . . . . . . . . . . . . . . . . . . . . .132
Non-GAAP measures . . . . . . . . . . . . . . . . . . . . . . . . . . . . .133
Forward-looking statements . . . . . . . . . . . . . . . . . . . . . .134
SUPPLEMENTARY INFORMATION
129

(€ in thousands, unless stated otherwise; quarterly data unaudited) Q1 2020 Q2 2020 Q3 2020 Q4 2020 FY 2020
Revenue 131,197 123,703 147,851 125,434 528,185Cost of sales 28,631 17,921 35,861 22,381 104,794Gross profit 102,566 105,782 111,990 103,053 423,391Research and development expenses 76,195 75,055 80,155 79,473 310,878Amortization of technology and databases 64,740 64,314 64,293 63,165 256,512Marketing expenses 6,854 4,946 5,825 6,018 23,643Selling, general and administrative expenses 32,524 25,665 29,327 32,552 120,068Total operating expenses 180,313 169,980 179,600 181,208 711,101Operating result -77,747 -64,198 -67,610 -78,155 -287,710Financial (expense)/income and result of associate 5,079 -2,457 -3,716 -6,213 -7,307Result before tax -72,668 -66,655 -71,326 -84,368 -295,017Income tax gain 9,915 4,640 4,358 18,465 37,378Net result from continuing operations -62,753 -62,015 -66,968 -65,903 -257,639Net profit from discontinued operations 0 0 0 0 0Net result attributable to equity holders of the parent -62,753 -62,015 -66,968 -65,903 -257,639
MarginsGross margin (%) 78% 86% 76% 82% 80%EBIT margin (%) -59% -52% -46% -62% -54%
Basic number of shares (in thousands) 131,690 130,107 130,220 130,237 130,562Diluted number of shares (in thousands) 133,754 132,198 130,978 131,162 131,706
Earnings per share from continuing operationsBasic EPS (€) -0 .48 -0 .48 -0 .51 -0 .51 -1 .97Diluted EPS (€) -0 .48 -0 .48 -0 .51 -0 .51 -1 .97
130
QUARTERLY STATEMENT OF INCOME 2020

(€ in thousands, quarterly data unaudited) Q1 2020 Q2 2020 Q3 2020 Q4 2020 FY 2020
Operating result -77,747 -64,198 -67,610 -78,155 -287,710Financial losses 145 -1,059 -2,249 -1,724 -4,887Depreciation and amortization 72,305 71,511 71,465 70,328 285,609Change in provisions -413 -2,811 -1,610 498 -4,336Equity-settled stock compensation expenses 1,213 1,660 1,688 1,876 6,437Changes in working capital:
Change in inventories 1,525 -8,995 3,782 756 -2,932Change in receivables and prepayments 21,384 7,221 -52,925 38,061 13,741Change in liabilities (excluding provisions) -313 -51,315 29,958 4,455 -17,215
Cash flow from operations 18,099 -47,986 -17,501 36,095 -11,293
Interest received 95 585 266 136 1,082Interest paid -386 -798 -353 -419 -1,956Corporate income taxes paid -2,004 -3,932 -1,399 -678 -8,013Cash flow from operating activities 15,804 -52,131 -18,987 35,134 -20,180
Investments in property, plant and equipment -2,111 -1,849 -1,027 -1,311 -6,298Dividends received 162 0 0 0 162(Increase)/decrease in fixed-term deposits 0 34,065 37,367 8,218 79,650Cash flow from investing activities -1,949 32,216 36,340 6,907 73,514
Payment of lease liabilities -3,612 -3,669 -4,087 -4,227 -15,595Proceeds on issue of ordinary shares 1,548 698 91 147 2,484Purchase of treasury shares -16,569 0 0 0 -16,569Cash flow from financing activities -18,633 -2,971 -3,996 -4,080 -29,680
Net increase/(decrease) in cash and cash equivalents -4,778 -22,886 13,357 37,961 23,654Cash and cash equivalents at the beginning of period 213,941 209,040 186,058 196,463 213,941Exchange rate changes on cash balances held in foreign currencies -123 -96 -2,952 -2,904 -6,075Cash and cash equivalents at the end of the period 209,040 186,058 196,463 231,520 231,520
Calculation of free cash flowCash flow from operating activities 15,804 -52,131 -18,987 35,134 -20,180Investments in property, plant and equipment -2,111 -1,849 -1,027 -1,311 -6,298Free cash flow 13,693 -53,980 -20,014 33,823 -26,478
1 Includes movements in the non-current portion of deferred revenue presented under Non-current liabilities .
131
QUARTERLY STATEMENT OF CASH FLOWS 2020

Term Definition
AC Audit CommitteeADAS Advanced Driver Assistance SystemsAFM the Netherlands Authority for Financial MarketsAI Artificial IntelligenceAMX the Amsterdam Mid-Cap IndexAPI Application programming interfaceApp ApplicationASP Average Selling PriceB2B Business to BusinessB2C Business to ConsumerCAGR Compound Annual Growth RateCode the Dutch Corporate Governance CodeCompany TomTom NVCRM Customer Relationship ManagementCSR Corporate Social ResponsibilityDCC The Dutch Civil CodeEBIT Earnings Before Interest and TaxEBITDA Earnings Before Interest, Tax, Depreciation and AmortizationEICC the Electronic Industry Citizenship CoalitionEMS Environmental Management SystemEPC Environmental Product ComplianceEPS Earnings Per ShareERP Enterprise Resource PlanningETR Effective Tax RateEV Electric vehicleFCF Free Cash FlowFMS Fleet Management ServiceFoundation Foundation Continuity TomTomGAAP Generally Accepted Accounting PrinciplesGDPR General Data Protection RegulationGIS Geographical Information SystemGPS Global Positioning SystemGroup TomTom NV together with its subsidiariesHD High DefinitionIA Internal AuditIFRS International Financial Reporting StandardsIoT Internet of ThingsIP Intellectual propertyISO International Organization for StandardizationKPI Key Performance Indicator
Term Definition
LBS Location-based ServiceLCV Light Commercial VehicleLTM Last 12 MonthsMB Management BoardNDS Navigation Data StandardNorth America The United States and CanadaNPE Non-practicing entitiesOEM Original Equipment ManufacturerOS Operating SystemPDA Personal Digital AssistantPND Portable Navigation DevicePOI Point-of-interestRBA Responsible Business AllianceR&D Research & DevelopmentRemCo Remuneration CommitteeRBA Responsible Business AllianceRSU Restricted Stock UnitSaaS Software-as-a-ServiceSB Supervisory BoardSD Standard DefinitionSDK Software Development KitSelCo Selection CommitteeSEMS Social and Environmental Management SystemSG&A Selling, general and administrativeTPEG Transport Protocol Experts GroupUSP Unique Selling PointW@TT Working at TomTomxFCD Extended Floating Car DataYoY Year on Year
Android™ is a trademark of Google Inc .LinkedIn™ is registered trademark or trademark of LinkedIn Corporation and its affiliates in the United States and/or other countries . Wi-Fi® is a registered trademark of Wi-Fi Alliance® .Siri is a trademark of Apple Inc ., registered in the US and other countries .
132
DEFINITIONS AND ABBREVIATIONS

The financial information in this report includes measures, which are not defined by generally accepted accounting principles (GAAP) such as IFRS . We believe this information, along with comparable GAAP measurements, gives insight to investors because it provides a basis for evaluating our operational performance . Non-GAAP financial measures should not be considered in isolation from, or as a substitute for, financial information presented in compliance with GAAP . Wherever appropriate and practical, we provide reconciliations to relevant GAAP measures .
Term Definition
Operational revenue Operational revenue is IFRS revenue adjusted for the movement of deferred and unbilled revenue .
Gross margin is calculated as gross profit divided by IFRS revenue .EBIT is equal to operating result .EBIT margin is calculated as operating result divided by IFRS revenue .EBITDA is equal to operating result plus depreciation and amortization charges .EBITDA margin is calculated as operating result plus depreciation and amortization charges
divided by IFRS revenue .Automotive backlog is the cumulative expected IFRS revenue from all awarded Automotive deals .Free cash flow is cash from operating activities minus capital expenditure (investments in
intangible assets and property, plant and equipment) of continuing operations .Net cash is cash and cash equivalents plus cash held in fixed term deposits minus the
nominal value of our outstanding bank borrowings .Equity free cash flow yield is free cash flow divided by the market capitalization (number of outstanding
share capital multiplied by the share price) at year end .
133
NON-GAAP MEASURES

IMPORTANT NOTICE
In this Annual Report ‘TomTom’ ‘the company’ and the ‘the group’ are sometimes used for convenience in contexts where reference is made to TomTom NV and/or any of its subsidiaries in general or where no useful purpose is served by identifying the particular company.
FORWARD-LOOKING STATEMENTSThis document contains certain forward-looking statements with respect to the financial condition, results of operations and business of TomTom and certain of the plans and objectives of TomTom with respect to these items . In particular, the words ‘expect’, ‘anticipate’, ‘estimate’, ‘may’, ‘should’, ‘believe’, ‘outlook’, and similar expressions are intended to identify forward-looking statements . By their nature, forward-looking statements involve risk and uncertainty because they relate to events and depend on circumstances that will occur in the future .
Actual results may differ materially from those expressed in these forward-looking statements, and you should not place undue reliance on them . For a discussion of factors that could cause future results to differ from such forward-looking statements, see also the Risk management and control of this Annual Report .
THIRD-PARTY MARKET SHARE DATAStatements regarding market share, including the company’s competitive position, contained in this Annual Report are based on outside sources such as specialized research institutes, industry and dealer panels in combination with management estimates .
134
FORWARD-LOOKING STATEMENTS

TOMTOM NVDE RUIJTERKADE 1541011 AC AMSTERDAMTHE NETHERLANDSTEL: +31 (0)20 757 5000TOMTOM.COM
FOR MORE INFORMATIONInvestor Relations website:
corporate.tomtom.com/investors/overview