toner transfer and fusing in electrophotography -...
TRANSCRIPT

Graphic Arts in Finland 39(2010)1
1
Toner Transfer and Fusing in Electrophotography
AL-Rubaiey, H. Aalto University, School of Science and Technology, Faculty of Information and Natural Sciences,
Department of Media Technology P.O.Box 15500, FIN-00076 Aalto, Finland, http://media.tkk.fi
E-mail: [email protected]
ABSTRACT
This article is a summary of the work discussed in the doctoral thesis titled TKK-ME-D-3 "THE ROLE OF PAPER AND PROCESS TECHNOLOGIES FOR MECHANISMS AND IMAGE QUALITY IN DIGITAL ELECTROPHOTOGRAPHY", published by the Department of Media Technology-TKK, on 18.12.2009.
The thesis was based on eight publications. They are listed below, and are referred to in the text by P1, P2, P3, P4, P5, P6, P7, and P8.
Image quality and the mechanisms involved in digital dry toner electrophotography are influenced by the interactions between the printing machine, toner and paper in the last two steps where the paper is involved, i.e., in transferring the eveloped image toner to the paper, and in fusing the image to be fixed permanently on the paper surface. This study discusses the role of paper in these two steps in different technologies and its effect on the printing mechanisms and image quality. The control of optical, electrostatic and mass and heat transfer phenomena in the
P1 Pirkko Oittinen, Hussain AL-Rubaiey, Katja Sipi and Katri Vikman, Research on Paper-Ink-Process Interactions in Electrophotographic and Ink Jet Printing, (The Int. Conf. on Digital Production Printing and Industrial Applications, May 13-16, 2001, Antwerp, Belgium), In Proceeding DPP2001, (IS&T, Springfield, VA, 2001), pp. 327-330.
P2 Hussain AL-Rubaiey and Pirkko Oittinen, Transfer Current and Efficiency in Toner Transfer to Paper, (The 17th Int. Conf. on Digital Printing Technology, Sep. 30-Oct. 5, 2001, Fort Lauderdale, Florida, USA), In Proceeding NIP 17 (IS&T, Springfield, VA, 2001), pp. 648-652.
P3 Hussain AL-Rubaiey, Timo Hartus and Pirkko Oittinen, The Influence of Flash Fusing Variables on Image Fixing Quality, (Int. Congress of Imaging Science, May 13-17, 2002, Japan), In Proceeding ICIS’02, Tokyo, (2002), pp. 600-601.
P4 Hussain Al-Rubaiey and Pirkko Oittinen, The Future Potential of Digital Electrophotography, (The Int. Conf. on Digital Production Printing and Industrial Applications, May 18-21, 2003 Barcelona, Spain), In Proceeding DPP2003, (IS&T, Springfield, VA, 2003), pp. 114-115.
P5 Hussain AL-Rubaiey, Nonkululeko Khanyeza, and Pirkko Oittinen, The Effect of Coating Colour on Toner Transfer in Digital Printing, PulPaper 2004, June 1-3, 2004 Helsinki-Finland, In Proceeding of PulPaper 04, Coating, pp. 35-40.
P6 Hussain Al-Rubaiey, Pia Räsänen and Pirkko Oittinen, Detail Rendering in Digital Dry Toner Electrophotography, The 31st International research conference of iarigai, 1-6 September 2004, Copenhagen, Denmark, Advances in Printing Science and Technology, IARIGAI Publication, Vol. 31, pp. 13-26 (2005).
P7 Hussain AL-Rubaiey and Pirkko Oittinen, Controlling Fusing Parameters by Optical Image Quality in Electrophotographic Printing, The 32nd International research conference of iarigai, September 2005, Porvoo, Finland, Advances in Printing Science and Technology, IARIGAI Publication, Vol. 32, pp. 123-127 (2006).
P8 Hussain AL-Rubaiey and Pirkko Oittinen, Thermal Behavior of Paper in Contact Fusing Technology, Journal of Imaging Science and Technology, Vol. 52, No. 3, (May/June- 2008), 1st page 030507 (10 pages).

Graphic Arts in Finland 39(2010)1
2
printing process are affected by the unevenness of the properties of paper due to its heterogeneous structure and its sensitivity to humidity conditions and printing process parameters. In this research, the focus was: to understand the electrostatic behaviour of paper in toner transfer and thermal behaviour in toner fusing, to investigate the possibility of controlling and modifying the printing process for better image quality, and adding functional values to the print such as in the security and coding applications, to use the printing process as online measurement tools to characterise the electrical and thermal properties of paper and any other substrates, and how different materials and the variation in properties influencing and changing the mechanisms of printing process.
INTRODUCTION This study is mainly focused on the role of paper when involved in the last two steps of dry toner electrophotographic printing process: toner transfer and fusing steps. The contribution of this study is to connect the three elements (process, paper and toner) in toner transfer and fusing to produce higher process efficiency and better print quality /1,2/. The electrophotographic process creates a visible image using electrostatic latent images in the form of surface charge patterns on a photoconductive surface called photoconductor (PC). The visible image consists of fine particles called toner /3-6/, which can be used as a dry powder or diluted with liquid /7-9/. The fist implementation of the process was an analogue copier. The black and white (B/W) laser printer was introduced in the 1970s, and multi-colour laser printing at the end of the 1980s /1/. Since then, the importance of process-toner-paper interaction has been realised, and the rapid development of toners and papers has been driven by increased demands for faster, better and wider applications. At present, electrophotography has consolidated its position in the printing market as the preferred method of short-run digital printing in a variety of commercial applications and office environments /P6/. In terms of speed and quality, the production scale of electrophography has developed rapidly to reach the level of about 200 pages per minute (ppm) of (B/W) and exceeding 100 ppm of colour printing in addressable resolution of 600 dots per inch (dpi). This already corresponds to the performance of low-end offset printing presses. The additional features of digital methods, such as customisation by including variable information and on-demand production of updated contents, have put the electrophotography -as digital method- in the core of nearly every business sector /P4/. The basic steps in the electrophotographic process are photoconductor charging, exposing the latent image to a light source (usually laser or a light emitting diode (LED)), toner charging, development of charged toner into the latent image on the photoconductor surface, transferring the developed image from photoconductor to paper, erasing the remaining charges and cleaning the residual toner, and finally fusing the image to be fixed and penetrated into the paper /1-17/. Figure 1, shows the functional diagram of the electrophotographic printing process, and the grey coloured steps where the paper is involved.

Graphic Arts in Finland 39(2010)1
3
Toner Transfer
During the printing process the toner, printer and paper meet each other for the first time at the transfer step. The developed image on the photoconductor can be transferred to the paper by applying different principles, such as electrostatic forces, adhesive forces, thermal energy, mechanical forces or a combination of different energies /3,4,P2/. Each principle can be implemented by using different technologies and configurations.
The electrostatic transfer method dominates in commercial colour laser and LED printers used in offices, and in a significant part of industrial presses meeting high print quality requirements. This method can be implemented by using different technologies such as a transfer roller, transfer belt, an intermediate transfer drum, transfer corona, and transfer drum (TD). Some of these technologies can be configured so that the toner is transferred to paper in two steps: first, the toner is transferred from the PC to an intermediate element such as a belt or drum, and second from the intermediate element to paper. Both toner transfer steps are achieved by electrostatic force, with or without pressure. If the transfer is done without pressure, it will be through a narrow gap of air, with the toner particles jumping over this gap because of the electrostatic attraction force /17-21/. This type of toner transfer is sometimes called “jumping transfer” referring to the absence of pressure. The air gap exists in all transfer technologies, even in those designed to avoid it. It is resulted from paper roughness, non-uniformity of toner particle shape and size, agglomeration of toner particles, and the differences in pile heights of the image. To avoid any contact with paper during the study of the electrostatic toner transfer mechanism, a printer technology based on jumping transfer was selected to be used in this research.
In all technologies using electrostatic toner transfer, the basic principle is to generate a sufficient electric field across the paper to attract and transfer the charged toner particles of the developed image from the PC to the paper. There are two ways of electric field generation for all electrostatic marking technologies. One is ion emission from a corona charger directly onto the paper or across a paper carrier element such as a belt. The other is to apply a DC voltage (direct
Figure 1 Functional diagram of electrophotographic printing process /3/.

Graphic Arts in Finland 39(2010)1
4
current voltage) via the transfer drum or a transfer roller directly to the paper or across the carrier element /1,5,22-25/.
For colour electrophotography, several toner transfer techniques are used according to the desired printing speed. At low speed, where the time required to print one colour page is the sum of the time to print each of the four colours, the four colours are accumulated either on the photoconductor, or on an intermediate element such as a transfer drum or belt, and then transferred simultaneously to paper /26-29/. In some technologies, the four colours can be applied by a single imaging unit four times, to be accumulated directly on paper, which is usually supported by a large transfer drum /30-32/. This type of marking engine, called multi-pass transfer technology, was selected to be used in this research /32/. For high-speed colour printing, the printer is constructed with four separate imaging units for each colour in a configuration called tandem or single-pass transfer /33/. The time to print one colour is equal to that of four colours.
Electrostatic Toner Transfer Mechanism and Efficiency
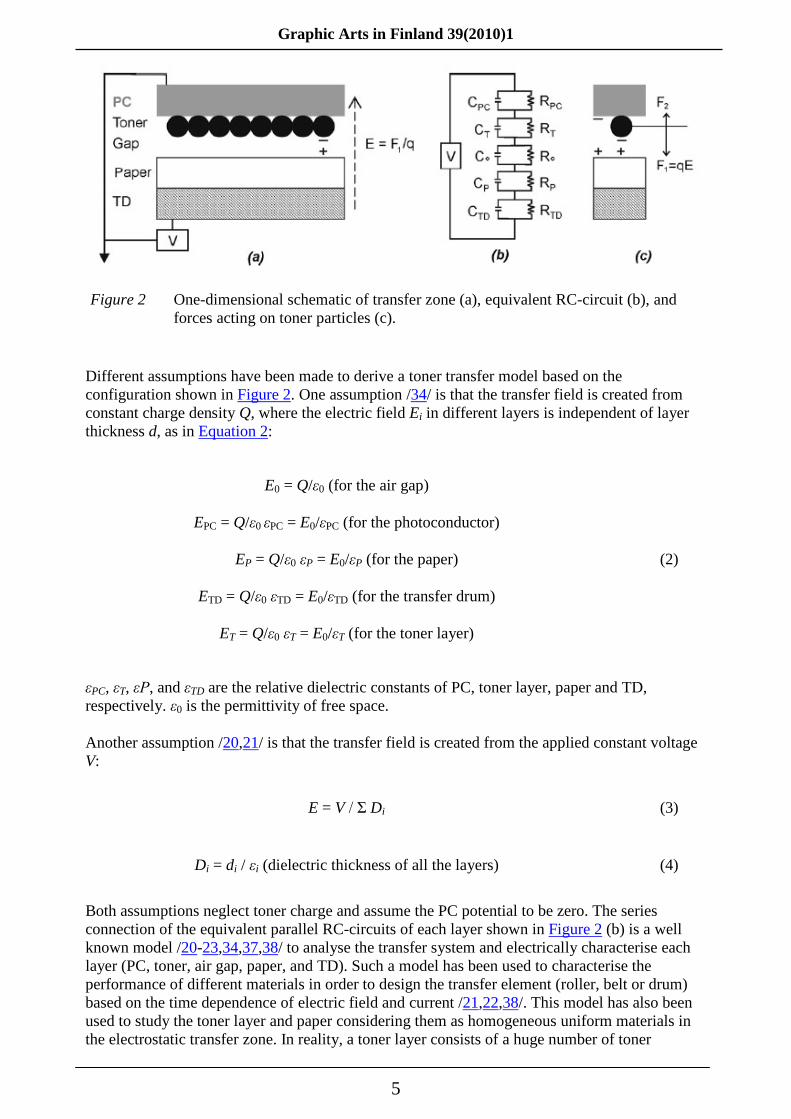
In the transfer step of the selected technology, the paper is clamped and attracted to the transfer drum-TD. As shown in Figure 2 (a), an electrical attraction occurs between the paper and the TD when a sufficient constant transfer voltage V is applied to the TD in a polarity to ensure an opposite charge on the paper surface to that of the toner charge. Part of the transfer voltage is consumed over the resistances of the TD layers, paper and the resistance of the contact regions between the layers of TD and the paper. The part applied to the paper is important for toner transfer and it must be high enough to cause effective polarisation of paper and to accumulate a sufficient charge density σ on the paper surface to allow an electric field E to be created between the paper and charged toner particles as shown in Figure 2 (c). The electrostatic force F1of this field -defined in Figure 2 (c)- will overcome several force components, mainly the adhesion of toner particles on the PC and transfer them to the paper according to Equation 1 /34,35,P2/:
Ft = F1– F2
Ft = qE – [K1(q/D)2 + K2(DE)2 + Fa] (1)
where Ft is the net transfer force acting on the toner, K1 and K2 are constants, q is toner charge, D is toner diameter, (F1 = qE) is total transfer force due to electric field E, (q/D)2 is toner adhesion forces on PC, (DE)2 is dipole forces, and Fa is including all other adhesion and cohesion forces, other Van Der Waals, double layer, chemical, hydrophobic, capillary, coulomb, etc. /34,35/.
The charged toner particles transferred to paper are intended to neutralise the same amount of charges on the paper surface. The amount of charge moving per unit of time will create an electric current I, and if this movement covers the image area, it will be described as electric current density. /4,5,8,5-37/
Graphic Arts in Finland 39(2010)1
5
Different assumptions have been made to derive a toner transfer model based on the configuration shown in Figure 2. One assumption /34/ is that the transfer field is created from constant charge density Q, where the electric field Ei in different layers is independent of layer thickness d, as in Equation 2:
E0 = Q/ε0 (for the air gap)
EPC = Q/ε0 εPC = E0/εPC (for the photoconductor)
EP = Q/ε0 εP = E0/εP (for the paper)
ETD = Q/ε0 εTD = E0/εTD (for the transfer drum)
ET = Q/ε0 εT = E0/εT (for the toner layer)
(2)
εPC, εT, εP, and εTD are the relative dielectric constants of PC, toner layer, paper and TD, respectively. ε0 is the permittivity of free space.
Another assumption /20,21/ is that the transfer field is created from the applied constant voltage V:
E = V / Σ Di (3)
Di = di / εi (dielectric thickness of all the layers) (4)
Both assumptions neglect toner charge and assume the PC potential to be zero. The series connection of the equivalent parallel RC-circuits of each layer shown in Figure 2 (b) is a well known model /20-23,34,37,38/ to analyse the transfer system and electrically characterise each layer (PC, toner, air gap, paper, and TD). Such a model has been used to characterise the performance of different materials in order to design the transfer element (roller, belt or drum) based on the time dependence of electric field and current /21,22,38/. This model has also been used to study the toner layer and paper considering them as homogeneous uniform materials in the electrostatic transfer zone. In reality, a toner layer consists of a huge number of toner
Figure 2 One-dimensional schematic of transfer zone (a), equivalent RC-circuit (b), and forces acting on toner particles (c).

Graphic Arts in Finland 39(2010)1
6
particles of different shapes and sizes. This results in variations in electrical properties. This situation is further complicated by the non-uniform dielectric constant of paper: paper materials and their distribution across the sheet are non-uniform. Therefore, paper always creates a non-uniform electric field /39-42/. This is a real problem since this model cannot express the local toner transfer variation, rather it consider the effect of the paper collectively as a uniform and homogeneous sheet. So, as a part of the configuration shown in Figure 2, this study has considered the paper layer only, to find out the role of different paper grades on toner transfer under different process settings and humidity conditions.
Whatever transfer configuration and assumption is used, the driving component in the toner transfer mechanism is the electric field across the toner layer. This component is determined by the net voltage which is the difference between the applied voltage V, and the voltage drop across the rest of the resistive layers /20,21,34-37/. To increase the net voltage and in turn the electric field of the toner layer for better transfer, the voltage drop across the rest of the layers should be reduced. One of these layers is the paper, and to reduce the voltage drop in paper, the electrical properties of paper, such as surface and volume resistivity, dielectric constant, permittivity, etc. should be controlled /3,4,20,21,37,43/. Some variations in the electrical properties arise from the variations in the basic properties of the paper, and some others are due to the variations in the humidity conditions. Different moisture levels in paper will produce different sets of electrical properties, resulting in varying toner transfer performance.
This is a challenging problem in electrophotography, and there have been many attempts to avoid or minimise the impact of the fluctuations of the electrical properties of paper in the toner transfer zone to ensure high and repeatable print quality. An old and powerful approach is to adjust the transfer voltage according to the ohmic resistivity of paper, in a closed loop control system which adjusts the required transfer voltage to each print job /32,36-43/ or even to every individual paper /44/.
Another approach is to use a web or belt with high and constant value of electrical resistivity, as an element to carry the paper in the transfer step, which will stabilise the electrical properties of the complete transfer system. Another development is the intermediate drum with a flexible and high resistance surface between the PC and paper to ensure the two transfer steps with high image quality and long life of the PC /44-49/. But the approaches of introducing high resistance intermediate and carrier elements are usually associated with high energy consumption.
The electrostatic toner transfer is the step where the toner and paper interact under the effect of the transfer step parameters. Thus, all the variations in paper and toner properties that are influenced by the electrostatic process parameters affect toner transfer. Printer manufacturers usually design the process parameters according to an ideal model in which the paper and toner are considered to be homogeneous, uniform and with stable properties. But in reality, they are not, and their properties are very sensitive to any change in ambient conditions /50,51/.
Toner transfer efficiency is determined as the ratio of the toner amount transferred to the paper to the toner amount developed on the PC. Also, it can be defined by the ratio of the optical image density transferred to the paper, to the optical density of the image developed on the PC /45,46/. The optical density is not always a good indicator of the toner amount: it reaches a saturation level at a certain limit of the toner amount where a halftone image becomes solid. After this limit, any additional amount of toner will not influence the measured image density /P5/. The thickness of the image will only be increased. Accordingly, the transfer efficiency can be given as the ratio of the thickness of the image transferred to the paper to the thickness of the image developed on the PC /36,43,45,P2,P5/. The thickness of the image is in proportion to the number of toner layers and the layer thickness is the diameter of the toner particles. This assumption requires a uniform toner particle shape and size, and for further theoretical analysis, the toner layer in this continuous model has to be considered as a homogeneous slab, which can be split
Graphic Arts in Finland 39(2010)1
7
into two layers at any thickness point based on the transfer voltage applied to the transfer system /47,48,P2/. In reality, some toner particles transfer earlier than others in such a model as an array of toner particles /49/. In this case the distances between toner particles in the air gap should be considered.
Toner Fusing
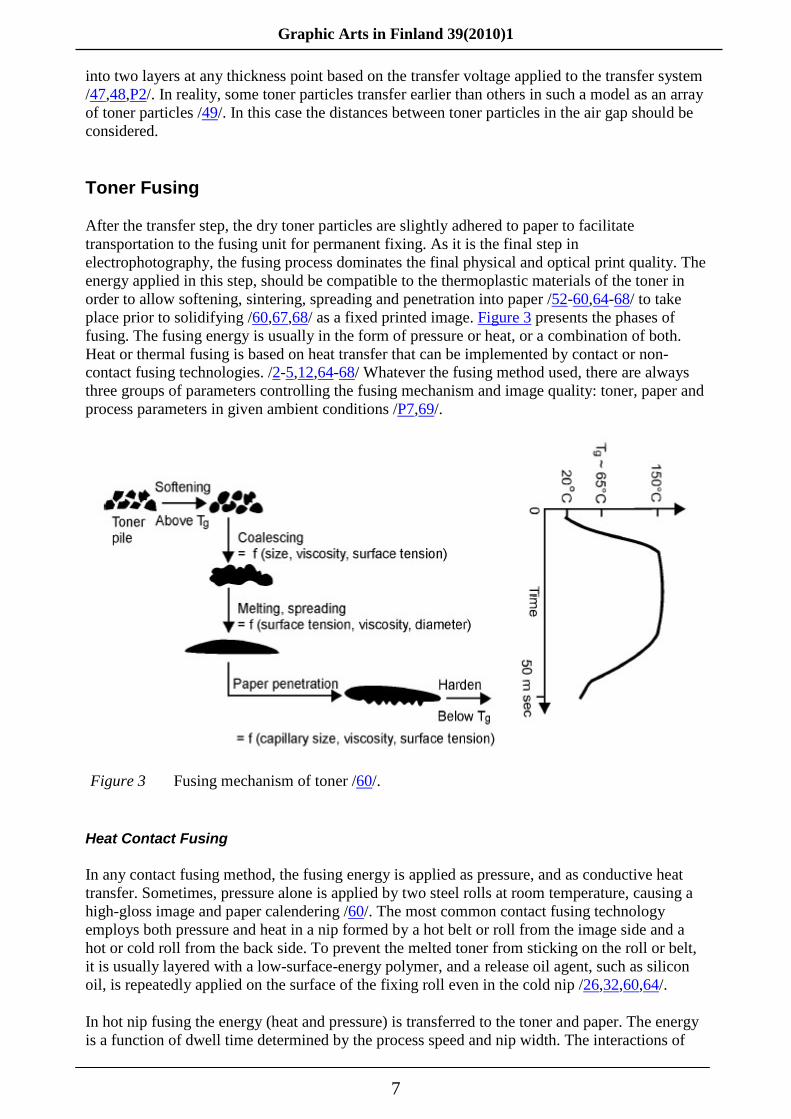
After the transfer step, the dry toner particles are slightly adhered to paper to facilitate transportation to the fusing unit for permanent fixing. As it is the final step in electrophotography, the fusing process dominates the final physical and optical print quality. The energy applied in this step, should be compatible to the thermoplastic materials of the toner in order to allow softening, sintering, spreading and penetration into paper /52-60,64-68/ to take place prior to solidifying /60,67,68/ as a fixed printed image. Figure 3 presents the phases of fusing. The fusing energy is usually in the form of pressure or heat, or a combination of both. Heat or thermal fusing is based on heat transfer that can be implemented by contact or non-contact fusing technologies. /2-5,12,64-68/ Whatever the fusing method used, there are always three groups of parameters controlling the fusing mechanism and image quality: toner, paper and process parameters in given ambient conditions /P7,69/.
Heat Contact Fusing
In any contact fusing method, the fusing energy is applied as pressure, and as conductive heat transfer. Sometimes, pressure alone is applied by two steel rolls at room temperature, causing a high-gloss image and paper calendering /60/. The most common contact fusing technology employs both pressure and heat in a nip formed by a hot belt or roll from the image side and a hot or cold roll from the back side. To prevent the melted toner from sticking on the roll or belt, it is usually layered with a low-surface-energy polymer, and a release oil agent, such as silicon oil, is repeatedly applied on the surface of the fixing roll even in the cold nip /26,32,60,64/.
In hot nip fusing the energy (heat and pressure) is transferred to the toner and paper. The energy is a function of dwell time determined by the process speed and nip width. The interactions of
Figure 3 Fusing mechanism of toner /60/.
Graphic Arts in Finland 39(2010)1
8
fusing process parameters with paper and toner properties influence image fixing quality. Fixing quality is primarily controlled by the rheological characteristics of the toner /68,69/ that are designed according to the fusing process parameters. Therefore, toner properties are sometimes considered as part of process parameters. Paper properties also play an important role in governing the process of toner fusing and the quality of fixed image, especially in contact fusing. A significant amount of heating energy absorbed by the mass of paper, regardless of the image size and toner amount, needs to be fixed on this paper. If the grammage of paper is high, then at a given moisture content there is a larger amount of water, so it will absorb a higher amount of heat compared to low-grammage paper, leaving the rest to the toner, which may not be enough to complete all the fusing phases to produce acceptable fixing quality. In this argument the competition is between the amount and the thermal conductivities of the material compositions of paper and toner. In another words, which material is faster in picking up the heating energy available for the duration of the nip dwell time /P8/. Where is the limitation of the paper grade that allows the toner to get enough heat to reach melting point, and lowering the viscosity, while it is still under the nip to benefit from the pressure for better toner penetration, adhesion, and image strength. Coating colour is an additional component involved in the previous argument, and also causing the change in paper porosity structure and permeability to influence the toner spreading, penetration and adhesion /69-71/. The surface sizing chemical of uncoated paper and the roughness of the paper are also known to improve the toner adhesion /69,72,73/. Therefore, the toner fusing mechanism in hot contact fusing should be discussed and analysed together with the thermal behaviour of paper in a defined fusing system and ambient atmosphere using a simple dynamic heat transfer model /P8/.
Within the fusing range determined by cold-set and hot-set offset, toner, paper and fusing parameters interact differently depending on how far or near they are to the ends of the fusing limitations /P7/. The toner on the peaks of the paper roughness profile gets very glossy because of the direct effect of heat and pressure (nip calendering). If the paper is very rough, the toner in the valleys of the surface does not get into good contact with the fusing roll, so the area remains matte due to the effect of heat only. The calendering effect is proportional to the nip pressure and paper thickness, so reduced nip pressure results in reduced gloss and in optical density variations. The proportion of the reduced pressure energy should be compensated by increasing either the dwell time (or nip width) or heating energy to achieve the same level of physical fusing and to improve optical quality /3,4,74/. The nip width is proportional to the thickness and elastic modulus of the elastomer layer /74,75/, so when the thickness of a softer layer is increased, the nip pressure is reduced and nip width is increased. By adjusting the fusing parameters and using a pre-determined variety of paper grades, different levels of image quality can be obtained due to different interactions and mechanisms of energy contribution to toner and paper /P6,P7/.
Flash Fusing
Flash fusing is one of the non-contact fusing methods available for toner image fixing. In this process, high uniform-intensity radiation energy supplied by a high-powered Xenon lamp with short pulse width is applied to soften the toner and to allow it to melt and flow into the paper, so it will be fixed permanently. The flash fusing process can be implemented alone as a main fusing unit or in combination with any other fusing technique, depending on the speed, the desired quality and application. At an early stage of implementation in 1978, it was combined with cold pressure fixing as a post-fusing method in high-speed black and white prints, to remove the gloss and improve the fixing quality /3-5,76-81/. Recently, it has been used alone to enable high-speed, high-quality digital colour printing of about 400 ppm /82/ to compete with newspaper printing in the “on demand” printing market /82,83/.
The mechanism of Near-Infra-Red (NIR) flash fusing is designed to apply the fusing energy selectively to the toner only and without any contact with the toner and the paper. Theoretically,

Graphic Arts in Finland 39(2010)1
9
the black toner of about 2-2.5% carbon black /58/ absorbs almost all the wavelengths, including the NIR radiation, whereas paper reflects this wavelength range. Other colour toners have negligible absorption of NIR, so suitable proportions of infrared absorbers and heat-sensitive materials have to be added to each colour to allow all the colour toners to perform similarly to that of black toner fusing. Colour darkness is a side effect due to optical non-transparency of NIR and heat additives /82,84/. Since flashing and other non-contact fusing methods depend mostly on the toner’s sensitivity to the fusing energy, and the availability of this energy, they can be used in a wide range of applications, regardless of the paper grade or other media /P3,78-83/.
If the fusing energy is high enough, either in the form of heat, pressure, or both, the toner fusing mechanism will follow the same phases as depicted in Figure 3: sintering, spreading and penetration. First, the toner particles become spherical prior to cohering to each other. Then the toner spreads and penetrates into paper as much as its weight and viscosity, and the smoothness of the paper surface allow spreading and penetration. In contact fusing the pressure helps the toner to flow while deforming it. In this phase the paper surface starts to interact with the pressure, generating a competing situation between toner spreading and penetration. The toner spreads more on a smooth surface, and penetrates deeper into a rough one /67-69,85-87/. In flash fusing, there is no pressure to serve this role in the fusing mechanism, so the toner should be highly sophisticated and allow adequate fusing with the available flashing energy. As a result, a toner with a small and narrow particle size distribution and with a uniform spherical shape will require less energy for fusing /33,78/. The chemical composition could also be changed to increase toner fluidity by adding a low-molecular material such as wax /33/. The paper could be pre-heated before the actual flash fusing to reflect as much radiation as possible /67,69,88/, and to reach faster the thermal equilibrium at the toner-paper interface /67,89/. The temperature of this thermal equilibrium is considered to be the fusing temperature /74/. More than one flashing lamp with an efficient reflection system can be used to increase the fusing efficiency and to overcome the shortage of time in high-speed printing /90/.
The paper surface can be treated with polymer particles interacting with toner to increase the image adhesion. However, any attempt to customise the paper is ineffective compared to optimisation of the process parameters and toner properties. The suitability of a given paper grade for different printing processes and applications is dependent on the papermaking process, economic scale and the specific properties of the paper in question. The advantages of flash fusing as a non-contact method are due to the absence of pressure and image deformation. High image sharpness and very small dot gain lead to minimising the edge noise and high detail rendering of the image /P6,91/. The flash fusing method supports high-speed printing of various paper grades with no jams and wrinkles. Finally, it is easy to maintain and operate with zero stand-by energy and heat-up time /82/.
EXPERIMENTAL
Within the framework of this research, several experimental approaches were used to examine the role of paper and the interaction between toner, paper, and the parameters of the toner transfer and fusing processes. In all experiments, the relevant toner and paper properties were determined, the transfer and fusing process parameters were controlled, adjusted and monitored as input variables or output data. This was achieved by constructing and installing special devices for the pre-selected printers that would fulfil the experimental approaches. Also, some modifications were made in the printers used in the experiments in order to produce different input variables, especially in the fusing units. The details of these installations and modifications will be discussed with the experimental arrangement of each set of data. The results were evaluated through direct optical measurements of the printed images such as density and gloss and their variation, and indirectly where the toner adhesion rates were calculated. Microscopic

Graphic Arts in Finland 39(2010)1
10
tools were used to characterise the image sharpness, edge noise, dot size and print structure resulting from different input variables or technologies. Additional results were obtained through online acquisitions and monitoring of output data of toner transfer and fusing, such as the transfer current, temperature and moisture content. All the experiments of this research were carried out under controlled humidity and temperature conditions according to TAPPI standards. The test images were designed independently according to each experimental approach to predict and measure the change in outputs.
RESULTS AND DISCUSSION
Toner Transfer
Monitoring the transfer voltage in a real printing process was the first step to evaluate the experimental installation of transfer voltage adjustment, which is important to characterise the transfer mechanism of several marking technologies. Successful adjustment and control of the transfer voltage and measuring the transfer current corresponding to each adjusted value has been the core for building up many experiments in this study. The experimental settings allowed examining the efficiency of toner transfer, to evaluate the influence of different paper grades and humidity conditions on toner transfer, and also to characterise the image properties.
Role of Image Properties in Toner Transfer Step
In this experiment, the test image printed on an A4 sheet consisted of two parallel yellow strips of equal area but different halftone percentages; 25% grey-scale percentage and 100% solid image. The high-quality transfer mode of five revolutions was selected with the designed operating value of transfer voltage relevant to each revolution. Figure 4 shows the current data of the toner transfer process at the 3rd and 4th revolutions of the transfer drum during printing of the test image shown in the lower right corner of the figure. At the 3rd revolution, where the cyan toner is transferred, the straight horizontal line represents the current data during the passage of the A4 sheet in the length direction, and there is no evidence of cyan toner transfer, because the image is designed to be yellow. So the current here results from the transfer voltage applied at this revolution and the resistivity of the empty A4 sheet.

Graphic Arts in Finland 39(2010)1
11
At the 4th revolution, where the yellow developed image is transferred from the photoconductor to paper, the changes in current data due to the transfer of yellow toner is clearly indicated to show the difference in toner amount transferred to a similar image area with a different halftone percentage (25% and solid). Magnifying and studying the current data of the printed image will provide a lot of information about the transfer process. This is true especially of the x-axis, which is the axis of the printing process direction. The current data is collected from the revolutions of the photoconductor as a function of time, at two levels of frequency; 10 and 50 Hz. So, the current in this experiment shows which colour is printed, the toner amount at each halftone, and image location on the A4 sheet. In this experiment, the transfer current was used to characterise the image.
Role of Paper Properties in Toner Transfer
When the paper reaches the transfer zone between the photoconductor and the transfer drum, the configuration is as presented in Figure 2, simply a “parallel-plate capacitor” filled by paper, toner layer, and an air gap. Some engines are designed to eliminate the air gap, but in practice the air gap cannot be avoided due to the variations in toner particle size, different toner colours (layers) and halftone structure of the image, and the thickness and unevenness of the surface profile of the paper. According to equations govern the transfer zone discussed earlier, the dielectric thicknesses of these layers (toner, air and paper) control the electric field to transfer the charged toner particles from PC to the TD. The dielectric thickness and other electrical properties of the paper are functions of its bulk properties, which are mostly dominated by the grammage and the thickness of paper.
Figure 4 Transfer current data of printing yellow image.

Graphic Arts in Finland 39(2010)1
12
Figure 5 shows the transfer current recorded for the 3rd and 4th revolutions to transfer a full-coverage A4-page yellow image to four different paper grammages of nearly the same density. At the 3rd revolution with no toner transferred, the higher grammage, the higher the transfer current obtained. This means in given transfer voltage and humidity conditions, that paper with a higher grammage creates a higher surface charge density, proportional to its polarisation effects /20,100,P2,P5/ and is therefore ready to pick up a greater amount of toner at the next 4th revolution.
For each paper, the differences between the current level at 3rd revolution denoted by A and the current level at the 4th revolution denoted by B is the current due to toner transfer. In Figure 6, they are plotted against the grammages to illustrate the relationship between toner transfer current and paper weight. Papers of the same grammage do not necessarily display the same transfer behaviour. The thickness or density, materials composition, surface treatment, and fibre type and orientation all have a strong effect on the electrical properties of paper. The relationship between the grammage and the transfer current is influenced by the speed of the printing process, the paper grammage range used in electrophotography, and the applied transfer voltage that should not cause dielectric breakdown within the possible range of relative humidity of 20%-80%.
Figure 5 Transfer current of printing four paper grades.
Figure 6 Current due toner transfer to different paper weights.
Graphic Arts in Finland 39(2010)1
13
Role of Ambient Conditions in Toner Transfer
The electrical properties of paper are related to its bulk also called basic properties. These relations are governed mostly by the moisture content (m.c.%) of the paper, which is quite sensitive to any change in ambient conditions; the relative humidity (RH%) and temperature. Toner and printing process parameters are also subject to ambient effects, but under strict control as they are parts of the machine design, whereas the paper is the end user’s choice. In these experiments, the transfer current was measured from papers in different humidity conditions. Some of the electrical properties of these papers were defined in the same conditions so as to study the influence of ambient conditions on electrostatic toner transfer.
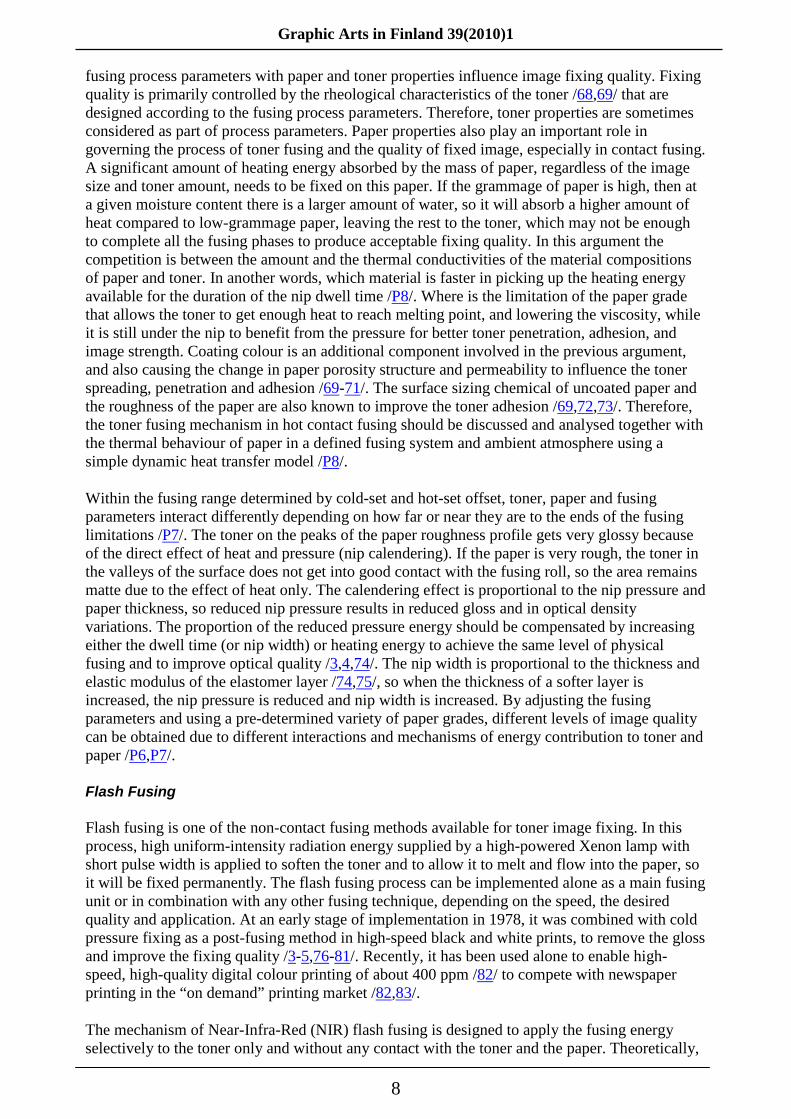
The transfer current and the moisture content measured from two paper grades at four humidity levels are all illustrated in Figure 7. The figure presents the relationship between the transfer current and the moisture content. It shows how the moisture content of paper influences the transfer current during toner transfer. An increase in the RH% of ambient air results in an increase in the m.c.% of the paper, in turn decreasing the volume and surface resistivity of the paper. The sensitivity of the transfer current to moisture changes is remarkably high, but slightly better, or less fluctuating for 100 g/m2 coated paper compared to the electrostatic performance of 80 g/m2 uncoated paper within the experimental range of relative humidity. This is due to the higher resistivity of this grade. The coating colour thickness and its compressibility on both sides of the base paper have an effect on the grammage, density, pore structure, homogeneity and the surface profile, which all improve the resistivity of the paper.
Toner Transfer Efficiency
Toner transfer efficiency was examined by means of the transfer current which is a new tool introduced in this study. The results were correlated to the conventional efficiency evaluation tools such as image density and toner amount, as well as to the theoretical model of toner transfer. Figure 8 shows the toner amount transferred to two paper grades as a function of transfer voltage, under the same ambient conditions. The test was repeated twice for 80 g/cm2 uncoated paper to show that the measurement is highly reproducible. The toner amount
Figure 7 Transfer current and m.c.% for two paper grades in different RH%.

Graphic Arts in Finland 39(2010)1
14
transferred to 100 g/m2 coated paper is more than the amount transferred to 80 g/m2 uncoated paper. The higher-grammage paper obtained a higher surface charge density, which in turn can transfer more toner. So, the paper grade has a considerable influence on the efficiency of toner transfer, due to its electrical properties such as volume and surface resistivity. It is also clear that the experimental transfer curves are similar to the behaviour of the ideal transfer profile /45,54,P2,P5/.
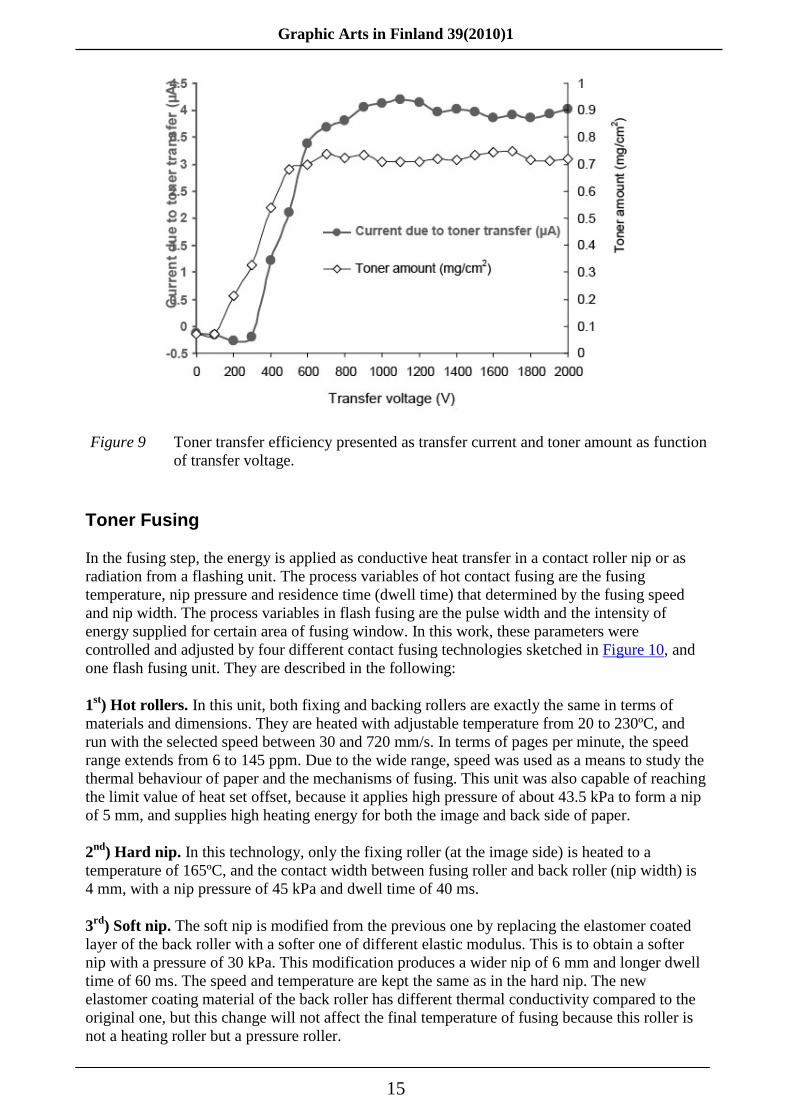
Figure 9 shows that the current due to toner transfer and the amount of toner transferred to 80 g/cm2 uncoated paper are directly related to each other and functions of the transfer voltage. The current curve also behaves similarly to the ideal transfer profile. It indicates the surface charge neutralised by the transferred toner particles. Therefore, the current curve also expresses the transfer efficiency. It was found that the optical image density measured before and after fusing the image, plotted as a function of the transfer voltage, presenting the transfer efficiency similarly to the transfer current and toner amount curves in the Figures 8 and 9. This conventional method provides additional support to the transfer current to be used as a tool for expressing the toner transfer efficiency and characterising different transfer situations.
Figure 8 Toner amount transferred to two different paper grades under different transfer voltages. The ideal transfer profile is also shown.
Graphic Arts in Finland 39(2010)1
15
Toner Fusing
In the fusing step, the energy is applied as conductive heat transfer in a contact roller nip or as radiation from a flashing unit. The process variables of hot contact fusing are the fusing temperature, nip pressure and residence time (dwell time) that determined by the fusing speed and nip width. The process variables in flash fusing are the pulse width and the intensity of energy supplied for certain area of fusing window. In this work, these parameters were controlled and adjusted by four different contact fusing technologies sketched in Figure 10, and one flash fusing unit. They are described in the following:
1st) Hot rollers. In this unit, both fixing and backing rollers are exactly the same in terms of materials and dimensions. They are heated with adjustable temperature from 20 to 230ºC, and run with the selected speed between 30 and 720 mm/s. In terms of pages per minute, the speed range extends from 6 to 145 ppm. Due to the wide range, speed was used as a means to study the thermal behaviour of paper and the mechanisms of fusing. This unit was also capable of reaching the limit value of heat set offset, because it applies high pressure of about 43.5 kPa to form a nip of 5 mm, and supplies high heating energy for both the image and back side of paper.
2nd) Hard nip. In this technology, only the fixing roller (at the image side) is heated to a temperature of 165ºC, and the contact width between fusing roller and back roller (nip width) is 4 mm, with a nip pressure of 45 kPa and dwell time of 40 ms.
3rd) Soft nip. The soft nip is modified from the previous one by replacing the elastomer coated layer of the back roller with a softer one of different elastic modulus. This is to obtain a softer nip with a pressure of 30 kPa. This modification produces a wider nip of 6 mm and longer dwell time of 60 ms. The speed and temperature are kept the same as in the hard nip. The new elastomer coating material of the back roller has different thermal conductivity compared to the original one, but this change will not affect the final temperature of fusing because this roller is not a heating roller but a pressure roller.
Figure 9 Toner transfer efficiency presented as transfer current and toner amount as function of transfer voltage.
Graphic Arts in Finland 39(2010)1
16
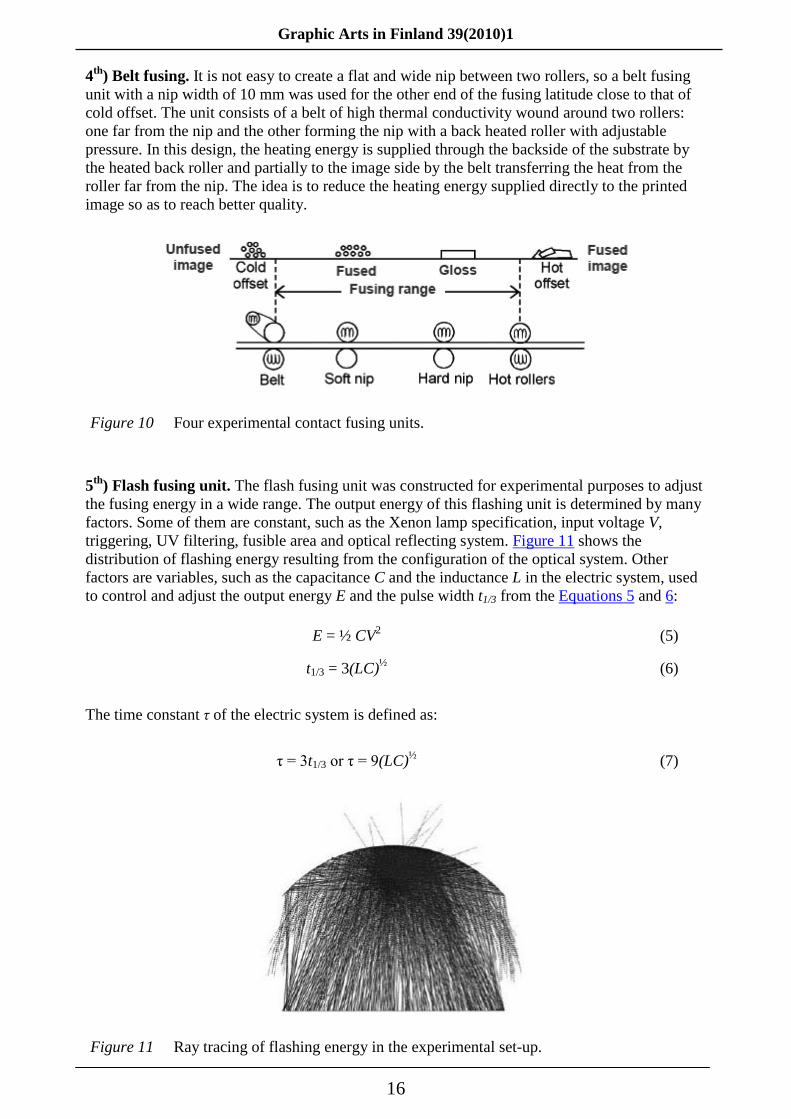
4th) Belt fusing. It is not easy to create a flat and wide nip between two rollers, so a belt fusing unit with a nip width of 10 mm was used for the other end of the fusing latitude close to that of cold offset. The unit consists of a belt of high thermal conductivity wound around two rollers: one far from the nip and the other forming the nip with a back heated roller with adjustable pressure. In this design, the heating energy is supplied through the backside of the substrate by the heated back roller and partially to the image side by the belt transferring the heat from the roller far from the nip. The idea is to reduce the heating energy supplied directly to the printed image so as to reach better quality.
5th) Flash fusing unit. The flash fusing unit was constructed for experimental purposes to adjust the fusing energy in a wide range. The output energy of this flashing unit is determined by many factors. Some of them are constant, such as the Xenon lamp specification, input voltage V, triggering, UV filtering, fusible area and optical reflecting system. Figure 11 shows the distribution of flashing energy resulting from the configuration of the optical system. Other factors are variables, such as the capacitance C and the inductance L in the electric system, used to control and adjust the output energy E and the pulse width t1/3 from the Equations 5 and 6:
E = ½ CV2 (5) t1/3 = 3(LC)½ (6)
The time constant τ of the electric system is defined as:
τ = 3t1/3 or τ = 9(LC)½ (7)
Figure 10 Four experimental contact fusing units.
Figure 11 Ray tracing of flashing energy in the experimental set-up.

Graphic Arts in Finland 39(2010)1
17
In these technologies, the latitude of the fusing parameters is controlled according to the pre-study experimental fusing results, by heat and cold offset, and printed image quality. So, the range of process variables is flexible enough to allow the degree of image fusing to vary between the limits of cold and hot offset. In addition to the process parameters, the image structure, toner, paper and the ambient environment are the factors which influence the print quality. With the help of the five experimental fusing machines, all these factors can be used as input variables to study the effect of single variables or combinations of many variables on image quality and fusing strength. Data obtained over a wide range of conditions supports an in-depth study of the thermal behaviour of paper and development of a model of fusing.
Role of Fusing Configurations
Preliminary experiments suggested that the gloss variation responds far more sensitively to adjustments of fusing variables than optical density. Consequently, it was of prime interest to use it as a criterion for examining the performance and roles of the fusing units for the quality of image fixing within the fusing range, and for determining the limitations of cold and hot offset. Gloss variation was measured using an experimental gloss analyser at the 20º incident-reflectance angles for a minimum image area of 44 mm × 46 mm. The measurement was based on the concept of band-pass filtering of image. Three bands were used. The coefficient of variation in each range can be used as a measure for the strength of gloss variation. The scale of gloss variation, which was used in Figure 13 is a measure of the size of unevenness and it is obtained by dividing the coefficient of variation from the band >5 mm by the coefficient of variation from the band <1 mm [(>5 mm) / (<1 mm)]. The scale is lowest for fine-grained and highest for coarse-grained structures. Based on tests with four different sets of fusing parameters, within acceptable results for the physical fusing window, each of the four fusing units was found to produce different density and gloss. According to the density measurements, different grey scale reproductions were produced from the same image at a certain grey scale %. In Figure 12, the higher level of densities obtained by hot rollers at each grey scale is due to heating energy being supplied from two opposite directions by both fixing and back rollers, which causes fast melting of toner and at the same time wide spreading under high pressure. As a result, image enhancement from a good level of coverage by high dot gain was obtained. From the black solid print, Figure 13 shows that the gloss variation of the image fused by the hot rollers is the highest. The gloss variation is an indication of print surface unevenness. The rougher the print surface, the higher the gloss variation. Reducing both energies, the heat and the pressure, and instead increasing the nip width as in belt fusing, less optical density is obtained in all grey scales, indicating less dot gain, which in turn means high accuracy (grey scale image reproduction), and less gloss variation from a smooth print surface. In belt fusing the optical image quality is improved.
Figure 12 Grey scale densities of black prints on 100 g/m2 coated paper.
Graphic Arts in Finland 39(2010)1
18
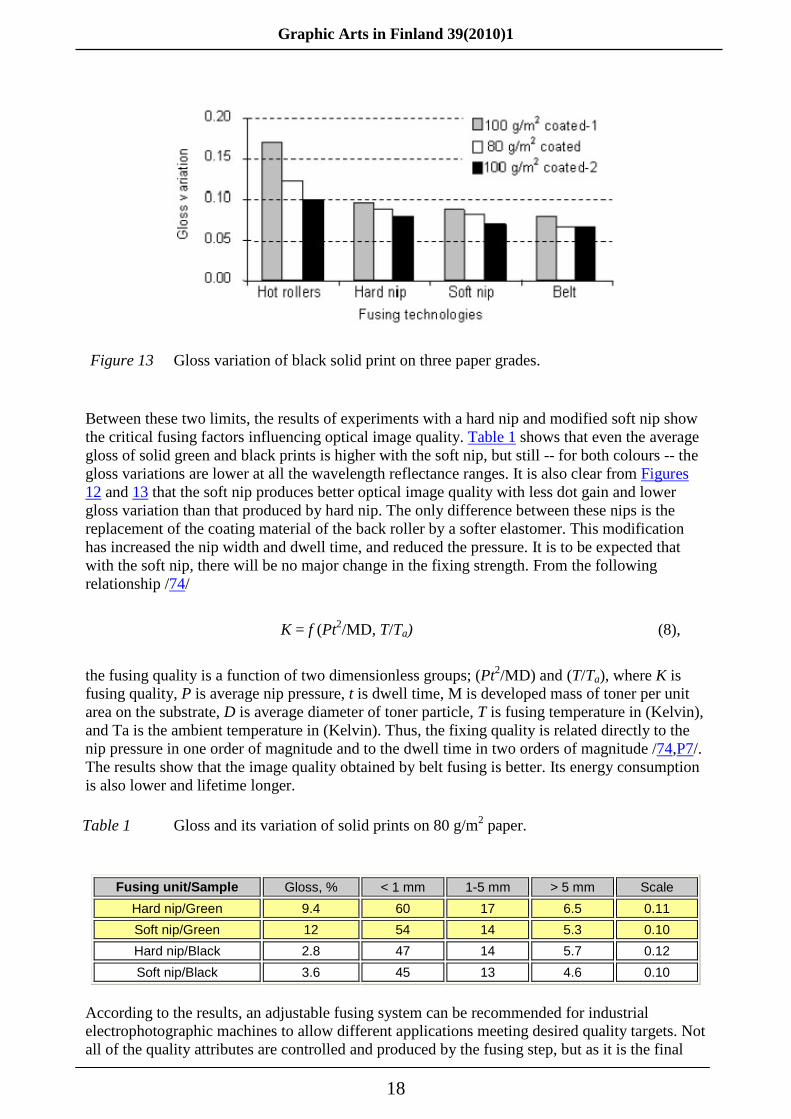
Between these two limits, the results of experiments with a hard nip and modified soft nip show the critical fusing factors influencing optical image quality. Table 1 shows that even the average gloss of solid green and black prints is higher with the soft nip, but still -- for both colours -- the gloss variations are lower at all the wavelength reflectance ranges. It is also clear from Figures 12 and 13 that the soft nip produces better optical image quality with less dot gain and lower gloss variation than that produced by hard nip. The only difference between these nips is the replacement of the coating material of the back roller by a softer elastomer. This modification has increased the nip width and dwell time, and reduced the pressure. It is to be expected that with the soft nip, there will be no major change in the fixing strength. From the following relationship /74/
K = f (Pt2/MD, T/Ta) (8),
the fusing quality is a function of two dimensionless groups; (Pt2/MD) and (T/Ta), where K is fusing quality, P is average nip pressure, t is dwell time, M is developed mass of toner per unit area on the substrate, D is average diameter of toner particle, T is fusing temperature in (Kelvin), and Ta is the ambient temperature in (Kelvin). Thus, the fixing quality is related directly to the nip pressure in one order of magnitude and to the dwell time in two orders of magnitude /74,P7/. The results show that the image quality obtained by belt fusing is better. Its energy consumption is also lower and lifetime longer.
Fusing unit/Sample Gloss, % < 1 mm 1-5 mm > 5 mm Scale Hard nip/Green 9.4 60 17 6.5 0.11 Soft nip/Green 12 54 14 5.3 0.10 Hard nip/Black 2.8 47 14 5.7 0.12 Soft nip/Black 3.6 45 13 4.6 0.10
According to the results, an adjustable fusing system can be recommended for industrial electrophotographic machines to allow different applications meeting desired quality targets. Not all of the quality attributes are controlled and produced by the fusing step, but as it is the final
Figure 13 Gloss variation of black solid print on three paper grades.
Table 1 Gloss and its variation of solid prints on 80 g/m2 paper.

Graphic Arts in Finland 39(2010)1
19
stage in electrophotographic process, it has the final and definitely a crucial effect on the print quality achieved. Some of the fusing parameters examined in this study that have a clear influence on optical image quality could be adjusted within an acceptable fusing range. To ensure high performance, these parameters could be adjusted automatically according to the density and gloss variation measured from the first print as functions of different substrates and image coverage.
Role of Paper in Flash Fusing
In flash fusing, the colour of the paper is important. White papers reflect the wavelengths in the visible and near infra-red (NIR) range. (98%) Most of flashing energy is absorbed by black toner particles, in a mechanism similar to that of Black-Body absorption. The NIR radiation spectra illustrated in Figure 14 were obtained by the diffuse reflectance measurement method. The figure presents the NIR radiation spectra of “normal white” coloured copy paper and, black and yellow toners. The reflectance spectrum of the paper is significantly higher than that of the black toner. The radiation energy is mostly absorbed by the black toner as the figure shows. Different white copy paper grades have nearly the same spectra of NIR radiation on both sides. This is also true for different irregular ground and spherical chemical black toners. The colour of any material is the dominating factor to determine the absorbed radiation in this range. Figure 14 also shows that a yellow toner reflects almost all the radiation in the wanted range. Magenta and cyan toners produce nearly identical NIR radiation spectra. These results indicate that the thermal effect of paper is neglected in flash fusing. However, the surface treatment and roughness of paper are important in toner adhesion and for the appearance of the image.
Flash fusing in colour electrophotography is possible by adding the same proportion of NIR absorbing additives to the three colour toners. High heat sensitivity of NIR additives is required in flash fusing to ensure fast thermal transfer through toner layers to the substrate surface /83/. The achromatic nature of these additives will produce a high darkness level of the coloured image /84/. To avoid this, one solution would be to add as small a portion as possible and increase the flashing energy at the same time.
Figure 14 NIR radiation spectrum of 100 g/m2 paper, and black and yellow toners.
Graphic Arts in Finland 39(2010)1
20
Fusing Mechanism
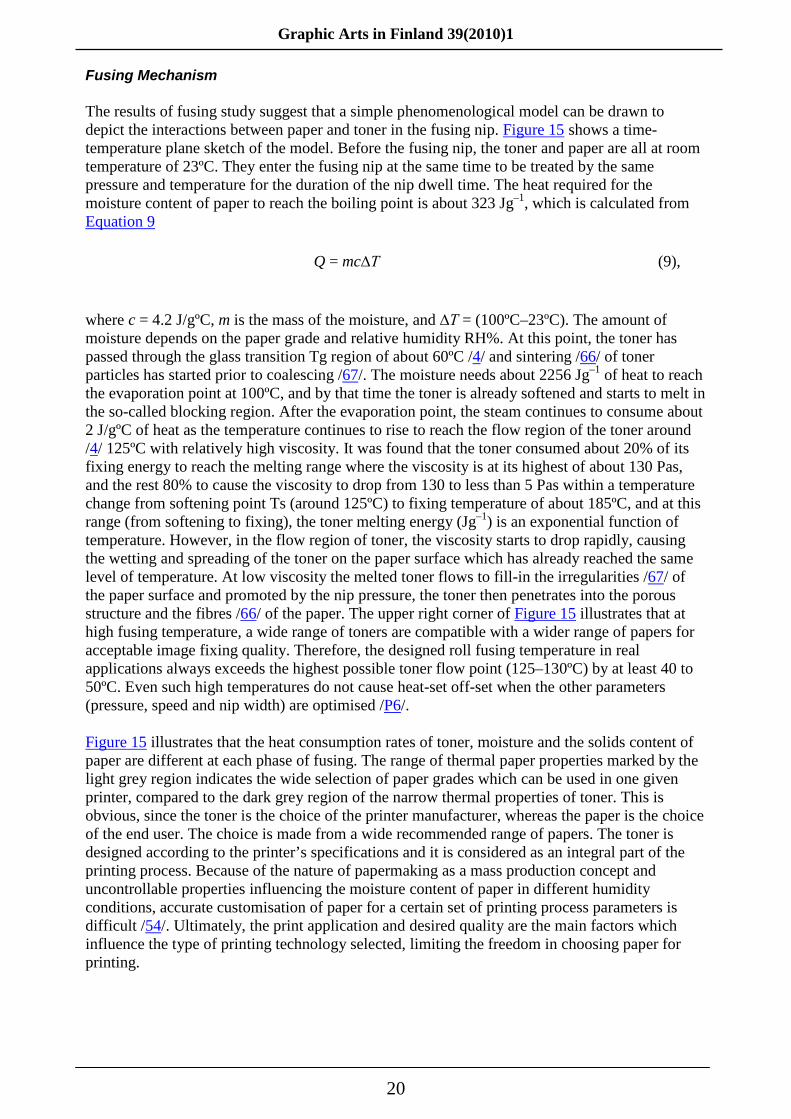
The results of fusing study suggest that a simple phenomenological model can be drawn to depict the interactions between paper and toner in the fusing nip. Figure 15 shows a time-temperature plane sketch of the model. Before the fusing nip, the toner and paper are all at room temperature of 23ºC. They enter the fusing nip at the same time to be treated by the same pressure and temperature for the duration of the nip dwell time. The heat required for the moisture content of paper to reach the boiling point is about 323 Jg–1, which is calculated from Equation 9
where c = 4.2 J/gºC, m is the mass of the moisture, and ∆T = (100ºC–23ºC). The amount of moisture depends on the paper grade and relative humidity RH%. At this point, the toner has passed through the glass transition Tg region of about 60ºC /4/ and sintering /66/ of toner particles has started prior to coalescing /67/. The moisture needs about 2256 Jg–1 of heat to reach the evaporation point at 100ºC, and by that time the toner is already softened and starts to melt in the so-called blocking region. After the evaporation point, the steam continues to consume about 2 J/gºC of heat as the temperature continues to rise to reach the flow region of the toner around /4/ 125ºC with relatively high viscosity. It was found that the toner consumed about 20% of its fixing energy to reach the melting range where the viscosity is at its highest of about 130 Pas, and the rest 80% to cause the viscosity to drop from 130 to less than 5 Pas within a temperature change from softening point Ts (around 125ºC) to fixing temperature of about 185ºC, and at this range (from softening to fixing), the toner melting energy (Jg–1) is an exponential function of temperature. However, in the flow region of toner, the viscosity starts to drop rapidly, causing the wetting and spreading of the toner on the paper surface which has already reached the same level of temperature. At low viscosity the melted toner flows to fill-in the irregularities /67/ of the paper surface and promoted by the nip pressure, the toner then penetrates into the porous structure and the fibres /66/ of the paper. The upper right corner of Figure 15 illustrates that at high fusing temperature, a wide range of toners are compatible with a wider range of papers for acceptable image fixing quality. Therefore, the designed roll fusing temperature in real applications always exceeds the highest possible toner flow point (125–130ºC) by at least 40 to 50ºC. Even such high temperatures do not cause heat-set off-set when the other parameters (pressure, speed and nip width) are optimised /P6/.
Figure 15 illustrates that the heat consumption rates of toner, moisture and the solids content of paper are different at each phase of fusing. The range of thermal paper properties marked by the light grey region indicates the wide selection of paper grades which can be used in one given printer, compared to the dark grey region of the narrow thermal properties of toner. This is obvious, since the toner is the choice of the printer manufacturer, whereas the paper is the choice of the end user. The choice is made from a wide recommended range of papers. The toner is designed according to the printer’s specifications and it is considered as an integral part of the printing process. Because of the nature of papermaking as a mass production concept and uncontrollable properties influencing the moisture content of paper in different humidity conditions, accurate customisation of paper for a certain set of printing process parameters is difficult /54/. Ultimately, the print application and desired quality are the main factors which influence the type of printing technology selected, limiting the freedom in choosing paper for printing.
Q = mc∆T (9),

Graphic Arts in Finland 39(2010)1
21
Combined Effects of Toner Transfer and Fusing Processes
Detail rendering is one of the traditional measures used in evaluation of printed image quality. This tool was used to characterise the current level of detail reproduction in electrophotography, and to explore the role of different papers and technological choices in determining the appearance of printed images. It was also used to gain a better understanding of the relation between image quality and the specifications and features of each process step in different machines, especially in toner transfer and fusing steps where the paper is involved.
A microdensitometer was used to measure the optical density profiles of line bar patterns printed by eight different printers. A variety of paper grades were examined. The dynamic range, contrast transfer function (CTF), and signal-to-noise ratio (SNR) were calculated from the maximum average density of the printed area and minimum average density of the non-printed area /P6/. The smallest reproducible pixel size was also defined using the frequency at the half of the CTF curve. Microscopic image and software analysis tools were used to determine the edge noise, raggedness and sharpness of lines. Some of these results are discussed but all are published in /P6/.
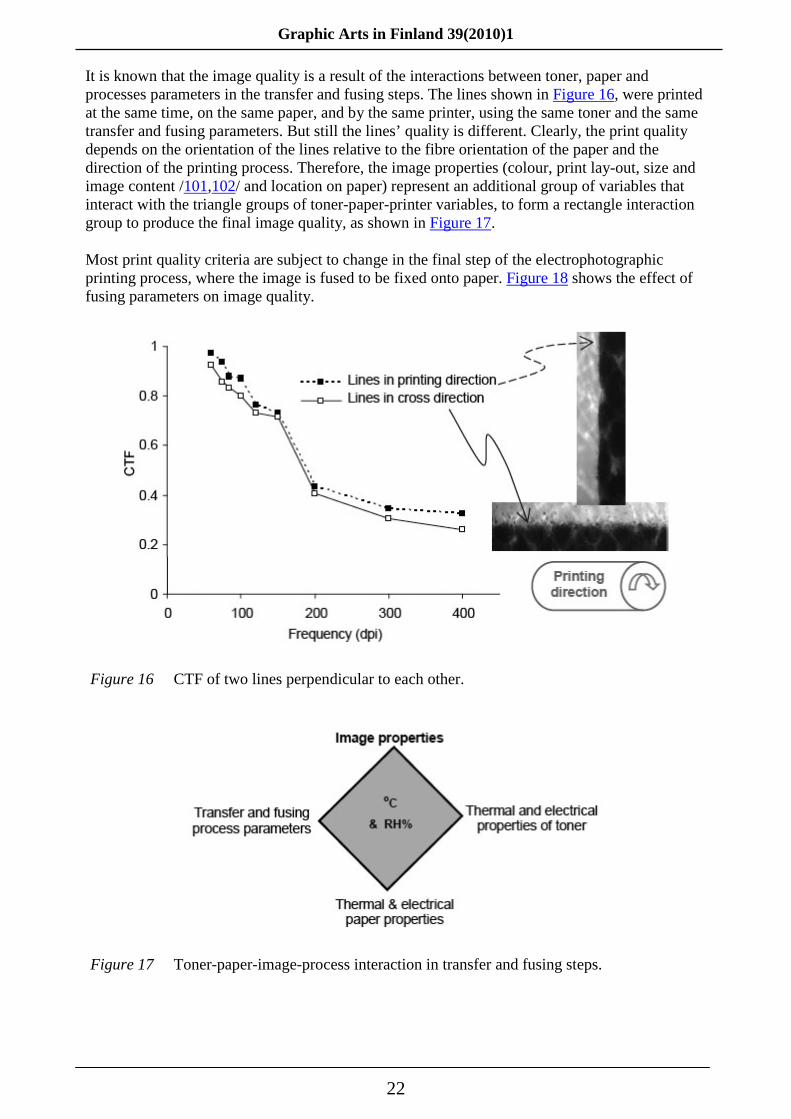
A printed line in the direction of the axis of the PC cylinder (in cross direction relative to the printing direction) requires less time to be exposed, developed, transferred and fused, than a line printed in the same direction as the printing process, which is printed in a mechanism determined by the circumference of the PC and its number of rotations. The line printed in cross direction allows avoiding the variation of several parameters along the printing process. This appears to be true at least in the exposure and development steps, but definitely not in the transfer and fusing steps where other factors such as pre- and post-transfer, and the flow directions of melt toner under the hot deformation of the fusing nip influence the detail rendering in opposite direction more strongly than the speed. The difference in CTF of two perpendicular lines printed on 80 g/m2 uncoated paper is shown in Figure 16.
Figure 15 Phenomenological model of fusing.
Graphic Arts in Finland 39(2010)1
22
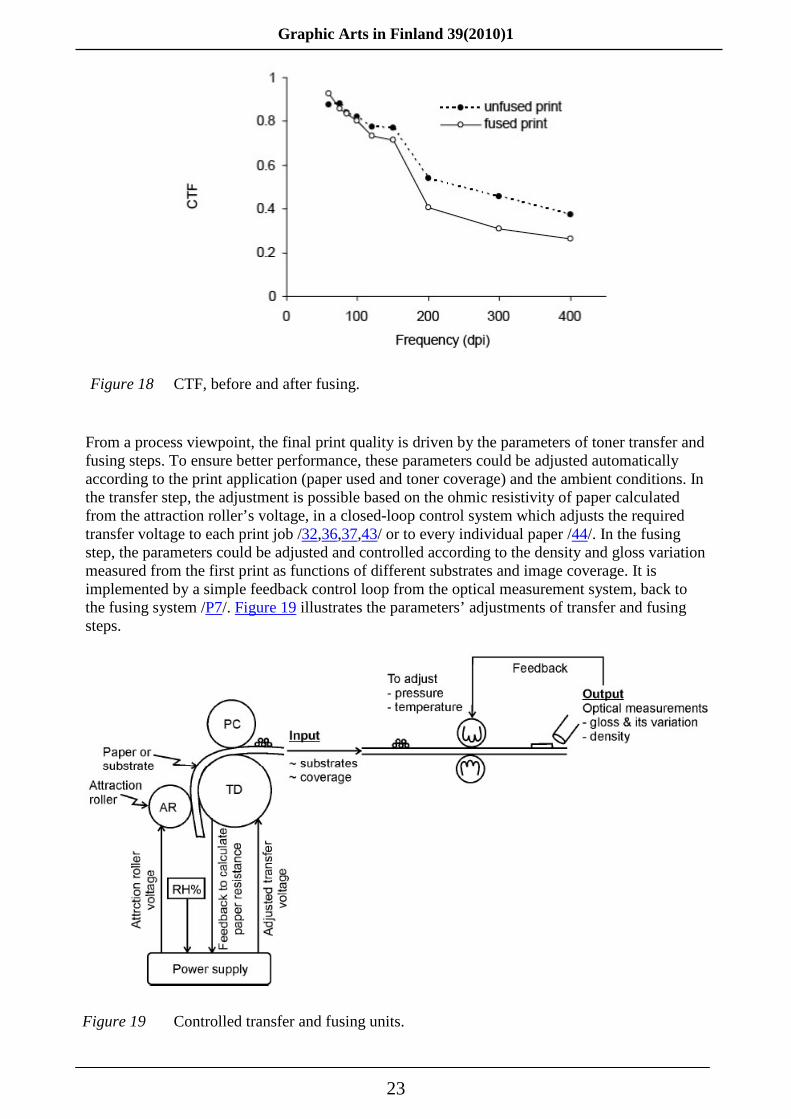
It is known that the image quality is a result of the interactions between toner, paper and processes parameters in the transfer and fusing steps. The lines shown in Figure 16, were printed at the same time, on the same paper, and by the same printer, using the same toner and the same transfer and fusing parameters. But still the lines’ quality is different. Clearly, the print quality depends on the orientation of the lines relative to the fibre orientation of the paper and the direction of the printing process. Therefore, the image properties (colour, print lay-out, size and image content /101,102/ and location on paper) represent an additional group of variables that interact with the triangle groups of toner-paper-printer variables, to form a rectangle interaction group to produce the final image quality, as shown in Figure 17.
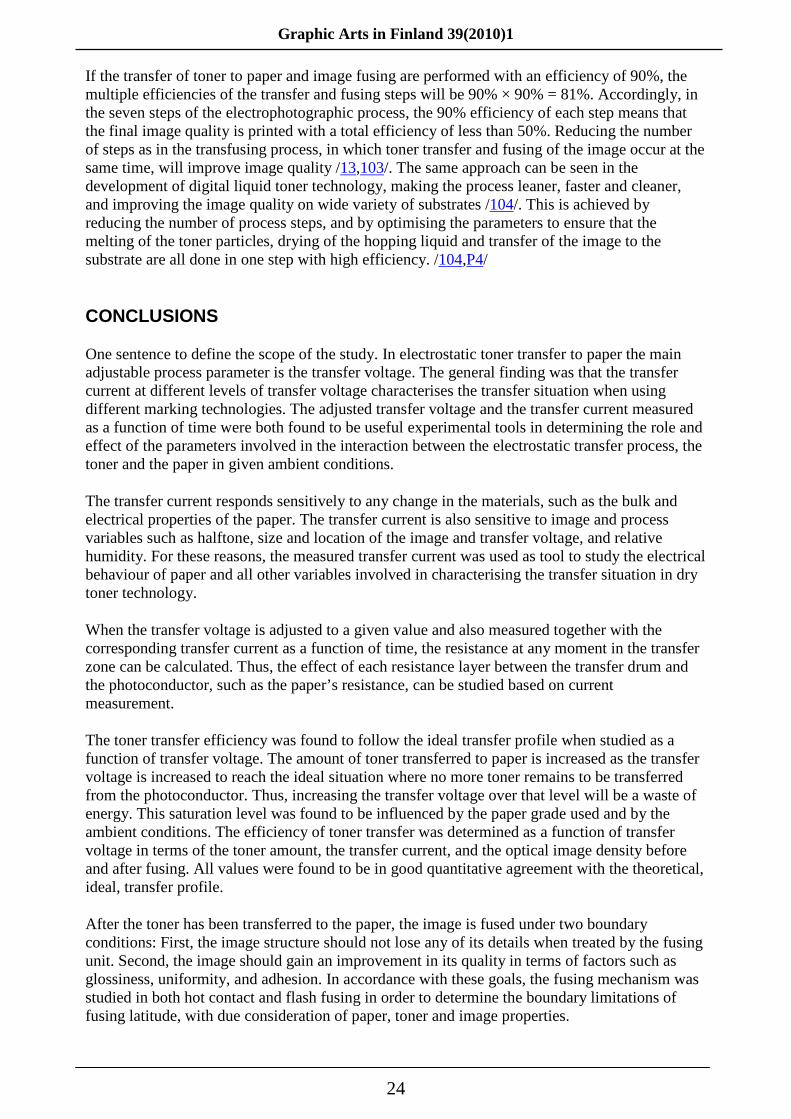
Most print quality criteria are subject to change in the final step of the electrophotographic printing process, where the image is fused to be fixed onto paper. Figure 18 shows the effect of fusing parameters on image quality.
Figure 16 CTF of two lines perpendicular to each other.
Figure 17 Toner-paper-image-process interaction in transfer and fusing steps.
Graphic Arts in Finland 39(2010)1
23
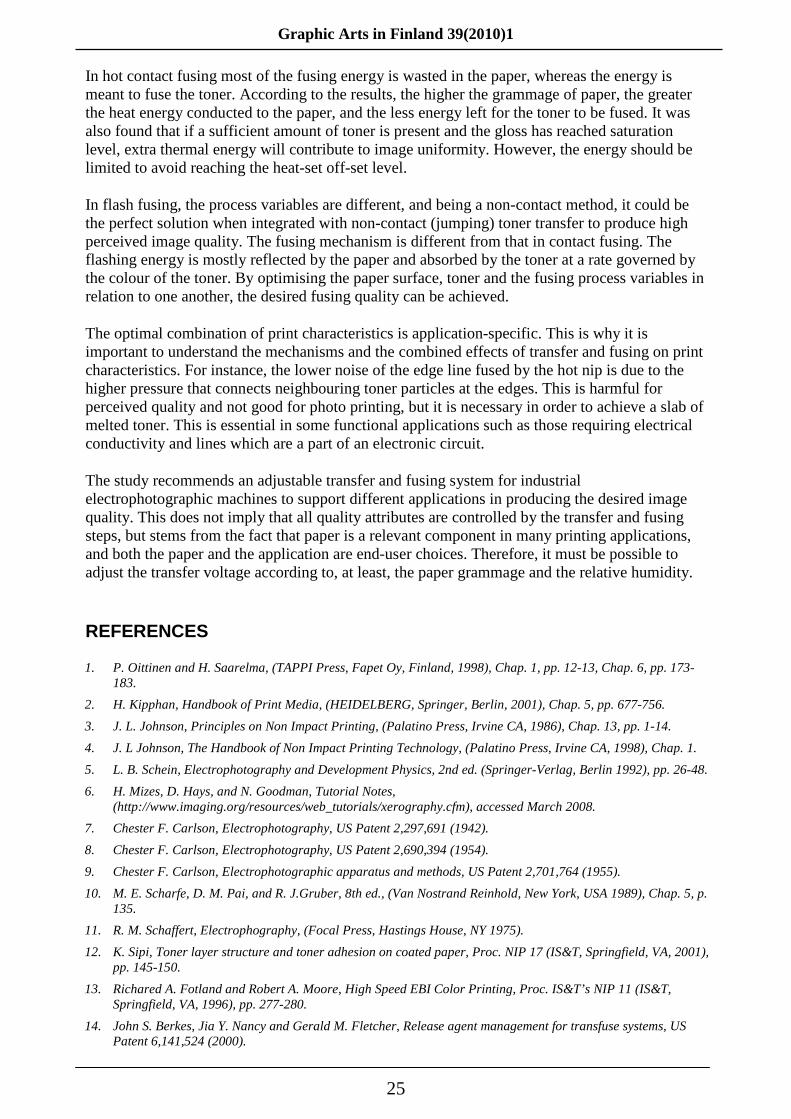
From a process viewpoint, the final print quality is driven by the parameters of toner transfer and fusing steps. To ensure better performance, these parameters could be adjusted automatically according to the print application (paper used and toner coverage) and the ambient conditions. In the transfer step, the adjustment is possible based on the ohmic resistivity of paper calculated from the attraction roller’s voltage, in a closed-loop control system which adjusts the required transfer voltage to each print job /32,36,37,43/ or to every individual paper /44/. In the fusing step, the parameters could be adjusted and controlled according to the density and gloss variation measured from the first print as functions of different substrates and image coverage. It is implemented by a simple feedback control loop from the optical measurement system, back to the fusing system /P7/. Figure 19 illustrates the parameters’ adjustments of transfer and fusing steps.
Figure 18 CTF, before and after fusing.
Figure 19 Controlled transfer and fusing units.
Graphic Arts in Finland 39(2010)1
24
If the transfer of toner to paper and image fusing are performed with an efficiency of 90%, the multiple efficiencies of the transfer and fusing steps will be 90% × 90% = 81%. Accordingly, in the seven steps of the electrophotographic process, the 90% efficiency of each step means that the final image quality is printed with a total efficiency of less than 50%. Reducing the number of steps as in the transfusing process, in which toner transfer and fusing of the image occur at the same time, will improve image quality /13,103/. The same approach can be seen in the development of digital liquid toner technology, making the process leaner, faster and cleaner, and improving the image quality on wide variety of substrates /104/. This is achieved by reducing the number of process steps, and by optimising the parameters to ensure that the melting of the toner particles, drying of the hopping liquid and transfer of the image to the substrate are all done in one step with high efficiency. /104,P4/
CONCLUSIONS
One sentence to define the scope of the study. In electrostatic toner transfer to paper the main adjustable process parameter is the transfer voltage. The general finding was that the transfer current at different levels of transfer voltage characterises the transfer situation when using different marking technologies. The adjusted transfer voltage and the transfer current measured as a function of time were both found to be useful experimental tools in determining the role and effect of the parameters involved in the interaction between the electrostatic transfer process, the toner and the paper in given ambient conditions.
The transfer current responds sensitively to any change in the materials, such as the bulk and electrical properties of the paper. The transfer current is also sensitive to image and process variables such as halftone, size and location of the image and transfer voltage, and relative humidity. For these reasons, the measured transfer current was used as tool to study the electrical behaviour of paper and all other variables involved in characterising the transfer situation in dry toner technology.
When the transfer voltage is adjusted to a given value and also measured together with the corresponding transfer current as a function of time, the resistance at any moment in the transfer zone can be calculated. Thus, the effect of each resistance layer between the transfer drum and the photoconductor, such as the paper’s resistance, can be studied based on current measurement.
The toner transfer efficiency was found to follow the ideal transfer profile when studied as a function of transfer voltage. The amount of toner transferred to paper is increased as the transfer voltage is increased to reach the ideal situation where no more toner remains to be transferred from the photoconductor. Thus, increasing the transfer voltage over that level will be a waste of energy. This saturation level was found to be influenced by the paper grade used and by the ambient conditions. The efficiency of toner transfer was determined as a function of transfer voltage in terms of the toner amount, the transfer current, and the optical image density before and after fusing. All values were found to be in good quantitative agreement with the theoretical, ideal, transfer profile.
After the toner has been transferred to the paper, the image is fused under two boundary conditions: First, the image structure should not lose any of its details when treated by the fusing unit. Second, the image should gain an improvement in its quality in terms of factors such as glossiness, uniformity, and adhesion. In accordance with these goals, the fusing mechanism was studied in both hot contact and flash fusing in order to determine the boundary limitations of fusing latitude, with due consideration of paper, toner and image properties.
Graphic Arts in Finland 39(2010)1
25
In hot contact fusing most of the fusing energy is wasted in the paper, whereas the energy is meant to fuse the toner. According to the results, the higher the grammage of paper, the greater the heat energy conducted to the paper, and the less energy left for the toner to be fused. It was also found that if a sufficient amount of toner is present and the gloss has reached saturation level, extra thermal energy will contribute to image uniformity. However, the energy should be limited to avoid reaching the heat-set off-set level.
In flash fusing, the process variables are different, and being a non-contact method, it could be the perfect solution when integrated with non-contact (jumping) toner transfer to produce high perceived image quality. The fusing mechanism is different from that in contact fusing. The flashing energy is mostly reflected by the paper and absorbed by the toner at a rate governed by the colour of the toner. By optimising the paper surface, toner and the fusing process variables in relation to one another, the desired fusing quality can be achieved.
The optimal combination of print characteristics is application-specific. This is why it is important to understand the mechanisms and the combined effects of transfer and fusing on print characteristics. For instance, the lower noise of the edge line fused by the hot nip is due to the higher pressure that connects neighbouring toner particles at the edges. This is harmful for perceived quality and not good for photo printing, but it is necessary in order to achieve a slab of melted toner. This is essential in some functional applications such as those requiring electrical conductivity and lines which are a part of an electronic circuit.
The study recommends an adjustable transfer and fusing system for industrial electrophotographic machines to support different applications in producing the desired image quality. This does not imply that all quality attributes are controlled by the transfer and fusing steps, but stems from the fact that paper is a relevant component in many printing applications, and both the paper and the application are end-user choices. Therefore, it must be possible to adjust the transfer voltage according to, at least, the paper grammage and the relative humidity.
REFERENCES
1. P. Oittinen and H. Saarelma, (TAPPI Press, Fapet Oy, Finland, 1998), Chap. 1, pp. 12-13, Chap. 6, pp. 173-183.
2. H. Kipphan, Handbook of Print Media, (HEIDELBERG, Springer, Berlin, 2001), Chap. 5, pp. 677-756. 3. J. L. Johnson, Principles on Non Impact Printing, (Palatino Press, Irvine CA, 1986), Chap. 13, pp. 1-14. 4. J. L Johnson, The Handbook of Non Impact Printing Technology, (Palatino Press, Irvine CA, 1998), Chap. 1. 5. L. B. Schein, Electrophotography and Development Physics, 2nd ed. (Springer-Verlag, Berlin 1992), pp. 26-48. 6. H. Mizes, D. Hays, and N. Goodman, Tutorial Notes,
(http://www.imaging.org/resources/web_tutorials/xerography.cfm), accessed March 2008. 7. Chester F. Carlson, Electrophotography, US Patent 2,297,691 (1942). 8. Chester F. Carlson, Electrophotography, US Patent 2,690,394 (1954). 9. Chester F. Carlson, Electrophotographic apparatus and methods, US Patent 2,701,764 (1955). 10. M. E. Scharfe, D. M. Pai, and R. J.Gruber, 8th ed., (Van Nostrand Reinhold, New York, USA 1989), Chap. 5, p.
135. 11. R. M. Schaffert, Electrophography, (Focal Press, Hastings House, NY 1975). 12. K. Sipi, Toner layer structure and toner adhesion on coated paper, Proc. NIP 17 (IS&T, Springfield, VA, 2001),
pp. 145-150. 13. Richared A. Fotland and Robert A. Moore, High Speed EBI Color Printing, Proc. IS&T’s NIP 11 (IS&T,
Springfield, VA, 1996), pp. 277-280. 14. John S. Berkes, Jia Y. Nancy and Gerald M. Fletcher, Release agent management for transfuse systems, US
Patent 6,141,524 (2000).
Graphic Arts in Finland 39(2010)1
26
15. Y. Tanioka, Image forming apparatus having mechanism for scraping away deteriorated layer of transfer roller, US Patent 6,185,391 (2001).
16. M. Ogasawara, M. Kimura, and T. Inagaki, Proc. IS&T’s NIP 5 (IS&T, Springfield, VA, 1989), pp. 167-170. 17. K. S. Lindley and N. A. Rowson, Magnetic and Electrical Separation, 1997, Doi: 10.1155/1997/96189, Vol. 8,
No. 2, pp. 101-113. 18. J. A. Cross, Electrostatics: Principles, Problems and Applications. Bristol, U.K, Adam Hilger, 1987, pp. 342-
360, 386–407. 19. A. Jaworek & A. Krupa, Czechoslovak J. of Physics, Springer Netherlands, ISSN: 0011-4626 (Print) 1572-9486
(Online), December, 1995, Doi: 10.1007/BF01691996, Vol. 45, No. 12, pp. 1035-1047. 20. R. Tobazeon, Electrical Phenomena of Dielectric Materials, Chap. 4, pp 51-82 (Handbook of Electrostatic
Processes, Edited by Jen-Shih Chang, Arnold J. Kelly & Joseph M. Crowley, Marcel Dekker, Inc. USA, 1995). 21. I. Chen, and M.-K. Tse, Modeling of electrostatic transfer, Proc. IS&T’s NIP 15 (IS&T, Springfield, VA, 1999),
pp 155-158. 22. Thomas N. Tombs and Bruce R. Benwood, US Patent 6,075,965 (2000). 23. Rose M. Bothner and James L. Butler, US Patent 4,712,906 (1987). 24. T. Meagher, US Patent 3,781,105 (1973). 25. E. Neal Tompkins, Jack N. Bartholmae, Peter A. Zuber, Kirk W. Charles, US Patent 4,931,839 (1990). 26. HP LaserJet series II printer (user manual). 27. Chromapress printer, Technical Manual. 28. Xerox DocuColor 40 Pro printer (user manual). 29. QMS MagiColour Printer, Technical Manual. 30. Canon CLC 500 printer (user manual). 31. Canon CLC 100 printer (user manual). 32. Lexmark Opetra C Laser Printer, Technical Manual. 33. Okipage 8c Plus Colour Printer, Technical Manual. 34. K. Pietrowski, Tutorial notes, IS&T’s NIP 17, (IS&T, Springfield, VA, 2001). 35. Hugh D. Young, and Roger A. Feedman, University Physics, 9th ed., (Addison-Wesley, reading, MA, 1996)
Chap. 15, pp. 460-498, Chap. 22, 23, 24, 25 and 26, pp. 669-832. 36. Hugh D. Young, University Physics, 8th ed., (Addison-Wesley, 1992) Chap. 26, pp. 798-830. 37. S. Simula, Electrical and thermal properties of paper, Doctoral thesis, Helsinki University of Technology, KCL,
Finland (1999), pp. 10-16. 38. Mark C. Zaretsky, J. Imaging Sci. Technol, Vol. 37, No. 2, (1993), pp. 187-191. 39. N. Provatas, A. Cassidy and M. Inoue, Proc. IS&T’s NIP 20 (IS&T, Springfield, VA, 2004), pp. 958-963. 40. N. Provatas, A. Cassidy and M. Inoue, Proc. IS&T’s NIP 18 (IS&T, Springfield, VA, 2002), pp. 770-773. 41. A. Cassidy, M. Grant, and N. Provatas, Modelling Simul. Mater. Sci. Eng. Vol. 12, (2004) 91-107. 42. G. Wright, T. N. Tombs, A.Chowdry, D. S. Weiss, and D. S. Rimai, J. Imaging Sci. Technol, Vol. 49, No. 5,
(2005), pp. 531-538. 43. Thomas N. Tombs, Tutorial notes, IS&T’s NIP16, (IS&T, Springfield, VA, 2000). 44. J. Weigert, Proc. IS&T’s DPP2003, (Springfield, VA, 2003), pp. 216-217. 45. J. W. May and Thomas N. Tombs, IS&T’s NIP 13, (IS&T, Springfield, VA, 1997), pp. 71-76. 46. T. Kumasaka, Y. Simazaki, Y. Takuma, M. Yamada, and N. Hoshi, US Patent 5,291,253 (1994). 47. N. Provatas, A. Cassidy and M. Inoue, Pulp and Paper Report, vol. 1523, 22 pages (2001). 48. C. M. Fletcher, IS&T’s NIP 8, (IS&T, Springfield, VA, 1992), pp 82-85. 49. Juan C. Agui, Derek B. Dove, and Pia N. Sanda, The society of imaging science and technology, NIP5 (Nov.
1989), pp. 69-72. 50. C. Tong, T. Wu and N. Provatas, Mater. Sci. Eng. Vol. 14, (2006)1447-1464. 51. P. Ahonen and M. Sundquist, Proc. IS&T’s NIP 10, (IS&T, Springfield, VA, 1994), pp 471-474. 52. M. Leskelä and S. Simula, Chap. 9, pp (285-317), Paper Physics, book 16, Edit by Kaarlo Niskanen, Fapet Oy,
Finland, 1998.
Graphic Arts in Finland 39(2010)1
27
53. A. C. Chen, J. Borch, C. E. Garcia, and B. Linn, J. Imaging Sci. Technol. Vol. 29(1), pp.11-17 (1989). 54. H. AL-Rubaiey, Master’s thesis, Helsinki University of Technology, Finland (2001), pp. 14, 29-30, 43. 55. H. Ensing and Jacobus H. M. Peulen, US Patent 4,607,947 (1986). 56. H. Yamamoto and Y. Takashima, US Patent 4,809,038 (1989). 57. J. M. O’Reilly and P.F. Erhardt, Proc. 2nd International Conf. on Electrophotography, Washington DC, 1974.,
pp 95. 58. T. Mitsuya and L. Hunt, Recent Progress in Toner Technology, (IS&T, Springfield, VA, 1997), pp 429-433. 59. K. Hirama and M. Uno, US Patent 5,501,931 (1996). 60. Damodar M. Pai and B. E. Springett, The American physics society, Rev. Mod. Phys., Vol. 65, No. 1, January
1993, pp.163-211. 61. James F. Paxon and Duane J. Schommer, US Patent 5,036,360 (1991). 62. Paul R. Spencer, US Patent 3,837,741 (1974). 63. A. Ito, US Patent 5,486,902 (1996). 64. K. D. Brooms, J. IBM, Res. Develop., pp. 22-26, (1978). 65. K. Sipi, M. Lamberg and P. Oittinen, Proc. NIP 15 (IS&T, Springfield, VA, 1999) pp. 426-429. 66. L.-H. Lee, Thermal fixing of electrophotographic images, Adhesion science and technology, (Plenum Press, New
York, 1975), pp. 831-852. 67. E. Hakola, Licentiate’s Thesis, Laboratory of Media Technology, Helsinki University of Technology, Espoo,
Finland, 2007, pp. 52-55. 68. K. Sipi and P. Oittinen, J. Imaging Sci. Technol. 5: 442, (2002). 69. K. M. Sipi, Licentiate’s Thesis, Laboratory of Media Technology, Helsinki University of Technology, Espoo,
Finland, 2002, pp. 2-5, 16-28. 70. P. Oittinen and H. Saarelma, Elektroninen painaminen, ISNB 951-672-139-7, Tekijät ja Otatieto Oy, Finland,
1992, p. 155, (Finnish language). 71. J. Borch, Colloids and Surfaces in Reprographic Technology, ACS, Washington D.C. 1982, pp.475-491. 72. D. J. Sanders, D.F. Rutland and W. K. Istone, J. Imaging Sci. Technol, Vol. 40, No. 2, (1996), pp.175-179. 73. R. Hemel, U. Riebeling and M. Versteegh, TAPPI Proceedings, Papermakers Conference, TAPPI, Atlanta, GA,
1996, pp. 115–119. 74. Chih-H. Chen, and Tsai-B. Yang, Recent progress in toner technology, Edited by George Marshall, (IS&T,
Springfield, VA, 1997), pp 401- 403. 75. R. B. Prime, Photo. Sci. and Eng., Vol. 27, No. 1, (1983), pp. 19-25. 76. Ian S. Neilson, Recent progress in toner technology,by George Marshall, (IS&T, Springfield, VA, 1997), pp. 425-
428. 77. Richared A, Fotland and Robert A. Moore, High Speed EBI Color Printing, Proc. IS&T’s NIP 11 (IS&T,
Springfield, VA, 1995), pp. 277-280. 78. John S. Berkes, Raymond A. Yourd, and Ronald J. Koch, US Patent 4,672,018 (1987). 79. John S. Berkes and Stanley B. Swackhamer, US Patent 4,788,123 (1988). 80. Y. Katagiri, Y. Horikoshi, and N. Sawatari, US Patent 5,518,851 (1996). 81. T. Kishimoto, A. Iwaishi, and T. Akuta, US Patent 6,721,531 (2004). 82. Fuji Xerox web site http://www.fujixerox.com/eng/company/technology/flash_fix/, accessed May 2008. 83. M. Katsukawa, Y. Tonomoto, K. Sato and M. Kimura, J. Japan Hardcopy L0935A, ISSN: 0916-8087, Vol. 2002,
(2002), pp. 600-601. 84. C-H. Kim, Personal discussions at his location in DPI Solutions, Inc., Daejon, Korea (May, 2002). 85. B. Sasteri, V. Sankaran, Media/toner interactions in laser printing, Proc. IS&T’s NIP 19 (IS&T, Springfield, VA,
2003), pp. 619-622. 86. J. C. Briggs, M. K. Tse, D. A. Telep, and J. Cavanaugh, Proc. IS&T’s NIP 14 (IS&T, Springfield, VA, 1998), pp.
451-461. 87. M. Schleusener and R. Apel, Proc. IS&T’s NIP 10 (IS&T, Springfield, VA, 1994), pp. 545-548. 88. M. A. Hopper, Proc. IS&T’s Archiving conference (IS&T, Springfield, VA, 2004), pp. 49-52.
Graphic Arts in Finland 39(2010)1
28
89. A. Eida, S. Omatsu, and J. Shimizu, Proc. IS&T’s NIP 20 (IS&T, Springfield, VA, 2004), pp. 102-106. 90. Albert N. Garthwaite and Luis A. Suarez Jr., US Patent 4,386,840 (1983). 91. P. Räsänen, Master’s thesis, Helsinki University of Technology, 108 pages, (2004). 92. http://www.malvern.co.uk/labeng/products/iwtm/particle_shape.htm, accessed August 2008. 93. http://belgium.oki.com/fcgi-bin/public.fcgi?pid=37&cid=134&prid=133&pncid=5&nid=42, accessed August
2008. 94. A. Ilmonen, Master’s thesis, Helsinki University of Technology, 68 pages, (2005). 95. A. J. Rushing, R. D. Fields, D. S. Rimia, and A. Hoskins, J. Imaging Sci. Technol. Vol. 45, No. 2, pp. 187-197,
(2001). 96. R. D. Fields, A. J. Rushing, D. S. Rimia, and A. Hoskins, Proc. IS&T’s NIP 15 (IS&T, Springfield, VA, 1999), pp.
503-506. 97. T. Miyashiro, H. Fujii, and T. Ochiai, US Patent 5,390,012 (1995). 98. Y. Iwakura, US Patent 5,771,430 (1998). 99. T. Takaya, S. Anzai, and T. Oikawa, US Patent 5,878,314 (1999). 100. Y. Kamei, H. Ohnishi, F. Shimazu, K. Toizumi, Y. Umetani, and K. Yamauchi, US Patent 6,081,685 (2000). 101. R. Halonen, Master’s thesis, Helsinki University of Technology, Espoo, Finland (2008), 80 pages, pp 52-63. 102. R. Halonen, T. Leisti, and P. Oittinen, Proc. IS&T’s NIP 24 (IS&T, Springfield, VA, 2008), pp. 459-462. 103. L. B. Schein and G. Beardsley, J. Imaging Sci. Technol, Vol. 37, No. 5, (1993), pp. 451-461. 104. U. Chatow,
Proc. IS&T’s DPP2001, (Springfield, VA, 2001), pp. 21-25. 104. U. Chatow, Proc. IS&T’s DPP2001, (Springfield, VA, 2001), pp. 21-25.