tools for evaluating the human health risks associated
TRANSCRIPT

Tools for Evaluating the Human Health Risks Associated with
Microbial Contamination of Apples
Jonathan Stamy Nagata
A thesis submitted in partial fulfillment of the
requirements for the degree of:
Master of Science
University of Washington
2015
Committee:
J. Scott Meschke
Alison Cullen
Karen Killinger
Program Authorized to Offer Degree:
Department of Environmental and Occupational Health Sciences
School of Public Health

© Copyright 2015
Jonathan Nagata

University of Washington
Abstract
Tools for Evaluating the Human Health Risks Associated with
Microbial Contamination of Apples
Jonathan Stamy Nagata
Chair of the Supervisory Committee:
Associate Professor J. Scott Meschke
Environmental and Occupational Health Sciences
This thesis incorporates laboratory methods, risk assessment modeling, and policy
analysis to address food safety issues related to microbial contamination of apple crops. Chapter
1 provides an introduction to microbial food safety issues and apple production in the United
States. It also broadly discusses the conceptual underpinnings for the three subsequent chapters
and specific aims of the thesis. More robust background information is provided within the
respective chapters. Chapter 2 provides an analysis of a novel method for the quantification of E.
coli on apple surfaces. Chapter 3 aims to evaluate the health risks of apple contamination under
varying harvest and cleaning conditions, utilizing three quantitative microbial risk assessment
models. The policy relevance of the study is discussed in Chapter 4, incorporating history of
food safety policy, broad policy process frameworks, and a discussion of the relevant policy
development stages in which the study findings may apply. As a whole, this thesis is intended to
provide an interdisciplinary approach to issues surrounding apple production and consumption.

i
TABLE OF CONTENTS
List of Figures .............................................................................................................................................. iii
List of Tables ............................................................................................................................................... iv
Acknowledgments ......................................................................................................................................... v
1. Introduction ........................................................................................................................................... 1
1.1. Sources and Control of Microbial Contamination ........................................................................ 3
1.2. Methods for the Detection of Microbial Contamination on Apples .............................................. 5
1.3. Estimating the Health Impacts of Apple Contamination .............................................................. 6
1.4. Policy Relevance ........................................................................................................................... 7
1.5. Study Purpose and Specific Aims ................................................................................................. 7
2. Evaluating a Novel Method for the Quantification of E. coli on Apples .............................................. 9
2.1. Introduction ................................................................................................................................... 9
2.2. Methods ....................................................................................................................................... 12
2.3. Results ......................................................................................................................................... 14
2.4. Discussion ................................................................................................................................... 16
2.4.1. Method Development .......................................................................................................... 16
2.4.2. Discussion of Results .......................................................................................................... 18
2.4.3. Limitations and Directions for Future Research ................................................................. 19
2.5. Conclusion .................................................................................................................................. 20
3. Estimating the Health Effects of Apple Contamination ...................................................................... 21
3.1. Introduction ................................................................................................................................. 21
3.1.1. Sources of Microbial Contamination .................................................................................. 22
3.1.2. Methods of Pathogen Reduction ......................................................................................... 25
3.2. Methods ....................................................................................................................................... 30
3.3. Hazard Identification................................................................................................................... 31
3.3.1. E. coli O157:H7 .................................................................................................................. 31
3.3.2. Salmonella ........................................................................................................................... 32
3.3.3. L. monocytogenes ................................................................................................................ 34
3.4. Exposure Assessment .................................................................................................................. 35
3.4.1. Sources of Contamination ................................................................................................... 37
3.4.2. Cleaning Processes .............................................................................................................. 41
3.5. Dose-Response Assessment ........................................................................................................ 44
3.5.1. E. coli O157:H7 .................................................................................................................. 45

ii
3.5.2. Salmonella spp. ................................................................................................................... 48
3.5.3. L. monocytogenes ................................................................................................................ 50
3.6. Results ......................................................................................................................................... 51
3.6.1. Model Simulations .............................................................................................................. 51
3.6.2. Risk Characterization .......................................................................................................... 53
3.6.3. Sensitivity Analysis............................................................................................................. 54
3.7. Discussion ................................................................................................................................... 55
3.7.1. Estimation of Foodborne Illness Risks ............................................................................... 55
3.7.2. Limitations and Directions for Future Research ................................................................. 56
4. Food Safety Policy: Values, Processes, and the Role of Science ....................................................... 58
4.1. United States Food Safety Policy: Past and Present ................................................................... 58
4.2. Values, Actors, Institutions, and Policy Processes in Food Safety ............................................. 60
4.2.1. Values in Food Safety ......................................................................................................... 61
4.2.2. Actors and Institutions in Food Safety ................................................................................ 66
4.2.3. Policy Processes .................................................................................................................. 68
4.3. Research Findings: Implications for Policy ................................................................................ 69
4.3.1. Agenda Setting .................................................................................................................... 70
4.3.2. Policy Analysis ................................................................................................................... 72
4.3.3. Selecting Policy Mechanisms ............................................................................................. 73
4.4. Conclusion .................................................................................................................................. 75
References ................................................................................................................................................... 77
Appendix A – Tornado Analysis Output .................................................................................................... 87
Appendix B – Significant Events in US Federal Food Safety Policy ......................................................... 88

iii
LIST OF FIGURES
Figure 1.1 – Pathways of Fresh Produce Contamination (Beuchat 1996) .................................................... 4
Figure 1.2 – Three Research Areas Associated with Specific Aims ............................................................. 8
Figure 2.1 – IDEXX Colilert®-18 and Quanti-Tray®/2000 under UV Light .............................................. 11
Figure 2.2 – Apples Being Transferred to Whirl-Pak® Bags ...................................................................... 13
Figure 2.3 – Correlation Between Inoculation and Percent Recovery ........................................................ 15
Figure 2.4 – Percent Recoveries for IDEXX and PCR ............................................................................... 16
Figure 3.1 – The Risk Assessment Framework .......................................................................................... 21
Figure 3.2 – Risk Assessment Framework for Provided Models ................................................................ 31
Figure 3.3 – Sources of Contamination and Reduction/Growth Processes ................................................. 36
Figure 3.4 – Flow Chart for Glove and Hand Contamination ..................................................................... 39
Figure 3.5 – E. coli O157:H7 Dose-Response Model Curves .................................................................... 47
Figure 3.6 – Salmonella Dose-Response Model Curves ............................................................................. 50
Figure 3.7 – L. monocytogenes Dose-Response Model Curves .................................................................. 51
Figure 4.1 – A Basic Policy Framework ..................................................................................................... 61
Figure 4.2 – Elements of the Food Safety System (Phillips and Wolfe 2001) ........................................... 68
Figure 4.3 – A Policy Process Framework ................................................................................................. 69
Figure 4.4 – Uses for Study Findings in Public Policy Processes .............................................................. 70
Figure 4.5 – Thesis Research Areas ............................................................................................................ 76

iv
LIST OF TABLES
Table 2.1 – Mean, Median, and Range of Percent Recoveries for Inoculated Apples................................ 15
Table 3.1 – Water Contamination Levels and Sources ............................................................................... 38
Table 3.2 – Distributions and Sources of Model Parameters for Cleaning Process .................................... 42
Table 3.3 – E. coli O157:H7 Dose-Response Model Parameters ............................................................... 47
Table 3.4 – Salmonella Dose-Response Model Parameters ........................................................................ 49
Table 3.5 – L. monocytogenes Dose-Response Model Parameters ............................................................. 51
Table 3.6 – Model Components Utilized in Four Scenarios ....................................................................... 52
Table 3.7 – E. coli O157:H7 Model Outputs Under Four Scenarios .......................................................... 53
Table 3.8 – Salmonella Model Outputs Under Four Scenarios .................................................................. 54
Table 3.9 – L. monocytogenes Model Outputs Under Four Scenarios ........................................................ 54
Table 4.1 – Select Examples of Formal Food Safety Institutions ............................................................... 67

v
Acknowledgments
This thesis would not have been possible without the support of advisors, colleagues,
friends, and family. I would like to thank Dr. Scott Meschke for his mentorship and guidance
throughout these research projects. Thanks to Dr. Karen Killinger and Dr. Alison Cullen, who
provided invaluable insights and advice during the development of this thesis. I would like to
acknowledge the Meschke lab staff – Nicky Beck, Christa Fagnant, Alex Kossik, and Jeff Shirai
– for their technical and emotional support. I would also like to acknowledge my fellow graduate
students for inspiring and motivating me throughout my graduate work. Extra thanks to my
partner-in-crime, Trevor Peckham, for being awesome. Finally, I would like to thank my family
and friends for their unwavering love and support.

1
1. Introduction
Foodborne illnesses are responsible for a significant amount of morbidity and mortality in
the United States; 47.8 million cases are estimated to occur annually (Scallan et al. 2011a,
2011b). This burden of foodborne illness has significant economic impacts; the aggregated costs
associated with foodborne illnesses are estimated at between $51.0 billion and $77.7 billion
annually, due to medical expenses, productivity losses, and illness-related mortality (Scharff
2012). Over the past decades, fresh produce has been increasingly recognized as a major source
of foodborne illness. Outbreaks linked to produce accounted for an increasing proportion of
reported foodborne outbreaks associated with a known food item, rising from 0.7% in the 1970s
to 6% in the 1990s (Sivapalasingam et al. 2004). From 1998-2008, 46% of foodborne illnesses in
the United States were attributed to consumption of produce (Painter et al. 2013).
Several factors have be identified to explain the increase in produce-associated foodborne
illnesses. Per capita consumption of fresh produce has increased substantially in the U.S. since
the 1970s (Pollack 2001). The increasing number of produce-related outbreaks can also be
attributed to larger scale production and more efficient distribution of fresh produce (Olaimat
and Holley 2012). Additionally, as agriculture becomes more intensive, produce fields may be
situated in closer proximity to animal production areas, and there may be increasing connectivity
between wild animals, farm animals, and produce farms (Lynch et al. 2009). Yet, no single risk
factor can explain the array of outbreaks associated with varying food items, production
environments, processes, and pathogens; rather, foodborne illness outbreaks are likely due to a
convergence of dynamic factors (Mandrell 2009).
The increasing number of foodborne illnesses associated with fresh produce has resulted
in a growing concern about the production and distribution of fruits and vegetables. Diverse

2
stakeholders, including farmers, trading companies, consumer organizations, government
authorities, and universities have prioritized the issue of bacterial pathogens on fresh produce
(Van Boxstael et al. 2013). In response to growing concern over the safety of fresh produce, food
safety policies have been increasingly focused on interventions that prevent human pathogens
from contaminating fruits and vegetables. The passage of the Food Safety Modernization Act
(FSMA) in 2011 represents an effort by the U.S. Government to address the safety of the
nation’s food systems. Under FSMA, the U.S. Food and Drug Administration (FDA) is charged
with establishing science-based standards for the safe growing, harvesting, packing, and holding
of produce on farms to reduce the incidence of foodborne illness cases associated with fruits and
vegetables. At the time this thesis was written, the FDA was in the process of revising the
proposed produce safety rule, titled “Standards for the Growing, Harvesting, Packing, and
Holding of Produce for Human Consumption” (FDA 2014). Among other mandates, the
proposed produce rule requires the inspection, maintenance, monitoring, and follow-up actions
related to agricultural water sources and water distribution systems. Furthermore, it requires
control measures for water used to grow, harvest, and pack covered produce. While the proposed
produce safety rule has the potential to reduce the incidence of produce-related foodborne illness,
farmers and industry associations have voiced concerns that proposed standards are too stringent.
In particular, apple growers have expressed concern over various provisions of the produce rule
– such as proposed irrigation water quality standards – with the rationale that relatively few
incidences of foodborne illness outbreaks have been attributed to apple consumption.
Apples are the second most consumed fruit in the United States after bananas. In 2014,
11.2 billion pounds of apples were harvested in the U.S. The 2014 apple crop was valued at
nearly $3 billion (NASS 2015). While unpasteurized apple juice and cider have been linked to

3
foodborne illness outbreaks, whole apples are regarded as a relatively safe crop. Only one major
outbreak has been linked to whole, fresh apples; a multistate outbreak of listeriosis in the winter
of 2014 prompted the recall of prepackaged caramel apples and specific varieties of packed,
whole fresh apples, produced in California (CDC 2015).
1.1. Sources and Control of Microbial Contamination
Several pathways for the contamination of produce prior to harvest have been proposed,
including irrigation water, sewage, feces, soil, inadequately composted manure, insect vectors,
wild and domestic animals, and air (Beuchat, 1996; Harris et al., 2003). Additionally, sources of
postharvest contamination may include human handling, harvesting equipment, transport
containers, wash and rinse water, and sorting and packing equipment (Harris et al., 2003). Figure
1.1 depicts some of the pathways by which fresh produce may become contaminated with
microorganisms. Of the aforementioned pathways, plausible sources of bacterial contamination
on apples include irrigation water used for spray irrigation or evaporative cooling, direct contact
with feces or manure when apples are dropped, hand contact during harvest and contact with
contaminated surfaces or washes during harvest and cleaning processes. Sources of
contamination are reviewed in greater detail in Chapter 3.
To address potential contamination in the orchard, and to improve aesthetic and shelf-life,
apples typically undergo several cleaning processes after harvest. These cleaning steps may
include a dump tank with chlorine, chlorine or peracetic acid spray, flume systems with similar
antimicrobials, spray bar systems with commercial cleaning agents or antimicrobials, and water
rinses. After cleaning, apples are dried and waxed. All of these processes typically result in
reduction of microbiological contaminants on the apple surface (Beuchat 1998; Herdt and Feng
2009; Kenney and Beuchat 2002). Pre-cleaning and post-cleaning storage also provides an

4
opportunity for microbial die-off (Janes et al. 2002). The lower risk of field contamination –
given that tree fruit are less likely to contact the soil – as well as post-harvest cleaning
procedures contribute to the observation that whole, fresh apples are rarely implicated in
foodborne illness outbreaks. Cleaning processes are described in greater detail in Chapter 3.
Figure 1.1 – Pathways of Fresh Produce Contamination (Beuchat 1996)
This study will focus on Escherichia coli O157:H7, Salmonella spp., and Listeria
monocytogenes as pathogens of concern in apple production. Strains of these bacteria have been
implicated in foodborne illnesses associated with fresh produce (Harris et al., 2003; Lynch et al.,
2009) and are recognized as pathogens of concern (Beuchat, 1996). Foodborne outbreaks have
been linked to unpasteurized apple cider contaminated with E. coli O157:H7 (Hilborn et al.
2000; CDC 1996; CDC 1997; Besser et al. 1993) and Salmonella typhimurium (CDC 1975). The
2014 outbreak associated with caramel apples was caused by L. monocytogenes (CDC 2015).
Additionally, numerous recalls of apple products have occurred due to potential L.
momocytogenes contamination, although illnesses were not directly linked to these incidents
(Stearns 2014).

5
1.2. Methods for the Detection of Microbial Contamination on Apples
Given the potential for microbial contamination of apples in the field, analytical methods
are essential for determining levels of bacterial load on the fruits. Quantification methods serve
two main purposes: (a) monitoring of apples during harvest and processing for regulatory or
quality control purposes, or (b) evaluating the risks of microbial contamination under varying
field conditions and cleaning processes. The methods discussed in this thesis relate to the latter
purpose; to better understand the potential human health risks of apple contamination, reliable
and efficient laboratory methods are needed to generate data on apple production, which in turn
may inform best management practices for regulatory standards.
While several quantification methods have been developed, there is no standard method
for the enumeration of microbiological agents on and in apples. The US Food and Drug
Administration (FDA) provides the agency’s preferred laboratory procedures for microbiological
analyses of foods in the Bacteriological Analytical Manual (FDA BAM). However, the FDA
BAM method – which utilizes multiple tube fermentation – is time-consuming and labor
intensive. Furthermore, researchers who examine the microbiological aspects of apple growing
and post-harvest processes tend to tailor their methodologies to address their specific research
question. For example, Fatemi et al. (2006) developed a method of coring and sectioning apple
samples to examine the penetration of E. coli into the fruit tissue, while Kreske et al. (2006)
utilized a rinsing method to quantify Bacillus spores on the apple surface. A rapid, accurate, and
easy-to-perform method for quantifying E. coli on apples may improve future food safety
investigations that examine apples.

6
1.3. Estimating the Health Impacts of Apple Contamination
Because apples have not been implicated in many foodborne illness outbreaks –
compared to crops more commonly associated with outbreaks such as lettuce, tomatoes, and
sprouts – the food safety literature lacks risk assessments that quantitatively estimate the health
outcomes associated with apple consumption. This study will utilize a quantitative microbial risk
assessment (QMRA) framework to estimate the probability of illness associated with the
consumption of contaminated apples. The purpose of this investigation is to estimate the
foodborne illness risks associated with apple contamination and to characterize the relative
contribution of contamination sources and cleaning steps to the risks of foodborne illness. Three
QMRA models are provided, respectively examining three microorganisms of concern: E. coli
O157:H7, Salmonella spp., and L. monocytogenes.
Risk assessment is the qualitative or quantitative characterization and estimation of
potential adverse health effects associated with exposure to hazards (Haas et al. 1999). Risk
assessment is a component of risk analysis, which incorporates risk assessment, risk
management, and risk communication. Risk assessment has developed as a tool for
characterizing human and ecological health risks associated with physical, chemical, and
biological hazards in the environment. The origin of risk assessment is tied to congressional
mandates of the 1970s, namely the Clean Air Act and the Safe Drinking Water Act
Amendments. The National Academy of Sciences formally recognized the field of risk
assessment in 1983 with the publication of the “red book” (NRC 1983). Although the field of
risk assessment has been critiqued over the years (Graham 1995), it continues to evolve and
serve as a tool for both academics and government agencies.

7
Charles Haas was the first to quantitatively examine microbial risks associated with
drinking waters based on dose-response modeling (Haas 1983). QMRA has since emerged as a
sub-field of risk assessment that specifically examines the health outcomes associated with
exposure to microbial hazards. The QMRA framework is explained in greater detail in Chapter 3.
While utilizing the same framework as chemical risk assessment, QMRAs require modifications
to account for the differences between chemical and microbiological hazards. For example,
QMRAs must address the growth and die-off pathogens and microbiologically-relevant dose-
response models (Haas et al. 1999).
1.4. Policy Relevance
The research presented in this thesis directly relates to the FDA’s proposed Standards for
the Growing, Harvesting, Packing, and Holding of Produce for Human Consumption. Yet, while
public policy is to an extent informed by best available science, other factors play important roles
in policy processes. Policy actors’ principles and values necessarily guide policy formation
(Lindblom and Woodhouse 1993). Likewise, institutions – the formal and informal mechanisms
that structure individuals’ or groups’ actions – guide decision-making processes. Consideration
of values, actors, institutions, and policy processes is necessary to understand the role for science
in food safety policy. Chapter 4 will examine the policy relevance of the research provided in
Chapter 3 by examining the history of food safety, providing general frameworks for food safety
policy processes, and identifying specific stages in which research findings may be utilized.
1.5. Study Purpose and Specific Aims
The purpose of this thesis is to provide tools for the evaluation of human health impacts
associated with apple consumption. The three tools provided here are reflected in a broader
framework that links laboratory methods, risk assessment modeling, and policy processes

8
(Figure 1.2). In this framework, experimental studies provide data that can be used in risk
assessment models. In turn, risk assessments can inform policy processes.
Figure 1.2 – Three Research Areas Associated with Specific Aims
The three specific aims for this thesis correlate to the three domains in Figure 1.2.
Specifically, this thesis aims to:
Aim 1: Evaluate the efficacy of a novel surface elution method to quantify E. coli on apples.
Aim 2: Use quantitative microbial risk assessment models to:
Aim 2A: Generate estimates of the probability of gastrointestinal illness associated with
apple consumption, under varying orchard and packing house conditions.
Aim 2B: Identify specific conditions or processes that likely have the most and least
consequential impact on apple safety.
Aim 2C: Identify data gaps in the literature to guide future research; propose improvements
to future iterations of apple QMRA models.
Aim 3: Examine the policy context of study findings and identify stages of food safety policy
processes in which the findings could be used.
9
2. Evaluating a Novel Method for the Quantification of E. coli on Apples
2.1. Introduction
Proposed regulations relating to the growing and handling of produce have stimulated
interest in conducting studies to evaluate the risks of foodborne illness associated with apples.
Because new standards for the growing, harvesting, packing, and holding of apples have
economic implications for apple growers, key stakeholders are increasingly interested in
characterizing the foodborne illness risks associated with apple growing practices. As a first step
towards determining the human health risks associated with apple production, reliable and
efficient methods must be developed for enumerating microbiological contaminants on apples.
Such methods can be used to generate data on bacterial growth and die-off rates during various
growing, harvest, cleaning, packaging, and storage processes. This data can, in turn, be used in
QMRA models to estimate the health risks associated with apple consumption. Current methods
are time-consuming and labor intensive, presenting a barrier to laboratory and field studies.
While an array of microbes could cause foodborne illness, testing for numerous distinct
pathogens is costly and time-consuming. Consequently, fecal coliforms and E. coli are typically
used as indicators to signify the potential presence of intestinal pathogens (Geldreich 1966).
Fecal coliforms are defined as facultatively anaerobic, rod-shaped, gram-negative non-
sporulating bacteria that ferment lactose at 44 ± 0.5oC. Because fecal coliforms may not
necessarily indicate the presence of feces, E. coli is more widely accepted as an indicator of fecal
contamination (Doyle and Erickson 2006). The conventional method for detecting and
quantifying fecal coliform or E. coli contamination in food samples is the FDA BAM Most
Probable Number (BAM MPN) method. Under BAM protocols, a specified mass of food sample

10
is first homogenized in a blender or stomacher. Then, a 15-tube dilution method is used to
statistically estimate the concentration of target microorganisms (FDA 2002).
An efficient and easy-to-perform coliform quantification method, the IDEXX Colilert®-
18 and Quanti-Tray® system, is widely used for the detection and quantification of total
coliforms, fecal coliforms, and E. coli in water. This method is designed to estimate the Most
Probable Number (MPN) of E. coli and coliform bacteria in drinking waters and other similar
treated and untreated waters. Colilert-18® uses Defined Substrate Technology® nutrient
indicators to detect coliforms and E. coli in water samples. The use of β-glucuronidase for the
rapid detection of E. coli in environmental media was proposed by Kilian, M., & Bülow (1976),
and since has become a widely utilized method for the identification of fecal bacteria (Rice et al.
1990). In the presence of the Colilert substrate, E. coli use β-glucuronidase to metabolize
indicators and create fluorescence. Non-coliforms that are equipped with these enzymes are
selectively suppressed by Colilert’s specifically formulated matrix. Colilert-18® is used in
conjunction with IDEXX's Quanti-Tray®/2000 (Figure 2.1), which is based on the same
statistical model as the traditional 15-tube serial dilution. By dividing the sample into wells,
Quanti-Tray® uses the Standard Method MPN approach to determine the number of bacteria in
the original sample. The relatively large number of wells (49 large wells and 48 small wells)
provides a high counting range and narrower 95% confidence intervals compared to the
traditional 15-tube fermentation method. Both methods use the following equation to estimate
the MPN (λ):
∑𝑔𝑗𝑚𝑗
1 − exp(−𝜆𝑚𝑗)=
𝑘
𝑗−1
∑𝑡𝑗𝑚𝑗
𝑘
𝑗−1

11
Where k denotes the number of dilutions, 𝑔𝑗 denotes the number of positive tubes in the jth
dilution, 𝑚𝑗 denotes the amount of the original sample in each tube in the jth dilution, and 𝑡𝑗 is
the number of tubes in the jth dilution.
Figure 2.1 – IDEXX Colilert®-18 and Quanti-Tray®/2000 under UV Light
The Colilert®-18/Quanti-Tray® method is an International Organization for
Standardization (ISO) worldwide standard for detecting total coliforms and E.coli in water (ISO
9308-2:2012). Numerous validation studies have shown that IDEXX Colilert®-18, Quanti-Tray®
produces results that are not significantly different from membrane filtration methods for
enumerating coliforms and E. coli in drinking water (Boubetra et al. 2011), recreational waters
(Kinzelman et al. 2005), municipal wastewater (Warden et al. 2011), and treated sewage sludge
(Eccles et al. 2004). The U.S. Environmental Protection Agency (EPA) has approved the use of
Colilert®-18 and Quanti-Tray® for testing wastewater treatment effluent. While Colilert®-18 and
Quanti-tray®/2000 has been used to estimate the concentration of E. coli on lettuce and tomatoes
(Leang 2013), the method has not been formally validated for testing fecal contamination of tree
fruit. This study aims to evaluate the efficacy of a surface elution method developed to maximize
the recovery of E. coli from contaminated apples, using the IDEXX system for quantification.

12
Specifically, this study will determine the rate at which E. coli are recovered off of inoculated
apple surfaces.
2.2. Methods
Apple Preparation
Unwaxed Fuji, Red Delicious, Gala, and Honeycrisp apples were procured from apple
growers in Washington State. Apples were stored at 4ºC. Prior to inoculation, apples were rinsed
with water, dried, and disinfected with 70% ethanol solution and UV light.
Preparation of Inocula
Non-pathogenic strains of E. coli were recovered from irrigation water samples. Stock
concentration of inoculum was prepared with DifcoTM Nutrient Broth, incubated overnight at
37ºC with agitation. Three inocula were prepared using serial dilutions in sterile phosphate
buffered saline (PBS); high, medium, and low inoculum concentrations were ~105, ~104, and
~103 CFU/ml, respectively. Concentrations of E. coli in the inocula were determined by plating
serial dilutions on DifcoTM Nutrient Agar with MUG.
Inoculation Procedure
Disinfected apples were spot inoculated with 100µl of inoculum. Approximate E. coli
concentrations for the high, medium, and low inoculation levels were 104, 103, and 102
CFU/apple, respectively. Droplets of inoculum were deposited evenly over the apple surface,
including the stem bowl and/or calyx. After inoculation, apples were dried in a biosafety cabinet
with air flow for 1.5-2 hours, until droplets had visibly dried. Negative control apples were spot
inoculated with 100µl of sterile PBS and dried under the conditions described above.

13
Recovery
Inoculated apples were placed in a 22-oz Whirl-Pak® bag with 100ml of sterile PBS. The
bagged apples were placed on a shaker table for 10 minutes, and then massaged by hand for 3
minutes. Eluate from the Whirl-Pak bags was transferred to individual sterile Nalgene sample
bottles. Bagged apples shown in Figure 2.2.
Figure 2.2 – Apples Being Transferred to Whirl-Pak® Bags
Enumeration
Eluate from the Whirl-Paks® was mixed with IDEXX Colilert®-18 reagent, then poured
into Quanti-tray®/2000 and sealed in a Quanti-tray® sealer. After incubation at 37ºC for 18-24
hours, an MPN for E. coli was generated for each sample based on the number of positive wells
(those that fluoresced under UV light).
Calculations
Percent recovery was determined by dividing the number of E. coli in the apple sample
eluate by the number of E. coli inoculated on the apple, using the equation:

14
𝑃𝑒𝑟𝑐𝑒𝑛𝑡𝑅𝑒𝑐𝑜𝑣𝑒𝑟𝑦 = 𝐸. 𝑐𝑜𝑙𝑖𝑖𝑛𝑒𝑙𝑢𝑎𝑡𝑒
𝐶𝑖𝑛𝑜𝑐𝑢𝑙𝑢𝑚 ∗ 𝑉𝑖𝑛𝑜𝑐𝑢𝑙𝑢𝑚∗ 100
Where 𝐶𝑖𝑛𝑜𝑐𝑢𝑙𝑢𝑚 is the concentration of E. coli in the inoculum and 𝑉𝑖𝑛𝑜𝑐𝑢𝑙𝑢𝑚 is the volume of
inoculum applied to the apple. The percent recovery value estimates the proportion of E. coli that
were recovered off of the apple from the surface eluation process.
PCR Enumeration
Quantitative PCR was used to evaluate the effect of die-off during the inoculation process
on recovery estimates. Three inocula were prepared as described above, with high, medium, and
low inoculum concentrations of ~108, ~107, and ~106 CFU/ml, respectively. Apples were spot
inoculated as described above; approximate high, medium, and low concentrations were 107, 106,
and 105 CFU/apple, respectively. E. coli were recovered as described above. After the apples
were massaged, 50ml of eluate was transferred from the Whirl-Pak® into sterile 50ml conicals.
Conicals were centrifuged at 7000G for 15 minutes. The pellet was resuspended in 400µl of
sterile PBS. DNA was extracted using UltraClean® Microbial DNA Kit (MoBio Laboratories).
Primer and probe sequences and cycling conditions were taken from Frahm and Obst (2003).
2.3. Results
Sixty-seven apples were inoculated and analyzed for E. coli levels. Apple mass ranged
from 112.1g to 198.5g. Of the inoculated apples, E. coli were recovered from all but one sample.
E. coli were not recovered from any of the negative controls. Eleven apple samples exceeded the
upper limit of the IDEXX assay (2419.6 MPN/apple), and therefore recovery rates could not be
determined. Of the 56 apples for which the recovery rate could be calculated, the average

15
recovery was 7.65%. The mean recoveries for low, medium, and high levels of inoculation were
8.83%, 8.84%, and 3.31%, respectively. Mean, median, and the range of recovery rates are
shown in Table 2.1. Figure 2.3 shows the correlation between the inoculation level and the
percent recovery. The trend line suggests that higher inoculation levels are associated with lower
rates of recovery.
Table 2.1 – Mean, Median, and Range of Percent Recoveries for Inoculated Apples
Inoculation Level Mean Median Maximum Minimum
High (n=12) 3.31 3.03 8.10 0.20
Medium (n=22) 8.84 6.43 24.42 0.45
Low (n=22) 8.83 6.74 30.35 0.00
All samples (n=56) 7.65 4.37 30.35 0.00
Figure 2.3 – Correlation Between Inoculation and Percent Recovery
0%
5%
10%
15%
20%
25%
30%
35%
1.0E+01 1.0E+02 1.0E+03 1.0E+04 1.0E+05
Pe
rce
nt
Re
cove
ry
Inoculation Level (CFU/apple)

16
Quantitative PCR was used to evaluate the effect of die-off during the inoculation process
on recovery estimates. PCR results suggest a mean and median recovery rate of 112% and 106%,
respectively (range: 36% - 249%). Figure 2.4 depicts the percent recoveries associated with both
the IDEXX and PCR results. Unlike the IDEXX results, recovery estimations with PCR do not
appear to have a correlation with inoculation level.
Figure 2.4 – Percent Recoveries for IDEXX and PCR
2.4. Discussion
2.4.1. Method Development
A novel approach to rapid quantification of E. coli was developed using a surface elution
method and IDEXX Colilert®-18 and Qunti-tray®/2000. The rationale for focusing on E. coli
0%
50%
100%
150%
200%
250%
300%
1.0E+01 1.0E+02 1.0E+03 1.0E+04 1.0E+05 1.0E+06 1.0E+07 1.0E+08
Pe
rce
nt
Re
cove
ry
Inoculation Level (CFU/apple)
Elution Method PCR

17
quantification is three-fold. First, E. coli serve as a model organism for studies on the efficacy of
cleaning and antimicrobial treatment processes. This method could be employed in such
research. Second, fecal coliforms, and E. coli specifically, are used as indicator organisms to
estimate levels of microbial contamination in environmental media. This method could therefore
be employed to estimate the frequency and magnitude of microbial contamination on apples in
orchards due to field contamination such as contact with irrigation water and fecal material.
Finally, this method relates to concern over E. coli O157:H7 and other enterohemorrhagic E. coli
as a cause of produce-related foodborne illness. While Colilert® does not expressly indicate
presence of the O157:H7 serotype, the protocols presented here can be augmented to include
serotyping of recovered E. coli.
Compared to the conventional BAM MPN method for quantifying E. coli in food
samples, the proposed IDEXX method requires considerably less effort in the lab, and produces
reliable results in a much shorter amount of time. Hands-on time with the kit (not including
elution procedures) is less than three minutes per sample. Colilert®-18 can confirm the presence
and concentration of fecal coliforms and E. coli after 18-24 hours. Conversely, the FDA BAM 3-
tube MPN method takes a minimum of 120 hours (5 days) to confirm the presence of E. coli. The
limit of detection for the BAM MPN method is <36 MPN/100ml (Downes and Ito 2001), while
the IDEXX limit of detection is 1 MPN/100ml. The multiple steps involved in the BAM MPN
method provide multiple opportunities for technical error; the IDEXX method is straight-forward
and interpretation of the assay is less ambiguous. Additionally, the BAM MPN method may not
be ideal for sampling apples. Unlike other food matrices, apple contamination is likely not
distributed throughout the sample; the calyx, stem, and surface tend to have the highest microbial

18
contamination (Burnett et al. 2000). As such, fractioning the apple into the appropriate mass for
the BAM MPN test may not provide a representative microbial sample of the apple.
2.4.2. Discussion of Results
The results of this study suggest that the proposed method is effective at recovering E.
coli from the surface of apples. E. coli were recovered from all but one apple sample, and
recovery was possible even at lower levels of inoculation. The relatively low estimates of
recovery (an average of 7.65% overall) using the surface elution method is likely due to two
factors (a) die-off of bacteria due to drying during the inoculation process, and (b) bacterial
attachment to the apple surface or uptake into the apple that cannot be reversed in the elution
process. Regarding the latter explanation, E. coli have been shown to preferentially attach to
discontinuities in the apple surface and infiltrate the floral tube (Burnett et al. 2000), making
removal by surface elution difficult or impossible.
Die-off of E. coli during the inoculation process was investigated using quantitative PCR.
Since desiccation during the drying process may result in significant die-off of bacteria, low
recovery rates may attributed not to elution inefficiency, but to inability of the enumeration
method to show the presence of inactivated cells. Quantitative PCR was therefore employed to
estimate the total number of recovered bacteria. The results indicate that recovery of E. coli is
higher than estimated with the IDEXX system. The high estimates using PCR – which indicate
above 100 percent recovery – were likely due to aggregations of E. coli in the apple sample
eluate. Despite the high recovery estimates, the PCR results nevertheless provide insights into
the actual elution process; because PCR is able to quantify both living and dead bacteria, the
results provide an estimate of total recovered organisms regardless of die-off during inoculation.
High recovery estimates from PCR suggest that the method is more effective at recovering E.

19
coli than the IDEXX method results suggest. While the exact rate of recovery cannot be derived
from this study, we can confidently assert that the proposed surface elution method, combined
with the IDEXX Colilert®-18 and Quanti-Tray®/2000, is effective at recovering E. coli off of
apple surfaces. Low recovery rates, likely due to die-off of bacteria during the inoculation
process, are consistent with findings from a study that examined the recovery of E. coli from the
surface of inoculated ceramic tiles and stainless steel (Meschke et al. 2009). Further studies may
elucidate the efficacy of this method compared to other methods.
2.4.3. Limitations and Directions for Future Research
One concern in this study is the discrepancy in units; inoculum concentrations were
estimated in CFU, while the IDEXX method generated estimates in MPN. MPN values are
estimates of bacteria based on a statistical model, while CFU are direct counts of colonies. While
this would suggest that the values are not directly comparable, this analysis nevertheless provides
useful information on the estimated recovery of E. coli from the apple surfaces. Differences in
MPN and CFU are understood to result not from human error or laboratory procedure variability,
but are recognized as a consequence of the probabilistic basis for calculating the MPN
(Gronewold and Wolpert 2008). Conceptually, MPN can be viewed as a statistical estimate of
CFU; under this assumption, this analysis can provide an approximate estimation of the efficacy
of the novel surface elution method.
This method is not able to capture bacteria that may have penetrated the surface.
Pathogen uptake into the apple interior has been investigated as a mechanism of contamination
(Buchanan et al. 1999). Furthermore, apples are more susceptible to contamination in puncture
wounds and damaged tissue (Fatemi et al. 2006). This method is not capable of extracting
bacteria from the interior of the apples; thus, the results may not reflect the true level of apple

20
contamination. Nevertheless, the surface elution method can estimate the concentration of E. coli
on the surface. This method would therefore be useful for evaluating apple cleaning processes;
by comparing the microbial load of an untreated inoculated apple against the microbial load of
an inoculated apple that has undergone a decontamination procedure, one may estimate the
effectiveness of that cleaning process. This study provides information that may guide further
validation studies. Future research may compare this method against other methods (namely,
FDA BAM protocols) to formally validate this procedure. Furthermore, this method could be
modified to test for other microbiological contaminants.
2.5. Conclusion
While this study is limited in its ability to draw conclusions about the efficacy of this
method compared to other protocols, it nevertheless provides strong evidence to support the
continued development and validation of the proposed method.

21
3. Estimating the Health Effects of Apple Contamination
3.1. Introduction
Risk assessment is the qualitative or quantitative characterization and estimation of
potential adverse health effects associated with exposure to hazards (Haas et al. 1999). A
framework for risk assessment is provided in Figure 3.1. The conventional risk assessment
framework begins with hazard identification, followed by exposure assessment and dose-
response assessment. Exposure assessment and dose-response assessment are together used to
characterize the risk. (Nam et al., 2014)
Figure 3.1 – The Risk Assessment Framework
Hazard identification is the first step in risk assessment. This step aims to identify an
environmental hazard – such as a pathogen – and describe the human health effects associated
with the hazard. The exposure assessment determines the size and nature of the population
exposed to the environmental hazard. This includes the route, concentration, frequency, and
duration of exposure. The dose-response assessment characterizes the relationship between the
amount of hazard (dose) to which an individual is exposed and the incidence of health outcome
(response). Risk characterization integrates the exposure assessment and dose response

22
assessment to estimate the public health consequences of the given hazard. Risk characterization
includes the evaluation of variability and uncertainty in the risk assessment model (Haas et al.
1999).
The process of conducting a risk assessment is useful not only in generating a
quantitative estimate of risk, but can provide unique insights into factors that affect risk for a
certain exposure pathway. The value of a risk assessment is not solely measured by the model
outputs, but by qualitative information gained in identifying data gaps and recognizing the
relative impact of various environmental conditions. This QMRA has three aims:
A) Provide quantitative estimates of the risk of foodborne illness associated with apple
consumption, given varying orchard conditions and cleaning processes.
B) Identify specific conditions or processes that likely have the most and least consequential
impact on apple safety.
C) Evaluate the reliability of the models’ projections and identify data gaps in the literature
that, if filled, would improve the risk assessment models.
3.1.1. Sources of Microbial Contamination
Waterborne Contamination from Evaporative Cooling
Irrigation water has been identified as a source of pathogenic bacteria on fresh produce
(Steele and Odemeru 2004). An association between water quality and produce safety has been
demonstrated by epidemiological studies where outbreak-implicated pathogens were recovered
from both infected individuals and irrigation water. Contaminated irrigation water has been
identified as a likely source of contamination of E. coli O157:H7 in outbreaks associated with
lettuce (Wachtel et al. 2002; Ackers et al. 1998). While the literature is lacking similar reports
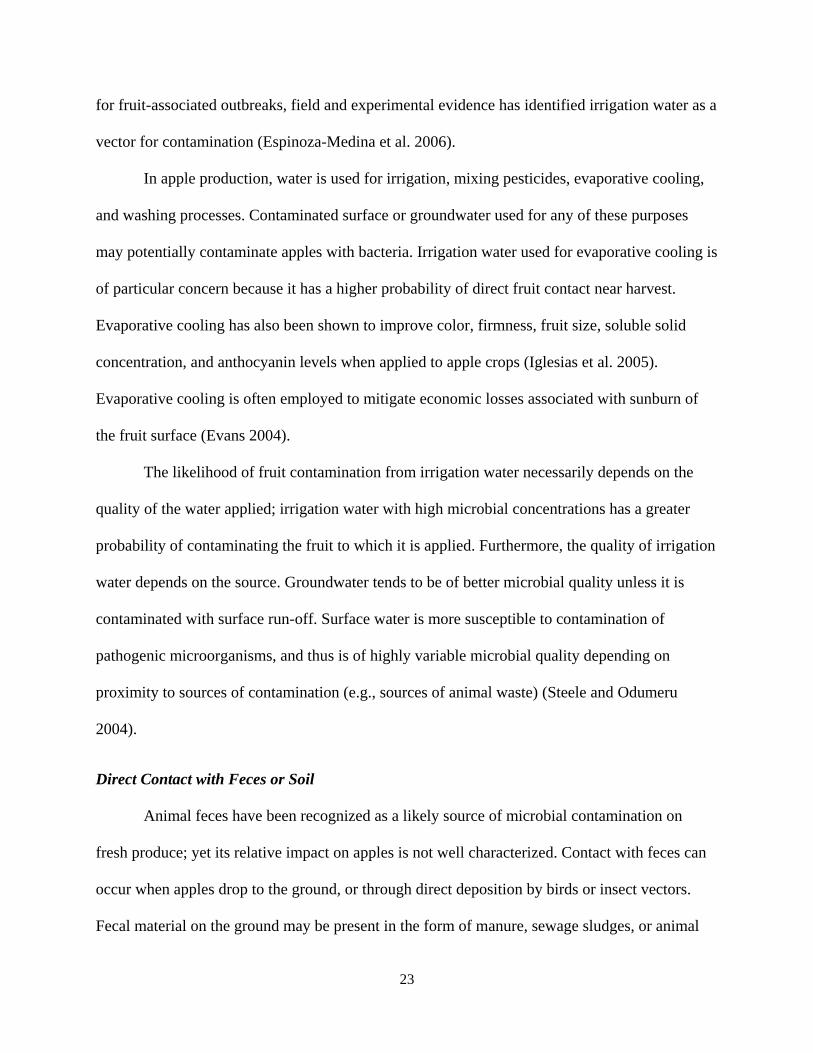
23
for fruit-associated outbreaks, field and experimental evidence has identified irrigation water as a
vector for contamination (Espinoza-Medina et al. 2006).
In apple production, water is used for irrigation, mixing pesticides, evaporative cooling,
and washing processes. Contaminated surface or groundwater used for any of these purposes
may potentially contaminate apples with bacteria. Irrigation water used for evaporative cooling is
of particular concern because it has a higher probability of direct fruit contact near harvest.
Evaporative cooling has also been shown to improve color, firmness, fruit size, soluble solid
concentration, and anthocyanin levels when applied to apple crops (Iglesias et al. 2005).
Evaporative cooling is often employed to mitigate economic losses associated with sunburn of
the fruit surface (Evans 2004).
The likelihood of fruit contamination from irrigation water necessarily depends on the
quality of the water applied; irrigation water with high microbial concentrations has a greater
probability of contaminating the fruit to which it is applied. Furthermore, the quality of irrigation
water depends on the source. Groundwater tends to be of better microbial quality unless it is
contaminated with surface run-off. Surface water is more susceptible to contamination of
pathogenic microorganisms, and thus is of highly variable microbial quality depending on
proximity to sources of contamination (e.g., sources of animal waste) (Steele and Odumeru
2004).
Direct Contact with Feces or Soil
Animal feces have been recognized as a likely source of microbial contamination on
fresh produce; yet its relative impact on apples is not well characterized. Contact with feces can
occur when apples drop to the ground, or through direct deposition by birds or insect vectors.
Fecal material on the ground may be present in the form of manure, sewage sludges, or animal

24
droppings from wild or domestic animals. Fecal material on the ground poses a greater risk to
produce grown in close proximity to the soil (e.g., lettuce, cantaloupes, and strawberries). While
fecal contamination from the ground has been recognized as a source of microbial contamination
on fresh fruits (FDA 1998), this route of pathogen introduction is generally recognized as lower
risk for hand-picked apples. Studies have shown that dropped apples are more likely to become
colonized by bacteria. Additionally, bruised apple tissue becomes more neutral in pH and sugar
content is lowered, providing conditions that are more conducive to bacterial growth (Dingman
2000). Industry practices discourage or prohibit the use of apples that have come in contact with
the ground. Yet, a survey of Wisconsin apple cider manufacturers indicated that 14% of
producers used wind-fall apples to make cider (Uljas and Ingham 2000). Outbreaks associated
with whole tree fruit have not been conclusively linked to fecal contamination; however, there is
convincing evidence that feces of infected deer may have contaminated apples used for the
manufacture of unpasteurized apple juice, leading to E. coli O157:H7 outbreaks (Garcia et al.
2006).
Apples may potentially be contaminated via direct deposition of bird feces on the fruit.
Duffy and Schaffner (2002) examined bird feces as a possible source of apple contamination.
Birds are capable of carrying and shedding E. coli O157:H7 (Wallace et al. 1997) and
Salmonella (Fenlon 1981) when an infected food source is located nearby. L. monocytogenes
carriage in birds has also been observed (Fenlon 1985), particularly in proximity to sewage
sources (Fenlon et al. 1996). While contamination of apples from bird feces is possible, there is
little evidence in the literature to support this as a key source of contamination on apple crops; no
data currently exists on the frequency at which bird feces directly lands on apples. The analysis
by Duffy and Schaffner (2002), utilizing a quantitative microbial risk assessment model,

25
estimated 3-4 log CFU contamination on 1000 hand-picked apples as a result of bird feces.
However, among other limitations, their model assumed that all feces dropped by birds would
land on the fruit.
Insects and other invertebrates have also been shown to serve as vectors of
microbiological contamination for apples in experimental settings. Insects have been shown to
carry and excrete human pathogens (Xu et al. 2003). Janisiewicz et al. (1999) demonstrated that
infected fruit flies were capable of transferring E. coli O157:H7 to exposed apple tissues.
However, little is known about the risks associated with transmission of human pathogens via
invertebrate vectors in food production systems (Bach and Delaquis 2009).
Contamination During Harvest, Cleaning, Packing, and Storage
Apple harvest and cleaning process provide a number of mechanisms by which microbial
contamination could occur. Apple contact with any surface during harvest and processing may be
viewed as a potential source of contamination. Contaminated gloves or hands used to pick the
apples could transfer bacteria from the harvester to the fruit. A survey of found that 16% of
Wisconsin apple cider producers utilized apple harvest methods in which the apples in one
storage box would contact the bottom of the storage box below (Uljas and Ingham 2000).
Furthermore, if apples are removed from boxes by immersion, rather than dumping, soil particles
from the boxes may be transferred to the wash water, and subsequently to apple surfaces.
3.1.2. Methods of Pathogen Reduction
Controls and cleaning processes in apple production are utilized to remove debris and
reduce risk of microbial contamination. Methods of pathogen control on apples include source
controls – which prevent initial contamination of the fruit – and use of antimicrobial substances
or processes following harvest.

26
Source Control
Measures that prevent contamination are often preferred over decontamination methods
because a) decontamination is typically associated with higher costs, and b) decontamination
methods may fail to inactivate all microorganisms on the fruit. Source control methods include
best management practices that prevent apple contact with surfaces or substances that may
contaminate the fruit. Examples of these practices include monitoring to restrict wild or domestic
animal access; the use of glove and hand hygiene practice during harvest; preventing the
collection of apples that have dropped to the ground; and ensuring that collection containers are
clean (Brackett 1999; Gravani 2009; Uljas and Ingham 2000). Some growers assess water quality
for irrigation and evaporative cooling water.
Antimicrobial Processes
Antimicrobial substances or processes are used to inactivate microorganisms that may
have affixed to the apple surface prior to or during harvest and prevent cross-contamination in
water systems. Most fresh produce is washed after harvest, typically involving flume transport
systems, batch tanks, or water sprays. Washing steps are important for removing soil and debris
and improving appearance. Washing can also reduce the microbial load on apples by removing
them from the surface (Annous et al. 2001). However, wash water may be reused, potentially
increasing the risk of contamination; pathogens removed from one batch during cleaning may
potentially contaminate the wash water and transfer microbes to subsequent batches of apples
(Gil et al. 2009). While wash water has been recognized as a possible source of contamination, it
has not been well characterized in industry settings.
Sanitizing compounds are often added to wash water to prevent the transmission of
microorganisms. Chlorine and peracetic acid are the most commonly used sanitizers or

27
disinfectants used in commercial apple production. Hydrogen peroxide has also been
investigated as an effective disinfectant in the apple cleaning process (Liao and Sapers 2000;
Sapers et al. 1999), but has not been adapted for commercial use to a large extent. Additionally,
wax application has been shown to reduce bacterial concentrations on apples (Kenney and
Beuchat 2002). The antimicrobial efficacy of these processes, however, relies upon numerous
factors.
Factors that Influence Antimicrobial Efficiency
The efficacy of microbial reduction using chlorine, peracetic acid, and hydrogen peroxide
depends on a variety of factors. Considerations when optimizing an antimicrobial washing
system include concentration, temperature, pH, soil load on the produce, buildup of organic
material in the wash water, characteristics of the target microbes, characteristics of the fruit, and
level of produce contamination. Because wash water is generally reused, especially for dump
tank or flume systems, organic matter accumulation will cause a decrease in the effective
concentration of the antimicrobial, contributing to an increased risk of bacterial contamination
(Herdt and Feng 2009).
Concentration: antimicrobial wash efficacy is primarily determined by the concentration of
the compound in solution. Typically, high antimicrobial concentrations correlate to high
antibacterial activity when other factors (e.g., pH, temperature, and organic content) are held
constant. However, high antimicrobial concentration may damage apple tissue, and could
result in chemical residues on the fruit.
Time: the duration of antimicrobial wash contact with the fruit influences the efficacy of
microbial reduction. Generally, increased contact times will result in increased bacterial
removal.

28
Temperature: Generally, an increase in the temperature of an antimicrobial solution is
associated with an increase in antimicrobial activity. However, higher temperatures are also
associated with a decrease in produce quality; produce industry practices have generally
shifted to cooling the washing plant to 4 oC. This temperature is additionally beneficial
because the maximum solubility of chlorine in water occurs at about this temperature (Herdt
and Feng 2009). However, apples may be cleaned under warmer conditions to facilitate wax
application.
pH: a solution’s pH can substantially affect the antimicrobial activity. An increase in pH
significantly decreases the inactivating activity of chlorine; low pH favors the formation of
hypochlorous acid (HClO), the most active species of chlorine. This is generally true for acid
sanitizers; the pH of the solution must be at or below the dissociation constant for the acid to
be effective (Herdt and Feng 2009).
Location of microbes on the apple: microbial entrapment in the calyx and stem of the apple
is significantly more difficult to overcome during wash treatments than other parts of the
apple. Sapers (2001) found that attachment of E. coli was greater in the stem and calyx areas,
and E. coli survival rates after washing were greater in these areas than elsewhere on the
apple.
Chlorine
Chlorine is the most widely used antimicrobial agent used in washes for fresh produce,
due to its efficiency, low cost, and ease of operation (Nguyen-the and Carlin 1994). Chlorine is
active against a wide spectrum of microorganisms, including viruses, acid-fast bacilli, non-acid-
fast vegetative bacteria, bacterial spores, fungi, algae, and protozoa (Trueman 1971). Free
available chlorine includes chlorine gas, hypochlorous acid, or hypochlorite ions. For raw fruits

29
and vegetables, treatments typically use chlorine concentrations around 200 mg/l at a pH of < 8.0
with a contact time of 1-2 minutes for processing (Beuchat 1996).
A study by Beuchat et al. (1998) examined the efficacy of chlorine spray application in
reducing Salmonella, E. coli O157:H7, L. monocytogenes, and other microorganisms on whole
apples. Inoculated produce was sprayed with solutions containing 200 or 2,000 ppm of chlorine
for various lengths of time. Compared to control treatment (spray with water), pathogen
reductions with chlorine ranged from 0.35 to 2.30 log CFU/cm2 (Beuchat et al. 1998).
Peracetic Acid
Peracetic acid (peroxyacetic acid or PAA) has a stronger oxidizing potential than
chlorine, chlorine dioxide, chlorous acid, and hydrogen peroxide (Herdt and Feng 2009). The
primary mechanism of disinfection for peracetic acid is oxidation. Peracetic acid has also been
thought to cause rupturing of outer cell walls by disrupting the sulfydryl and sulfur bonds in
proteins and enzymes in microbes (Block 1991). In some instances, peracetic acid is preferential
to other oxidizing agents because it has higher tolerance to organic materials; it can retain
effectiveness with higher levels of soil and organic load in the water wash (Herdt et al. 2007).
Wright et al. (2000) found that apples inoculated with E. coli O157:H7, when treated
with 80 ppm of peracetic acid for 2 minutes, reduced pathogen load by 2.6 logs. These findings
were consistent with other studies that examined bacterial reductions on cantaloupes and
honeydew melons (Park and Beuchat 1999). Using a 160 ppm concentration of peracetic acid for
15 minutes on whole apples, Wisniewsky et al. (2000) achieved a 5-log reduction in E. coli
O157:H7. In another study, Rodgers et al. (2004) observed a 4.3-log reduction in L.
monocytogenes and a 4.5-log reduction in E. coli O157:H7 when treating fresh produce with 80
ppm peracetic acid for 5 minutes.

30
Waxing
Wax is applied to fresh apples primarily to maintain the quality of the fruit. However,
waxing has been demonstrated to aid in microbial reduction as well. Kenney and Beuchat (2002)
investigated how wax chemical components affected the survival of E. coli O157:H7. Apples
were inoculated with E. coli O157:H7, then waxed, dried, and stored at 2°C. After storage, the
apples exhibited significant reductions in pathogen levels, with 3.05-log reductions after three
weeks of storage and 4.95-log reduction after six weeks of storage. By comparison, unwaxed
inoculated apples exhibited very little reduction in E. coli O157:H7 after 6 weeks of storage.
3.2. Methods
Three QMRA models were developed to estimate the health impacts associated with
three pathogens of concern: E. coli O157:H7, Salmonella spp., and Listeria monocytogenes. Risk
assessment models follow the conventional QMRA structure of hazard identification, exposure
assessment, dose-response assessment, and risk characterization (shown in Figure 3.2, detailed
explanations in subsequent sections). Exposure and dose-response assessments were populated
with data from the literature. Exposure assessments in all three models include the same sources
of contamination and cleaning processes. Models were created in Crystal BallTM with 10,000
simulations per run.
For several contamination sources and reduction/growth steps, data could not be found in
the literature to populate the model parameters. Where data was missing for given parameters,
alterative data was used. For example, studies were not found on the reduction of Salmonella on
apples during storage; proxy data from a study on the reduction of Salmonella on tomatoes
during storage was used instead. While alternative data introduces uncertainty into the model, it
was necessary to fully construct the models.

31
Figure 3.2 – Risk Assessment Framework for Provided Models
3.3. Hazard Identification
3.3.1. E. coli O157:H7
E. coli are Gram-negative, facultatively anaerobic and non-sporulating bacteria that
reside in the lower intestinal tracts of mammals. They are rod-shaped and are approximately two
microns in length and 0.5 micron in diameter. The Escherichia genus is a member of the
Enterobacteriaceae family, which includes other pathogenic bacteria, such as Salmonella,
Yersinia pestis, Klebsiella and Shigella (Garrity et al. 2005). E. coli O157:H7 is included in a
group of bacteria called enterohemorrhagic E. coli (EHEC), shiga-like toxin-producing E. coli
(STEC), hemolytic uremic syndrome–associated enterohemorrhagic E. coli (HUSEC) and
verocytotoxin- or verotoxin-producing E. coli (VTEC) (Karch, Tarr and Bielaszewska 2005).

32
Infection with E. coli O157:H7 can be entirely asymptomatic or can result in a variety of
clinical symptoms. The most common condition associated with infection is hemorrhagic colitis,
which results in stomach cramps and acute bloody diarrhea. In one study, more than 90% of
hospitalized patients with E. coli O157:H7 infection displayed these symptoms. The reported
diarrhea was severe, with two thirds of patients having at least seven bowel movements per day
(Besser et al. 1999). Although bloody diarrhea is the hallmark symptom of infection, non-
bloody watery diarrhea is common. Vomiting and nausea is also observed in about half of
infected patients (Meyers, Schulman and Kaplan 1998). The illness generally resolves in five to
seven days with no obvious sequelae. However, in 5-10% of E. coli O157:H7 cases, infection
causes hemolytic-uremic syndrome (HUS), which leads to additional complications. STEC toxin
enters the bloodstream and causes damage to the renal glomerular endothelial cells, which
express receptors for the toxin. HUS is characterized by hemolytic anemia (anemia caused by
destruction of red blood cells), uremia (acute kidney failure), and thrombocytopenia
(low platelet count) (Boyer and Niaudet 2011). Decreased urine output, increased pallor, and
mild jaundice are indicative of HUS, which typically occurs 1 to 14 days after the onset of
diarrhea. Young children constitute an overwhelming majority of HUS cases.
E. coli O157:H7 causes an estimated 73,000 illnesses in the United States annually
(Mead et al. 1999). A large proportion of E. coli O157:H7 foodborne illness outbreaks have been
linked to contaminated meat; from 1998 to 2008, 41 percent of E. coli O157:H7 foodborne
outbreaks were associated with ground beef (Rangel et al. 2005). However, foodborne outbreaks
of E. coli O157:H7 have also been linked to produce items, such as lettuce, salad, coleslaw,
melons, sprouts, and grapes. Unpasteurized apple juice and cider has been implicated in several
E. coli O157:H7 outbreaks (Hilborn et al. 2000; CDC 1996; CDC 1997; Besser et al. 1993).

33
3.3.2. Salmonella
Every year, Salmonella is estimated to cause about 1.2 million illnesses in the United
States, with about 23,000 hospitalizations and 450 deaths (Scallan et al. 2011a). Most persons
infected with Salmonella develop diarrhea, fever, and abdominal cramps 12 to 72 hours after
infection. Since Salmonella has been implicated in produce-related foodborne outbreaks, this risk
assessment will attempt to estimate the risk of illness associated with consumption of apples
contaminated with Salmonella.
Salmonella is a genus of Gram-negative rod-shaped bacteria of the family
Enterobacteriaceae. While there are only a few species of Salmonella, thousands of serovars
have been identified. Salmonellae are found worldwide in both cold-blooded and warm-blooded
organisms, and in the environment. Pathogenic Salmonella can be categorized as typhoidal and
non-typhoidal serovars, latter of which are more common. Food poisoning by Salmonella occurs
when the person ingests a dose of an infectious serovar with subsequent growth of the bacteria in
the gastrointestinal tract. Nearby cells are poisoned with endotoxins released from the
salmonellae, leading to enteritis and gastrointestinal disorder. Symptoms of Salmonella-induced
acute gastrointestinal illness (AGI) include diarrhea, fever, vomiting, and abdominal cramps.
Most cases resolve without treatment; however, severe cases may require hospitalization,
typically related to dehydration (CDC 2014).
Outbreaks of salmonellosis are typically associated with contaminated meat and poultry.
However, many outbreaks in the U.S. have been linked to fresh produce over the past five years,
including: cucumbers (2013), mangoes (2012), cantaloupe (2012, 2011 and 2008), and alfalfa
sprouts (2011, 2010, and 2009) (CDC 2014). While no outbreaks have been associated with fresh
apples, irrigation water has been identified as a possible source of microbial contamination that

34
could expose consumers to pathogens. Studies show that Salmonella can survive and grow on
plant surfaces (Lynch et al. 2009).
3.3.3. L. monocytogenes
In the United States, L. monocytogenes is estimated to cause 19-28 percent of deaths due
to foodborne illness annually (Scallan et al. 2011a; Mead et al. 1999). L. monocytogenes
infections are associated with a 92.2% hospitalization rate and a 20% case fatality rate (Mead et
al. 1999). The majority listeriosis cases occur in individuals with an underlying condition that
leads to suppression of their T-cell-mediated immunity (Farber and Peterkin 1991). The clinical
syndromes associated with adult listeriosis include mild diarrhea, meningitis, primary
bacteremia, septicemia, central nervous system infections, and endocarditis (Farber and Peterkin
1991, Marth 1988). L. monocytogenes is thought to enter the host through the intestine, then
actively multiply in the liver. Unrestricted proliferation of the pathogen in the liver may result in
prolonged low-level bacteremia, potentially leading to invasion of secondary target organs
(Vázquez-Boland et al. 2001)
L. monocytogenes is a Gram-positive, nonsporeforming, facultatively anaerobic
bacterium. It is ubiquitous and is resistant to diverse environmental conditions including low pH
and high NaCl concentrations (Rocourt et al. 2003). Additionally, L. monocytogenes is
microaerophilic and psychrophilic. It grows between -0.4 and 50ºC (Junttila et al. 1988), and
therefore can proliferate at food storage temperatures that typically inhibit microbial growth.
Dairy products have been identified as a source of L. monocytogenes, but it has also been found
in beef, pork, poultry, and seafood. In the United States, L. monocytogenes has been found on
fresh produce such as cabbage, potatoes, cucumbers, celery, lettuce, onion, leeks, watercress, and
radishes (Heisick et al 1989; Sizmur and Walker 1988).

35
3.4. Exposure Assessment
The purpose of the exposure assessment is to estimate the number of E. coli, Salmonella,
or L. monocytogenes a person would ingest when consuming an average serving of apple. This
estimated dose will factor possible sources of pathogen contamination, as well as growth and
die-off associated with various cleaning and handling processes. Figure 3.3 is a flow chart
depicting the sources of contamination and processes by which pathogen growth or die-off may
occur. All three models include the same contamination sources and pathogen reduction/growth
processes. The models are populated with microbe-specific data for environmental prevalence,
cleaning step reduction, and growth. Where data for a particular parameter was unavailable,
alternative data was used (as described in section 3.2). In some cases, it was necessary to utilize
data from surrogate microbes (e.g., populating a Salmonella model parameter with data from an
E. coli study) or proxy produce (e.g., populating a model parameter with data from a study that
looked at microbial behavior on tomatoes). The models include switches that enable the user to
turn modules “on” or “off” to customize the model configuration to include specific processes.

36
Figure 3.3 – Sources of Contamination and Reduction/Growth Processes

37
3.4.1. Sources of Contamination
Irrigation Water for Evaporative Cooling
This QMRA includes irrigation water – applied to apples during evaporative cooling – as
a potential source of microbial contamination. Evaporative cooling involves spraying the apple
orchards with water to prevent sun damage to the fruit prior to harvest. If the cooling water
contains microbes, this process could introduce pathogens onto the apples’ surface, potentially
causing illness to consumers. The concentration of microbial contamination on a single apple is
estimated by the equation:
𝐶𝑎𝑝𝑝𝑙𝑒_𝐼𝑊 = 𝐶𝐼𝑊 ∗ (𝑉𝐼𝑊𝑎𝑐𝑟𝑒
) ∗ (𝑎𝑐𝑟𝑒
𝑎𝑝𝑝𝑙𝑒𝑠) ∗ 𝐹
Where 𝐶𝐼𝑊 is the concentration of bacteria in irrigation water, 𝑉𝐼𝑊 is the volume of irrigation
water applied to an acre of orchard for evaporative cooling, and 𝐹is the fraction of applied
irrigation water that lands on apples. The irrigation water component of the model allows the
user to select between multiple levels of contamination. Pathogen concentration levels are based
on data from the literature, field data, or values that reflect “worst case” scenarios. E.coli
O157:H7 concentrations were derived from generic E. coli levels using a 1:100 ratio (FDA
2012). Distributions were applied to each value to account for variability or uncertainty. Table
3.1 provides bacterial concentration levels and respective data sources.

38
Table 3.1 – Microbial Concentration Parameters and Sources
Model Level Mean Concentration
(CFU/100ml)
Data source
E. coli O157:H7* Most likely 46.13
(lognormal distribution;
location = 0, mean = 46.13,
standard deviation = 184.8)
Meschke et al. 2014; Irrigation
water quality data, collected from
agricultural surface waters in
Washington State.
High 1,575,897
(triangular distribution;
likeliest = 1,575,897, min =
30,000, max = 6,200,000)
Payment et al (2001);
concentration of E. coli in
untreated wastewater
Salmonella Most likely 18.2
(uniform distribution; min =
0, max = 36.3)
Haley et al. 2009; Salmonella
densities estimated in waters in a
rural watershed in Georgia.
High 1,300
(normal distribution; mean =
1,300; standard deviation =
130)
Langeland 1982; Salmonella
density in untreated wastewater in
Oslo, Norway. 10-fold factor for a
conservative estimate.
L. monocytogenes Most likely 20
(normal distribution; mean =
20, standard deviation = 2)
Bernagozzi et al. 1994; Listeria
densities in surface waters.
High 700-18,000
(uniform distribution; min =
700, max = 18,000)
Bernagozzi et al. 1994; Listeria
density in untreated wastewater
* concentrations in water are for generic E. coli; 1:100 ratio applied in model to estimate E. coli
O157:H7 concentration.
Hand Contact
In the model, the user can choose between three options to incorporate contamination due
to handling: glove use, no glove use, or unknown glove use. The first two options use the logic
shown in Figure 3.4. A scenario with unknown glove use incorporates a probability into the
model, based on the likelihood that gloves are used during harvest. While no literature was found
describing glove use on apple orchards, a study by Pate and Nummer (2013) found that 66.6% of
workers used gloves on USDA Good Agricultural Practice (GAP) certified farms.

39
Figure 3.4 – Flow Chart for Glove and Hand Contamination
No studies in the literature were found that examined the density of E. coli O157:H7,
Salmonella, or L. monocytogenes on apple picker hands. Data was drawn from a study by
Materon et al. (2007) that examined microbial loading on the hands of cantaloupe pickers in
Mexico. Since melon harvest involves direct contact with soil, the values likely represent a
highly conservative estimate of hand contamination in apple picking. Since data could not be
found for glove contamination, the same data was used for both glove and hand contamination.
Transfer rates between glove/hand and fruit were taken from a study that examined Salmonella
transfer between gloves/hands and green bell peppers (Jimenez et al., 2007).
Bird Feces
Fecal contamination from birds has been discussed as a possible source of apple
contamination (Beuchat and Ryu 1997). Even though there is limited evidence to demonstrate

40
that bird feces pose a high risk to the microbial quality of apple crops, this model incorporates a
module that predicts the level of apple contamination due to bird feces. The level of
contamination is the product of the pathogen density in feces and the mass of feces. The
probability that a given apple is contaminated incorporates the number of birds per acre,
defecations per bird per day, number of days that the apple is growing in the orchard, ratio of
apple area to the acre of orchard, and a 10-fold factor (for the increased likelihood that a bird
would perch on an apple tree).
Mass of feces and frequency of defecation was drawn from Duffy and Schaffner (2002).
Their QMRA examined E. coli O157:H7 contamination on apples from bird droppings and
ground manure. In their study, the mass of gull feces was derived from data on broiler chickens
(Hermanson et al. 2001) and E. coli O157:H7 concentration in bird feces was estimated using
data from cow feces (Zhao et al. 1995). Fecal Salmonella densities were taken from Fenlon
(1981). The concentration of L. monocytogenes in feces was derived from ruminant shedding
rates (Fenlon et al. 1996). Log decreases in E. coli O157:H7, Salmonella, and L. monocytogenes
in the feces were taken from Himathongkham and Riemann (1999).
Ground Contact
While industry best management practices discourage collection of fallen apples, this
model includes a module that introduces soil contact as a possible source of apple contamination.
Transfer rates of bacteria from soil to apples were based off of a study by Guo et al. (2002) that
examined tomato contamination from soil. Data from Guo et al. was used to generate a transfer
parameter that estimates the concentration on a downed apple given a concentration in the soil.
The models enable the user to select between two soil contamination levels: most likely and
high. Most likely generic E. coli concentrations in soil were taken from Ishii et al. (2006) and

41
used to estimate E. coli O157:H7 concentration with the 1:100 ratio (FDA 2012). Most likely L.
monocytogenes concentration in the soil was taken from Dowe (1997) and Salmonella soil
concentration was taken from Trimble et al. 2013. High soil concentrations were derived from
studies that examined sewage sludge. These high levels simulate worst-case scenarios in which
soils are heavily contaminated. Worst-case generic E. coli concentrations were taken from
Dudley et al. 1980. Krzyzanowski et al. (2014) found a maximum of 12 MPN/g of Salmonella in
sewage sludge; to provide a more conservative worst-case scenario, high Salmonella soil
concentrations were estimated to be the same as wastewater (Langeland 1982).
Fungicide Drench Application
After apples are picked, the collection bins may be drenched in fungicide. If mixed with
contaminated water, the fungicide may serve as a source of pathogenic bacteria. The QMRA
models include a module for fungicide application that incorporates either (a) the bacterial
concentration specified in the irrigation water module, or (b) an alternative water contamination
level. The alternate concentration may be utilized if water for the fungicide is drawn from a
separate source (e.g., groundwater). It was assumed that 10ml of fungicide would coat the apple.
3.4.2. Cleaning Processes
Modules for apple storage, cleaning, and waxing processes were included in the models.
Data on log reductions or growth was pulled from the literature and used to populate the models.
Table 3.2 lists the reduction or growth values and respective sources associated with each
cleaning step. In many cases, pathogen-specific data was not available; it was necessary to
assume that E. coli O157:H7, Salmonella, and L. monocytogenes would exhibit similar responses
to treatment processes. Many studies on the efficacy of decontamination treatments show similar

42
log reductions in Salmonella, Listeria, and E. coli when subject to uniform treatment conditions
(Neal et al. 2012; Ruiz-Cruz et al. 2007; Tapp III et al. 2013; Yang et al 2009).
Table 3.2 – Distributions and Sources of Model Parameters for Cleaning Process
Cleaning Step Model Log Reduction or
Growth (log cfu)
Source and Notes
Pre-cleaning
storage
(reduction)
E. coli O157:H7 Triangular distribution
(likeliest = 0.13 per day,
min = 0.08 per day, max
= 0.16 per day)
Janes et al. 2002: examined the
reduction of E. coli O157:H7 on
inoculated apples stored at 4°C
Salmonella Triangular distribution
(likeliest = 0.28 per day,
min = 0.00 per day, max
= 1.00 per day)
Guo et al. 2002: examined the
survival of Salmonella on
tomatoes stored at 20°C
L. monocytogenes No reduction Conway et al. 2000: found no
significant reduction of L.
monocytogenes on inoculated
apple slices
Pre-cleaning
storage
(growth)
E. coli O157:H7 and
Salmonella
Triangular distribution
(likeliest = 0.83 per day,
min per day = 0, max per
day= 1.16)
Janisiewicz et al. 1999:
examined the growth of E. coli
O157:H7 in damaged apple
tissue at 24°C
L. monocytogenes No growth Conway et al. 2000: found no
significant growth of L.
monocytogenes on inoculated
apple slices
Chlorine dunk
tank
(reduction)
All models Triangular distribution
(likeliest = 3.0, min = 0.5,
max = 4.9)
Sapers et al. 1999, Wisniewsky
et al. 2000, Rodgers et al. 2004:
studies investigated rates of
pathogen reduction on
inoculated apples in 200 ppm
chlorine water
Commercial
cleaners
(reduction)
All models Toggle between two
cleaners (0.5 probability
each). Cleaner A: triangle
distribution (likeliest =
0.27, min = 0, max =
0.85); Cleaner B: triangle
distribution (likeliest =
0.47, min = 0, max =
0.99)
Annous et al. 2001: examined a
variety of washing agents and
their efficacy at removing E. coli
from inoculated apples

43
Cleaning Step Model Log Reduction or
Growth (log cfu)
Source and Notes
PAA spray bar
(reduction)
All models Triangular distribution
(likeliest = 1.12, min =
0.76, max = 1.42)
Wang et al. 2006: examined the
E. coli O157:H7 population
reduction on fresh-cut apples
after treatment with PAA
Chlorine spray
bar (reduction)
E. coli O157:H7 Triangular distribution
(likeliest = 0.75, min =
0.68, max = 0.83)
Beuchat et al 1998: examined
the efficacy of chlorinated water
spray in killing E. coli O157:H7
on apples.
Salmonella Triangular distribution
(likeliest = 0.75, min =
0.38, max = 1.15)
Beuchat et al 1998: examined
the efficacy of chlorinated water
spray in killing Salmonella on
apples.
L. monocytogenes Triangular distribution
(likeliest = 0.84, min =
0.73, max = 0.95)
Beuchat et al 1998: examined
the efficacy of chlorinated water
spray in killing L.
monocytogenes on apples.
Water rinse
(reduction)
All models Triangular distribution
(likeliest = 0.57, min =
0.11, max = 0.99)
Annous et al. 2001: examined a
variety of washing agents and
their efficacy at removing E. coli
from inoculated apples
Drying
(reduction)
All models Triangular distribution
(likeliest = 0.27, min =
0.19, max = 0.30)
Laboratory data from method
evaluation in Chapter 2.
Reductions due to drying were
assumed to be half of difference
between inoculation and
recovery.
Waxing
(reduction)
E. coli O157:H7 and
L. monocytogenes
Triangular distribution
(likeliest = 0.32, min = -
0.28, max = 1.22)
Kenney and Beuchat 2002:
examined the effect of waxing
on Salmonella-inoculated apples
Salmonella Triangular distribution
(likeliest = 0.40, min = -
0.11, max = 0.92)
Kenney and Beuchat 2002:
examined the effect of waxing
on Salmonella-inoculated apples
Post-cleaning
storage
(reduction)
E. coli O157:H7 Triangular distribution
(likeliest = 0.13 per day,
min = 0.08 per day, max
= 0.16 per day)
Janes et al. 2002: examined the
reduction of E. coli O157:H7 on
inoculated apples stored at 4°C
Salmonella Triangular distribution
(likeliest = 0.28 per day,
min = 0.00 per day, max
= 1.00 per day)
Guo et al. 2002: examined the
survival of Salmonella on
tomatoes stored at 20°C

44
Cleaning Step Model Log Reduction or
Growth (log cfu)
Source and Notes
L. monocytogenes No reduction Conway et al. 2000: found no
significant reduction of L.
monocytogenes on inoculated
apple slices
Post-cleaning
storage
(growth)
E. coli O157:H7 and
Salmonella
Triangular distribution
(likeliest = 0.83 per day,
min per day = 0, max per
day= 1.16)
Janisiewicz et al. 1999:
examined the growth of E. coli
O157:H7 in damaged apple
tissue at 24°C
L. monocytogenes No growth Conway et al. 2000: found no
significant growth of L.
monocytogenes on inoculated
apple slices
3.5. Dose-Response Assessment
This dose-response assessment was conducted to describe the relationship between the
number of E. coli O157:H7, Salmonella spp., and L. monocytogenes consumed and the
likelihood of gastrointestinal illness. A dose-response model is, in essence, a mathematical
function where the input is a dose of contaminant and the output is the probability of particular
adverse health effect. Two key features differentiate microbial hazards from other health risks
such as chemicals. First, a population of humans exposed to microbial hazards will necessarily
receive a distribution of doses. Second, infectious microorganisms are able to propagate within a
host. Given these factors, Haas et al. (1999) posit that there are two biologically-plausible dose-
response models for microbiological hazards: exponential and beta-Poisson.
The exponential dose-response model is the simplest dose-response model. This model
assumes that (a) the distribution of organisms between doses is random, (b) each organism has an
independent and identical probability of survival, and (c) that one organism is sufficient to cause
infection (Haas et al. 1999). If the probability of survival is represented by parameter k, the
probability of response is given by:

45
𝑃(𝑟𝑒𝑠𝑝𝑜𝑛𝑠𝑒) = 1 − exp(−𝑘 ∗ 𝑑𝑜𝑠𝑒)
The exponential model assumes that the pathogen-host survival probability is constant. The beta-
Poisson model instead assumes non-constant survival and infection probabilities, where the
probabilities of survival, k, are given by the beta distribution. Given a median infectious dose,
N50, and a slope parameter of the equation, α, the probability of response in the beta-Poisson
model is:
𝑃(𝑟𝑒𝑠𝑝𝑜𝑛𝑠𝑒) = 1 − [1 +𝑑𝑜𝑠𝑒
𝑁50(21 𝛼⁄ − 1)]
−𝛼
or 𝑃(𝑟𝑒𝑠𝑝𝑜𝑛𝑠𝑒) = 1 − [1 +𝑑𝑜𝑠𝑒
𝛽]−𝛼 where 𝛽 =
𝑁50
21 𝛼⁄ −1
In most studies, the maximum likelihood estimation (MLE) method is used to fit dose response
data to the models described above by minimizing the deviance, as described by various authors
(Haas 1983; Haas et al. 1993; Regli et al. 1991; Teunis et al. 1996). Data sources for dose-
response models include human feeding studies, animal experiments, and outbreak data. Each of
these sources presents unique challenges to dose-response modelling. For example,
epidemiological outbreak data introduces a high level of uncertainty, while animal studies may
not reflect the pathogen-host interactions that occur in humans. To provide more robust estimates
of illness given a dose of bacteria, multiple dose-response models are used for each risk
assessment model.
3.5.1. E. coli O157:H7
Five previously described dose response models were utilized to estimate the likelihood
of gastrointestinal illness given ingestion of E. coli O157:H7. Dose-response model parameters
from E. coli O157:H7 models are provided in Table 3.3; model curves are depicted in Figure 3.5.
The first model was taken from Haas et al. (2000). Since there are no known human dose-

46
response studies for E. coli O157:H7, the authors analyzed animal dose-response data. Pai et al.
(1986) examined diarrheal disease in infant rabbits after oral inoculation of E. coli O157:H7.
Using the MLE method, Haas et al. (2000) generated parameters for both exponential and beta-
Poisson models. Using a goodness of fit test, the authors found that the beta-Poisson model
provided an acceptable fit to the data, while the exponential model did not. For validation, the
model was compared against data from two human E. coli O157:H7 outbreaks. In both
outbreaks, the predicted concentrations came close to the observed concentrations.
The second E. coli O157:H7 dose-response model is taken from Powell et al. (2000).
Because there are no human feeding studies for E. coli O157:H7, Powell et al. utilized data from
two enteropathogenic E. coli (EPEC) human feeding studies. The pooled data from Bieber et al.
(1998) and Levine et al. (1978) yield a beta-Poisson model that is not statistically different from
the fits provided by the individual models.
The third dose-response model is taken from Teunis et al. (2004). In 1996, a foodborne
outbreak occurred at an elementary school in Morioka city, Japan. Stool samples from pupils and
teachers implicated E. coli O157:H7 as the infectious agent. Teunis et al. used data from this
outbreak to generate a dose-response model. A Markov chain Monte Carlo method (Metropolis-
Hastings algorithm) was used to generate posterior mode parameter values. The proposed beta-
Poisson model was compared to other E. coli O157:H7 dose-response models using a likelihood
ratio test.
The fourth E. coli O157:H7 dose-response model was taken from Strachan et al. (2005).
This analysis pulled data from eight different E. coli O157:H7 outbreaks, linked to both
foodborne and environmental sources. Using the MLE method to fit the data, the authors
generated exponential, and beta-Poisson dose-response models. The overall best fit was the exact

47
beta-Poisson with beta-binomial likelihood. While the fit is not statistically significant, the
authors attribute this to the high variation in data obtained from outbreaks, compared to
controlled feeding studies. Strachan et al. found that previous E. coli O157:H7 dose-response
models – which used Shigella as a surrogate – were contained within confidence intervals of the
proposed model.
The final E. coli O157:H7 dose-response model is taken from Danyluk and Schaffner
(2011), which is based on a model by Cassin et al. (1998). With the assumption that Shigella
dysenteriae exhibits similar virulence to E. coli O157:H7, Cassin et al. used data from three S.
dysenteriae human feeding studies to generate a beta-binomial dose-response model. Danyluk
and Schaffner (2011) converted the beta-binomial model into a simplified beta-poisson model.
Figure 3.5 – E. coli O157:H7 Dose-Response Model Curves
0
0.1
0.2
0.3
0.4
0.5
0.6
0.7
0.8
0.9
1
1E-02 1E+01 1E+04 1E+07 1E+10 1E+13 1E+16
Pro
bab
ility
of
Illn
ess
Dose (CFU)
Haas et al. 2000 Powell et al. 2000
Teunis et al. 2004 Strachan et al. 2005
Danyluk and Schaffner 2011

48
Table 3.3 – E. coli O157:H7 Dose-Response Model Parameters
Study Model α β
Haas et al. 2000 Beta-Poisson 0.49 1.91x10⁵
Powell et al. 2000 Beta-Poisson 0.22 8.7x10³
Teunis et al. 2004 Beta-Poisson 0.050 1.001
Strachan et al. 2005 Beta-Poisson 0.0565 2.5487
Danyluk and Schaffner 2011 Beta-Poisson 0.267 229.2928
3.5.2. Salmonella spp.
Four previously described dose-response models were utilized to estimate the likelihood
of illness due to ingestion of Salmonella on contaminated apples. Dose-response model
parameters from Salmonella models are provided in Table 3.4; model curves are depicted in
Figure 3.6. Fazil (1996) analyzed human feeding trial data and fit beta-Poisson, lognormal, and
exponential dose-response models. Feeding trial data was taken from McCullough and Eisele
(1951a, 1951b), in which healthy males from a penal institution were fed non-typhoid
Salmonella. Five different serotypes were used, including S. Anatum, S. Meleagridis, S.
Newport, S. Bareilly, and S. Derby. Fazil (1996) proposed that the beta-Poisson model best
described the Salmonella dose-response relationship. Furthermore, it was reported that all the
serotypes could be adequately described using a single beta-Poisson dose-response curve.
FAO/WHO (2002) posit a modified beta-Poisson model based on the work of Fazil
(1996). Since the original model did not consider the effect of multiple feedings on the dose-
response relationship, FAO/WHO used only naïve subject data. Subjects from McCullough and
Eisele (1951a, 1951b) who received multiple doses were dropped from the analysis. Using the
MLE method to fit the data, a beta-Poisson model was proposed.
The third dose-response model employed in this QMRA is the USDA (1998) model for
Salmonella Enteritidis. USDA initially fitted a beta-Poisson model to data from Salmonella

49
feeding trails in McCullough and Eisele (1951a, 1951b). However, this model did not reflect the
higher attack rate and low doses observed in S. Enteritidis epidemiological outbreak data. USDA
instead based their dose-response model on Shigella dysenteriae, using human feeding trial data
from Levine et al. (1973). A beta-Poisson model was fit to the data, and comparison to
Salmonella epidemiological outbreak data showed that the S. dysenteriae dose-response model
was preferable to the prior model based on Salmonella feeding studies. To introduce uncertainty
in the model, USDA characterized the beta parameter as a normal distribution. While models
were created for both susceptible and normal populations, only the model for the normal
population is utilized here.
The final dose-response model is drawn from Latimer et al. (2001). This study proposed a
weighted composite dose-response model which incorporated three pathogenicity-specific
models to account for uncertainty in Salmonella virulence. Lack of human feeding data at low
dose levels led Latimer et al. to use S. dysenteriae 1 as a proxy for low-dose Salmonella strains.
Exponential, two-subpopulation exponential, and beta-Poisson models were proposed at each
pathogenicity level (high, moderate, and low). The beta-Poisson models fit well for all three
pathogenicity levels. While Latimer et al. incorporated multiple models into the weighted
composite dose-response model, only the high pathogenicity beta-Poisson model is utilized here.
Table 3.4 – Salmonella Dose-Response Model Parameters
Study Model α β
Fazil 1996 Beta-Poisson 0.3126 2885
FAO/WHO 2002 Beta-Poisson 0.4047 5587
USDA 1998 Beta-Poisson 0.2767 Normal(μ:21.159, σ:20,
min:0, max:60)
Latimer et al. 2001 Beta-Poisson 0.157 9.17

50
Figure 3.6 – Salmonella Dose-Response Model Curves
3.5.3. L. monocytogenes
Dose-response models for L. monocytogenes were taken from Haas et al. (1999) and
Buchanan et al. (1997). The former study utilized animal data, in which Swiss conventional
female OF1 mice were exposed to L. monocytogenes 10401 (Audurier et al. 1979) and C57B1/6J
mice were exposed to L. monocytogenes F5817 (Golnazarian et al. 1989). In both animal studies,
infection was verified through detection of viable bacteria in the liver, lungs, spleen, brain, or
kidneys. Data for L. monocytogenes strains were pooled together and analyzed using the MLE
method. The beta-Poisson model was determined to be a better fit. In the case of the pooled
F5817 dose-response model, pooled trial data was shown to improve the model. Buchanan et al.
(1997) proposed a dose-response model based on epidemiologic data. Examining consumption
rates of smoked fish, observed levels of L. monocytogenes in samples of the food matrix, and
incidence of listeriosis in consumers, Buchanan et al. derived an exponential dose-response
0
0.1
0.2
0.3
0.4
0.5
0.6
0.7
0.8
0.9
1
1E-03 1E+00 1E+03 1E+06 1E+09 1E+12
Pro
bab
ility
of
Illn
ess
Dose (CFU)
Fazil 1996 FAO/WHO 2002 USDA 1998 Latimer 2001

51
model. Dose-response model parameters from L. monocytogenes models are provided in Table
3.5; model curves are depicted in Figure 3.7.
Table 3.5 – L. monocytogenes Dose-Response Model Parameters
Study Model α N50 k
Haas et al. 1999 (10401) Beta-Poisson 0.17 2.1x10⁶ -
Haas et al. 1999 (F5817) Beta-Poisson 0.25 2.76x10² -
Buchanan et al 1997 Exponential - - 1.79x10⁻¹⁰
Figure 3.7 – L. monocytogenes Dose-Response Model Curves
3.6. Results
3.6.1. Model Simulations
Models were run under four scenarios (A-D), each with increasing likelihood of
contamination and/or ineffective pathogen reduction processes. Scenarios are described in Table
3.6. Scenario A is an expected situation for hand-picked apples. The ground contamination
0
0.1
0.2
0.3
0.4
0.5
0.6
0.7
0.8
0.9
1
1E-02 1E+01 1E+04 1E+07 1E+10 1E+13 1E+16
Pro
bab
ility
of
Illn
ess
Dose (CFU)
Haas et al. 1999 (10401) Haas et al. 1999 (F5817) Buchanan et al. 1997

52
module was turned off, as best management practices discourage the harvest of fallen apples.
Concentrations of pathogens in irrigation water and fungicide were set at “most likely” levels.
PAA, rather than chlorine, was used in the spray bar. Since pathogen growth during storage is
associated with tissue damage or puncture on the apples, this module was turned off with the
assumption that damaged apples would be removed during sorting processes. Scenario B
included soil contact as a source of contamination, where the probability that an apple is
retrieved from the ground is 1:100. This scenario also included pathogen growth during storage
and chlorine, instead of PAA, in the spray bar.
Table 3.6 – Model Components Utilized in Four Scenarios
Module Scenario A
Best case
Scenario B
Good case
Scenario C
Worst case:
high contamination
Scenario D
Worst case:
no cleaning
Irrigation water YES
(low)
YES
(low)
YES
(high)
YES
(low)
Ground contact NO
YES
(low)
YES
(high)
YES
(low)
Hand/glove contact YES YES YES YES
Bird feces NO YES YES YES
Fungicide application YES
(low)
YES
(low)
YES
(high)
YES
(low)
Pre-cleaning storage
(reduction) YES YES YES NO
Pre-cleaning storage
(growth) NO YES YES YES
Dump tank YES YES YES NO
Commercial Cleaners YES NO YES NO
PAA Spray Bar YES NO YES NO
Chlorine Spray Bar NO YES NO NO
Water rinse YES YES YES NO
Drying YES YES YES NO
Waxing YES YES YES NO
Post-cleaning storage
(reduction) YES YES YES NO
Post-cleaning storage
(growth) NO NO YES YES

53
Scenario C and D represent “worst case” scenarios. Scenario C is a situation in which
high levels of contamination occur through both irrigation water and soil. Pathogen
concentrations were based on untreated wastewater and sewage sludge for water and soil,
respectively. Cleaning steps were turned on in Scenario C. In scenario D, pathogen
concentrations in soil and water were set at lower levels, but all reduction steps were turned off.
Table 3.6 illustrates scenario module components.
3.6.2. Risk Characterization
The risk characterization incorporates the exposure assessment and dose-response
components of the model to estimate the risks of illness associated with the consumption of an
apple. This calculates the probability of illness, given a dose of infectious agent, using the beta-
Poisson or exponential dose-response model given in Section 3.5. All models were run with a
toggle between all dose-response models. Tables 3.7, 3.8, and 3.9 provide the model outputs for
E. coli O157:H7, Salmonella, and L. monocytogenes, respectively.
Table 3.7 – E. coli O157:H7 Model Outputs Under Four Scenarios
Scenario A Scenario B Scenario C Scenario D
Dose
(CFU/serving)
Mean
Median
5th Percentile
95th Percentile
5.21x10⁻⁸
6.04x10⁻¹¹
1.37x10⁻¹³
7.85x10⁻⁸
1.13x10⁻⁶
6.99x10⁻¹⁰
1.31x10⁻¹²
1.15x10⁻⁶
58.3
0.0177
2.66x10⁻⁵
24.9
1,286
0.0861
1.14x10⁻⁴
343
Probability of
Illness
Mean
Median
5th Percentile
95th Percentile
6.82x10⁻¹⁰
4.68x10⁻¹⁴
0
4.67x10⁻¹⁴
2.29x10⁻⁸
4.99x10⁻¹³
0
5.30x10⁻⁹
0.0104
1.39x10⁻⁵
1.05x10⁻⁹
0.0665
0.0262
7.32x10⁻⁵
4.27x10⁻⁹
0.18

54
Table 3.8 – Salmonella Model Outputs Under Four Scenarios
Scenario A Scenario B Scenario C Scenario D
Dose
(CFU/serving)
Mean
Median
5th Percentile
95th Percentile
9.79x10⁻⁵
1.44x10⁻⁷
1.58x10⁻¹⁰
6.30x10⁻⁵
3.60x10⁻³
3.99x10⁻⁶
4.94x10⁻⁹
1.60x10⁻³
0.951
3.27x10⁻⁴
1.48x10⁻⁶
0.343
4.88x10⁶
633.0
4.39
1.13x10⁶
Probability of
Illness
Mean
Median
5th Percentile
95th Percentile
1.34x10⁻⁶
1.57x10⁻¹⁰
6.41x10⁻¹⁴
2.54x10⁻⁷
3.29x10⁻⁵
4.34x10⁻⁹
1.99x10⁻¹²
6.83x10⁻⁶
1.91x10⁻³
4.40x10⁻⁷
3.80x10⁻¹⁰
1.19x10⁻³
0.370
0.314
7.98x10⁻⁴
0.908
Table 3.9 – L. monocytogenes Model Outputs Under Four Scenarios
Scenario A Scenario B Scenario C Scenario D
Dose
(CFU/serving)
Mean
Median
5th Percentile
95th Percentile
6.14x10⁻⁶
2.80x10⁻⁷
6.57x10⁻⁹
1.89x10⁻⁵
0.0421
4.50x10⁻⁷
6.99x10⁻⁹
0.0539
0.0116
1.42x10⁻⁵
7.73x10⁻⁸
0.0147
53.1
3.20x10⁻³
1.05x10⁻³
430.9
Probability of
Illness
Mean
Median
5th Percentile
95th Percentile
1.88x10⁻⁹
2.31x10⁻¹⁴
0
3.94x10⁻⁹
1.14x10⁻⁵
8.57x10⁻¹⁴
0
5.13x10⁻⁸
3.29x10⁻⁶
1.86x10⁻¹²
1.11x10⁻¹⁶
6.31x10⁻⁷
7.10x10⁻³
3.26x10⁻¹⁰
2.65x10⁻¹³
6.41x10⁻⁵
3.6.3. Sensitivity Analysis
A tornado analysis was performed to determine which parameters in each model had the
greatest impact on the outcome projection (probability of illness). This analysis utilized built-in
features of Crystal BallTM to calculate sample correlation coefficients. Sample correlation
coefficients provide a measure of linear association between two variables, and are used in
sensitivity analysis to evaluate the relative effect of model input variables on outcomes. A
tornado analysis was performed on the E. coli O157:H7 model. Graphical outputs of the analysis
are shown in Appendix A. From this analysis, the most influential input variables were the log
increase per day in storage and log reduction from dump tank in the E. coli O157:H7 model. The

55
most sensitive variable of the Listeria model was the concentration of Listeria in bird feces.
Indeed, it was assumed that Listeria levels in feces – unlike E. coli or Salmonella – would not
decrease over time (Himathongkham and Riemann 1999).
3.7. Discussion
3.7.1. Estimation of Foodborne Illness Risks
Under the best case scenario, the median risk of foodborne illness associated with apple
consumption was estimated at 4.68x10⁻¹⁴, 1.57x10⁻¹⁰, and 2.31x10⁻¹⁴ for E. coli O157:H7,
Salmonella, and L. monocytogenes, respectively. Mean probabilities of foodborne illness were
estimated at 5.21x10⁻⁸ for E. coli O157:H7, 1.34x10⁻⁶ for Salmonella, and 1.88x10⁻⁹ for L.
monocytogenes. These estimates suggest that there is a low risk of foodborne illness for healthy
adults when consuming apples. This is consistent with the low occurrence of foodborne
outbreaks associated with whole apples. The true probability of illness may even be lower, as the
models were intentionally developed to be health protective (e.g., assuming that all irrigation
water applied for evaporative cooling would have some pathogen load). The large differences
between mean and median probabilities of illness suggest a highly skewed distribution of model
outputs. When estimating the probability of illness associated with a single consumption event, it
may be appropriate to use the median of the distribution. Alternatively, when considering the
population risk, the mean may be a more appropriate value to examine.
Under worst-case scenarios, the risk of foodborne illness was estimated to be
considerably greater. However, these worst-case scenarios are unlikely to occur in reality;
assumptions in the worst-case models included contamination via numerous sources and/or
significant failure of cleaning processes to remove pathogens from apple surfaces.
Contamination levels such as those used in the worst case scenarios (e.g., irrigation water with

56
contamination equal to untreated wastewater) are extremely unlikely to occur in apple orchards.
However, the worst case scenarios provide valuable insights into the relative impact of
contamination sources and cleaning steps on the probability of illness. The model outputs for
scenario C (high contamination with cleaning steps on) were greater than model outputs for
scenario D (low contamination with cleaning steps off). For Salmonella and L. monocytogenes,
the probability of illness estimated under scenario C and scenario D differed by several orders of
magnitude. This suggests that the effectiveness of cleaning steps has a greater impact on the
microbial quality of apples than orchard conditions. This finding has potential implications for
the selection of appropriate policies to address microbial contamination of apples.
3.7.2. Limitations and Directions for Future Research
The models provided here provide insight into the sources of apple contamination and the
cleaning processes used to reduce pathogen loads. However, there are several assumptions and
limitations that challenge the certainty of the models’ estimates. The models are largely limited
by missing data; more robust datasets could provide more reliable risk estimates. In several
instances, model parameters were populated with data from surrogate microorganisms,
alternative environmental conditions, and studies that examined other types of produce. Minimal
data was found that adequately characterized orchard conditions, and alternative data was used.
For example, while birds are observed in apple orchards, the literature lacks data that
characterizes bird behaviors, frequencies of defecation, and carriage of pathogenic microbes.
Studies that survey the microbiological ecology of water, soil, and air in and around apple
orchards would enhance these models.
While the literature is robust with studies that provide data on the efficacy of various
antimicrobial processes for apples, experimental studies that examine these processes may not

57
reflect the actual microbial reduction and growth rates observed in packinghouses. Future
research may seek to better understand the sources of contamination and cleaning processes that
inform the microbial safety of fresh apples. Furthermore, as not all packinghouses utilize the
cleaning steps included in the model, robust industry data on the use of these processes would
enhance the reliability of model outputs.

58
4. Food Safety Policy: Values, Processes, and the Role of Science
Scientific research in the area of food safety both guides – and is guided by – policy
decisions. Yet, allusions to policy implications in scientific publications are typically brief and
lack substantive discussions about the specific policy processes in which the research findings
may apply. Using broad frameworks, I aim to deconstruct United States food safety policy
processes to answer the question: what is the role for this research in public policy? Specifically,
this chapter will:
a) Review the history of food safety policy in the United States
b) Examine the values, institutions, and processes that guide food safety policy
c) Posit ways that study findings from previous chapters may be employed in policy processes
4.1. United States Food Safety Policy: Past and Present
While current food safety policies are implemented at the international, national, state,
and local levels, the broadest and farthest-reaching policies in the United States have historically
been implemented by the Federal Government. A timeline of federal food safety legislation and
noteworthy agency changes is provided in Appendix B. Federal regulation of food safety
originated in the Department of Agriculture (USDA), which was formed in 1862 with a mission
to aid and promote American agriculture (Merrill and Francer 2000). The earliest food safety
legislation, which aimed to prevent the importation of adulterated teas, went into effect in 1883
(Wilson 1942). The first statute aimed at regulation of domestic food was passed in 1886; it
taxed margarine and sought to regulate cheese and butter imitations. While seemingly intended
to protect consumers, the statute was largely a form of economic protectionism; the legislation
was designed to protect dairy farmers from the growing threat of margarine producers (Merrill
and Francer 2000).

59
The next significant food safety laws in the United States were the Pure Food and Drug
Act (PFDA) and the Meat Inspection Act (MIA), both passed in 1906. The PFDA aimed to
address the introduction of adulterated foods into interstate commerce. The MIA established a
program of systematic inspection of meat processing facilities. The passage of both pieces of
legislation was aided significantly by the publication of Upton Sinclair’s The Jungle, which
exposed the alarming practices of the Chicago meat packing industry. Furthermore, a coalition
that included the American Medical Association, the American Public Health Association, labor
unions, and consumer groups formed to support the legislation, which was opposed by food
producers (Wiley 1929). Implementation of the PFDA and MIA was delegated to the USDA’s
Bureau of Chemistry and Bureau of Animal Industry, respectively (Herrick 1944).
Over the next 80 years, several other pieces of legislation were passed in the United
States. These included the Grain Standards Act of 1916, the Filled Milk Act of 1923, the Food
Drug, and Cosmetic Act of 1938, The Fungicide, Insecticide, and Rodenticide Act of 1947, the
Poultry Products Inspection Act of 1957, the Fair Packaging and Labeling Act of 1967, the Egg
Products Inspection Act of 1970, and the Toxic Substances Control Act of 1976 (Johnson 2014).
Throughout this period, numerous changes in the federal bureaucracy occurred. The Food, Drug,
and Insecticide Administration (FDIA), created within the USDA in 1927, became the Food and
Drug Administration (FDA) in 1930 and was transferred to the Federal Security Agency in 1940.
The FDA was later transferred to the Department of Health, Education, and Welfare – the
predecessor of the current Department of Health and Human Services. Food safety policy in the
20th century therefore represents not only an increasing role of federal government in food safety,
but a continually-changing landscape of institutions and ideologies.

60
Currently, United States food safety policies are implemented at the national, state, and
local level. In the Federal Government, responsibilities for food safety fall primarily on the Food
and Drug Administration (FDA) and the U.S. Department of Agriculture (USDA). The FDA is
charged with ensuring the safety of all domestic and imported food products, with the notable
exceptions of most meats and poultry. The USDA regulates most meat and poultry products, as
well as some egg products. The Government Accountability Office has identified as many as 15
different federal agencies that collectively administer at least 30 food safety laws (Johnson
2014). Additionally, state and local authorities are responsible for various food safety functions,
including the inspection of food establishments.
The piece of legislation most pertaining to apple production is the FDA Food Safety
Modernization Act (FSMA), which was signed into law by President Obama in January 2011.
FSMA is intended to protect human health by enabling the FDA to focus on prevention of food
safety issues rather than taking a reactionary approach to foodborne outbreaks (FDA 2014). The
law provides the FDA with enforcement authorities intended to achieve higher compliance with
regulatory standards, using a risk-based approach to food safety. It also gives the FDA tools to
hold imported foods to the same standards as domestic foods, and “directs FDA to build an
integrated national food safety system in partnership with state and local authorities” (FDA
2014). Proposed rules under FSMA – namely Standards for the Growing, Harvesting, Packing,
and Holding of Produce for Human Consumption – have implications for apple growers in the
US.
4.2. Values, Actors, Institutions, and Policy Processes in Food Safety
Figure 4.1 illustrates a basic framework for conceptualizing public policy. A policy can
be defined as a relatively stable, purposive course of action that guides actors or institutions in

61
dealing with a problem. In a public policy context, a problem can be defined as a situation that
causes people distress or dissatisfaction, for which relief is sought through policy. The
identification of a problem, desired outcome, and policy design are informed by values, actors,
and institutions.
Figure 4.1 – A Basic Policy Framework
For this analysis, values can be defined as the principles that guide an individual’s behavior.
Values necessarily inform the actions – or inactions – of policy actors. Policy actors are
individuals or groups that seek to influence the creation and implementation of policies to
address public problems. Institutions are formal or informal mechanisms that persist over time
and structure the behavior of actors by constraining, enabling or encouraging behaviors. Policy
actors can create, alter, or dismantle institutions; conversely, institutions may influence the
behavior of actors.
4.2.1. Values in Food Safety
Policy scholars have long realized that principles and values play a vital role in policy
formulation. As Lindblom and Woodhouse (1993) suggest, a rational person’s first step after

62
identifying a problem is identifying and ranking values. To understand the food safety policy
process, one must first understand the values that guide decision-making. Values inform the
behavior of actors and the construction of institutions which, together, inform the design and
implementation of public policies. An individual’s values are not static; interactions between
actors and institutions result in a dynamic system of values that evolves over time.
Under the assumption that prevailing values guide decision-making, an examination of past
policies should reveal the dominant principles that guide food safety policy in the United States.
I posit that two core American values have shaped the trajectory of US food safety policy:
community and self-determination. Policy actors’ positions on food safety policy – both for and
against government intervention – have been informed by these principles.
Community
The notion of community is foundational to the American identity. The religious
ideologies that guided early European settlers placed tremendous value on community. In his
famous thesis, John Winthrop articulates “that every man might have need of others, and from
hence they might be all knit more nearly together in the bonds of brotherly affection… every
man afford his help to another in every want or distress” (1630). The Declaration of
Independence concludes with the statement, “we mutually pledge to each other our lives, our
fortunes and our sacred honor.” Early Americans’ sense of obligation to community informed a
collective American identity which, while respecting the rights of the individual, recognizes a
commitment to support fellow citizens.
In the early 20th Century, the value of community manifested in government programs
that sought to promote the maximization of social welfare. Drawing from values of community,
the Progressive Era saw introduction of antitrust laws, which aimed to improve competition by

63
breaking up large monopolistic corporations. Theorists and politicians of the early 20th century –
including Herbert Croly, Theodore Roosevelt, and Woodrow Wilson – argued that social and
economic inequalities justified government intervention to protect the welfare of American
citizens. As President Wilson explained in his campaign speech, “You know that it was Jefferson
who said that the best government is that which does as little governing as possible, which
exercises its power as little as possible… But that time is past. America is not now, and cannot in
the future be, a place for unrestricted individual enterprise” (1912). In The Promise of American
Life, Herbert Croly argued that the founding fathers’ envisioned government was insufficient to
protect the people (1909). Progressives felt that unrestricted corporate entities contributed to
adverse social conditions; government intervention was therefore warranted to improve the
quality of life in the United States.
The Federal Government’s role in food safety has strong ties to ideologies of the
Progressive Era. It was during this time that growing concern about the quality of food, water,
and medicine led to the passage of consumer safety legislation, including the PFDA and MIA in
1906 (Law 2003). This legislature set a precedent for federal regulation in industries whose
products affected public health. Although the U.S. Constitution does not guarantee rights to the
protection of health (Zietlow 2011), there is an implicit contract between individuals and society
that places health-related functions above other social services (Butler 1989). Regulation relating
to food safety, although not solely motivated by health concerns, carries with it an inherent
recognition of wellbeing. For example, the Federal Insecticide, Fungicide, and Rodenticide Act
(FIFRA) established a system of pesticide regulation for the protection of human health and the
environment.

64
In addition to the health and wellbeing of US citizens, food safety policies address the
economic welfare of the nation. The burden of healthcare costs associated with foodborne illness
is, among other factors, a driver behind the development of food safety regulation. Lost producer
profits due to foodborne outbreaks – in the form of food recalls, lost sales, and legal fees – may
provide further incentive for government intervention in food safety. Specifically, policies that
focus on the prevention of produce contamination could reduce the costs associated with
outbreaks and recalls. FSMA is federal legislation aimed at protecting not only consumers of
food, but producers as well. This collectivist and utilitarian ideology stems from a deep-rooted
value of community.
Self-Determination
Self-determination, or individual liberty, is a core American value that has shaped the
policy terrain in the United States. Moral claims of individual liberty are intrinsically tied to
claims about the role of the federal government. Self-determination is a principle employed to
challenge food safety policies. Opponents of food safety policies have invoked moral claims on
individual liberty, drawing heavily from Jeffersonian notions of democracy. A foundational
value in the American identity, liberty is explicitly listed in the Declaration of Independence as
an unalienable right: “…that among these are life, liberty, and the pursuit of happiness.” Rhetoric
used to challenge government intervention in food safety reflects anti-federalist sentiments that
originated during America’s formative years, and have persisted throughout U.S. history. The
Letters from the Federal Farmer to the Republican asserted that a federal government could not
adequately address the “unalienable and fundamental rights” of the people (1787). In the Fort
Hill Address, John Calhoun states, “so numerous and diversified are the interest of our country,
that they could not be fairly represented in a single government” (1831).

65
Policy actors who oppose food safety policy may invoke arguments that restrictions or
regulations on food production represent overexertion of government power. These challenges to
food safety are not necessarily based on the real risk that food production imposes on society, but
rather the underlying principles that government intervention appears to violate.
The notion of individual liberty has also been used to support food safety policy. Under the view
that the role of federal government is to protect the freedoms and rights of individuals, food
safety could be claimed as a responsibility of the government. If one asserted that US citizens are
bestowed with a right to consume unadulterated foods, it would be the job of the government to
intervene and protect citizens from food contamination – not on a basis of social welfare, but out
of a duty to protect the individual liberties of citizens.
Other Values
The distillation of food safety values into two tenets – individual liberty and community –
perhaps oversimplifies the landscape of values that guide food safety policy. Numerous other
values inform the policy processes relating to food safety, such as equity, enterprise, progress,
and efficiency. Moreover, specific policies may invoke arguments based on particular values and
principles. For example, FSMA is guided by values that place prevention of – rather than
response to – foodborne outbreaks as a priority in food safety. I posit that it is less important to
characterize all of the possible values involved in food safety policy, and more important to
recognize that policy decisions are necessarily informed by individuals’ values and principles.
Community and self-determination are simply two far-reaching values that are foundational to
the American identity and function as underlying justifications for and against federal food
safety policy.

66
4.2.2. Actors and Institutions in Food Safety
Policy actors are individuals or groups of individuals that are directly or indirectly
affiliated with or affected by the policy process. Policy actors may include individuals,
governments, businesses, interest groups, social organizations, and communities. Individuals and
groups are integral to policy processes; indeed, policies are created by people to address
problems that affect people. In the realm of food safety, prominent policy actors include federal
government agencies, researchers, and interest groups of both consumers and producers.
Institutions are formal or informal mechanisms that persist over time and structure the behavior
of actors by constraining, enabling or encouraging behaviors. Informal institutions are unwritten
behavioral models, such as social norms or codes of conduct. Conversely, formal institutions are
those for which a prescribed structure exists. Examples of formal institutions include government
entities (e.g., agencies), laws, and regulations. The distinction between actors and formal
institutions is not always clear; indeed, many entities could be regarded as both institution and
actor. For example, the US Congress is both a group of people that influence policy and a formal
mechanism that guides behaviors by enabling and constraining actors; Congress could therefore
be considered both a group of actors and a formal institution. For this analysis, the distinction
between actors and institutions is less important than the recognition that policy processes are
facilitated by people through socially constructed entities.
Both formal and informal institutions guide food safety in the United States. Informal
institutions include social norms that, while implicit, guide the actions of food producers and
consumers. For example: even in the absence of federal regulation, farmers would not
deliberately contaminate their crops with pathogens, given that social norms preclude them from
such an activity that would adversely affect the health of consumers. Formal institutions related

67
to food safety include the laws, government agencies, and prescribed practices that relate to food
safety. Select examples of formal food safety institutions are provided in Table 4.1.
Table 4.1 – Select Examples of Formal Food Safety Institutions
Institution Enables, constrains, or structures behaviors by…
U.S. Food and Drug
Administration
establishing policies that require food producers to meet
regulatory standards and/or implement best management
practices.
Food Quality Protection Act requiring practices by food producers and enables food
consumers by mandating health-based standards for pesticides
used in foods.
Nutrition Labeling and
Education Act
providing consumers with nutrition information to aid in
decision-making (Balasubramanian and Cole 2002).
Food Safety Modernization
Act
enabling the FDA to implement additional rules that reduce the
risk of foodborne illness outbreaks.
The media deciding what events and information are disseminated to the
public, thus shaping public opinion.
WTO SPS Agreement requiring that regulatory measures be scientifically justified at the
national and trans-national levels (Peel 2004).
International Association for
Food Protection
facilitating cross-disciplinary networking of food safety
professionals and scientists; publishing research in academic
journals.
Phillips and Wolfe (2001) propose a conceptualization of the food safety system that
consists of three interacting domains: science, safety, and trade (Figure 4.2). This framework
reflects three different groups of actors (experts, citizens/consumers, and producers) who utilize
different modes of reasoning (risk assessment, risk communication, and risk management) in the
areas of science, safety, and trade, respectively. The authors, to their credit, admit that this is an
oversimplification of the food safety system. Yet, it is a useful framework that reflects the ways
in which both actors and institutions interact in food safety policy. In this framework, policy
actors, formal institutions, and informal institutions are grouped into domains based on their

68
perceived positions with regard to food safety. The interaction between these three domains
informs problem definition, policy development, and policy implementation.
Figure 4.2 – Elements of the Food Safety System (Phillips and Wolfe 2001)
4.2.3. Policy Processes
Policy scholars have proposed numerous frameworks and theories for understanding the
policy process. I propose here a framework for conceptualizing the policy process, particularly as
it pertains to food safety (Figure 4.3). In this framework, problems are first identified and
prioritized. Once a problem has been identified, a policy development process begins, whereby
various policy options are considered. Once a specific policy is selected, the policy is
implemented. After implementation, evaluation typically occurs; this evaluation allows
implementers of the policy to determine whether alterations or modifications must be made to
improve the policy. Values, actors, and institutions are integral to these stages in the policy
processes. The process is necessarily political; politics are, after all the practice of influencing
other people in the area of governance.

69
Figure 4.3 – A Policy Process Framework
As with all frameworks, this policy process framework is a generalization of the
processes by which problems are identified and policies are implemented. The staggering
complexity of the policy process requires simplification of the situation to facilitate
understanding; “one simply cannot look for, and see, everything” (Sabatier 2007). In practice,
stages of the policy process seldom occur sequentially and without conflict or reiteration.
Furthermore, the complex interactions between actors and institutions make it difficult to tease
out who, when, and how incremental decisions are made. Nevertheless, this framework serves as
a useful tool for understanding not only how food safety policies come into existence, but for
identifying places in the policy process that scientific studies, such as this one, may be employed
in the design of policy.
4.3. Research Findings: Implications for Policy
Considering the policy process frameworks provided here, the question remains: what
role might the research findings in previous chapters play in public policy? Specifically, who
might utilize this research, where in the policy process might it be employed, and to what end? I

70
posit that the tools developed in this study – namely the quantitative microbial risk assessment
models – could be used in three key areas of the food safety policy process (see Figure 4.4):
1) Advocating for and prioritizing issues (agenda setting)
2) Choosing between policy options (policy analysis)
3) Selecting an appropriate mechanism by which the policy is implemented
Figure 4.4 – Uses for Study Findings in Public Policy Processes
4.3.1. Agenda Setting
Agenda setting is a process by which public issues are prioritized by policy actors and
institutions. The public agenda is a “political barometer” that reflects the most sensitive issues
that have come to the attention of the public and policy makers (Gerston 2014). Issues may be
promoted by an array of policy actors, including citizens, interest groups, the media, and other
policy institutions. In the context of food safety, agenda setting involves the prioritization of food

71
safety issues and the determination of which issues to address in policy-making. For example,
interest groups advocating for public health in the early 1900s – such as the American Medical
Association and American Public Health Association – pushed for the passage of PFDA and
MIA (Wiley 1929), raising the issue of food safety on the public agenda.
Interest groups could use this research to place – or remove – the issue of produce safety.
Sarah Pralle (2006) argues that advocacy groups make conscious decisions about issue framing,
forming alliances, and selecting institutional venues in order to expand or contract policy issues.
The research findings from this study suggest that current cleaning processes significantly
minimize the risk of foodborne illness outbreaks associated with apples. Apple producers might
use this information to suggest that produce contamination is not a problem that warrants
government intervention. This argument could assert that other food safety issues – or perhaps
other public problems entirely – deserve higher priority with regard to policy-making.
Alternatively, proponents of enhanced food safety regulation could point to the data gaps in the
risk assessment models and suggest that, given uncertainty in the scientific evidence,
precautionary approaches should be taken to ensure consumer safety.
From a federal government perspective, research such as this could be used to prioritize
various public problems. If the findings of this study suggest that apple contamination poses a
higher risk to society when compared to other food safety issues (e.g., pesticides residues or
microbial hazards on other fruits), then addressing apple contamination may be a priority. If
other food safety issues are associated with a higher risk of illness – or risk of more severe
illnesses – perhaps other problems should take priority. Indeed, government agencies – including
the Food and Drug Administration – use risk assessment to determine what issues need to be
addressed (Haas et al. 1999; FDA 2011).

72
4.3.2. Policy Analysis
Once a public issue is identified for policy intervention, policy analysis is a tool that
enables policy-makers to select a policy from a pool of options. Specifically, policy analysis
provides advice on policy options, given identification of the problem, analysis of stakeholders,
consideration of alternatives, and examination of the implications associated with policies
(Weimer and Vining 2005). Policy analysis may evaluate policy options on parameters such as:
impact, efficiency, cost-benefit analysis, equity, and political feasibility.
Government agencies use analytic tools – such as cost-benefit analysis – to determine
what policy options are best suited to address a public problem. Risk assessment is one potential
tool at the disposal of decision-makers to decide between policy options. For example, if
foodborne illness from fresh produce has been identified as a public problem, several policy
options (or combinations of policy options) may be proposed to address it: command-and-control
regulations, market-based policies, or transparency-based governance. An agency might conduct
an analysis to determine which policy alternative will have the greatest impact on foodborne
illness.
Risk assessment models, like the one presented in this study, may be used to select
between policy options. The results of the risk assessment models suggest that, even with high
levels of field contamination, there is a low risk of foodborne illness from apples. This would
suggest that command-and-control systems of governance during apple production may not have
a large impact on apple contamination. An alternative policy might focus on preparation of
apples for eating (i.e., how apples are treated after they leave the cleaning and packing facility).
Conversely, the uncertainty of this model might motivate decision-makers to pursue a policy that

73
provides additional protections. This is consistent with the proposed FSMA rules, which would
mandate irrigation water quality standards to match those of recreational water.
Policy actors like interest groups may advocate for a specific policy option that is
consistent with their values and desired outcome. Given that a problem has been identified, a
particular course of action may be more desirable to policy actors than proposed alternatives.
Policy advocates may feel that a particular policy option is best suited to achieve their goals, and
pressure decision-makers to select their preferred course of action.
4.3.3. Selecting Policy Mechanisms
Selection of policy mechanisms here refers to the specific rules, protocols, and programs
used to implement a policy. While laws provide direction for a government agency to address a
public problem, specific rules are set to achieve a desired goal. For example, FSMA is a policy
that directs the FDA to improve food safety; irrigation water quality standards set by the FDA
are specific mechanisms for achieving the policy goal of lowering foodborne illness risk. Risk
assessment models, like the ones provided in Chapter 3, can elucidate the specific mechanisms
that are most likely to achieve the desired result.
The results from this study could be used to choose what media, processes, or
technologies are subject to regulatory standards, and to what level. The results suggest that even
high levels of bacteria in irrigation water – well above recreational water quality standards – are
associated with low risks of foodborne illness. This might suggest that irrigation water standards
are not an effective means of reducing microbial contamination of apples. With this information,
alternative mechanisms – such as mandating certain disinfection protocols – might be pursued in
policy implementation. The FDA may propose that apple growers use certain types of
disinfectants at specified concentrations for a given duration of time to ensure decontamination.

74
Alternatively, storage or transport standards may be set to ensure ample time for bacterial
reduction during other phases of apple harvest and processing.
As with problem definition and policy development, policy implementation is subject to
input from other policy actors. Comment periods for proposed rules are opportunities for interest
groups to voice opinions on the mechanisms by which polices are implemented. An association
of farmers may, using the results of a risk assessment, argue for different regulatory standards
than those proposed. Alternatively, stakeholders may advocate for an entirely different form of
governance than command-and-control regulation. Policy mechanisms like certification
programs and self-regulation have been proposed and utilized as alternatives to traditional
government regulation paradigms (Caswell and Johnson 1991). Even within the realm of
command-and-control regulation, mechanisms may allow producers a level of autonomy in
determining what specific protocols or procedures are used to achieve a set goal. For example,
HACCP (Hazard Analysis & Critical Control Points) is a management system that addresses
food safety through the analysis and control of biological, chemical, and physical hazards in the
production system (Mortimore and Wallace 2013). In response to juice-associate outbreaks, the
FDA implemented a juice-HACCP rule that requires juice producers to apply interventions
capable of achieving a 5-log reduction of pathogens, but leaves the choice of methods to the
producer (Vojdani et al. 2008). The QMRA findings support a flexible management-based
system like HACCP to address potential contamination of apples; the model predicts similar
outcomes for various configurations of treatment processes, suggesting that producer autonomy
in apple handling is justified given that end-of-process criteria are met.

75
4.4. Conclusion
This chapter attempted to contextualize previous chapters’ research findings in food
safety policy processes, with the purpose of identifying places where study results could be
utilized. Three stages of the policy process – agenda setting, policy analysis, and policy
mechanism selection – were identified as places where QMRAs may be used to inform food
safety policy. While the provided conceptual frameworks provide insight into policy processes
and the relevance of this research, they fail to account for the complex interactions that guide
problem formation, policy development, and policy implementation. Food safety policy
outcomes are the result of complex trade-offs between competing demands of different interest
groups that may be affected (Henson and Caswell 1999). The history of food safety policy in the
United States has been shaped by dynamic political, social, and economic forces that change
over time, and one might argue that oversimplification of these intricacies distorts the reality of
food safety governance systems. I posit that the exercise of examining the policy process is
valuable nevertheless; an analysis such as this affords academics and policy-makers an
opportunity to reflect on the relationship between science and public policy.
Risk assessment is a discipline that is nestled in-between the realms of “science” and
“public policy.” In a traditional paradigm, the interaction between science and policy is a one-
way relationship: scientists first discover facts, then policy-makers decide what to do with them
(Haller and Gerrie 2007). This view is blurred by the integration of science directly into
decision-making processes, such as the use of risk assessment by federal agencies. Furthermore,
risk assessments are, perhaps to a greater extent than other scientific studies, informed by the
investigators’ values; “risk assessment is inherently subjective and represents a blending of
science and judgement with important psychological, social, cultural, and political factors”

76
(Slovic 1999). Without opening a proverbial “Pandora’s box” of discussion around the
“objectivity” of science, my intention is merely to suggest that a risk assessment ought to involve
discussion of the broader social context in which it applies.
This chapter was an attempt to explore the values, institutions, and policy processes that
surround food safety, and situate the QMRA models within a broader policy framework. Figure
1.2 (copied below as Figure 4.5) illustrated a framework that links laboratory methods, risk
assessment, and policy processes. In addition to identifying ways that QMRA results could be
used in policy processes (Figure 4.5, arrow A), the analysis provided in this chapter serves the
purpose of identifying the social and political forces that may inform the risk assessment
paradigm (Figure 4.5, arrow B). Recognition of the values, institutions, and policy processes that
inform risk assessment studies may lead toward directed and transparent research that has
positive implications for human health.
Figure 4.5 – Thesis Research Areas

77
References
Ackers, M. L., Mahon, B. E., Leahy, E., Goode, B., Damrow, T., Hayes, P. S., ... & Slutsker, L. (1998).
An outbreak of Escherichia coli O157: H7 infections associated with leaf lettuce
consumption. Journal of Infectious Diseases, 177(6), 1588-1593.
Annous, B. A., Sapers, G. M., Mattrazzo, A. M., & Riordan, D. C. (2001). Efficacy of washing with a
commercial flatbed brush washer, using conventional and experimental washing agents, in reducing
populations of Escherichia coli on artificially inoculated apples. Journal of Food Protection®, 64(2),
159-163.
Audurier, A., Pardon, P., Marly, J., & Lantier, F. (1979, December). Experimental infection of mice with
Listeria monocytogenes and L. innocua. In Annales de microbiologie (Vol. 131, No. 1, pp. 47-57).
Bach, S., & Delaquis, P. (2009). 2 The Origin and Spread of Human Pathogens in Fruit Production
Systems. Microbial Safety of Fresh Produce, 40, 43.
Balasubramanian, S. K., & Cole, C. (2002). Consumers’ search and use of nutrition information: The
challenge and promise of the nutrition labeling and education act. Journal of Marketing, 66(3), 112-
127.
Becker, G. S., & Porter, D. V. (2007, February). The federal food safety system: A primer. Congressional
Research Service, Library of Congress.
Bernagozzi, M., Bianucci, F., Sacchetti, R., & Bisbini, P. (1994). Study of the prevalence of Listeria spp.
in surface water. Zentralblatt fur Hygiene und Umweltmedizin= International journal of hygiene and
environmental medicine,196(3), 237-244.
Beuchat, L. R. (1996). Pathogenic microorganisms associated with fresh produce. Journal of Food
Protection®, 59(2), 204-216.
Beuchat, L. R., & Ryu, J. H. (1997). Produce handling and processing practices. Emerging infectious
diseases, 3(4), 459.
Beuchat, L. R., Nail, B. V., Adler, B. B., & Clavero, M. R. S. (1998). Efficacy of spray application of
chlorinated water in killing pathogenic bacteria on raw apples, tomatoes, and lettuce. Journal of Food
Protection®, 61(10), 1305-1311.
Besser, R. E., Lett, S. M., Weber, J. T., Doyle, M. P., Barrett, T. J., Wells, J. G., & Griffin, P. M. (1993).
An outbreak of diarrhea and hemolytic uremic syndrome from Escherichia coli O157: H7 in fresh-
pressed apple cider. Jama, 269(17), 2217-2220.
Besser, M. R. E., M. P. M. Griffin & M. M. L. Slutsker (1999) Escherichia coli O157:H7 Gastroenteritis
and the Hemolytic Uremic Syndrome: An Emerging Infectious Disease. Annual review of medicine,
50, 355-367.
Bieber, D., Ramer, S. W., Wu, C. Y., Murray, W. J., Tobe, T., Fernandez, R., & Schoolnik, G. K. (1998).
Type IV pili, transient bacterial aggregates, and virulence of enteropathogenic Escherichia coli.
Science, 280(5372), 2114-2118.
Block SS. (1991). Peroxygen compounds. In: S.S. Block, editor. Disinfection, Sterilization and
Preservation, 4th edition. Philadelphia: Lea & Febiger Co. p 167 – 181.
Boubetra, A., Le Nestour, F., Allaert, C., & Feinberg, M. (2011). Validation of alternative methods for
the analysis of drinking water and their application to Escherichia coli. Applied and Environmental
Microbiology, 77(10), 3360-3367.

78
Boyer, O. & P. Niaudet (2011) Hemolytic uremic syndrome: new developments in pathogenesis and
treatment. International Journal of Nephrology, 2011.
Brackett, R. (1999). Incidence, contributing factors, and control of bacterial pathogens in
produce. Postharvest Biology and Technology, 15(3), 305-311.
Buchanan, R. L., Edelson, S. G., Miller, R. L., & Sapers, G. M. (1999). Contamination of intact apples
after immersion in an aqueous environment containing Escherichia coli O157: H7. Journal of Food
Protection®, 62(5), 444-450.
Buchanan, R. L., Damert, W. G., Whiting, R. C., & van Schothorst, M. (1997). Use of epidemiologic and
food survey data to estimate a purposefully conservative dose-response relationship for Listeria
monocytogenes levels and incidence of listeriosis. Journal of Food Protection®, 60(8), 918-922.
Burnett, S. L., Chen, J., & Beuchat, L. R. (2000). Attachment of Escherichia coli O157: H7 to the
surfaces and internal structures of apples as detected by confocal scanning laser microscopy. Applied
and Environmental Microbiology, 66(11), 4679-4687.
Butler, S. (1989). Assuring Affordable Health Care for All Americans. The Heritage Foundation.
Accessed on 05 December 2014 at
http://healthcarereform.procon.org/sourcefiles/1989_assuring_affordable_health_care_for_all_americ
ans.pdf
Cahn, M. A. (2013). Institutional and Noninstitutional Actors in the Policy Process. Public Policy: The
Essential Readings, 199-206.
Calhoun, J. (1831). The Fort Hill Address.
Cassin, M. H., Lammerding, A. M., Todd, E. C., Ross, W., & McColl, R. S. (1998). Quantitative risk
assessment for Escherichia coli O157: H7 in ground beef hamburgers. International Journal of Food
Microbiology, 41(1), 21-44.
Caswell, J. A., & Johnson, G. V. (1991). Firm strategic response to food safety and nutrition regulation.
In Economics of food safety (pp. 273-297). Springer Netherlands.
Centers for Disease Control and Prevention (CDC). (1975). Salmonella typhimurium outbreak traced to a
commercial apple cider—New Jersey. Morb. Mortal. Wkly. Rep, 24, 87-88.
CDC. (1996). Outbreak of Escherichia coli O157: H7 infections associated with drinking unpasteurized
commercial apple juice--British Columbia, California, Colorado, and Washington, October
1996. MMWR. Morbidity and mortality weekly report, 45(44), 975
CDC. (1997). Outbreaks of Escherichia coli O157: H7 infection and cryptosporidiosis associated with
drinking unpasteurized apple cider--Connecticut and New York, October 1996. MMWR. Morbidity
and mortality weekly report, 46(1), 4.
CDC. (2015). Multistate Outbreak of Listeriosis Linked to Commercially Produced, Prepackaged
Caramel Apples Made from Bidart Bros. Apples (Final Update). Accessed 10 March 2015 at
http://www.cdc.gov/listeria/outbreaks/caramel-apples-12-14/
Conway, W. S., Leverentz, B., Saftner, R. A., Janisiewicz, W. J., Sams, C. E., & Leblanc, E. (2000).
Survival and growth of Listeria monocytogenes on fresh-cut apple slices and its interaction with
Glomerella cingulata and Penicillium expansum. Plant disease, 84(2), 177-181.
Croly, H. (1909). The Promise of American Life. The Macmillan Company.

79
Danyluk, M. D., & Schaffner, D. W. (2011). Quantitative assessment of the microbial risk of leafy greens
from farm to consumption: preliminary framework, data, and risk estimates. Journal of Food
Protection®, 74(5), 700-708.
Dingman, D. W. (2000). Growth of Escherichia coli O157: H7 in bruised apple (Malus domestica) tissue
as influenced by cultivar, date of harvest, and source. Applied and Environmental
Microbiology, 66(3), 1077-1083.
Downes, F. P., & Ito, K. (2001). Compendium of methods for the microbiological examination of foods.
American Public Health Association. Washington, DC.
Doyle, M.P., and Erickson, M.C. 2006. Closing the door on the fecal coliform assay. Microbe 1(4): 162-
163.
Duffy, S., & Schaffner, D. W. (2002). Monte Carlo simulation of the risk of contamination of apples with
Escherichia coli O157:H7. International Journal of Food Microbiology, 78(3), 245-255.
Eccles, J.P., Searle, R., Holt, D., and Dennis, P.J. 2004. A comparison of methods used to enumerate
Escherichia coli in conventionally treated sewage sludge. Journal of Applied Microbiology 96(2):
375-383.
Espinoza-Medina, I. E., Rodríguez-Leyva, F. J., Vargas-Arispuro, I., Islas-Osuna, M. A., Acedo-Félix, E.,
& Martinez-Tellez, M. A. (2006). PCR identification of Salmonella: potential contamination sources
from production and postharvest handling of cantaloupes. Journal of Food Protection®, 69(6), 1422-
1425.
Evans, R.G. (2004). Energy balance of apples under evaporative cooling. Transactions of the ASAE 47(4):
1029-1037
Farber, J. M., & Peterkin, P. I. (1991). Listeria monocytogenes, a food-borne pathogen. Microbiological
Reviews, 55(3), 476.
Fazil, A. M. (1996). A quantitative risk assessment model for Salmonella (Doctoral dissertation, Drexel
University).
Fatemi, P., LaBorde, L. F., Patton, J., Sapers, G. M., Annous, B., & Knabel, S. J. (2006). Influence of
punctures, cuts, and surface morphologies of golden delicious apples on penetration and growth of
Escherichia coli O157: H7. Journal of Food Protection®, 69(2), 267-275.
Fenlon, D. R. (1981). Seagulls (Larus spp.) as vectors of salmonellae: an investigation into the range of
serotypes and numbers of salmonellae in gull faeces. Journal of Hygiene, 86(02), 195-202.
Fenlon, D. R. (1985). Wild birds and silage as reservoirs of Listeria in the agricultural
environment. Journal of Applied Bacteriology, 59(6), 537-543.
Fenlon, D. R., Wilson, J., & Donachie, W. (1996). The incidence and level of Listeria monocytogenes
contamination of food sources at primary production and initial processing. Journal of Applied
Bacteriology, 81(6), 641-650.
Food and Agriculture Organization of the United Nations/World Health Organization. (2002).
Microbiological Risk Assessment Series 2: Risk Assessments of Salmonella in Eggs and Broiler
Chickens. 92-5-104872-X, (Rome, Italy, 302 pp.).
Food and Drug Administration (FDA). (1998). Guidance for industry: Guide to minimize microbial food
safety hazards for fresh fruits and vegetables. Food and Drug Administration: Silver Spring, MD,
USA.
FDA. (2002). Bacteriological Analytical Manual: Chapter 4: Enumeration of Escherichia coli and the
Coliform Bacteria.

80
FDA. (2011). Risk Analysis at FDA: Food Safety: A science-based approach to policy decisions .
Factsheet. Accessed 28 April 2015 at
http://www.fda.gov/downloads/Food/FoodScienceResearch/UCM267257.pdf
FDA. (2014). FDA Food Safety Modernization Act (FSMA). Accessed 05/20/14. Page Last Updated:
05/12/2014. http://www.fda.gov/Food/GuidanceRegulation/FSMA/default.htm
Frahm, E., & Obst, U. (2003). Application of the fluorogenic probe technique (TaqMan PCR) to the
detection of Enterococcus spp. and Escherichia coli in water samples. Journal of Microbiological
Methods, 52(1), 123-131.
Garcia, L., Henderson, J., Fabri, M., & Oke, M. (2006). Potential sources of microbial contamination in
unpasteurized apple cider. Journal of Food Protection®, 69(1), 137-144.
Garrity, G., D. Jones, N. R. Krieg, W. Ludwig, F. A. Rainey, K. H. Schleifer & W. B. Whitman. 2005.
Bergey's Manual of Systematic Bacteriology: The Proteobacteria. New York: Springer.
Geldreich, E. E. (1966). Sanitary significance of fecal coliformes in the environment. In Sanitary
significance of fecal coliformes in the environment. Department of the Interior.
Gerston, L. N. (2014). Public policy making: Process and principles. Routledge.
Gil, M. I., Selma, M. V., López-Gálvez, F., & Allende, A. (2009). Fresh-cut product sanitation and wash
water disinfection: problems and solutions. International Journal of Food Microbiology, 134(1), 37-
45.
Golnazarian, C. A., Donnelly, C. W., Pintauro, S. J., & Howard, D. B. (1989). Comparison of infectious
dose of Listeria monocytogenes F5817 as determined for normal versus compromised C57B1/6J
mice. Journal of Food Protection®, 52(10), 696-701.
Graham, J. D. (1995). Historical perspective on risk assessment in the federal
government. Toxicology, 102(1), 29-52.
Gravani, R. B. (2009). The role of good agricultural practices in produce safety. Microbial safety of fresh
produce, 101.
Gronewold, A. D., & Wolpert, R. L. (2008). Modeling the relationship between most probable number
(MPN) and colony-forming unit (CFU) estimates of fecal coliform concentration. Water
research, 42(13), 3327-3334.
Guo, X., Chen, J., Brackett, R. E., & Beuchat, L. R. (2002). Survival of Salmonella on tomatoes stored at
high relative humidity, in soil, and on tomatoes in contact with soil. Journal of Food
Protection®, 65(2), 274-279.
Haas, C. N. (1983). Estimation of risk due to low doses of microorganisms: a comparison of alternative
methodologies. American Journal of Epidemiology, 118(4), 573-582.
Haas, C.N., Rose, J.B., Gerba, C., Regli, S. 1993. Risk assessment of virus in drinking water. Risk
Analysis, 13: 545–552.
Haas, C. N., Rose, J. B., & Gerba, C. P. (1999). Quantitative microbial risk assessment. John Wiley &
Sons.
Haas, C. N., Thayyar-Madabusi, A., Rose, J. B., & Gerba, C. P. (2000). Development of a dose-response
relationship for Escherichia coli O157: H7. International Journal of Food Microbiology, 56(2), 153-
159.
Haas, C. N., Thayyar-Madabusi, A., Rose, J. B., & Gerba, C. P. (1999). Development and validation of
dose-response relationship for Listeria monocytogenes. Quantitative Microbiology, 1(1), 89-102.

81
Harris, L. J., Farber, J. N., Beuchat, L. R., Parish, M. E., Suslow, T. V., Garrett, E. H., & Busta, F. F.
(2003). Outbreaks Associated with Fresh Produce: Incidence, Growth, and Survival of Pathogens in
Fresh and Fresh‐Cut Produce. Comprehensive reviews in food science and food safety, 2(s1), 78-141.
Haley, B. J., Cole, D. J., & Lipp, E. K. (2009). Distribution, diversity, and seasonality of waterborne
salmonellae in a rural watershed. Applied and Environmental Microbiology, 75(5), 1248-1255.
Henson, S., & Caswell, J. (1999). Food safety regulation: an overview of contemporary issues. Food
policy, 24(6), 589-603.
Heisick, J. E., Wagner, D. E., Nierman, M. L., & Peeler, J. T. (1989). Listeria spp. found on fresh market
produce. Applied and Environmental Microbiology, 55(8), 1925-1927.
Herdt J.G., Warf C.C., Foong-Cunningham S., Swanson K.M.J. (2007). Critical factors that influence the
effectiveness of aqueous antimicrobial interventions for fresh produce. Presented at Institute of Food
Technologists, 2007 Annual Meeting. Chicago, Illinois. July 28 – Aug 1.
Herdt, J., & Feng, H. (2009). Aqueous antimicrobial treatments to improve fresh and fresh-cut produce
safety. Microbial Safety of Fresh Produce, 169.
Hermanson, R.E., Kalita, P.K., 2001. Animal manure data sheet.
http://www.cru.cahe.wsu.edu/CEPublications/eb1719/eb1719.html, Clean Water for Washington.
Herrick, A.D. (1944). Food Safety and Compliance. Revere Publishing.
Hilborn, E. D., Mshar, P. A., Fiorentino, T. R., Dembek, Z. F., Barrett, T. J., Howard, R. T., & Cartter, M.
L. (2000). An outbreak of Escherichia coli O157:H7 infections and haemolytic uraemic syndrome
associated with consumption of unpasteurized apple cider. Epidemiology and Infection, 124(01), 31-
36.
Himathongkham, S., & Riemann, H. (1999). Destruction of Salmonella typhimurium, Escherichia coli
O157: H7 and Listeria monocytogenes in chicken manure by drying and/or gassing with ammonia.
FEMS microbiology letters, 171(2), 179-182.
Iglesias, I., Salvia, J., Torguet, L., & Montserrat, R. (2005). The evaporative cooling effects of overtree
microsprinkler irrigation on ‘Mondial Gala’ apples. Scientia horticulturae, 103(3), 267-287.
Janes, M. E., Cobbs, T., Kooshesh, S., & Johnson, M. G. (2002). Survival differences of Escherichia coli
O157: H7 strains in apples of three varieties stored at various temperatures. Journal of Food
Protection®, 65(7), 1075-1080.
Janisiewicz, W. J., Conway, W. S., Brown, M. W., Sapers, G. M., Fratamico, P., & Buchanan, R. L.
(1999). Fate of Escherichia coli O157: H7 on fresh-cut apple tissue and its potential for transmission
by fruit flies. Applied and Environmental Microbiology, 65(1), 1-5.
Jimenez, M., Siller, J. H., Valdez, J. B., Carrillo, A., & Chaidez, C. (2007). Bidirectional Salmonella
enterica serovar Typhimurium transfer between bare/glove hands and green bell pepper and its
interruption. International Journal of Environmental Health Research, 17(5), 381-388.
Junttila, J. R., Niemelä, S. I., & Hirn, J. (1988). Minimum growth temperatures of Listeria
monocytogenes and non‐haemolytic listeria. Journal of Applied Bacteriology, 65(4), 321-327.
Karch, H., P. I. Tarr & M. Bielaszewska (2005) Enterohaemorrhagic Escherichia coli in human medicine.
International Journal of Medical Microbiology, 295, 405-418.
Kenney, S. J., & Beuchat, L. R. (2002). Survival of Escherichia coli O157: H7 and Salmonella Muenchen
on apples as affected by application of commercial fruit waxes. International Journal of Food
Microbiology, 77(3), 223-231.

82
Keraita, B., Konradsen, F., Drechsel, P., & Abaidoo, R. C. (2007). Effect of low‐cost irrigation methods
on microbial contamination of lettuce irrigated with untreated wastewater. Tropical Medicine &
International Health, 12(s2), 15-22.
Kilian, M., & Bülow, P. (1976). Rapid diagnosis of Enterobacteriaceae. Acta Pathologica Microbiologica
Scandinavica Section B Microbiology, 84(5), 245-251.
Kinzelman, J.L., Singh, A., Ng, C., Pond, K.R., Bagley, R.C., and Gradus, S. 2005. Use of IDEXX
Colilert-18® and Quanti-Tray/2000 as a Rapid and Simple Enumeration Method for the
Implementation of Recreational Water Monitoring and Notification Programs. Lake and Reservoir
Management 21(1): 73-77.
Krzyzanowski, F., Zappelini, L., Martone-Rocha, S., Dropa, M., Matté, M. H., Nacache, F., & Razzolini,
M. T. (2014). Quantification and characterization of Salmonella spp. isolates in sewage sludge with
potential usage in agriculture. BMC Microbiology, 14(1), 263.
Latimer, H. K., Jaykus, L. A., Morales, R. A., Cowen, P., & Crawford‐Brown, D. (2001). A weighted
composite dose–response model for human salmonellosis. Risk Analysis, 21(2), 295-306.
Law, M. T. (2003). The origins of state pure food regulation. The Journal of Economic History, 63(04),
1103-1130.
Langeland, G.U.N.N.A.R. (1982). Salmonella spp. in the working environment of sewage treatment
plants in Oslo, Norway. Applied and environmental microbiology, 43(5), 1111-1115.
Leang, A. (2013). Prevalence of Salmonella and E. coli on Produce from Seattle Farmers Markets.
Masters Thesis, University of Washington.
Levine, M. M., DuPont, H. L., Formal, S. B., Hornick, R. B., Takeuchi, A., Gangarosa, E. J., ... &
Libonati, J. P. (1973). Pathogenesis of Shigella dysenteriae 1 (Shiga) dysentery. Journal of Infectious
Diseases, 127(3), 261-270.
Levine, M., Nalin, D., Hornick, R., Bergquist, E., Waterman, D., Young, C., ... & Rowe, B. (1978).
Escherichia coli strains that cause diarrhoea but do not produce heat-labile or heat-stable enterotoxins
and are non-invasive. The Lancet, 311(8074), 1119-1122.
Liao, C. H., & Sapers, G. M. (2000). Attachment and growth of Salmonella Chester on apple fruits and in
vivo response of attached bacteria to sanitizer treatments. Journal of Food Protection®, 63(7), 876-
883.
Lindblom, C. E., & Woodhouse, E. J. (1993). The policy-making process. 3rd Edition. Prentice Hall
Lynch, M. F., Tauxe, R. V., & Hedberg, C. W. (2009). The growing burden of foodborne outbreaks due
to contaminated fresh produce: risks and opportunities. Epidemiology and Infection, 137(03), 307-
315.
Mandrell, R. E. (2009). Enteric human pathogens associated with fresh produce: sources, transport and
ecology. Microbial Safety of Fresh Produce, 5-41.
Marth, E. H. (1988). Disease Characteristics of Listeria-Monocytogenes. Food Technology, 42(4), 165-
168.
Materon, L. A., Martinez-Garcia, M., & McDonald, V. (2007). Identification of sources of microbial
pathogens on cantaloupe rinds from pre-harvest to post-harvest operations. World Journal of
Microbiology and Biotechnology, 23(9), 1281-1287.
Mead, P. S., Slutsker, L., Dietz, V., McCaig, L. F., Bresee, J. S., Shapiro, C., ... & Tauxe, R. V. (1999).
Food-related illness and death in the United States. Emerging Infectious Diseases, 5(5), 607.

83
McCullough, N. B., & Elsele, C. W. (1951a). Experimental human salmonellosis: I. Pathogenicity of
strains of Salmonella meleagridis and Salmonella anatum obtained from spray-dried whole egg. The
Journal of Infectious Diseases, 278-289.
McCullough, N. B., & Eisele, C. W. (1951b). Experimental human salmonellosis: III. Pathogenicity of
strains of Salmonella newport, Salmonella derby, and Salmonella bareilly obtained from spray-dried
whole egg. The Journal of Infectious Diseases, 209-213.
Meschke, J.S., Lee, J.K., Rohlik, C., Ray, L., Gounder, A., and Beck, N.K. (2009). Evaluation of Various
Sampling Methods for Bacterial Recovery from Surfaces. Unpublished manuscript.
Mescke, J.S., Nagata, J.S., Thayer, K., and Killinger, K.M. (2014). [Irrigation water quality data from
Washington State]. Unpublished raw data.
Meyers, K. E. C., S. L. Schulman & B. S. Kaplan. 1998. Principles of the Treatment of Shiga Toxin-
Associated Hemolytic-Uremic Syndrome: Pay Meticulous Attention to Detail, and Do No Harm. In
Escherichia coli O157:H7 and Other Shiga Toxin-Producing E. coli Strains, eds. J. B. Kaper & A. D.
O'Brien, 364-373. Washington, D.C.: ASM Press.
Merrill, R. A., & Francer, J. K. (2000). Organizing federal food safety regulation. Seton Hall L. Rev., 31,
61.
Mortimore, S., & Wallace, C. (2013). HACCP: A practical approach. Springer Science & Business
Media.
National Agricultural Statistics Service (NASS). (2015). Noncitrus Fruits and Nuts: 2014 Preliminary
Summary. United States Department of Agriculture. ISSN: 1948-2698
National Research Council (NRC). (1983). Risk assessment in the federal government: Managing the
process. Committee on the Institutional Means for Assessment of Risks to Public Health. National
Academy Press.
Neal, J. A., Marquez-Gonzalez, M., Cabrera-Diaz, E., Lucia, L. M., O'Bryan, C. A., Crandall, P. G., ... &
Castillo, A. (2012). Comparison of multiple chemical sanitizers for reducing Salmonella and
Escherichia coli O157: H7 on spinach (Spinacia oleracea) leaves. Food Research International,
45(2), 1123-1128.
Nguyen‐the, C., & Carlin, F. (1994). The microbiology of minimally processed fresh fruits and
vegetables. Critical Reviews in Food Science & Nutrition, 34(4), 371-401.
Olaimat, A. N., & Holley, R. A. (2012). Factors influencing the microbial safety of fresh produce: a
review. Food Microbiology, 32(1), 1-19.
Pai, C. H., Kelly, J. K., & Meyers, G. L. (1986). Experimental infection of infant rabbits with verotoxin-
producing Escherichia coli. Infection and Immunity, 51(1), 16-23.
Painter, J. A., Hoekstra, R. M., Ayers, T., Tauxe, R. V., Braden, C. R., Angulo, F. J., & Griffin, P. M.
(2013). Attribution of foodborne illnesses, hospitalizations, and deaths to food commodities by using
outbreak data, United States, 1998–2008. Emerging Infectious Diseases, 19(3), 407.
Pao, S., Davis, C. L., Friedrich, L. M., & Parish, M. E. (2002). Utilization of fluorogenic assay for rapid
detection of Escherichia coli in acidic fruit juice. Journal of Food Protection®, 65(12), 1943-1948.
Park, C.M., Beuchat, L.R. (1999). Evaluation of sanitizers for killing Escherichia coli O157:H7,
Salmonella, and naturally occurring microorganisms on cantaloupes, honeydew melons and
asparagus. Dairy Food Environment Sanitation 19 (12): 842 – 847 .

84
Pate, M. L., & Nummer, B. (2013). Hand safety for specialty crop production workers: a pilot study
investigating frequencies of minor open-wound hand injuries and presence of pathogenic
bacteria. Journal of Agricultural Safety and Health, 19(4), 227-236.
Payment, P., Plante, R., & Cejka, P. (2001). Removal of indicator bacteria, human enteric viruses, Giardia
cysts, and Cryptosporidium oocysts at a large wastewater primary treatment facility. Canadian
Journal of Microbiology, 47(3), 188-193.
Peel, J. (2004). Risk regulation under the WTO SPS agreement: Science as an international normative
yardstick?. NYU School of Law.
Phillips, P. W., & Wolfe, R. (2001). Governing food in the 21st century. The globalization of risk
analysis. Governing Food: Science, Safety and Trade, 1-10.
Pollack, S. (2001). Consumer demand for fruit and vegetables: the U.S. example. In: Regmi A, ed.
Changing Structure of Global Food Consumption and Trade. Washington, DC: Economic Research
Service/United States Department of Agriculture; publication no.WRS01-1. pp. 49–54.
Powell, M. R., Ebel, E., Schlosser, W., Walderhaug, M., & Kause, J. (2000). Dose-response envelope for
Escherichia coli O157: H7. Quantitative Microbiology, 2(2), 141-163.
Pralle, S. B. (2006). Branching out, digging in: Environmental advocacy and agenda setting.
Washington, DC: Georgetown University Press.
Regli, S., Rose, J.B., Haas, C.N., Gerba, C. 1991. Modelling risk for pathogens in drinking water. Journal
American Water Works Association, 83: 76–84.
Rangel, J. M., Sparling, P. H., Crowe, C., Griffin, P. M., & Swerdlow, D. L. (2005). Epidemiology of
Escherichia coli O157: H7 outbreaks, United States, 1982–2002. Emerging Infectious Diseases,
11(4), 603-609.
Rice, E. W., Allen, M. J., & Edberg, S. C. (1990). Efficacy of beta-glucuronidase assay for identification
of Escherichia coli by the defined-substrate technology. Applied and Environmental
Microbiology, 56(5), 1203-1205.
Rocourt, J., BenEmbarek, P., Toyofuku, H., & Schlundt, J. (2003). Quantitative risk assessment of
Listeria monocytogenes in ready‐to‐eat foods: the FAO/WHO approach. FEMS Immunology &
Medical Microbiology, 35(3), 263-267.
Rodgers, S. L., Cash, J. N., Siddiq, M., & Ryser, E. T. (2004). A comparison of different chemical
sanitizers for inactivating Escherichia coli O157: H7 and Listeria monocytogenes in solution and on
apples, lettuce, strawberries, and cantaloupe. Journal of Food Protection®, 67(4), 721-731.
Ruiz-Cruz, S., Acedo-Félix, E., Díaz-Cinco, M., Islas-Osuna, M. A., & González-Aguilar, G. A. (2007).
Efficacy of sanitizers in reducing Escherichia coli O157: H7, Salmonella spp. and Listeria
monocytogenes populations on fresh-cut carrots. Food Control, 18(11), 1383-1390.
Sabatier, P.A. (2007). The Need for Better Theories. In: Sabatier, P.A., (ed.). Theories of the Policy
Process. Westview Press.
Sapers, G. M. (2001). Efficacy of washing and sanitizing methods for disinfection of fresh fruit and
vegetable products. Food Technology and Biotechnology, 39(4), 305-312.
Sapers, G. M., Miller, R. L., & Mattrazzo, A. M. (1999). Effectiveness of sanitizing agents in inactivating
Escherichia coli in golden delicious apples. Journal of Food Science, 64(4), 734-737.
Sapers, G. M., Miller, R. L., Jantschke, M., & Mattrazzo, A. M. (2000). Factors limiting the efficacy of
hydrogen peroxide washes for decontamination of apples containing Escherichia coli. Journal of food
Science, 65(3), 529-532.

85
Scallan, E., Hoekstra, R. M., Angulo, F. J., Tauxe, R. V., Widdowson, M. A., Roy, S. L., ... & Griffin, P.
M. (2011a). Foodborne illness acquired in the United States—major pathogens. Emerging Infectious
Diseases, 17(1).
Scallan, E., Griffin, P. M., Angulo, F. J., Tauxe, R. V., & Hoekstra, R. M. (2011b). Foodborne illness
acquired in the United States—unspecified agents. Emerging Infectious Diseases, 17(1), 16.
Scharff, R. L. (2012). Economic burden from health losses due to foodborne illness in the United
States. Journal of Food Protection®, 75(1), 123-131.
Sivapalasingam, S., Friedman, C. R., Cohen, L., & Tauxe, R. V. (2004). Fresh produce: a growing cause
of outbreaks of foodborne illness in the United States, 1973 through 1997. Journal of Food
Protection®, 67(10), 2342-2353.
Sizmur, K., & Walker, C. W. (1988). Listeria in prepacked salads. The Lancet,331(8595), 1167.
Slovic, P. (1999). Trust, emotion, sex, politics, and science: Surveying the risk‐assessment
battlefield. Risk analysis, 19(4), 689-701.
Stearns, D. (2014). Apples and a Recent History of Listeria. Food Poison Journal. Web; accessed 01 June
2015 at http://www.foodpoisonjournal.com/food-poisoning-information/apples-and-a-recent-history-
of-listeria/
Steele, M., & Odumeru, J. (2004). Irrigation water as source of foodborne pathogens on fruit and
vegetables. Journal of Food Protection®, 67(12), 2839-2849.
Strachan, N. J., Doyle, M. P., Kasuga, F., Rotariu, O., & Ogden, I. D. (2005). Dose response modelling of
Escherichia coli O157 incorporating data from foodborne and environmental outbreaks. International
Journal of Food Microbiology, 103(1), 35-47.
Tapp, I. I. I., Gragg, S. E., Brooks, J. C., Miller, M. F., & Brashears, M. M. (2013). Reduction of
Escherichia coli O157: H7 and Salmonella after Application of Various Sanitizing Treatments to
Harvesting Knives. Journal of Food Protection®, 76(2), 200-204.
Teunis, P.F.M., Van der Heijden, O.G., Van der Giessen, J.W.B., & Havelaar, A.H. 1996. The dose
response relation in human volunteers for gastro-intestinal pathogens. National Institute of Public
Health and the Environment, Bilthoven, The Netherlands. RIVM Report No. 284550002.
Teunis, P., Takumi, K., & Shinagawa, K. (2004). Dose response for infection by Escherichia coli O157:
H7 from outbreak data. Risk Analysis, 24(2), 401-407.
Trueman J.R. (1971). The Halogens. In: W.B. Hugo, editor. Inhibition and Destruction of the Microbial
Cell. London: Academic Press. p 137 – 165 .
Uljas, H.E., & Ingham, S. C. (2000). Survey of apple growing, harvesting, and cider manufacturing
practices in Wisconsin: implications for safety. Journal of Food Safety, 20(2), 85-100.
USDA-FSIS. 1998. Salmonella Enteritidis Risk Assessment. Shell Eggs and Egg Products. Final Report.
Prepared for FSIS by the Salmonella Enteritidis Risk Assessment Team. 268 pp. Available on
Internet as PDF document at: www.fsis.usda.gov/ophs/risk/contents.htm
Van Boxstael, S., Habib, I., Jacxsens, L., De Vocht, M., Baert, L., Van de Perre, E., ... & Uyttendaele, M.
(2013). Food safety issues in fresh produce: bacterial pathogens, viruses and pesticide residues
indicated as major concerns by stakeholders in the fresh produce chain. Food Control, 32(1), 190-
197.
Vázquez-Boland, J. A., Kuhn, M., Berche, P., Chakraborty, T., Domı́nguez-Bernal, G., Goebel, W., ... &
Kreft, J. (2001). Listeria pathogenesis and molecular virulence determinants. Clinical Microbiology
Reviews, 14(3), 584-640.
86
Vojdani, J. D., Beuchat, L. R., & Tauxe, R. V. (2008). Juice-associated outbreaks of human illness in the
United States, 1995 through 2005. Journal of Food Protection®, 71(2), 356-364.
Wachtel, M. R., Whitehand, L. C., & Mandrell, R. E. (2002). Association of Escherichia coli O157: H7
with preharvest leaf lettuce upon exposure to contaminated irrigation water. Journal of Food
Protection®, 65(1), 18-25.
Wang, H. U. A., Feng, H. A. O., & Luo, Y. (2006). Dual‐Phasic Inactivation of Escherichia Coli O157:
H7 with Peroxyacetic Acid, Acidic Electrolyzed Water and Chlorine on Cantaloupes and Fresh‐Cut
Apples. Journal of Food Safety, 26(4), 335-347.
Warden, P.S., DeSarno, M.S., Volk, S.E., and Eldred, B.J. 2011. Evaluation of Colilert-18 for Detection
and Enumeration of Fecal Coliform Bacteria in Wastewater Using the US Environmental Protection
Agency Alternative Test Procedure Protocol. Journal of AOAC International 94(5): 1573-1580.
Weimer, D. L., & Vining, A. R. (2005). Policy analysis: Concepts and practice.
Wiley, H. (1929). The History of Crime Against Food Law. Ayer Co Pub.
Wilson, W. (1912). Campaign Speech, September 23, 1912, Scranton, Pennsylvania. In Davidson, J.W.
(ed). (1956). A Crossroads of Freedom: The 1912 Campaign Speeches. New Haven, Conn.: Yale
University Press.
Wilson, S. (1942). Food & drug regulation. American Council of Public Affairs.
Winthrop, J. (1630). A Model of Christian Charity.
Wisniewsky, M.A., Glatz, B.A., Gleason M.L., Reitmeier, C.A. (2000). Reduction of Escherichia coli
O157:H7 counts on whole fresh apples by treatment with sanitizers. Journal of Food Protection, 63
(6): 703–708.
Wright J.R., Sumner S.S., Hackney C.R., Pierson M.D., Zoecklein B.W. (2000). Reduction of
Escherichia coli O157:H7 on apples using wash and chemical sanitizers treatments. Dairy Food
Environment Sanitation 20 (2): 120–126.
Wallace, J. S., Cheasty, T., & Jones, K. (1997). Isolation of Vero cytotoxin‐producing Escherichia coli
O157 from wild birds. Journal of Applied Microbiology, 82(3), 399-404.
Xu, J., Liu, Q., Jing, H., Pang, B., Yang, J., Zhao, G., & Li, H. (2003). Isolation of Escherichia coli O157:
H7 from dung beetles Catharsius molossus. Microbiology and Immunology, 47(1), 45-49.
Yang, H., Kendall, P. A., Medeiros, L., & Sofos, J. N. (2009). Inactivation of Listeria monocytogenes,
Escherichia coli O157: H7, and Salmonella typhimurium with compounds available in households.
Journal of Food Protection®, 72(6), 1201-1208.
Zietlow, R. E. (2011). Democratic Constitutionalism and the Affordable Care Act. Ohio St. LJ, 72, 1367.
Zhao, T., Doyle, M.P., Shere, J., Garber, L., 1995. Prevalence of enterohemorrhagic Escherichia coli
O157:H7 in a survey of dairy herds. Applied Environmental Microbiology. 61, 1290– 1293.

87
APPENDIX A – Tornado Analysis Output
0.96
3.99
96.71
0.96
0.85
0.76
0.80
1.28
0.14
0.14
0.79
0.28
0.31
1.55
1.29
0.31
0.02
0.22
0.31
0.91
0.10
0.10
0.71
0.22
0.35
577.50
0.58
55,000.00
712.00
0.00 0.00 0.00 0.00 0.00 0.00
log increase per day in storage
Log reduction from dump tank
Water generic E. coli concentration - A
log growth per day in cold storage
Log reduction from waxing
Log reduction from cleaner
Log reduction from water wash
Log reduction from PAA spray bar
log reduction per day in storatge
log reduction per day in cold storatge
Log reduction from Cl spray bar
Log reduction from drying
Log reduction from cleaner (AK)
Soil E. coli O157:H7 concentration -Expected
Log reduction in E. coli O157:H7 per day
E. coli O157:H7 density in feces
Hand/glove contamination (distribution)
Probability of Illness - E. Coli O157:H7
Upside Downside

88
APPENDIX B – Significant Events in US Federal Food Safety Policy*
Year Event
1862 USDA established; Division of Chemistry established
1883 Legislation to prevent the importation of adulterated teas
1897 Tea Importation Act (superseded 1883 tea legislation)
1901 Division of Chemistry becomes Bureau of Chemistry
1906 Federal Food and Drugs Act (Pure Food and Drug Act)
1906 Federal Meat Inspection Act
1914 Federal Trade Commission Act
1916 US Grain Standards Act
1923 Filled Milk Act
1927 Food, Drug, and Insecticide Administration (FDIA) created within USDA
1927 Federal Import Milk Act
1930 FDIA becomes Food and Drug Administration
1938 Federal Food, Drug, and Cosmetic Act
1940 FDA transferred from USDA to the Federal Security Agency (FSA)
1946 Agricultural Marketing Act
1947 Federal Fungicide, Insecticide, and Rodenticide Act (FIFRA)
1953 FDA transferred to Department of Health, Education, and Welfare (HEW)
1957 Poultry Products Inspection Act
1958 Food Additives Amendment
1967 Fair Packaging and Labeling Act
1967 Wholesome Meat Act (amended Federal Meat Inspection Act)
1970 Egg Products Inspection Act
1970 Environmental Protection Agency established (took over FIFRA)
1971 Animal and Plant Health Inspection Service established (APHIS)
1976 Toxic Substances Control Act
1979 HEW becomes Department of Health and Human Services
1981 Food Safety and Inspection Service established within USDA
1990 Nutrition Labeling and Education Act (NLEA)
1990 Sanitary Food Transportation Act
1994 Dietary Supplement Health and Education Act (DSHEA)
1996 Food Quality Protection Act
1996 Federal Tea Tasters Repeal Act
1997 FDA Modernization Act
2002 Public Health Security and Bioterrorism Preparedness and Response Act
2007 FDA Amendments Act of 2007
2011 FDA Food Safety Modernization Act
*Adapted from Johnson 2014, Merrill and Francer 2000