tools guide - vi-hps · this tools guide offers a brief overview of the ... grates profiling...
TRANSCRIPT
VIRTUAL INSTITUTE – HIGH PRODUCTIVITY SUPERCOMPUTING
ToolsGuideOctober 2017
Introduction
The mission of the Virtual Institute - High Productivity Supercomputing(VI-HPS1) is to improve the quality and accelerate the development processof complex simulation codes in science and engineering that are beingdesigned to run on highly-parallel computer systems. For this purpose, thepartners of the VI-HPS are developing integrated state-of-the-art program-ming tools for high-performance computing that assist programmers indiagnosing programming errors and optimizing the performance of theirapplications.
This Tools Guide offers a brief overview of the technologies and toolsdeveloped by the twelve partner institutions of the VI-HPS. It is intendedto assist developers of simulation codes in deciding which of the tools ofthe VI-HPS portfolio is best suited to address their needs with respect todebugging, correctness checking, and performance analysis. To simplifynavigation and to quickly locate the appropriate tool for a particular usecase, an icon list on the left margin of each double page indicates the maincharacteristics of the corresponding tool. The following paragraphs providebrief definitions of what is meant by each of these icons in the context ofthis guide.
Single-node vs. Parallel: These icons indicate whether a tool focuseson either single-node or parallel characteristics, or both. Here, single-noderefers to characteristics of serial, shared-memory or accelerated programsexecuting on a single system, while parallel relates to programs executingon multiple nodes of a cluster using some communication library such asMPI (i.e., using distributed memory parallelism).
Focus
single
parallel
Performance vs. Debugging vs. Correctness vs. Workflow: Per-formance tools provide information about the runtime behavior of an appli-cation and/or inefficient usage of the available hardware resources. Thisdata can be obtained in various ways, e.g., through static code analysis,measurements, or simulation. Debugging tools, on the other hand, maybe used to investigate a program – either live at execution time or post-mortem – for possible errors by examining the value of variables and theactual control flow.
Focus
perform
debug
correct
workflow
In contrast, a correctness checking tool detects errorsin the usage of programming models such as MPI against certain errorpatterns and reports them to the user, usually performing the analysis
1http://www.vi-hps.org
right at runtime. Finally, workflow tools help to automate certain tasks andworkflows and thus improve overall productivity.
Programming models: Over the years, many different programmingmodels, libraries and language extensions have been developed to simplifyparallel programming. Unfortunately, tools need to provide specific supportfor each programming model individually, due to their different charac-teristics. The corresponding icon list indicates which of the programmingmodels and libraries most-commonly used in the area of high-performancecomputing are supported by a tool. In particular, these are the de-factostandard for distributed-memory parallelization MPI, the shared-memoryprogramming extensions OpenMP, Pthreads (a.k.a. POSIX threads) andOmpSs, the programming models CUDA, OpenCL and OpenACC targetingaccelerators, as well as the partitioned global address space (PGAS) lan-guages/libraries UPC and SHMEM. However, it may be possible that a toolsupports additional programming models, which will then be indicated inthe tool description.
Prog. model
MPI
OpenMP
Pthreads
OmpSs
CUDA
OpenCL
OpenACC
UPC
SHMEM
Languages: Finally, some tools may be restricted with respect to the pro-gramming languages they support, for example, if source-code processingis required. Here, we only consider the most commonly used programminglanguages in HPC, namely C, C++ and Fortran. Again, it may be possiblethat tools support further languages or are even language-independent,which will then be mentioned in the description.
Language
C
C++
Fortran
ImprintCopyright © 2017 Partners of the Virtual Institute – High Productivity Supercomputing
Contact: [email protected]
Allinea DDTFocus
single
parallel
perform
debug
correct
workflow
Prog. model
MPI
OpenMP
Pthreads
OmpSs
CUDA
OpenCL
OpenACC
UPC
SHMEM
Language
C
C++
Fortran
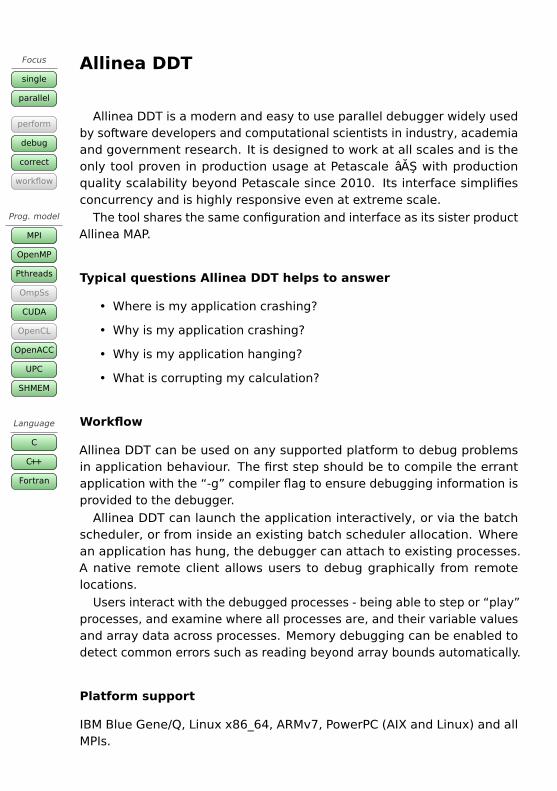
Allinea DDT is a modern and easy to use parallel debugger widely usedby software developers and computational scientists in industry, academiaand government research. It is designed to work at all scales and is theonly tool proven in production usage at Petascale âAS with productionquality scalability beyond Petascale since 2010. Its interface simplifiesconcurrency and is highly responsive even at extreme scale.
The tool shares the same configuration and interface as its sister productAllinea MAP.
Typical questions Allinea DDT helps to answer
• Where is my application crashing?
• Why is my application crashing?
• Why is my application hanging?
• What is corrupting my calculation?
Workflow
Allinea DDT can be used on any supported platform to debug problemsin application behaviour. The first step should be to compile the errantapplication with the “-g” compiler flag to ensure debugging information isprovided to the debugger.
Allinea DDT can launch the application interactively, or via the batchscheduler, or from inside an existing batch scheduler allocation. Wherean application has hung, the debugger can attach to existing processes.A native remote client allows users to debug graphically from remotelocations.
Users interact with the debugged processes - being able to step or “play”processes, and examine where all processes are, and their variable valuesand array data across processes. Memory debugging can be enabled todetect common errors such as reading beyond array bounds automatically.
Platform support
IBM Blue Gene/Q, Linux x86_64, ARMv7, PowerPC (AIX and Linux) and allMPIs.
License
Commercial
Web page
http://www.allinea.com/products
Contact
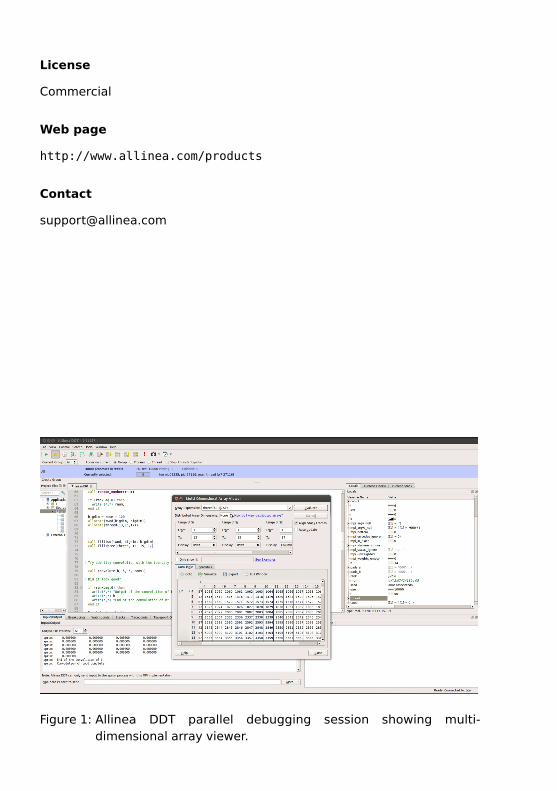
Figure 1: Allinea DDT parallel debugging session showing multi-dimensional array viewer.
Allinea MAPFocus
single
parallel
perform
debug
correct
workflow
Prog. model
MPI
OpenMP
Pthreads
OmpSs
CUDA
OpenCL
OpenACC
UPC
SHMEM
Language
C
C++
Fortran
Allinea MAP is a modern and easy to use profiling tool that is designed tohelp users visually identify performance issues in their application. It inte-grates profiling information alongside source code and can show metricssuch as vectorization, communication and I/O. The tool shares the sameconfiguration, interface and scalable architecture as its sister productAllinea DDT.
Typical questions Allinea MAP helps to answer
• Where is my code slow - what line and why?
• Am I achieving good vectorization?
• Is memory usage killing my performance?
Workflow
Applications can be launched via Allinea MAP and the performance data willbe recorded automatically. There is no need to recompile, although a “-g”flag will ensure accuracy of source line information. The “.map” files areanalysed inside the tool and are sufficiently compact to be easily shared.
Platform support
Linux x86_64 and all MPIs.
License
Commercial
Web page
http://www.allinea.com/products/map
Contact
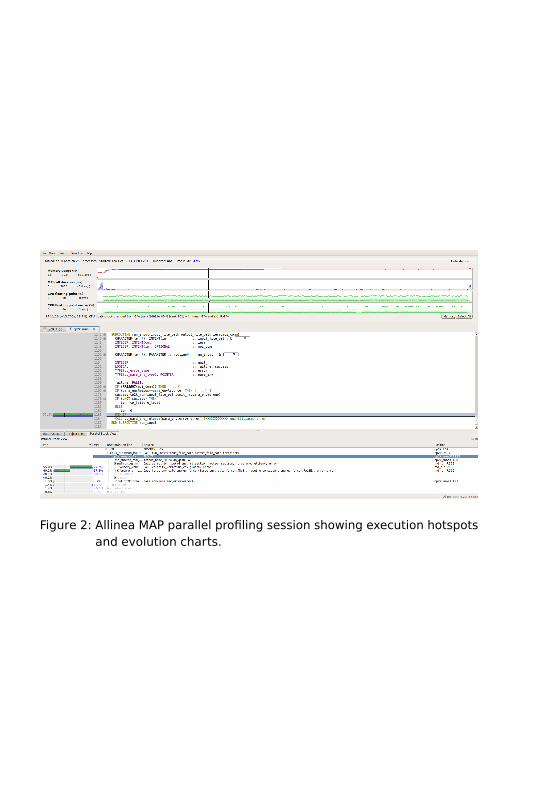
Figure 2: Allinea MAP parallel profiling session showing execution hotspotsand evolution charts.
Allinea Performance ReportsFocus
single
parallel
perform
debug
correct
workflow
Prog. model
MPI
OpenMP
Pthreads
OmpSs
CUDA
OpenCL
OpenACC
UPC
SHMEM
Language
C
C++
Fortran
Allinea Performance Reports is a performance tool that aims to provideinformation for anyone involved in HPC, not just software developers. Itdoes not require configuration or any change to the profiled application.
The output provided from a run is a single one-page report on applicationperformance - containing information such as vectorization, communica-tion, energy usage and I/O - with advice about what can be explored toimprove the performance.
Typical questions Allinea Performance helps to answer
• Am I achieving good vectorization?
• Is memory usage killing my performance?
• What system or usage changes could I make to improve performance?
Workflow
Applications are launched with a simple prefix-command (“perf-report”)to the existing MPI launch line. There is no need to recompile or relink onmost platforms. The “.html” report file created is then viewable in anystandard browser.
Platform support
Linux x86_64 and all major MPIs.
License
Commercial
Web page
http://www.allinea.com/products/performance
Contact
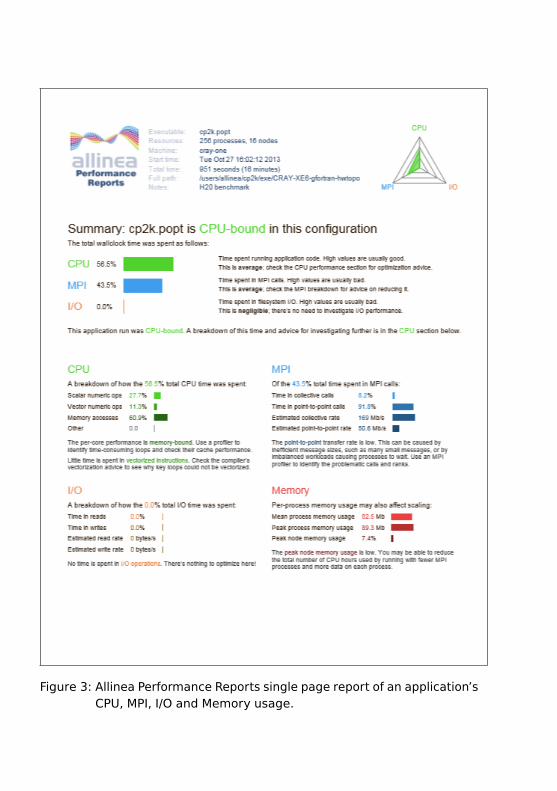
Figure 3: Allinea Performance Reports single page report of an application’sCPU, MPI, I/O and Memory usage.
ArcherFocus
single
parallel
perform
debug
correct
workflow
Prog. model
MPI
OpenMP
Pthreads
OmpSs
CUDA
OpenCL
OpenACC
UPC
SHMEM
Language
C
C++
Fortran
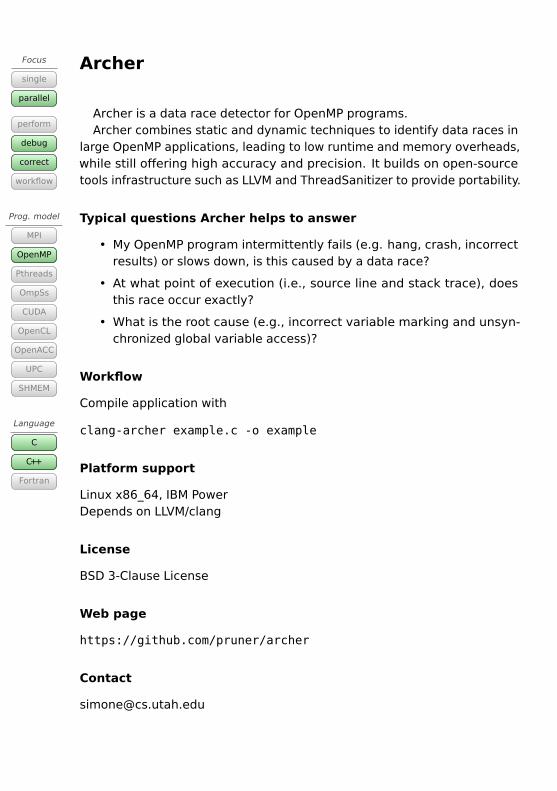
Archer is a data race detector for OpenMP programs.Archer combines static and dynamic techniques to identify data races in
large OpenMP applications, leading to low runtime and memory overheads,while still offering high accuracy and precision. It builds on open-sourcetools infrastructure such as LLVM and ThreadSanitizer to provide portability.
Typical questions Archer helps to answer
• My OpenMP program intermittently fails (e.g. hang, crash, incorrectresults) or slows down, is this caused by a data race?
• At what point of execution (i.e., source line and stack trace), doesthis race occur exactly?
• What is the root cause (e.g., incorrect variable marking and unsyn-chronized global variable access)?
Workflow
Compile application with
clang-archer example.c -o example
Platform support
Linux x86_64, IBM PowerDepends on LLVM/clang
License
BSD 3-Clause License
Web page
https://github.com/pruner/archer
Contact
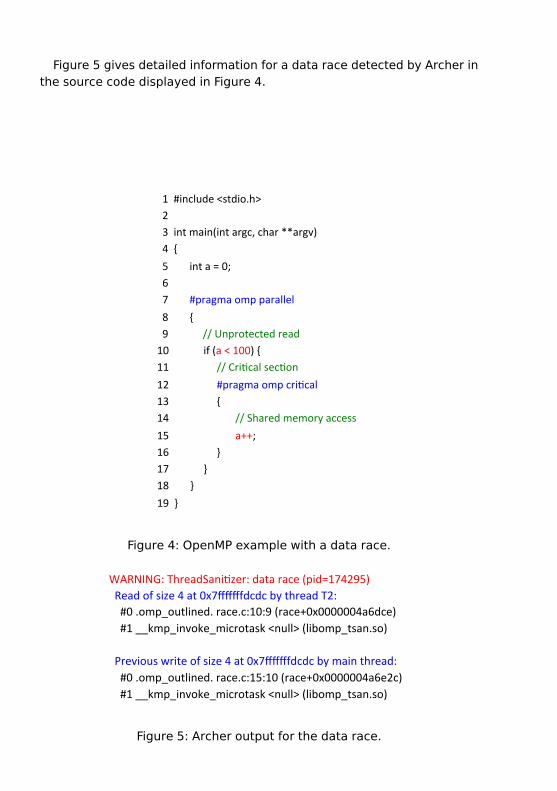
Figure 5 gives detailed information for a data race detected by Archer inthe source code displayed in Figure 4.
1#include<stdio.h>23intmain(intargc,char**argv)4{5inta=0;67#pragmaompparallel8{9//Unprotectedread10if(a<100){11//CriLcalsecLon12#pragmaompcriLcal13{14//Sharedmemoryaccess15a++;16}17}18}19}
Figure 4: OpenMP example with a data race.
WARNING:ThreadSani2zer:datarace(pid=174295)Readofsize4at0x7fffffffdcdcbythreadT2:#0.omp_outlined.race.c:10:9(race+0x0000004a6dce)#1__kmp_invoke_microtask<null>(libomp_tsan.so)Previouswriteofsize4at0x7fffffffdcdcbymainthread:#0.omp_outlined.race.c:15:10(race+0x0000004a6e2c)#1__kmp_invoke_microtask<null>(libomp_tsan.so)
Figure 5: Archer output for the data race.
CallgrindFocus
single
parallel
perform
debug
correct
workflow
Prog. model
MPI
OpenMP
Pthreads
OmpSs
CUDA
OpenCL
OpenACC
UPC
SHMEM
Language
C
C++
Fortran
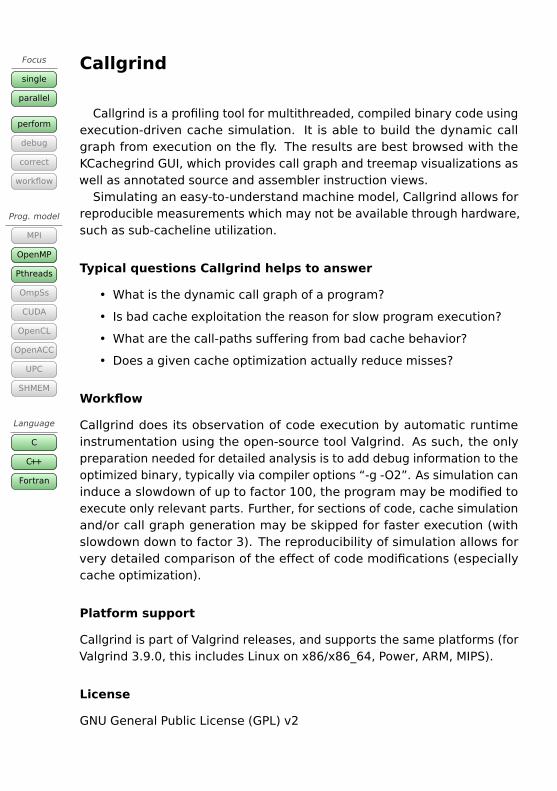
Callgrind is a profiling tool for multithreaded, compiled binary code usingexecution-driven cache simulation. It is able to build the dynamic callgraph from execution on the fly. The results are best browsed with theKCachegrind GUI, which provides call graph and treemap visualizations aswell as annotated source and assembler instruction views.
Simulating an easy-to-understand machine model, Callgrind allows forreproducible measurements which may not be available through hardware,such as sub-cacheline utilization.
Typical questions Callgrind helps to answer
• What is the dynamic call graph of a program?
• Is bad cache exploitation the reason for slow program execution?
• What are the call-paths suffering from bad cache behavior?
• Does a given cache optimization actually reduce misses?
Workflow
Callgrind does its observation of code execution by automatic runtimeinstrumentation using the open-source tool Valgrind. As such, the onlypreparation needed for detailed analysis is to add debug information to theoptimized binary, typically via compiler options “-g -O2”. As simulation caninduce a slowdown of up to factor 100, the program may be modified toexecute only relevant parts. Further, for sections of code, cache simulationand/or call graph generation may be skipped for faster execution (withslowdown down to factor 3). The reproducibility of simulation allows forvery detailed comparison of the effect of code modifications (especiallycache optimization).
Platform support
Callgrind is part of Valgrind releases, and supports the same platforms (forValgrind 3.9.0, this includes Linux on x86/x86_64, Power, ARM, MIPS).
License
GNU General Public License (GPL) v2
Web page
http://www.valgrind.org, http://kcachegrind.sourceforge.net
Contact
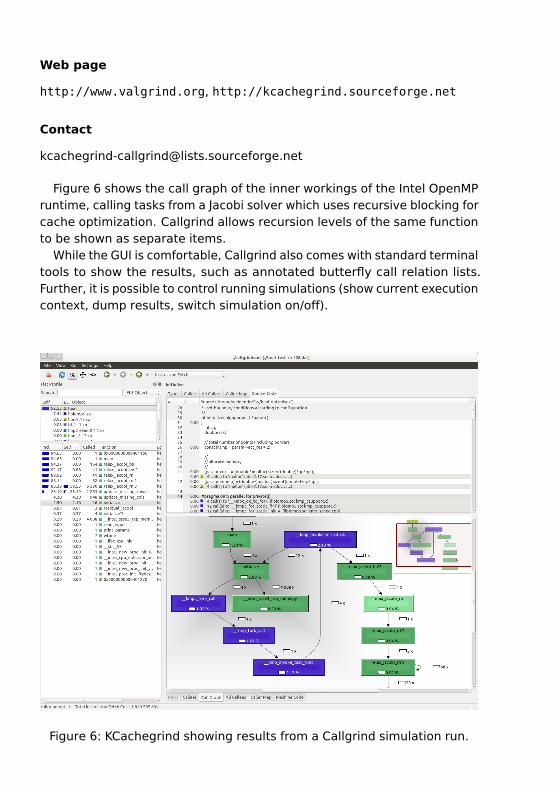
Figure 6 shows the call graph of the inner workings of the Intel OpenMPruntime, calling tasks from a Jacobi solver which uses recursive blocking forcache optimization. Callgrind allows recursion levels of the same functionto be shown as separate items.
While the GUI is comfortable, Callgrind also comes with standard terminaltools to show the results, such as annotated butterfly call relation lists.Further, it is possible to control running simulations (show current executioncontext, dump results, switch simulation on/off).
Figure 6: KCachegrind showing results from a Callgrind simulation run.
CubeFocus
single
parallel
perform
debug
correct
workflow
Prog. model
MPI
OpenMP
Pthreads
OmpSs
CUDA
OpenCL
OpenACC
UPC
SHMEM
Language
C
C++
Fortran
Cube is a generic tool for manipulating and displaying a multi-dimensionalperformance space consisting of the dimensions (i) performance metric,(ii) call path, and (iii) system resource. Each dimension can be representedas a tree, where non-leaf nodes of the tree can be collapsed or expandedto achieve the desired level of granularity and present inclusive or ex-clusive metric values. In addition, Cube can display multi-dimensionalCartesian process topologies, highlight a region from a source file, andpresent descriptions of metrics.
Typical questions Cube helps to answer
• Which metrics have values indicating performance problems?
• Which call-paths in the program have these values?
• Which processes and threads are most affected?
• How are metric values distributed across processes/threads?
• How do two analysis reports differ?
Workflow
Scalasca, Score-P and other tools use the provided libraries to write analysisreports in Cube format for subsequent interactive exploration in the CubeGUI. Additional utilities are provided for processing analysis reports.
Platform support
GUI: Linux (x86/x86_64/IA64/PPC/Power), Mac OS X (x86_64), Windows 7;
Libraries & utilities: IBM Blue Gene/P/Q, Cray XT/XE/XK/XC, SGI Altix (incl.ICE + UV), Fujitsu FX-10/100 & K Computer, Tianhe-1A, IBM SP & Bladeclusters (incl. AIX), Intel Xeon Phi, Linux clusters (x86/x86_64)
License
BSD 3-Clause License
Web page
http://www.scalasca.org
Contact
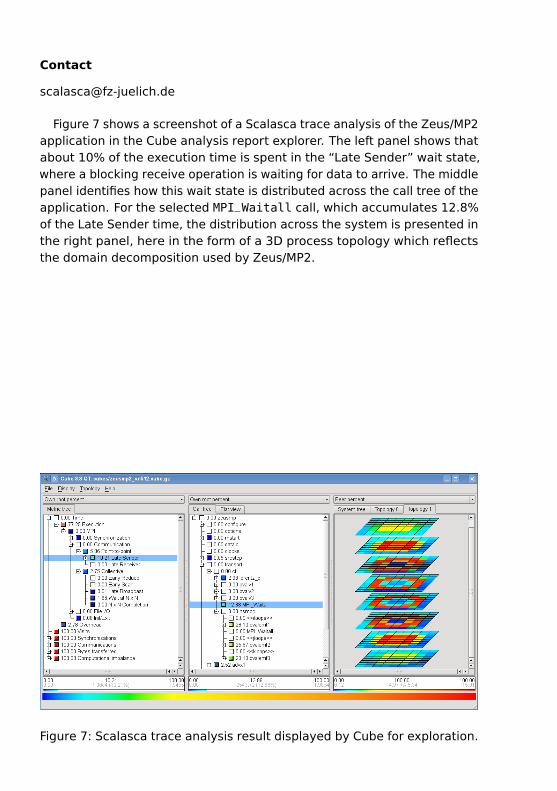
Figure 7 shows a screenshot of a Scalasca trace analysis of the Zeus/MP2application in the Cube analysis report explorer. The left panel shows thatabout 10% of the execution time is spent in the “Late Sender” wait state,where a blocking receive operation is waiting for data to arrive. The middlepanel identifies how this wait state is distributed across the call tree of theapplication. For the selected MPI_Waitall call, which accumulates 12.8%of the Late Sender time, the distribution across the system is presented inthe right panel, here in the form of a 3D process topology which reflectsthe domain decomposition used by Zeus/MP2.
Figure 7: Scalasca trace analysis result displayed by Cube for exploration.
DimemasFocus
single
parallel
perform
debug
correct
workflow
Prog. model
MPI
OpenMP
Pthreads
OmpSs
CUDA
OpenCL
OpenACC
UPC
SHMEM
Language
C
C++
Fortran
Dimemas is a performance analysis tool for message-passing programs.The Dimemas simulator reconstructs the temporal behavior of a parallelapplication using a recorded event trace and allows simulating the parallelbehavior of that application on a different system. The Dimemas architec-ture model is a network of parallel clusters. Dimemas supports two maintypes of analyses: what-if studies to simulate how an application wouldperform in a given scenario (e.g. reducing to half the network latency,moving to a CPU three times faster...), and parametric studies to analyzethe sensitivity of the code to system parameters (e.g. the execution timefor varying network bandwidths).. The target system is modeled by a set ofkey performance factors including linear components like the MPI point topoint transfer time, as well as non-linear factors like resources contention.By using a simple model Dimemas allows executing parametric studies ina very short time frame. Dimemas can generate among others a Paravertrace file, enabling the user to conveniently examine and compare thesimulated run and understand the application behavior.
Typical questions Dimemas helps to answer
• How would my application perform in a future system?
• Increasing the network bandwidth would improve the performance?
• Would my application benefit from asynchronous communications?
• Is my application limited by the network or the serializations anddependency chains within my code?
• What would be the impact of accelerating specific regions of mycode?
Workflow
The first step is to translate a Paraver trace file to Dimemas format.Thereby, it is recommended to focus on a representative region with a re-duced number of iterations. Second, the user specifies via a configurationfile the architectural parameters of the target machine and the mappingof the tasks on to the different nodes. Third, the output Paraver tracefile allows then to analyze and compare the simulated scenario with theoriginal run using the Paraver tool.
Platform support
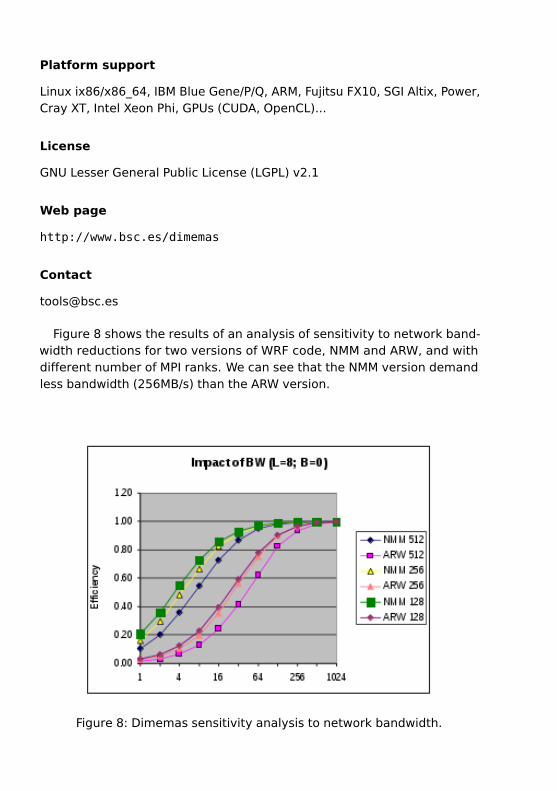
Linux ix86/x86_64, IBM Blue Gene/P/Q, ARM, Fujitsu FX10, SGI Altix, Power,Cray XT, Intel Xeon Phi, GPUs (CUDA, OpenCL)...
License
GNU Lesser General Public License (LGPL) v2.1
Web page
http://www.bsc.es/dimemas
Contact
Figure 8 shows the results of an analysis of sensitivity to network band-width reductions for two versions of WRF code, NMM and ARW, and withdifferent number of MPI ranks. We can see that the NMM version demandless bandwidth (256MB/s) than the ARW version.
Figure 8: Dimemas sensitivity analysis to network bandwidth.
Extra-PFocus
single
parallel
perform
debug
correct
workflow
Prog. model
MPI
OpenMP
Pthreads
OmpSs
CUDA
OpenCL
OpenACC
UPC
SHMEM
Language
C
C++
Fortran
Extra-P is an automatic performance-modeling tool that supports theuser in the identification of scalability bugs. A scalability bug is a part ofthe program whose scaling behavior is unintentionally poor, that is, muchworse than expected.
Extra-P uses measurements of various performance metrics at differentprocessor configurations as input to represent the performance of coderegions (including their calling context) as a function of the number of pro-cesses. All it takes to search for scalability issues even in full-blown codesis to run a manageable number of small-scale performance experiments,launch Extra-P, and compare the asymptotic or extrapolated performanceof the worst instances to the expectations. Besides the number of pro-cesses, it is also possible to consider other parameters such as the inputproblem size.
Extra-P generates not only a list of potential scalability bugs but alsohuman-readable models for all performance metrics available such asfloating-point operations or bytes sent by MPI calls that can be furtheranalyzed and compared to identify the root causes of scalability issues.
Typical questions Extra-P helps to answer
• Which regions of the code scale poorly?
• Which metrics cause the run-time to scale poorly?
• What are the best candidates for optimization?
• How will my application behave on a larger machine?
Workflow
Extra-P accepts input files in the Cube format and processes them into acondensed Cube format containing functions for each metric and call pathrather than individual measured values. Tools such as Scalasca, Score-P,and others are provided with libraries that produce analysis reports in theCube format. GUI plugins are provided to visualize, browse, and manipulatethe resulting models in the Cube browser. Detailed textual results are alsogenerated by Extra-P for the in-depth analysis of sensitive code regions.
Platform support
Linux (x86/x86_64/IA64/PPC/Power), Mac OS X (x86_64);
License
BSD 3-Clause License
Web page
http://www.scalasca.org
Contact
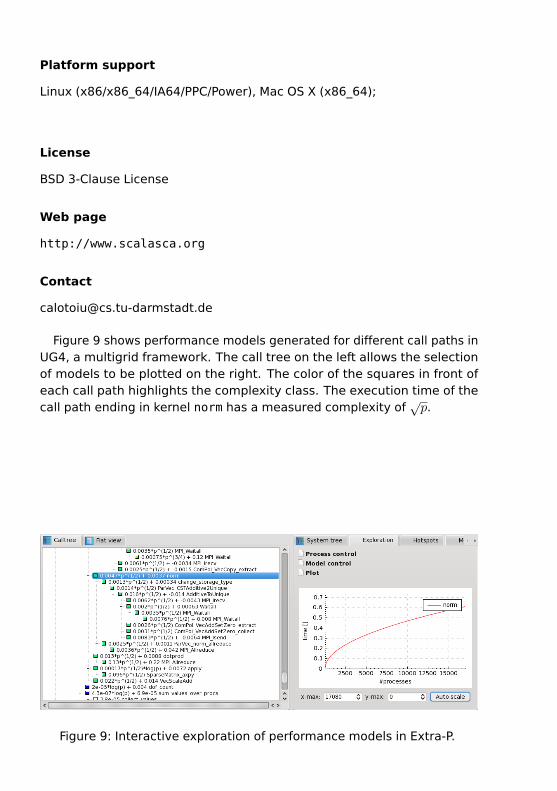
Figure 9 shows performance models generated for different call paths inUG4, a multigrid framework. The call tree on the left allows the selectionof models to be plotted on the right. The color of the squares in front ofeach call path highlights the complexity class. The execution time of thecall path ending in kernel norm has a measured complexity of
√p.
Figure 9: Interactive exploration of performance models in Extra-P.
JUBEFocus
single
parallel
perform
debug
correct
workflow
Prog. model
MPI
OpenMP
Pthreads
OmpSs
CUDA
OpenCL
OpenACC
UPC
SHMEM
Language
C
C++
Fortran
The JUBE environment provides a script-based application and platformindependent framework, which allows the creation and parametrisationof an automatic workflow execution to be used in benchmark, test orproduction scenarios.
Typical questions JUBE helps to answer
• How to run my application in a reproducible way?
• How to easily create a parameter study for my application?
• How to parametrise the different parts of my application from a singlepoint?
Workflow
JUBE is a Python-based tool which is configured using XML files. Withinthese input files an application workflow is based on different steps, wheredependencies and related files can be configured. For program executionJUBE uses normal Linux shell commands, which allows developers to keeptheir existing mechanism to start or manage applications.
In addition JUBE allows a flexible way to specify parameters, which canbe used to control the compilation of the application, its runtime argumentsand behaviour, or the job execution environment.
After program execution, JUBE can also run post-processing tools or scanany ASCII-based program output to extract useful information like timing in-formation or performance data. This information is gathered and displayedin a combined output form together with the selected parametrisation.
Platform support
Linux x86_64, (Python2.6, Python2.7, Python3.2 or any newer version)
License
GPLv3
Web page
http://www.fz-juelich.de/jsc/jube
Contact
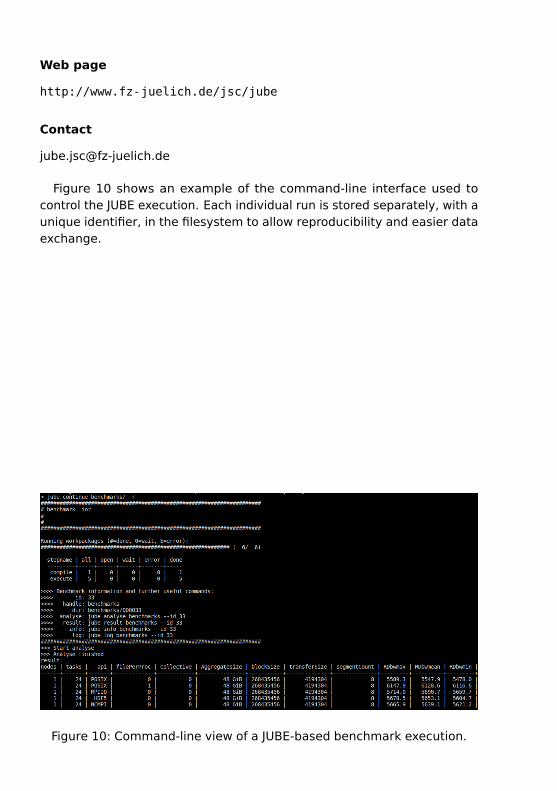
Figure 10 shows an example of the command-line interface used tocontrol the JUBE execution. Each individual run is stored separately, with aunique identifier, in the filesystem to allow reproducibility and easier dataexchange.
Figure 10: Command-line view of a JUBE-based benchmark execution.
MAQAOFocus
single
parallel
perform
debug
correct
workflow
Prog. model
MPI
OpenMP
Pthreads
OmpSs
CUDA
OpenCL
OpenACC
UPC
SHMEM
Language
C
C++
Fortran
MAQAO (Modular Assembly Quality Analyzer and Optimizer) is a perfor-mance analysis and optimization tool suite operating at binary level (norecompilation necessary). The main goal of MAQAO is to provide applica-tion developers with synthetic reports in order to help them optimizingtheir code. The tool mixes both dynamic and static analyses based on itsability to reconstruct high level structures such as functions and loops froman application binary.
Another key feature of MAQAO is its extensibility. Users can easily writetheir own modules thanks to an API using the Lua scripting language,allowing fast prototyping of new MAQAO modules.
Typical questions MAQAO helps to answer
• What is the time breakdown between I/O, MPI, OpenMP, PThreads inmy application ?
• Which functions and loops are the most time consuming ?
• Are all my hotspots consuming the same amount of time across allthe processes/threads (load balancing)?
• How can I optimize a loop ? Which performance factor may I gain ?
Workflow
The first step consists in pinpointing the most time consuming hotspotsin order to quickly identify where optimization efforts should be directedto. This is done through the LProf module, a sampling-based lightweightprofiler that offers results at the function and loop levels. LProf is alsoable to categorize its results depending on their source: parallelization(runtime), I/O, memory, main code, etc.
The Code Quality Analyzer (CQA) module can then help users optimizinghot loops. CQA performs static analysis to assess the quality of the codegenerated by the compiler and produces a set of reports describing poten-tial issues, an estimation of the potential gain if fixed, and hints on how toachieve this through compiler flags or source code transformations.
Platform support
Linux clusters (Intel 64 and Xeon Phi)
License
GNU Lesser General Public License (LGPL) v3
Web page
http://www.maqao.org
Contact
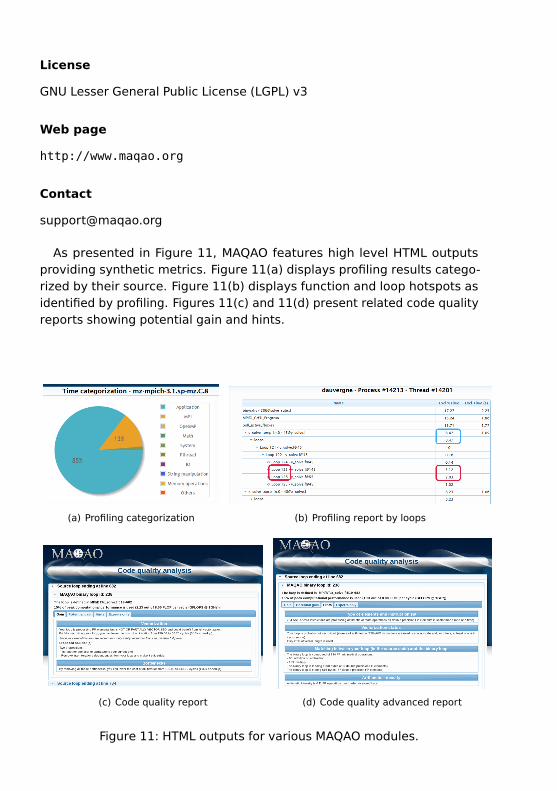
As presented in Figure 11, MAQAO features high level HTML outputsproviding synthetic metrics. Figure 11(a) displays profiling results catego-rized by their source. Figure 11(b) displays function and loop hotspots asidentified by profiling. Figures 11(c) and 11(d) present related code qualityreports showing potential gain and hints.
(a) Profiling categorization (b) Profiling report by loops
(c) Code quality report (d) Code quality advanced report
Figure 11: HTML outputs for various MAQAO modules.
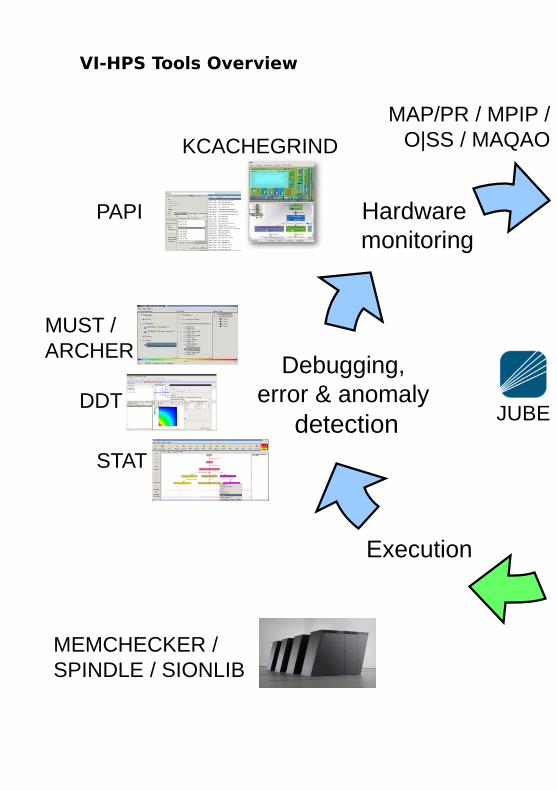
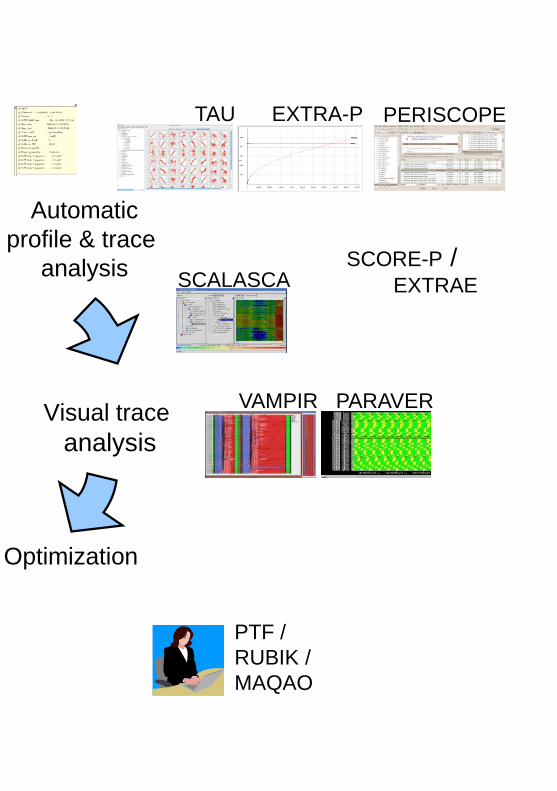
VI-HPS Tools Overview
VI-HPS Tools
SCALASCA SCORE-P / EXTRAE
Optimization
Visual trace
analysis
Automatic
profile & trace
analysis
Debugging,
error & anomaly
detection
Hardware
monitoring
Execution
VAMPIR PARAVER
PAPI
MUST /
ARCHER
PERISCOPE
KCACHEGRIND
PTF /
RUBIK /
MAQAO
MEMCHECKER /
SPINDLE / SIONLIB
STAT
MAP/PR / MPIP /
O|SS / MAQAO
JUBE
EXTRA-P TAU
DDT
MUSTFocus
single
parallel
perform
debug
correct
workflow
Prog. model
MPI
OpenMP
Pthreads
OmpSs
CUDA
OpenCL
OpenACC
UPC
SHMEM
Language
C
C++
Fortran
MUST detects whether an application conforms to the MPI standard and isintended to scale with the application (O(10,000) processes). At runtime ittransparently intercepts all MPI calls and applies a wide range of correct-ness checks (including type matching checks and deadlock detection) totheir arguments. This allows developers to identify manifest errors (onesyou already noticed), portability errors (manifest on other platforms), andeven unnoticed errors (e.g., silently corrupted results). When an applica-tion run with the tool finishes it provides its results in a correctness reportfor investigation.
Typical questions MUST helps to answer
• Has my application potential deadlocks?
• Am I doing type matching right?
• Does my application leak MPI resources?
• Other hidden errors?
Workflow
Replace mpiexec/mpirun/runjob/.. by mustrun:mpiexec -np 1024 executable → mustrun -np 1024 executableAfter the run inspect the outputfile MUST_Output.html with a browser(w3m, firefox, . . . ).
For Batchjobs: Note that the run uses extra MPI processes to executechecks, use "--must:info" to retrieve resource allocation information.
Platform support
Linux x86_64, IBM Blue Gene/Q, Cray XE (early support), SGI Altix4700Tested with various MPI implementations:Open MPI, Intel MPI, MPICH, MVAPICH2, SGI MPT, . . .
License
BSD 3-Clause License
Web page
https://www.itc.rwth-aachen.de/must
Contact
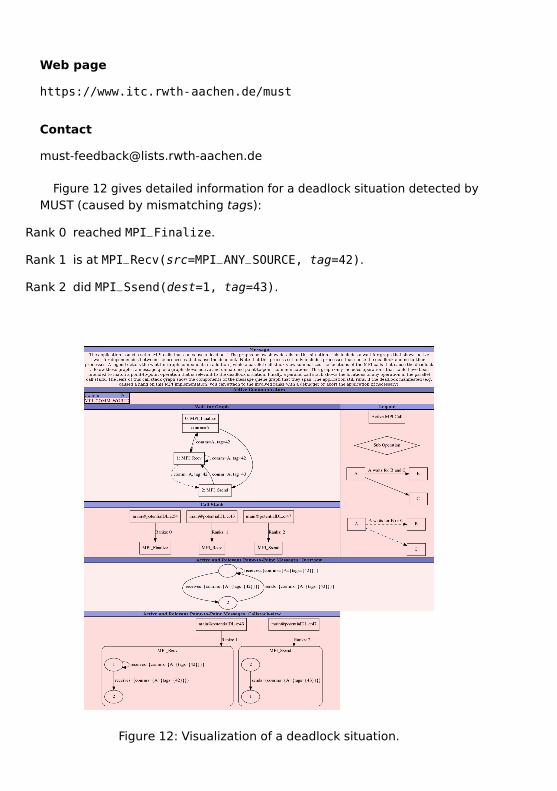
Figure 12 gives detailed information for a deadlock situation detected byMUST (caused by mismatching tags):
Rank 0 reached MPI_Finalize.
Rank 1 is at MPI_Recv(src=MPI_ANY_SOURCE, tag=42).
Rank 2 did MPI_Ssend(dest=1, tag=43).
Figure 12: Visualization of a deadlock situation.
Open|SpeedShopFocus
single
parallel
perform
debug
correct
workflow
Prog. model
MPI
OpenMP
Pthreads
OmpSs
CUDA
OpenCL
OpenACC
UPC
SHMEM
Language
C
C++
Fortran
Open|SpeedShop is an open source multi platform performance tool thatis targeted to support performance analysis of applications running onboth single nodes and large scale platforms. Open|SpeedShop is explicitlydesigned with usability in mind and provides both a comprehensive GUIas well as a command line interface (CLI). The base functionality includessampling experiments, support for callstack analysis, access to hardwareperformance counters, tracing and profiling functionality for both MPI andI/O operations, as well floating point exception analysis. Each of thesefunctionalities is available as an Experiment that a user can select andexecute on a given target application. Several other experiments, suchas memory analysis and CUDA support, are available in experimentalversions.
Typical questions this tool helps to answer
• In which module, function, loop or statement is my code spendingmost of its time (Experiment name: pcsamp)?
• On which call paths were my hotspots reached (Experiment name:usertime)?
• Which hardware resources cause bottlenecks for my execution (Ex-periment name: hwcsamp)?
• How do hardware performance counter results, like TLB misses, mapto my source (Experiment name: hwc/hwctime)?
• How much time am I spending in I/O or MPI operations (Experimentname: io/iot and mpi/mpit)?
Workflow
Open|SpeedShop can be applied to any sequential or parallel target ap-plication in binary form. To get finer grained attribution of performanceto individual statements, it is recommended to apply the tool to codescompiled with -g, although this is not a requirement. The user picks anexperiment (starting with the simple sampling experiment pcsamp is typi-cally a good idea) and prepends the execution of the code (incl. MPI joblauncher) with an Open|SpeedShop launch script for that experiment.
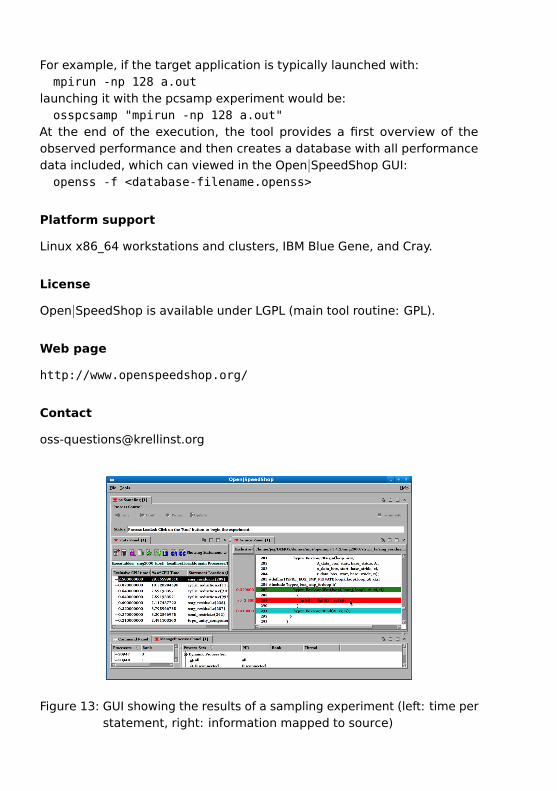
For example, if the target application is typically launched with:mpirun -np 128 a.out
launching it with the pcsamp experiment would be:osspcsamp "mpirun -np 128 a.out"
At the end of the execution, the tool provides a first overview of theobserved performance and then creates a database with all performancedata included, which can viewed in the Open|SpeedShop GUI:openss -f <database-filename.openss>
Platform support
Linux x86_64 workstations and clusters, IBM Blue Gene, and Cray.
License
Open|SpeedShop is available under LGPL (main tool routine: GPL).
Web page
http://www.openspeedshop.org/
Contact
Figure 13: GUI showing the results of a sampling experiment (left: time perstatement, right: information mapped to source)
PAPIFocus
single
parallel
perform
debug
correct
workflow
Prog. model
MPI
OpenMP
Pthreads
OmpSs
CUDA
OpenCL
OpenACC
UPC
SHMEM
Language
C
C++
Fortran
Parallel application performance analysis tools on large scale computingsystems typically rely on hardware counters to gather performance data.The PAPI performance monitoring library provides tool designers and appli-cation engineers with a common and coherent interface to the hardwareperformance counters (available on all modern CPUs) and other hardwarecomponents of interest (e.g., GPUs, network, and I/O systems).
Typical questions PAPI helps to answer
• What is the relation between software performance and hardwareevents?
• What are the number of cache misses, floating-point operations,executed cycles, etc. of the routines, loops in my application?
• How much data is sent over the network? How much data originatesfrom a node and how much is passed through a node?
• What is the system’s power usage and energy consumption when myapplication is executed?
Workflow
While PAPI can be used as a stand-alone tool, it is more commonly appliedas a middleware by third-party profiling, tracing as well as sampling tools(e.g., CrayPat, HPCToolkit, Scalasca, Score-P, TAU, Vampir), making it a defacto standard for hardware counter analysis.
The events that can be monitored involve a wide range of performance-relevant architectural features: cache misses, floating point operations,retired instructions, executed cycles, and many others. By tightly couplingPAPI with the tool infrastructure, pervasive performance measurementcapability - including accessing hardware counters, power and energymeasurements, and data transfers, at either the hardware or softwarelibrary level - can be made available.
Platform support
AMD, ARM Cortex A8, A9, A15 (coming soon ARM64), Cray, Fujitsu K Com-puter, IBM Blue Gene Series (including Blue Gene/Q: 5D-Torus, I/O system,CNK, EMON power), IBM Power Series; Intel (including RAPL power/energy,MIC power/energy), Linux clusters (x86/x86_64, MIPS), NVidia (Tesla, Kepler,NVML).
License
BSD 3-Clause License
Web page
http://icl.cs.utk.edu/papi
Contact
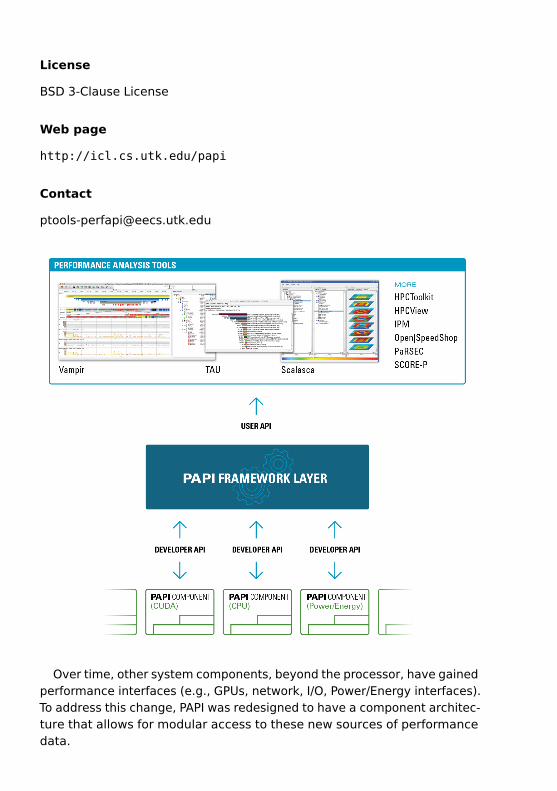
Over time, other system components, beyond the processor, have gainedperformance interfaces (e.g., GPUs, network, I/O, Power/Energy interfaces).To address this change, PAPI was redesigned to have a component architec-ture that allows for modular access to these new sources of performancedata.
ParaverFocus
single
parallel
perform
debug
correct
workflow
Prog. model
MPI
OpenMP
Pthreads
OmpSs
CUDA
OpenCL
OpenACC
UPC
SHMEM
Language
C
C++
Fortran
Paraver is a performance analyzer based on event traces with a greatflexibility to explore the collected data, supporting a detailed analysis ofthe variability and distribution of multiple metrics with the objective ofunderstanding the application’s behavior. Paraver has two main views withhigh flexibility to define and correlate them. The timeline view displaysthe application behavior with time, while the statistics view (histograms,profiles) complements the analysis with distribution of metrics. To facilitateextracting insight from detailed performance data, during the last yearsnew modules introduce additional performance analytics techniques: clus-tering, tracking and folding allow the performance analyst to identify theprogram structure, study its evolution and look at the internal structureof the computation phases. The tool has been demonstrated to be veryuseful for performance analysis studies, with unique features that revealprofound details about an application’s behavior and performance.
Typical questions Paraver helps to answer
• How well does the parallel program peform and how does the behaviorchange over time?
• What is the parallelization efficiency and the effect of communication?
• What differences can be observed between two executions?
• Are performance or workload variations the cause of load imbalancesin computation?
• Which performance issues are reflected by hardware counters?
Workflow
The basis of an analysis with Paraver is a measurement of the applicationexecution with its performance monitor Extrae. After opening the resultingtrace file in Paraver the user can select from a subset of introductoryanalysis views that are hinted by the tool based on the recorded metrics.These basic views allow an easy overview of the application behavior.Next to that, Paraver includes a multitude of predefined views enablinga deeper analysis. Furthermore, Paraver offers a very flexible way tocombine multiple views, so as to generate new representations of the dataand more complex derived metrics. Once a desired view is obtained, it canbe stored in a configuration file to apply it again to the same trace or to adifferent one.
Platform support
Linux ix86/x86_64, IBM Blue Gene/P/Q, ARM, Fujitsu FX10, SGI Altix, Power,Cray XT, Intel Xeon Phi, GPUs (CUDA, OpenCL), ...
License
GNU Lesser General Public License (LGPL) v2.1
Web page
http://www.bsc.es/paraver
Contact
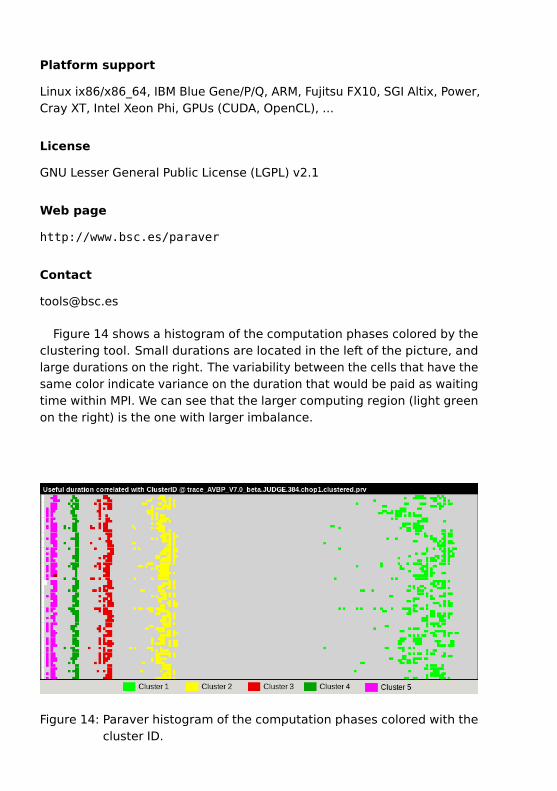
Figure 14 shows a histogram of the computation phases colored by theclustering tool. Small durations are located in the left of the picture, andlarge durations on the right. The variability between the cells that have thesame color indicate variance on the duration that would be paid as waitingtime within MPI. We can see that the larger computing region (light greenon the right) is the one with larger imbalance.
Figure 14: Paraver histogram of the computation phases colored with thecluster ID.
Periscope Tuning FrameworkFocus
single
parallel
perform
debug
correct
workflow
Prog. model
MPI
OpenMP
Pthreads
OmpSs
CUDA
OpenCL
OpenACC
UPC
SHMEM
Language
C
C++
Fortran
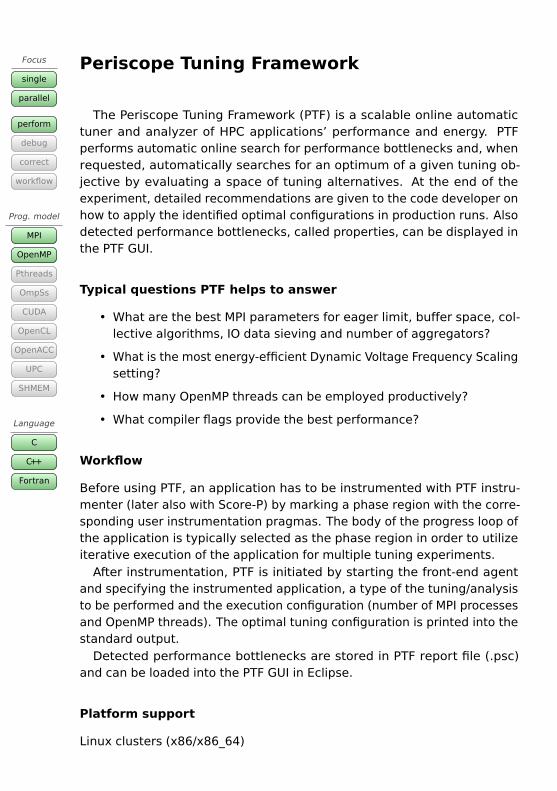
The Periscope Tuning Framework (PTF) is a scalable online automatictuner and analyzer of HPC applications’ performance and energy. PTFperforms automatic online search for performance bottlenecks and, whenrequested, automatically searches for an optimum of a given tuning ob-jective by evaluating a space of tuning alternatives. At the end of theexperiment, detailed recommendations are given to the code developer onhow to apply the identified optimal configurations in production runs. Alsodetected performance bottlenecks, called properties, can be displayed inthe PTF GUI.
Typical questions PTF helps to answer
• What are the best MPI parameters for eager limit, buffer space, col-lective algorithms, IO data sieving and number of aggregators?
• What is the most energy-efficient Dynamic Voltage Frequency Scalingsetting?
• How many OpenMP threads can be employed productively?
• What compiler flags provide the best performance?
Workflow
Before using PTF, an application has to be instrumented with PTF instru-menter (later also with Score-P) by marking a phase region with the corre-sponding user instrumentation pragmas. The body of the progress loop ofthe application is typically selected as the phase region in order to utilizeiterative execution of the application for multiple tuning experiments.
After instrumentation, PTF is initiated by starting the front-end agentand specifying the instrumented application, a type of the tuning/analysisto be performed and the execution configuration (number of MPI processesand OpenMP threads). The optimal tuning configuration is printed into thestandard output.
Detected performance bottlenecks are stored in PTF report file (.psc)and can be loaded into the PTF GUI in Eclipse.
Platform support
Linux clusters (x86/x86_64)
License
BSD 3-Clause License
Web page
http://periscope.in.tum.de/
Contact
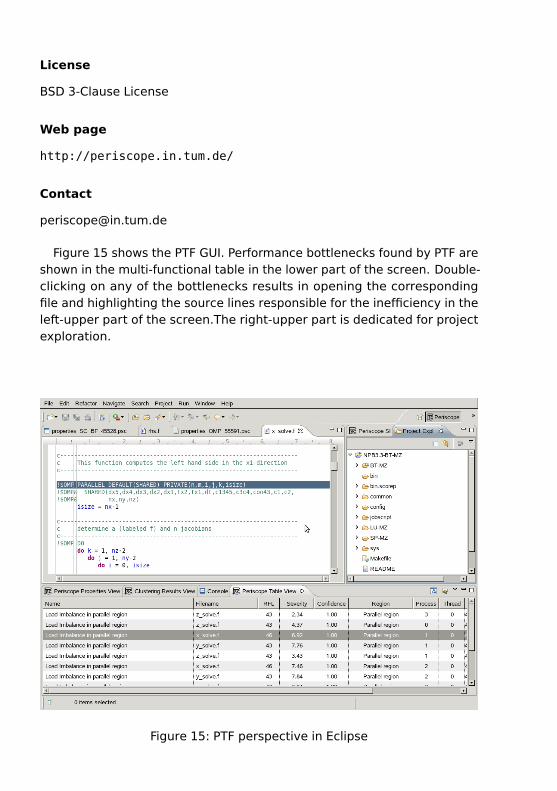
Figure 15 shows the PTF GUI. Performance bottlenecks found by PTF areshown in the multi-functional table in the lower part of the screen. Double-clicking on any of the bottlenecks results in opening the correspondingfile and highlighting the source lines responsible for the inefficiency in theleft-upper part of the screen.The right-upper part is dedicated for projectexploration.
Figure 15: PTF perspective in Eclipse
Scalasca Trace ToolsFocus
single
parallel
perform
debug
correct
workflow
Prog. model
MPI
OpenMP
Pthreads
OmpSs
CUDA
OpenCL
OpenACC
UPC
SHMEM
Language
C
C++
Fortran
The Scalasca Trace Tools support performance optimization of parallelprograms with a collection of highly scalable trace-based tools for in-depthanalyses of concurrent behavior. The Scalasca tools have been specifi-cally designed for use on large-scale systems such as the IBM Blue Geneseries and Cray XT and successors, but is also well suited for small- andmedium-scale HPC platforms. The automatic analysis identifies potentialperformance bottlenecks – in particular those concerning communicationand synchronization – and offers guidance in exploring their causes.
Typical questions the Scalasca Trace Tools help to answer
• Which call-paths in my program consume most of the time?
• Why is the time spent in communication or synchronization higherthan expected?
• For which program activities will optimization prove worthwhile?
• Does my program suffer from load imbalance and why?
Workflow
Before any Scalasca analysis can be carried out, an execution trace of thetarget application needs to be collected. For this task, Scalasca leveragesthe community-driven instrumentation and measurement infrastructureScore-P. After an optimized measurement configuration has been preparedbased on initial profiles, a targeted event trace in OTF2 format can begenerated, and subsequently analyzed by Scalasca’s automatic eventtrace analyzer after measurement is complete. This scalable analysissearches for inefficiency patterns and wait states, identifies their rootcauses (i.e., delays) also along far-reaching cause-effect chains, collectsstatistics about the detected wait-state instances, and determines a profileof the application’s critical path. The result can then be examined usingthe interactive analysis report explorer Cube.
Platform support
IBM Blue Gene, Cray XT/XE/XK/XC, SGI Altix (incl. ICE/UV), Fujitsu FX-10/100& K Computer, Tianhe-1A & 2, IBM SP & Blade clusters, Intel Xeon Phi, Linuxclusters (x86/x86_64, Power, ARM)
License
BSD 3-Clause License
Web page
http://www.scalasca.org
Contact
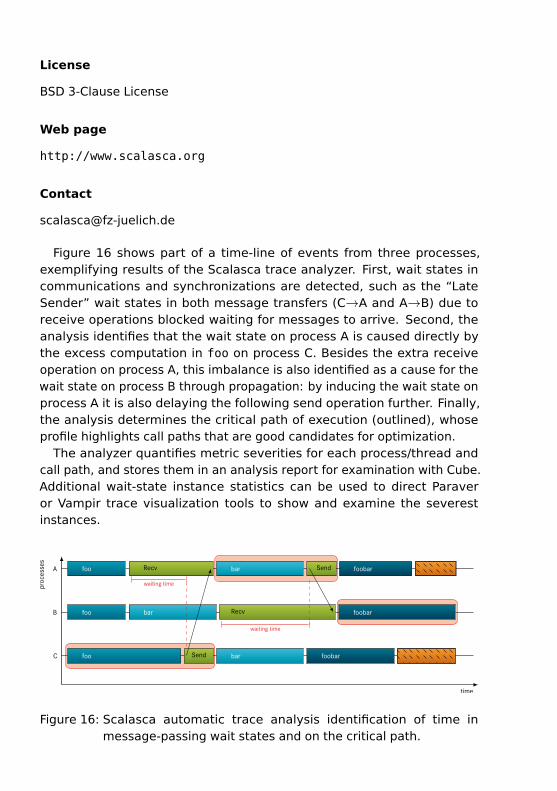
Figure 16 shows part of a time-line of events from three processes,exemplifying results of the Scalasca trace analyzer. First, wait states incommunications and synchronizations are detected, such as the “LateSender” wait states in both message transfers (C→A and A→B) due toreceive operations blocked waiting for messages to arrive. Second, theanalysis identifies that the wait state on process A is caused directly bythe excess computation in foo on process C. Besides the extra receiveoperation on process A, this imbalance is also identified as a cause for thewait state on process B through propagation: by inducing the wait state onprocess A it is also delaying the following send operation further. Finally,the analysis determines the critical path of execution (outlined), whoseprofile highlights call paths that are good candidates for optimization.
The analyzer quantifies metric severities for each process/thread andcall path, and stores them in an analysis report for examination with Cube.Additional wait-state instance statistics can be used to direct Paraveror Vampir trace visualization tools to show and examine the severestinstances.
time
proc
esse
s
A
B
C
foo bar foobar
foo bar foobar
foo bar foobar
Recv
Recv
Send
Send
waiting time
waiting time
Figure 16: Scalasca automatic trace analysis identification of time inmessage-passing wait states and on the critical path.
Score-PFocus
single
parallel
perform
debug
correct
workflow
Prog. model
MPI
OpenMP
Pthreads
OmpSs
CUDA
OpenCL
OpenACC
UPC
SHMEM
Language
C
C++
Fortran
The Score-P measurement infrastructure is a highly scalable and easy-to-use tool suite for profiling, event tracing, and online analysis. It supports awide range of HPC platforms and programming models. Score-P providescore measurement services for a range of specialized analysis tools, suchas Vampir, Scalasca, TAU, or Periscope.
Typical questions Score-P helps to answer
• Which call-paths in my program consume most of the time?
• How much time is spent in communication or synchronization?
Further analysis tools can also be employed on Score-P measurements.
Workflow
1. Preparation. To create measurements, the target program must be in-strumented. Score-P offers various instrumentation options, includingautomatic compiler instrumentation or manual source-code instru-mentation. As an alternative to automatic compiler instrumentation,events can be generated using a sampling approach.
2. Measurement. The instrumented program can be configured to recordan event trace or produce a call-path profile. Optionally, PAPI, rusage,and perf hardware metrics can be recorded. Filtering techniquesallow precise control over the amount of data to be collected.
3. Analysis. Call-path profiles can be examined in TAU or the Cubeprofile browser. Event traces can be examined in Vampir or used forautomatic bottleneck analysis with Scalasca. Alternatively, on-lineanalysis with Periscope is possible.
Platform support
IBM Blue Gene/P/Q, Cray XT/XE/XK/XC, SGI Altix/ICE, Fujitsu K Computer,FX10 and FX100, ARM32- and 64-bit, IBM Power 8, Intel Xeon Phi (nativemode), Linux clusters (x86/x86_64)
License
BSD 3-Clause License
Web page
http://www.score-p.org
Contact
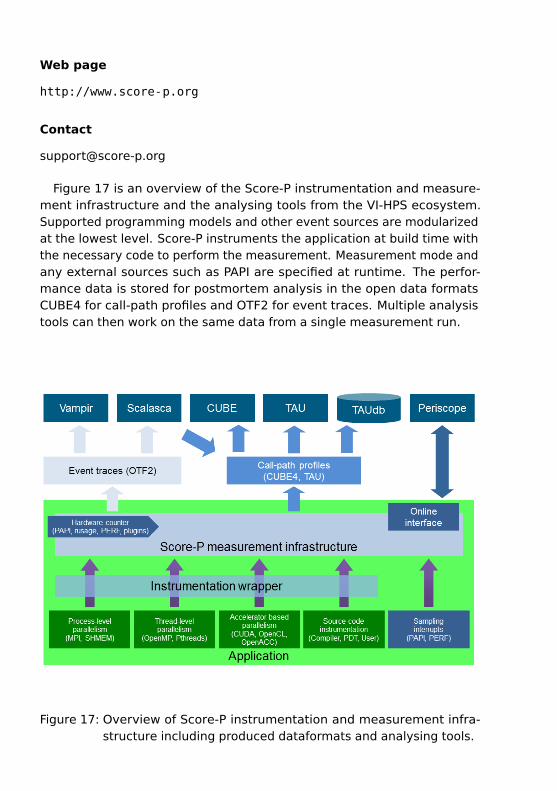
Figure 17 is an overview of the Score-P instrumentation and measure-ment infrastructure and the analysing tools from the VI-HPS ecosystem.Supported programming models and other event sources are modularizedat the lowest level. Score-P instruments the application at build time withthe necessary code to perform the measurement. Measurement mode andany external sources such as PAPI are specified at runtime. The perfor-mance data is stored for postmortem analysis in the open data formatsCUBE4 for call-path profiles and OTF2 for event traces. Multiple analysistools can then work on the same data from a single measurement run.
Figure 17: Overview of Score-P instrumentation and measurement infra-structure including produced dataformats and analysing tools.
STAT — The Stack Trace Analysis ToolFocus
single
parallel
perform
debug
correct
workflow
Prog. model
MPI
OpenMP
Pthreads
OmpSs
CUDA
OpenCL
OpenACC
UPC
SHMEM
Language
C
C++
Fortran
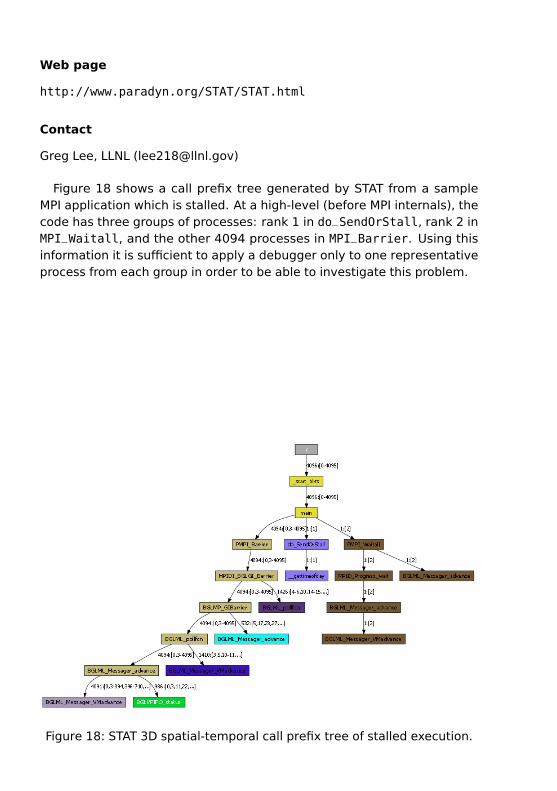
The Stack Trace Analysis Tool gathers and merges stack traces fromall processes of a parallel application. The tool produces call graphs: 2Dspatial and 3D spatial-temporal; the graphs encode calling behavior ofthe application processes in the form of a prefix tree. The 2D spatial callprefix tree represents a single snapshot of the entire application. The 3Dspatial-temporal call prefix tree represents a series of snapshots from theapplication taken over time (see Figure 18). In these graphs, the nodesare labeled by function names. The directed edges, showing the callingsequence from caller to callee, are labeled by the set of tasks that followthat call path. Nodes that are visited by the same set of tasks are assignedthe same color, giving a visual reference to the various equivalence classes.
Typical questions STAT helps to answer
• Where is my code stuck?
• Which processes have similar behavior?
• Where do I need to start debugging?
Workflow
STAT comes with its own GUI, invoked with the stat-gui command. Oncelaunched, this GUI can be used to select the application to debug (in thecontext of MPI applications typically the job launch process, i.e., mpirunor equivalent). STAT will then attach to the target application processes,gather the stack traces and display them within the GUI for analysis.
Platform support
Linux x86_64 workstations and clusters, IBM Blue Gene, and Cray XT/XE/XK.
License
BSD
Web page
http://www.paradyn.org/STAT/STAT.html
Contact
Greg Lee, LLNL ([email protected])
Figure 18 shows a call prefix tree generated by STAT from a sampleMPI application which is stalled. At a high-level (before MPI internals), thecode has three groups of processes: rank 1 in do_SendOrStall, rank 2 inMPI_Waitall, and the other 4094 processes in MPI_Barrier. Using thisinformation it is sufficient to apply a debugger only to one representativeprocess from each group in order to be able to investigate this problem.
Figure 18: STAT 3D spatial-temporal call prefix tree of stalled execution.
TAUFocus
single
parallel
perform
debug
correct
workflow
Prog. model
MPI
OpenMP
Pthreads
OmpSs
CUDA
OpenCL
OpenACC
UPC
SHMEM
Language
C
C++
Fortran
TAU is a comprehensive profiling and tracing toolkit that supports perfor-mance evaluation of programs written in C++, C, UPC, Fortran, Python, andJava. It is a robust, flexible, portable, and integrated framework and toolsetfor performance instrumentation, measurement, debugging, analysis, andvisualization of large-scale parallel computer systems and applications.TAU supports both direct measurement as well as sampling modes of in-strumentation and interfaces with external packages such as Score-P, PAPI,Scalasca, and Vampir.
Typical questions TAU helps to answer
• Which routines, loops, and statements in my program consume mostof the time?
• Where are the memory leaks in my code and where does my programviolate array bounds at runtime?
• What is the extent of I/O and what is the bandwidth of I/O operations?
• What is the performance of kernels that execute on accelerators suchas GPUs and Intel Xeon co-processors (MIC).
• What is the extent of variation of the power and heap memory usagein my code? When and where does it show extremes?
Workflow
TAU allows the user to instrument the program in a variety of ways in-cluding rewriting the binary using tau_rewrite or runtime pre-loading ofshared objects using tau_exec. Source level instrumentation typically in-volves substituting a compiler in the build process with a TAU compilerwrapper. This wrapper uses a given TAU configuration to link in the TAUlibrary. At runtime, a user may specify different TAU environment variablesto control the measurement options chosen for the performance experi-ment. This allows the user to generate callpath profiles, specify hardwareperformance counters, turn on event based sampling, generate traces, orspecify memory instrumentation options.
Performance-analysis results may be stored in TAUdb, a database forcross-experiment analysis and advanced performance data mining oper-ations using TAU’s PerfExplorer tool. It may be visualized using ParaProf,TAU’s 3D profile browser that can show the extent of performance variationand compare executions.
Supported platforms
IBM Blue Gene P/Q, NVIDIA and AMD GPUs and Intel MIC systems, CrayXE/XK/XC30, SGI Altix, Fujitsu K Computer (FX10), NEC SX-9, Solaris & Linuxclusters (x86/x86_64,MIPS,ARM), Windows, Apple Mac OS X.
Supported Runtime Layers
MPI, OpenMP (using GOMP, OMPT, and Opari instrumentation), Pthread,MPC Threads, Java Threads, Windows Threads, CUDA, OpenCL, OpenACC.
License
BSD style license
Web page
http://tau.uoregon.edu
Contact
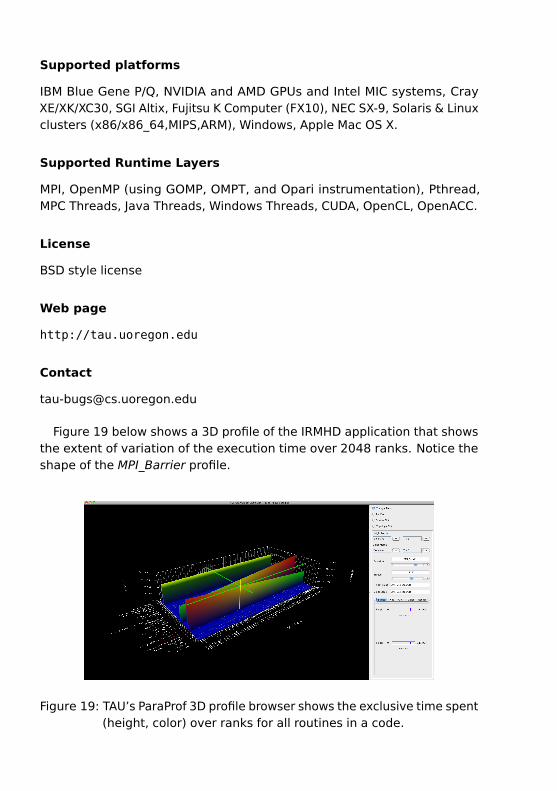
Figure 19 below shows a 3D profile of the IRMHD application that showsthe extent of variation of the execution time over 2048 ranks. Notice theshape of the MPI_Barrier profile.
Figure 19: TAU’s ParaProf 3D profile browser shows the exclusive time spent(height, color) over ranks for all routines in a code.
VampirFocus
single
parallel
perform
debug
correct
workflow
Prog. model
MPI
OpenMP
Pthreads
OmpSs
CUDA
OpenCL
OpenACC
UPC
SHMEM
Language
C
C++
Fortran
The Vampir performance visualizer allows to quickly study a program’sruntime behavior at a fine level of detail. This includes the display of de-tailed performance event recordings over time in timelines and aggregatedprofiles. Interactive navigation and zooming are the key features of thetool, which help to quickly identify inefficient or faulty parts of a program.
Typical questions Vampir helps to answer
• How well does my program make progress over time?
• When/where does my program suffer from load imbalances and why?
• Why is the time spent in communication or synchronization higherthan expected?
• Are I/O operations delaying my program?
• Does my hybrid program interplay well with the given accelerator?
Workflow
Before using Vampir, an application program needs to be instrumentedand executed with Score-P. Running the instrumented program produces abundle of trace files in OTF2-format with an anchor file called traces.otf2.When opening the anchor file with Vampir, a timeline thumbnail of thedata is presented. This thumbnail allows to select a subset or the totaldata volume for a detailed inspection. The program behavoir over timeis presented to the user in an interactive chart called Master Timeline.Further charts with different analysis focus can be added.
Platform support
IBM Blue Gene/Q, IBM AIX (x86_64,POWER6), Cray XE/XK/XC, SGI UV/ICE/Altix,Linux clusters (x86/x86_64), Windows, Apple Mac OS X.
License
Commercial
Web page
http://www.vampir.eu
Contact
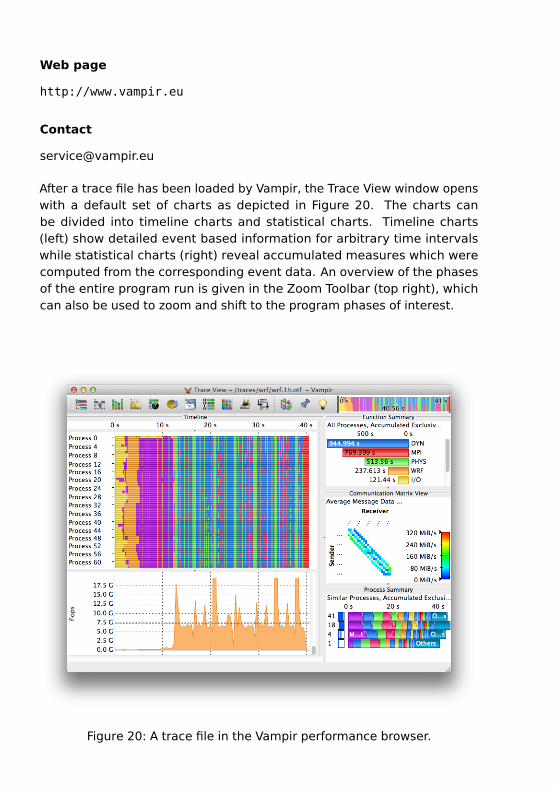
After a trace file has been loaded by Vampir, the Trace View window openswith a default set of charts as depicted in Figure 20. The charts canbe divided into timeline charts and statistical charts. Timeline charts(left) show detailed event based information for arbitrary time intervalswhile statistical charts (right) reveal accumulated measures which werecomputed from the corresponding event data. An overview of the phasesof the entire program run is given in the Zoom Toolbar (top right), whichcan also be used to zoom and shift to the program phases of interest.
Figure 20: A trace file in the Vampir performance browser.
VI-HPS training
Next to the development of state-of-the-art productivity tools for high-performance computing, the VI-HPS also provides training in the effectiveapplication of these tools. Workshops and tutorials are orchestrated inclose collaboration of the host organization to fit the particular need of theaudience.
Training events can be a tuning workshop, a custom workshop or course,or a tutorial conducted in collaboration with an HPC-related conference.Sign up to the VI-HPS news mailing list via our website to receive announce-ments of upcoming training events.
Tuning workshop series VI-HPS Tuning Workshops are the major train-ing vehicle where up to 30 participants receive instruction and guidanceapplying VI-HPS tools to their own parallel application codes, along withadvice for potential corrections and optimizations. Feedback to tools devel-opers also helps direct tools development to user needs, as well as improvetool documentation and ease of use. These workshops of three to fivedays at HPC centres occur several times per year, and feature a variety ofVI-HPS tools.
Other training events VI-HPS Tuning Workshops are complementedby additional courses and tutorials at conferences, seasonal schools andother invited training events which have taken place on four continents.Training events of individual VI-HPS partners can also be found on theirown websites.
Course material Coordinated tools training material is available withemphasis on hands-on exercises using VI-HPS tools individually and inter-operably. Exercises with example MPI+OpenMP parallel applications canbe configured to run on dedicated HPC compute resources or within thevirtual environment provided by a free Linux Live ISO that can be bootedand run on an x86_64 notebook or desktop computer.
Linux Live-ISO The downloadable VI-HPS Linux Live-ISO image providesa typical HPC development environment for MPI and OpenMP containingthe VI-HPS tools. Once booted, the running system provides the GNUCompiler Collection (including support for OpenMP multithreading) andOpenMPI message-passing library, along with a variety of parallel debug-ging, correctness checking and performance analysis tools.
The latest ISO/OVA files are currently only available as 64-bit versions,requiring a 64-bit x86-based processor and a 64-bit OS if running a vir-tual machine. Depending on available memory, it should be possible toapply the provided tools and run small-scale parallel programs (e.g., 16MPI processes or OpenMP threads). When the available processors areover-subscribed, however, measured execution performance will not berepresentative of dedicated HPC compute resources. Sample measure-ments and analyses of example and real applications from a variety of HPCsystems (many at large scale) are therefore provided for examination andinvestigation of actual execution performance issues.
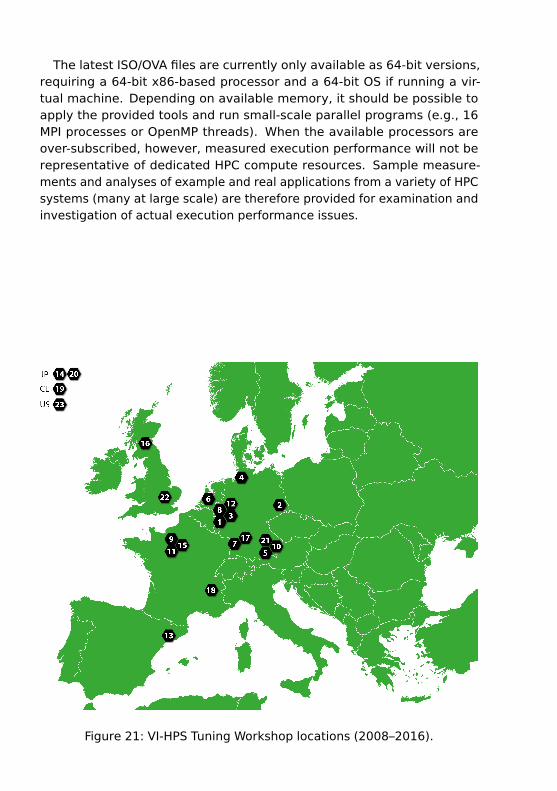
Figure 21: VI-HPS Tuning Workshop locations (2008–2016).
VI-HPS Tools Guide
The Virtual Institute – High Productivity Supercomputing (VI-HPS) aimsat improving the quality and accelerating the development process ofcomplex simulation codes in science and engineering that are beingdesigned to run on highly-parallel HPC computer systems. For thispurpose, the partners of VI-HPS are developing integrated state-of-the-art programming tools for high-performance computing that as-sist programmers in diagnosing programming errors and optimizingthe performance of their applications.
This VI-HPS Tools Guide provides a brief overview of the technologiesand tools developed by the twelve partner institutions of the VI-HPS. Itis intended to assist developers of simulation codes in deciding whichof the tools of the VI-HPS portfolio is best suited to address their needswith respect to debugging, correctness checking, and performanceanalysis.
www.vi-hps.org | [email protected]