top companies for women technologists
TRANSCRIPT

Top Companies for Women Technologists2021 Key Findings and Insights
Dare to put the change where it belongs

TOP COMPANIES FOR WOMEN TECHNOLOGISTS ©2021 AnitaB.org Page 2
WHILE 2020 WILL BE REMEMBERED MOST for the way COVID-19 changed our lives in nearly every way and in every part of the world, it will also be remembered for some remarkable strides made to advance gender equality and inclusion. In the technology industry specifically, women faced challenges in what was ultimately deemed a “she-cession.” However, as the latest iteration of Top Companies found, some tech companies stayed the course towards diversity and took multiple steps to increase and diversify the technical talent pool. Now in its eleventh year, Top Companies continues its work to provide insights and transparency into these types of workforce trends, in hopes of elevating equity and equality in the tech industry and beyond. This year’s report provides more insights than ever before, covering a vast array of topics pertinent to women technologists – from training to childcare support and more. This is also the first year we have created an interactive component to Top Companies, with a dashboard that allows anyone to drill
down to more specifics based on technical workforce size. On behalf of everyone at AnitaB.org, I want to thank you participating companies for sharing your data with us. These data are essential in our work in sustaining an equitable future for women in tech. Sharing your data helps us ignite much-needed conversations and, ultimately, serves as the fuel that allows us to cultivate a community invested in creating a world of inclusive technology. With 2020 behind us, this challenging year now under our belts, let’s learn from these insights and search for ways our organization can partner with yours in making the technology industry a more inclusive place. It is our hope that this information serves as a starting point for you and your place of work to improve and foster a more informed and diverse environment in which all can thrive.
Executive Summary 3About Top Companies 4Winners, Leaders and Participants 5Representation 6Hiring 11Retention 15Advancement 17Company Leadership 19Caregiving Support 20Flexible Work 25Pay Equity 27Inclusion 29Transparency 31Sponsorship 32Conclusion and Call to Action 34
Brenda Darden WilkersonAnitaB.org President and CEO

EXECUTIVE SUMMARYIn 2021, Top Companies collected and analyzed data on more than half a million U.S. technologists from 56 companies
Percent of companies providing the following to technologists
12.6%
9.3%
0.6%
0.1%
0.0%
White
Asian
1.5%Latinx
1.7%Black
Multiracial
Native American
Pacific Islander
Overall representation of women technologists
Representation of tech women by career levelRepresentation of tech women
by race/ethnicity
26.7% 87.3%Childcare Support
94.4%Flexible
Work
75.5%Pay Equity
Policy
83.6%Unbias Hiring
Training
76.4%Unbias
Performance Management
Training
60.4%Sponsorship
Programs
81.8%12+ Weeks to Birthparents
36.4%12+ Weeks to
Non-birthparentsWomen promoted
Men promoted
ADVANCEMENT
16.9%15.7%
Women hired
Men hired
HIRING
30.9%68.8%
Women exited
Men exited
RETENTION
11.3%12.2%
39.0%
32.8%
26.2%
22.4%
21.5%
10.9%
Intern
Mid
Senior
Entry
Exec
CEO
Parity is possible6 companies achieved representation parity
in at least one career level.

TOP COMPANIES FOR WOMEN TECHNOLOGISTS ©2021 AnitaB.org Page 4
In 2021, Top Companies measured the U.S. technical workforces of 56 companies
View Top Companies 2021: Dare to Explore dashboard to see data broken down by tech workforce size.
AboutTop Companies
Top Companies for Women Technologists is the only benchmarking program that specifically evaluates the technical workforce and awards companies that are making the most progress toward intersectional gender equity.
Top Companies for Women Technologists is a national program from AnitaB.org that identifies key trends around the equity of women technologists in the workforce. Launched in 2011, the program helps organizations discover areas where they can improve and signals a commitment to diversity, equity, and inclusion that women look for in an employer. This report contains the findings for data collected from participating companies for the period of January 1, 2020, through December 31, 2020. At a time when women, particularly women of color, are significantly underrepresented on teams that are building technologies that shape every aspect of modern life, Top Companies helps point the way to a more diverse, equitable, and inclusive future.
552,751Technologists
Women Technologists
141,038Women of Color Technologists
79,163
Large Technical Workforce
> 10,000 14 companies
Medium Technical Workforce
1,000-10,000 29 companies
Small Technical Workforce
< 1,000 13 companies
Segmentation by technical workforce size allows AnitaB.org to examine the role that tech workforce size plays in creating structural equity.
TOP COMPANIES FOR WOMEN TECHNOLOGISTS ©2021 AnitaB.org Page 4
TOP COMPANIES FOR WOMEN TECHNOLOGISTS ©2021 AnitaB.org Page 5
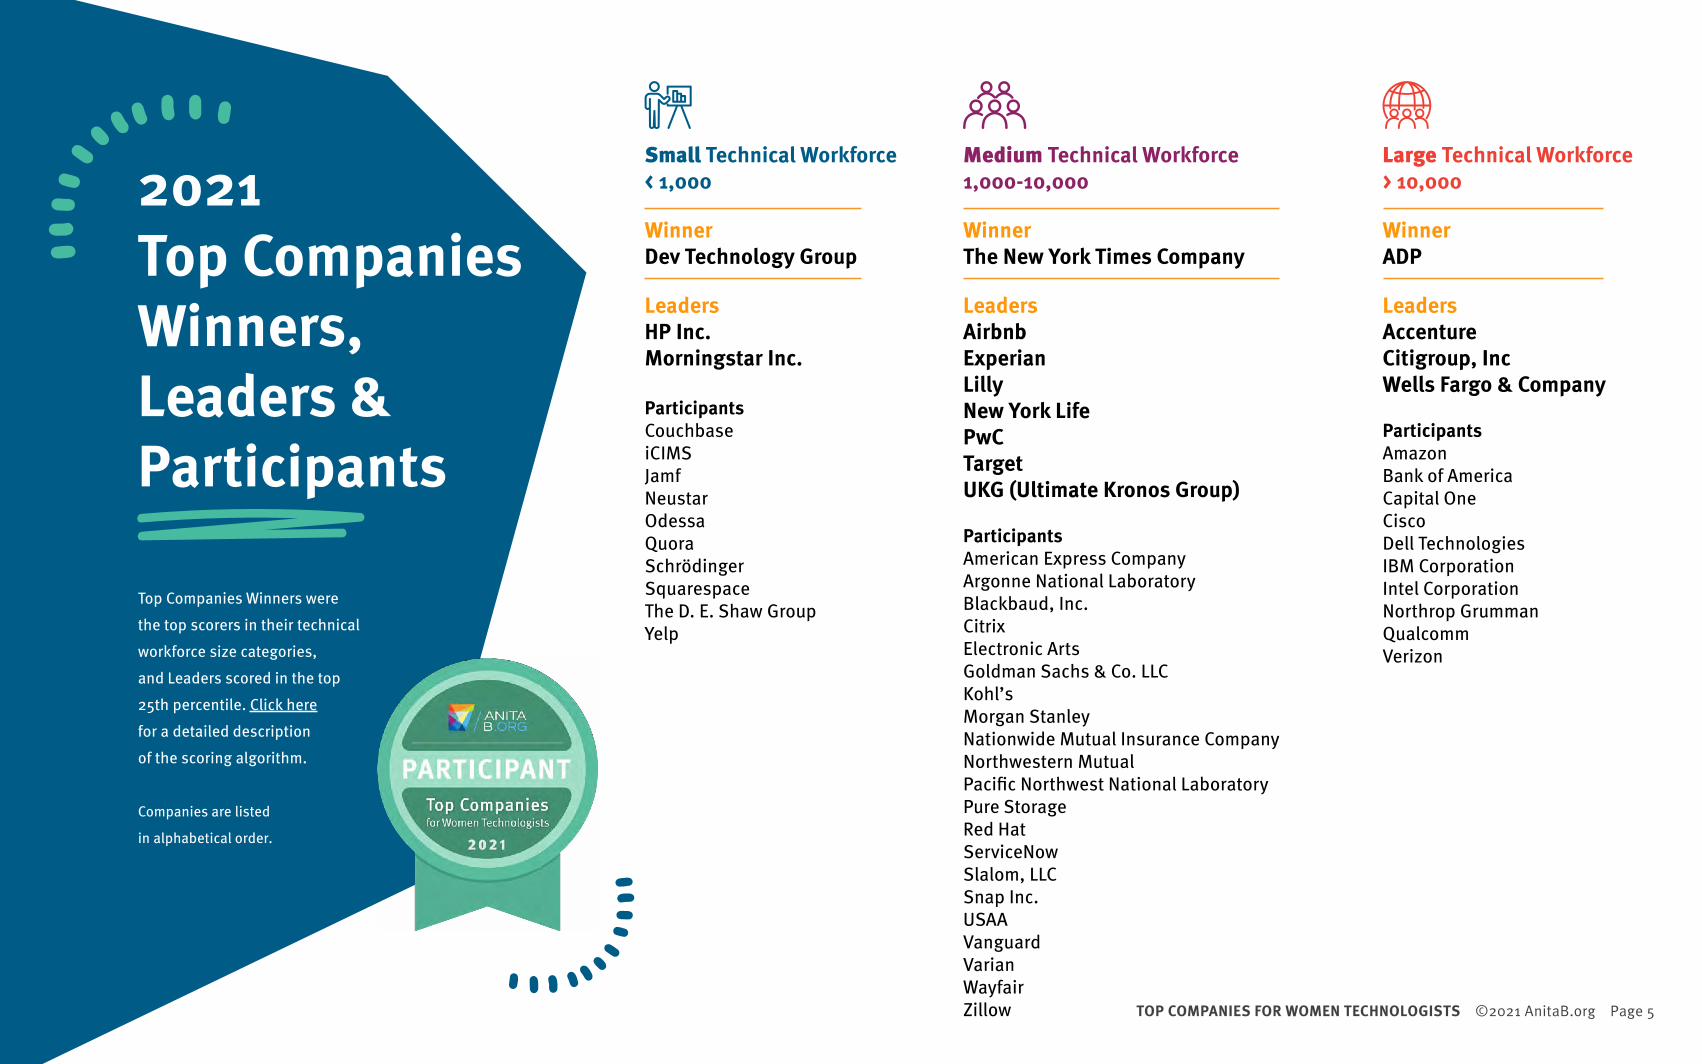
2021Top CompaniesWinners, Leaders & Participants
Large Technical Workforce > 10,000
WinnerADP
LeadersAccentureCitigroup, IncWells Fargo & Company
ParticipantsAmazonBank of AmericaCapital OneCiscoDell TechnologiesIBM CorporationIntel CorporationNorthrop GrummanQualcommVerizon
Medium Technical Workforce 1,000-10,000
WinnerThe New York Times Company
LeadersAirbnbExperianLillyNew York LifePwCTargetUKG (Ultimate Kronos Group)
ParticipantsAmerican Express CompanyArgonne National LaboratoryBlackbaud, Inc.CitrixElectronic ArtsGoldman Sachs & Co. LLCKohl’sMorgan StanleyNationwide Mutual Insurance CompanyNorthwestern MutualPacific Northwest National LaboratoryPure StorageRed HatServiceNowSlalom, LLCSnap Inc.USAAVanguardVarianWayfairZillow
Small Technical Workforce < 1,000
WinnerDev Technology Group
LeadersHP Inc.Morningstar Inc.
ParticipantsCouchbaseiCIMSJamfNeustarOdessaQuoraSchrödingerSquarespaceThe D. E. Shaw GroupYelp
Top Companies Winners were the top scorers in their technical workforce size categories, and Leaders scored in the top 25th percentile. Click here for a detailed description of the scoring algorithm.
Companies are listed
in alphabetical order.

TOP COMPANIES FOR WOMEN TECHNOLOGISTS ©2021 AnitaB.org Page 6
The total representation of technical women decreased by 2.1 percentage points from 2020 to 2021. Small workforces incurred the greatest losses, with a decrease of 5.1 percentage points. The overall decrease is explained mostly by chance, as the participating companies differ each year. Historically, Top Companies participants have had a higher representation of tech women than the overall industry. This year, the representation of tech women in participating companies was more consonant with the industry average of about 26%.
REPRESENTATION
Data collection period: Previous Top Companies submissions collected data from March 1st of the previous year to March 31st of the current year. This year Top Companies shifted the collection period to the calendar year. Throughout the report, data labeled 2021 is as of January 1, 2021.
Decline in overall representation of women technologists
26.7%January 2021
28.8% March 202026.2% March 2019
25.1%Small
27.8%Medium
26.2%Large
Tech women’s representation by technical workforce size
Technical women’s representation

TOP COMPANIES FOR WOMEN TECHNOLOGISTS ©2021 AnitaB.org Page 7
Decreased representation of technical women at most career levels
The representation of techincal women decreased at all career levels except intern. Losses were greatest at the entry and senior levels; after climbing annually since March 2018, representation for entry- and senior-level women in January 2021 was at its lowest since March 2019.
REPR
ESEN
TATI
ON 23.6%
38.8% 39.0%
32.8%
26.2%
22.4%
21.5%
31.6%33.1%
36.2%
25.8% 26.0%
28.3%
22.2%21.3%
18.0%19.8%
24.1%
Intern
Entry
Mid
Exec
Senior
March 2018March 2019
March 2020
January 2021
TOP COMPANIES FOR WOMEN TECHNOLOGISTS ©2021 AnitaB.org Page 8
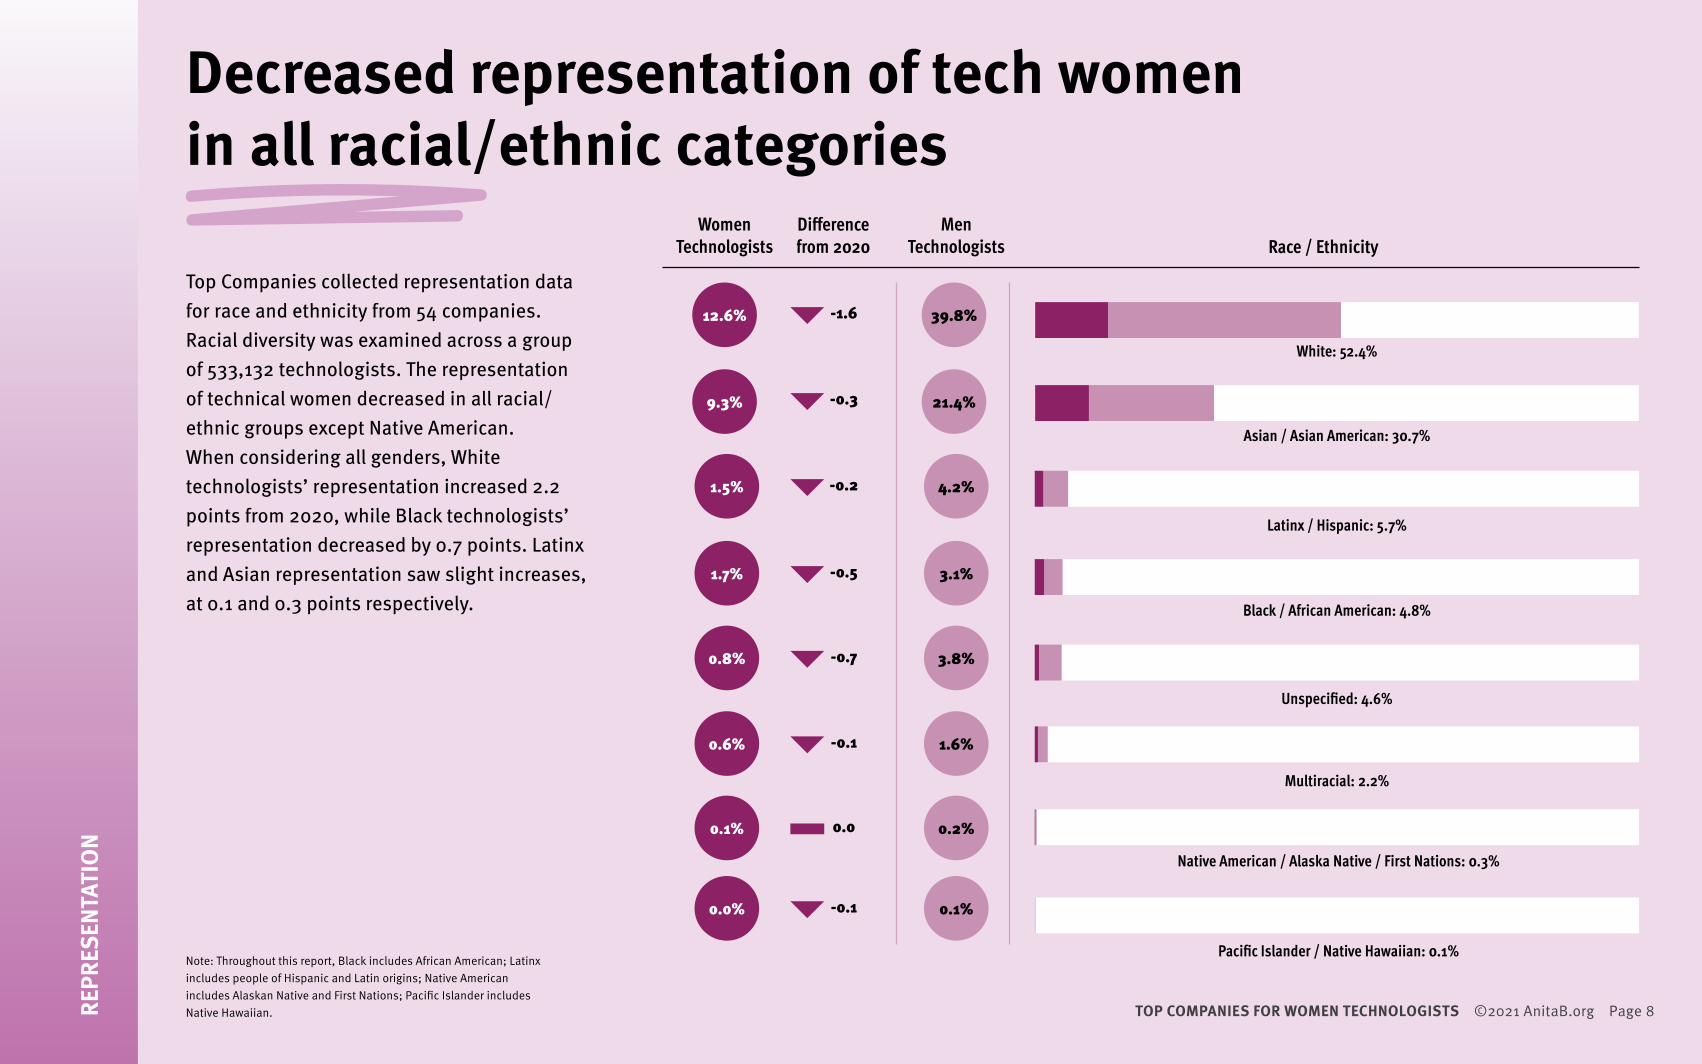
Decreased representation of tech women in all racial/ethnic categories
Top Companies collected representation data for race and ethnicity from 54 companies. Racial diversity was examined across a group of 533,132 technologists. The representation of technical women decreased in all racial/ethnic groups except Native American. When considering all genders, White technologists’ representation increased 2.2 points from 2020, while Black technologists’ representation decreased by 0.7 points. Latinx and Asian representation saw slight increases, at 0.1 and 0.3 points respectively.
REPR
ESEN
TATI
ON
Note: Throughout this report, Black includes African American; Latinx includes people of Hispanic and Latin origins; Native American includes Alaskan Native and First Nations; Pacific Islander includes Native Hawaiian.
White: 52.4%
Women Technologists
12.6%
9.3%
1.5%
1.7%
0.8%
0.6%
0.1%
Men Technologists
39.8%
21.4%
4.2%
3.1%
3.8%
1.6%
0.2%
0.1% 0.0%
Race / Ethnicity
Asian / Asian American: 30.7%
Latinx / Hispanic: 5.7%
Black / African American: 4.8%
Unspecified: 4.6%
Multiracial: 2.2%
Pacific Islander / Native Hawaiian: 0.1%
Native American / Alaska Native / First Nations: 0.3%
-1.6
-0.3
-0.2
-0.5
-0.7
-0.1
0.0
-0.1
Difference from 2020

TOP COMPANIES FOR WOMEN TECHNOLOGISTS ©2021 AnitaB.org Page 9REPR
ESEN
TATI
ON
Fewer than 8% of companies report non-binary data for technical employees
This year only 4 companies provided data on non-binary employees. It is unclear whether other companies have no non-binary employees or are not collecting non-binary gender information. This lack of data is troubling because a recent study found that 1.2 million lesbian, gay, bisexual, transgender, queer, and questioning (LGBTQ) people in the United States identify as non-binary, amounting to about 11% of all LGBTQ adults.1
1. Wilson, B.D.M., & Meyer, I.H. (2021). Nonbinary LGBTQ Adults in the United States. Williams Institute. https://williamsinstitute.law.ucla.edu/publications/nonbinary-lgbtq-adults-us/
CALL TO ACTION:More companies must
begin to provide non-binary gender
options to employees.
Intern Entry Mid Senior Exec
Percent of tech career level that is non-binary
Race/ethnicityof non-binary
technicalworkforce
White 65.3%
Native American 1.0%
Multiracial 2.1%
Unspecified 15.9%
Latinx 4.2%
Asian 1.0%
Black 10.4%

TOP COMPANIES FOR WOMEN TECHNOLOGISTS ©2021 AnitaB.org Page 10Page 10 TOP COMPANIES FOR WOMEN TECHNOLOGISTS — BUILDING A MORE INCLUSIVE FUTURE ©2020 AnitaB.org TOP COMPANIES FOR WOMEN TECHNOLOGISTS ©2021 AnitaB.org Page 10
Dev Technology Group created and enhanced activities to
support organizational community and allyship, as well as spearheaded conversations about anti-racism and
inclusion in partnership with the A Long Talk Program to discuss relevant
issues around systemic racism.
Dev Technology Group Small Technical Workforce Winner

Greater percentage of new hires are women, but overall hiring decreases
TOP COMPANIES FOR WOMEN TECHNOLOGISTS ©2021 AnitaB.org Page 11
Women’s representation in new hires increased this year, continuing a favorable trend of the last five years. However, many companies instituted hiring freezes for portions of 2020, causing an overall decrease in tech new hires. Because hiring is the primary driver of increasing diversity, decreased overall hiring resulted in 18.2% fewer tech women brought into organizations this year.
HIRING
Percent of technical new hires by race and gender
Percent of tech new hires that are women
27.3% 29.4% 30.9%
March 2019 March 2020 January 2021
White: 42.7%
Women Technologists
10.9%
13.1%
0.8%
0.1%
0.04%
Men Technologists
31.8%
22.2%
1.9%
0.1%
0.1%
Race / Ethnicity
Asian: 35.3%
Multiracial: 2.7%
Native American: 0.2%
Pacific Islander: 0.14%
1.8% 4.8%
Latinx: 6.6%
2.5% 4.3%
Black: 6.8%Prior to COVID-19, 20% of the technical workforce were new hires. By January 2021, overall technical hiring dropped to 14%.
TOP COMPANIES FOR WOMEN TECHNOLOGISTS ©2021 AnitaB.org Page 12
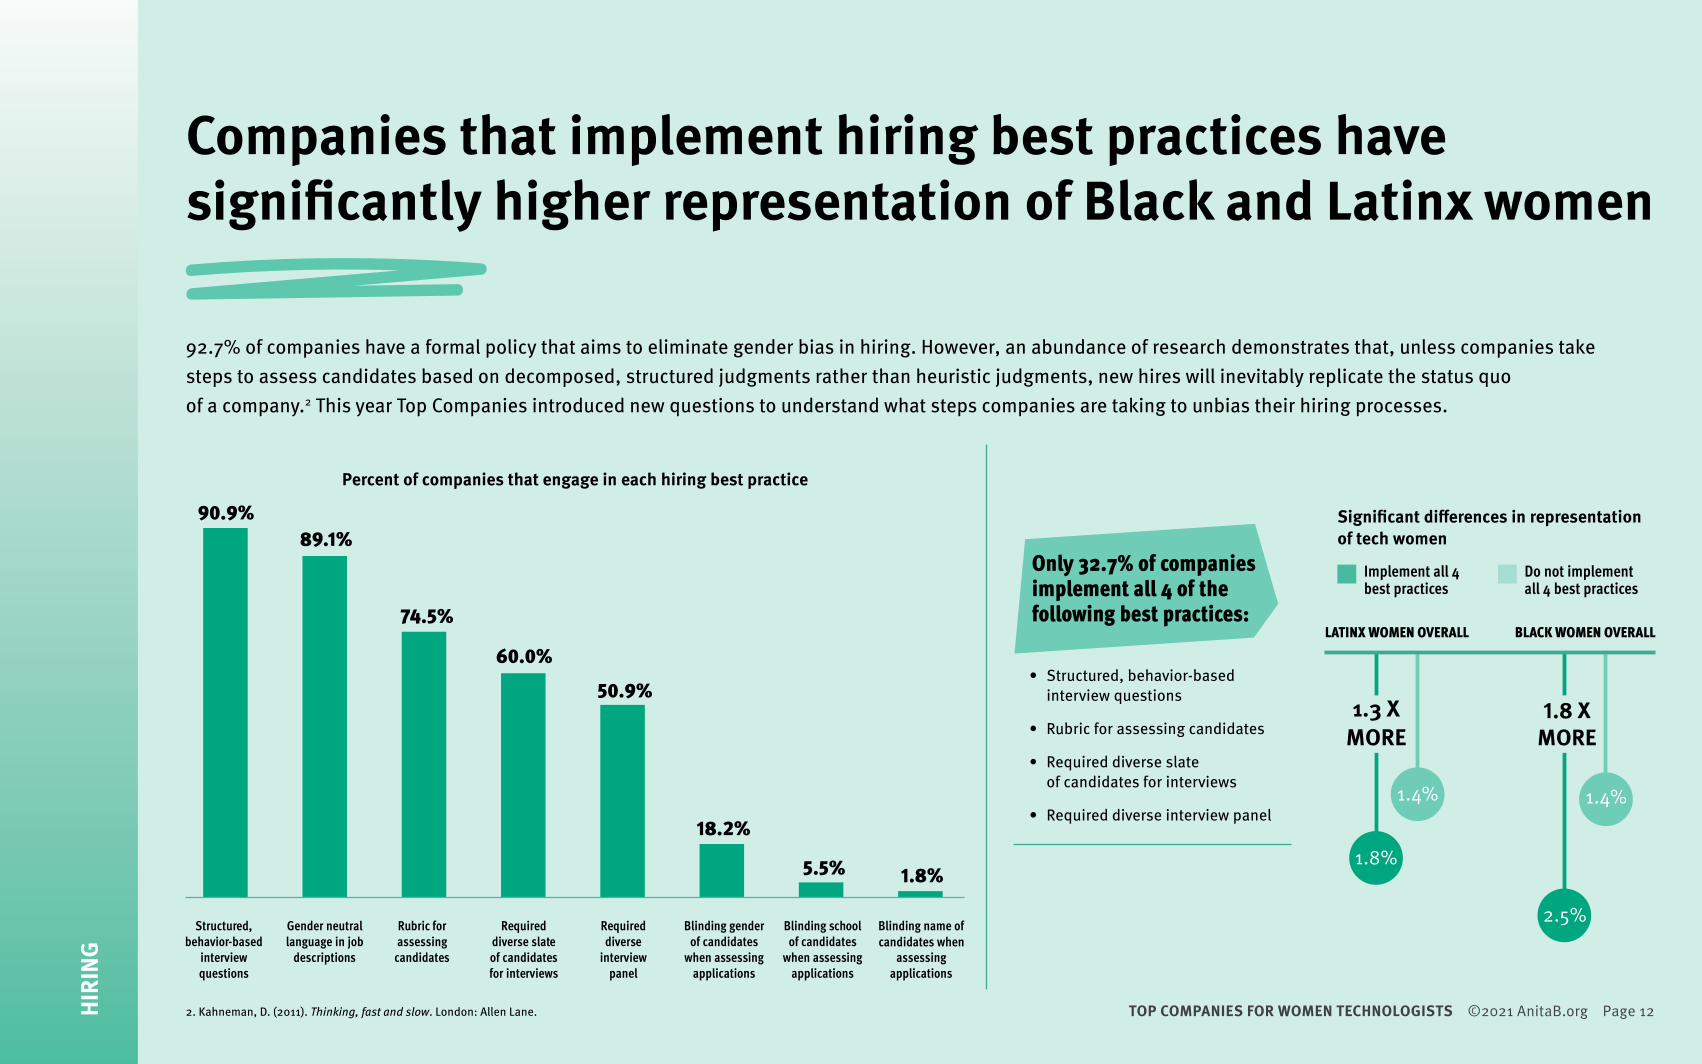
Companies that implement hiring best practices have significantly higher representation of Black and Latinx women
92.7% of companies have a formal policy that aims to eliminate gender bias in hiring. However, an abundance of research demonstrates that, unless companies take steps to assess candidates based on decomposed, structured judgments rather than heuristic judgments, new hires will inevitably replicate the status quo of a company.2 This year Top Companies introduced new questions to understand what steps companies are taking to unbias their hiring processes.
HIRI
NG
2. Kahneman, D. (2011). Thinking, fast and slow. London: Allen Lane.
• Structured, behavior-based interview questions
• Rubric for assessing candidates
• Required diverse slate of candidates for interviews
• Required diverse interview panel
Only 32.7% of companies implement all 4 of the following best practices:
LATINX WOMEN OVERALL BLACK WOMEN OVERALL
Structured, behavior-based
interviewquestions
Gender neutral language in job
descriptions
Rubric for assessing
candidates
Requireddiverse slateof candidatesfor interviews
Requireddiverse
interviewpanel
Blinding gender of candidates
when assessing applications
Blinding school of candidates
when assessing applications
Blinding name of
assessing applications
Significant differences in representation of tech women
Do not implement all 4 best practices
Implement all 4 best practices
1.3 XMORE
1.4% 1.4%
2.5%
1.8%
Percent of companies that engage in each hiring best practice
candidates when

TOP COMPANIES FOR WOMEN TECHNOLOGISTS ©2021 AnitaB.org Page 13HIRI
NG
Mandatory training on unbiasing the hiring process is linked with increased hiring of women technologists
Of the 80% of companies that offered formal unbiasing training to hiring managers, only 43.2% made this training mandatory. Mandatory training on unbiasing the hiring process positively predicts percentage of Black women new hires, and it is linked with significantly higher representation of tech women new hires and tech women overall.
Mandatory MandatoryVoluntary Voluntary
Women new hires Women overall
Significant differences in representation of tech women
Companies with mandatory trainings on unbiasing the
hiring process have 1.2x more tech women new hires
and tech women overall.

TOP COMPANIES FOR WOMEN TECHNOLOGISTS ©2021 AnitaB.org Page 14HIRI
NG
Companies are taking multiple steps to increase the technical talent pool
In order to increase the diversity of new hires, companies must also take steps to increase the diversity of the applicant pool. To do this, more companies have broadened their recruitment scope to include colleges that were previously excluded from targeted hiring, as well as pathways outside traditional 4-year schools.
89.1% of companies recruit from HBCUs and/or MSIs.
LATINX WOMEN OVERALL LATINX WOMEN NEW HIRES
Significant differences in representation of tech women
Do not recruit from HBCUs/MSIs
Recruit from HBCUs/MSIs
0.2% 0.2%
2.0%1.7%
technologists(apprenticeships)
technologists
Recruiting from community
colleges
Recruiting non-technologist
new hires totrain to be
Reskilling programs to train current non-tech employees to be
55.6%
Percent of companies that engage in each best practice to increase the tech talent pool
Recruiting fromHistorically
Black Colleges and Universities
(HBCUs)
Recruiting from Minority Serving
Institutions (MSIs)
8.5 XMORE 10.0 X
MORE

TOP COMPANIES FOR WOMEN TECHNOLOGISTS ©2021 AnitaB.org Page 15
Women technologists stayed put in 2020Overall retention of the tech force increased by 8.4% from March 2020 to January 2021, with this increase being far greater for women. Although voluntary and involuntary attrition were not measured separately this year, many companies anecdotally reported that their voluntary attrition greatly decreased in response to COVID-19. With a sinking economy and growing uncertainty about the future of major industries, as well as increased emotional, psychological, and domestic demands from living during a pandemic, it is unsurprising that many employees chose to remain at their current jobs. Prior to the outbreak of COVID-19, only 5.6% of companies reported a very low attrition rate of below 5% for technologists. By 2021, that number had grown to 20.4% of companies reporting this low total attrition rate. In contrast, a few companies experienced layoffs and reported attrition rates of greater than 20%, with men accounting for a large percentage of this attrition. The decreased overall attrition rate, plus disproportionate attrition rates of men at companies that experienced layoffs, resulted in the largest retention difference ever measured by Top Companies in favor of retaining women.
RETENTION
MenWomen
Percent of technologists who exited their companies
March 2020
January 2021
January 2021March 2020March 2019
Percent of companies where fewer than 5% of tech employees exited
0.8 morewomen exited
0.1 morewomen exited
0.9 moremen exited
Percent of companies where more than 20% of tech employees exited
5.6%
20.4%
11.1%
14.8%

TOP COMPANIES FOR WOMEN TECHNOLOGISTS ©2021 AnitaB.org Page 16
Men of color are leaving at higher rates than other groups
12.2% of technical men left their companies between March 2020 and January 2021. The highest attrition rates were from Black, Latinx, and Asian men. Women of all races/ethnicities had lower attrition rates than their male counterparts in that racial group, and only Black women had an attrition rate higher than the average men’s attrition rate.
RETE
NTIO
N
BLACK MEN RETENTION• Hiring managers formally trained on unbiasing hiring process• Promote flex work in job descriptions• Offer training on antiracism• Formal career sponsorship program
LATINX MEN RETENTION• Weeks of non-birth parent leave• Offer training on creating psychologically safe teams• Have an executive or C-suite level DEI employee
ASIAN MEN RETENTION• Offer training on examining Whiteness• Allow ERGs to have input on policies & programs
Policies and programs that positively predict retention for men of color
Native American
Multiracial
White
AsianLatinx
Black
Men’s average attrition rate 12.2%
Attrition rates of tech employees
by gender and race
MenWomen
14.4%
13.4%12.6% 12.5%
9.5%
11.1%
9.7%
10.5%
7.1%6.9%
9.1% 9.4%
10.8% 11.4%
Exite
d at
low
er ra
te
than
ave
rage
men
Exite
d at
hig
her r
ate
than
ave
rage
men

TOP COMPANIES FOR WOMEN TECHNOLOGISTS ©2021 AnitaB.org Page 17
For the last several years, tech women have been promoted at higher rates than men. While this positive trend remained true this year, the difference in promotion rates narrowed—men’s promotion rates increased relative to women’s. Companies must promote women, especially women of color, at higher rates than men to achieve representation parity in management and leadership positions.
Women’s advancement stagnates, especially for women of color
ADVANCEMENT
March 2019 March 2020
1.1 more women promoted
2.2 more women promoted
1.2 more women promoted
Promotion rates of tech women by race
MenWomen
Percent of technologists who were promoted
All womenMultiracial
women Whitewomen
Latinxwomen
Blackwomen
Native American
women
Men’s average promotion rate 15.7%
Asianwomen16.9% 16.8%16.1% 15.9%
15.4%
12.3%
9.6%
8.0%
Prom
oted
at l
ower
rate
th
an a
vera
ge m
enPr
omot
ed a
t hig
her r
ate
than
ave
rage
men
January 2021

TOP COMPANIES FOR WOMEN TECHNOLOGISTS ©2021 AnitaB.org Page 18
Asian tech women’s representation decreases by 71% from entry to exec level
While Asian women and White women are similarly represented in technical entry level positions, Asian women’s representation declines at all other levels. Asian men’s representation peaks at mid-level and then declines sharply. Of all racial/ethnic groups, only White men and women have greater representation at executive level than at entry level. These findings accord with broader research that Asian employees are excluded from leadership.3 The often-cited pipeline problem is not the sole explanation for lack of diversity in leadership; systemic factors favoring White employees are strongly at play.
ADVA
NCEM
ENT
White menAsian menWhite womenAsian women
Asian and White tech representation by gender and career level
32.2%
17.6%
13.1%
12.6%
Entry Mid Senior Exec
38.8%
23.3%
12.7%
9.1%
47.3%
21.4%
13.3%
5.5%
53.3%
16.1%
15.3%
3.7%
Entry
4.7%
7.7%
0.2%
0.1%
Black
Mid
2.8%
3.9%
0.2%
0.1%
Entry
2.8%
2.3%
0.1%
0.04%
Senior
1.8%
3.2%
0.2%
0.1%
Mid
1.6%
1.4%
0.1%
0.04%
Exec
1.3%
2.1%
0.1%
0.03%
Senior
0.8%
1.0%
0.1%
0.02%
Exec
1.4%
0.8%
0.1%
0.01%
Latinx
Native American
Pacific Islander
Representation of tech men Representation of tech women
Representation declines after entry level for historically excluded technologists of color.
3. Gee, B., & Peck, D. (2018, May 31). Asian Americans are the least likely group in the U.S. to be promoted to management. Harvard Business Review. https://hbr.org/2018/05/asian-americans-are-the-least-likely-group-in-the-u-s-to-be-promoted-to-management
TOP COMPANIES FOR WOMEN TECHNOLOGISTS ©2021 AnitaB.org Page 19
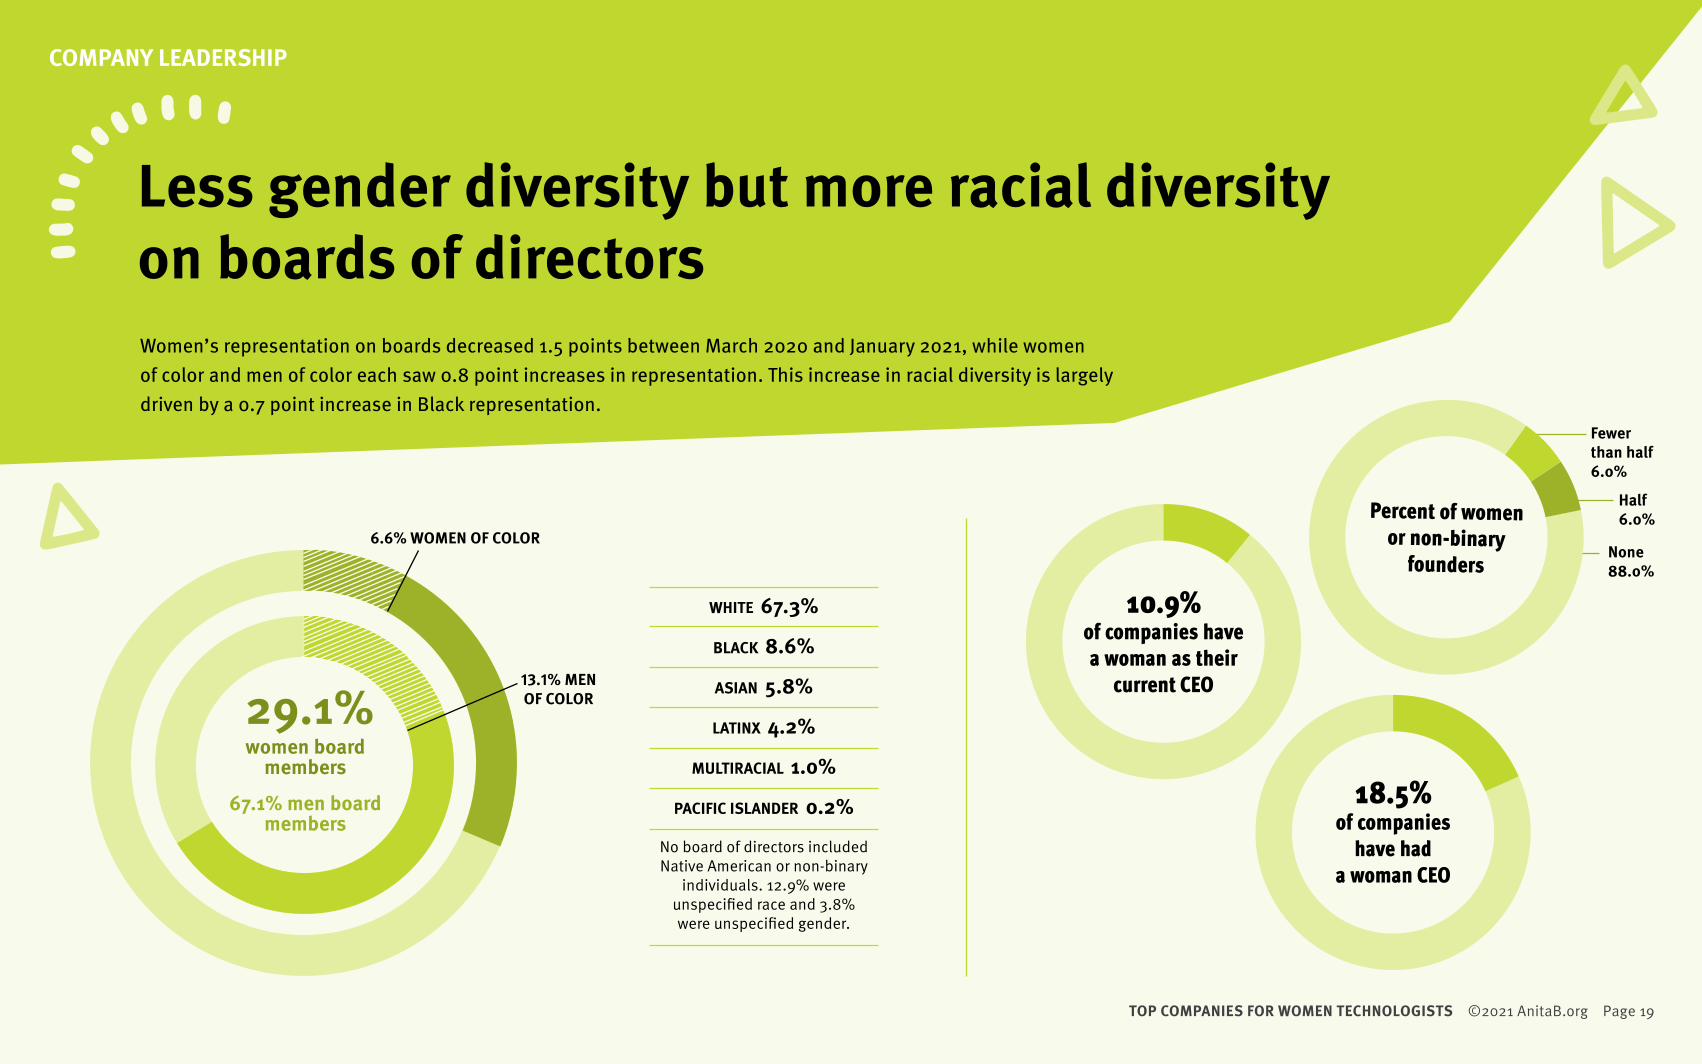
Women’s representation on boards decreased 1.5 points between March 2020 and January 2021, while women of color and men of color each saw 0.8 point increases in representation. This increase in racial diversity is largely driven by a 0.7 point increase in Black representation.
Less gender diversity but more racial diversity on boards of directors
COMPANY LEADERSHIP
Fewer than half 6.0%
None 88.0%
Half 6.0%Percent of women
or non-binary founders
WHITE 67.3%
BLACK 8.6%
ASIAN 5.8%
LATINX 4.2%
MULTIRACIAL 1.0%
PACIFIC ISLANDER 0.2%
No board of directors included Native American or non-binary
individuals. 12.9% were unspecified race and 3.8% were unspecified gender.
10.9% of companies have a woman as their
current CEO
women board members
67.1% men board members
29.1%
6.6% WOMEN OF COLOR
13.1% MEN OF COLOR
18.5% of companies
have had a woman CEO

TOP COMPANIES FOR WOMEN TECHNOLOGISTS ©2021 AnitaB.org Page 20
Research has demonstrated that women who work outside the home also shoulder more of the domestic and childcare labor in the home, creating a “second shift” for women.4 Although it has been long established that companies attract and retain more women when they provide an environment mindful of this dual burden, the COVID-19 pandemic has made it impossible for organizations to ignore the competing domestic and work priorities affecting employees of all genders. While companies have no control over the division of labor in people’s private lives, they can promote the equitable sharing of domestic work by providing equal paid caregiving leave to all genders, a benefit that only 23.6% of companies currently provide.
4. Bianchi, S. M., Sayer, L. C., Milkie, M. A., & Robinson, J. P. (2012). Housework: Who did, does or will do it, and how much does it matter? Social forces, 91(1), 55–63.
CAREGIVING SUPPORT
Only 23.6% percent of companies are encouraging shared domestic labor
81.8% of companies provide at least 12 weeks
of full paid parental leave to birthparents.
Women receive almost twice as many weeks for parental leave
as men.
Significant differences in representation of tech women
Less than 12 weeks12+ weeks
MID-LEVEL ASIAN WOMEN EXEC LEVEL LATINX WOMEN
0.3%1.0%
10.0%
6.0%
1.7 XMORE
3.3 XMORE15.4
8.1
15.4
8.8
15.5
9.2
Average weeks of parental leave provided
Non-birthparentBirthparent
March 2019 March 2020 January 2021

TOP COMPANIES FOR WOMEN TECHNOLOGISTS ©2021 AnitaB.org Page 21
Caregiver leave is increasing, but only half of companies measure support for caregiving
It is not enough to provide adequate paid caregiver leave if employees feel there will be penalties for taking it. Companies can better understand if there is a culture of support for caregiving by measuring usage of parental leave by gender and collecting anonymous feedback from employees on their feelings of organizational support in using paid caregiver leave.
Measuring usage of parental leave by genderWhen policies are utilized by women and not men, those policies will inevitably become stigmatized. Companies must routinely examine what groups are taking leave and for how long in order to identify potential differences in usage patterns.
CARE
GIVI
NG S
UPPO
RT
51.9% of companies track the usage of paid
parental leave by gender.
Significant differences in representation of tech women
Do not trackTrack
ASIAN WOMEN OVERALL MID-LEVEL ASIAN WOMEN WOMEN RETENTION RATE SENIOR LEVEL LATINX WOMEN
10.8%
8.4%
1.3 XMORE
7.7%
10.7%
1.4 XMORE
0.7%1.1%
1.6 XMORE
0.8%1.0%
1.3 XMORE

TOP COMPANIES FOR WOMEN TECHNOLOGISTS ©2021 AnitaB.org Page 22
Caregiver leave is increasing, but only half of companies measure support for caregiving (cont.)
CARE
GIVI
NG S
UPPO
RT
42.0% of companies collect feedback from employees on their feelings of support for using caregiver leave.
Significant differences in representation of Black tech women
Do not collect feedbackCollect feedback
OVERALL ENTRY LEVEL MID-LEVEL SENIOR LEVEL
2.5%
1.2%
2.1 XMORE
2.1%
3.9%
1.9 XMORE
0.5%
1.2%
2.4 XMORE2.3%
2.1 XMORE
1.1%
2.1%1.9%
Significant differences in representation of Latinx tech women
1.0%
2.1 XMORE
1.9 XMORE
1.3%
3.3 XMORE
1.6%
3.2 XMORE
0.5%
1.0%
0.4%
Collecting feelings of organizational support in using paid caregiver leave The best way to understand how employees feel about support for caregiving is to routinely ask them. Feedback should be anonymous but tied to key demographics to understand if there are differences in sentiment between groups.
OVERALL MID-LEVEL SENIOR LEVEL EXEC LEVEL
Do not collect feedbackCollect feedback
TOP COMPANIES FOR WOMEN TECHNOLOGISTS ©2021 AnitaB.org Page 23
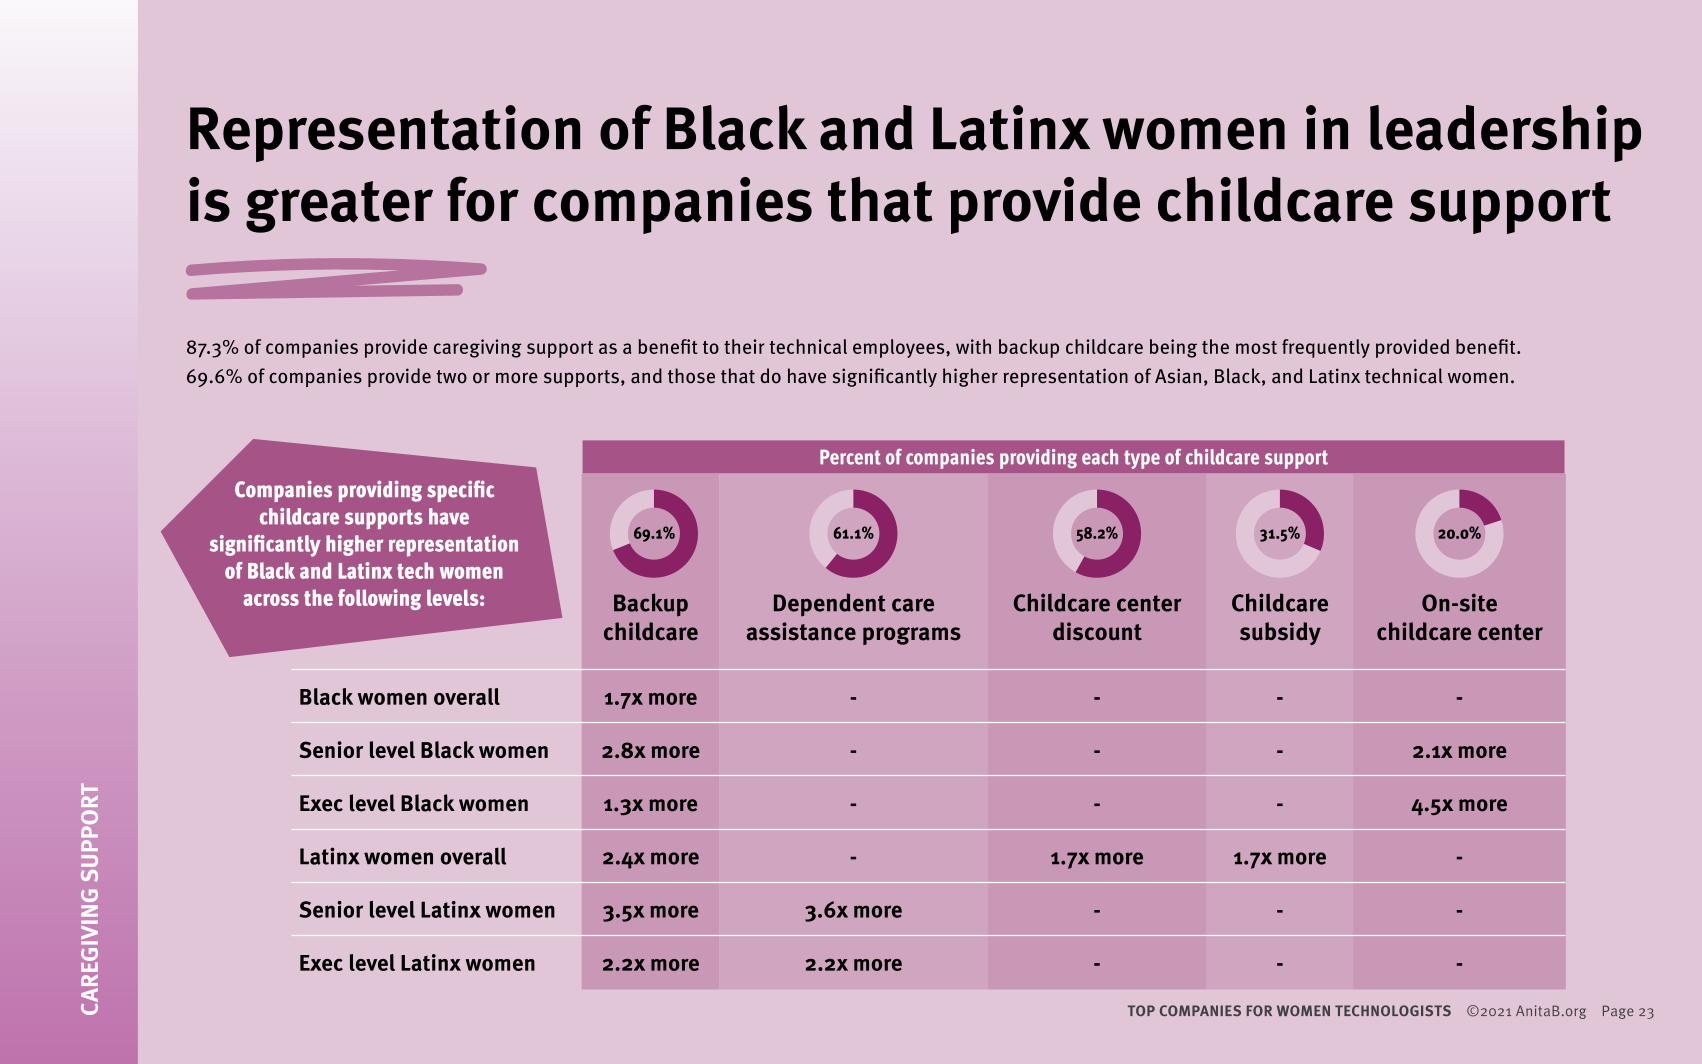
Representation of Black and Latinx women in leadership is greater for companies that provide childcare support
87.3% of companies provide caregiving support as a benefit to their technical employees, with backup childcare being the most frequently provided benefit. 69.6% of companies provide two or more supports, and those that do have significantly higher representation of Asian, Black, and Latinx technical women.
CARE
GIVI
NG S
UPPO
RT
Backup childcare
Dependent care assistance programs
Childcare center discount
Childcare subsidy
On-site childcare center
Black women overall
Senior level Black women
Exec level Black women
Latinx women overall
Senior level Latinx women
Exec level Latinx women
1.7x more
2.8x more
1.3x more
2.4x more
3.5x more
2.2x more
-
-
-
-
3.6x more
2.2x more
-
-
-
1.7x more
-
-
-
-
-
1.7x more
-
-
-
2.1x more
4.5x more
-
-
-
Percent of companies providing each type of childcare supportCompanies providing specific
childcare supports have significantly higher representation
of Black and Latinx tech women across the following levels:
69.1% 61.1% 58.2% 31.5% 20.0%

TOP COMPANIES FOR WOMEN TECHNOLOGISTS ©2021 AnitaB.org Page 24Page 24 TOP COMPANIES FOR WOMEN TECHNOLOGISTS — BUILDING A MORE INCLUSIVE FUTURE ©2020 AnitaB.org TOP COMPANIES FOR WOMEN TECHNOLOGISTS ©2021 AnitaB.org Page 24
The New York Times Company implemented the following inclusive recruitment practices: a recruitment tool to help teams write more inclusive job descriptions; a requirement for diverse slates of competitive candidates during the interview process; and interviews with a panel of employees from diverse backgrounds. Hiring managers and interview panels underwent mandatory formal interview skills and unconscious bias and inclusive teams training.
The New York Times Company Medium Technical Workforce Winner

TOP COMPANIES FOR WOMEN TECHNOLOGISTS ©2021 AnitaB.org Page 25
Prior to the COVID-19 pandemic, flexible work was cited as an important factor to creating workplaces that better supported women’s priorities.5 Last year’s Top Companies report found that companies with an official flex time policy had higher representation of women technologists. While many companies already had flexible work policies (sometimes including remote work policies) prior to the pandemic, the outbreak of COVID-19 rapidly increased the percentage of companies offering these options. While remote and flexible work options are ostensibly good for women, they have potential long-term ramifications that must be considered. Companies must track the usage of flex work by gender; if it is found that women take greater advantage of flex work options, companies must examine how this difference impacts women’s promotion rates, compensation, and other areas of work.
Flexible work is attractive to women technologists, but future impacts remain uncertain
FLEXIBLE WORK
Only 9.8% of companies track usage of flex work by gender.
Percent of companies that have an official flextime policy
March2019
March2020
January2021
4.4%
2.0% 2.7%
0.7%1.4%
2.2 XMORE
2.3 XMORE
2.0 XMORE
1.2%
Significant differences in representation of Latinx tech women
Do not track usageTrack usage
ENTRY LEVEL MID-LEVEL SENIOR LEVEL
4.5%
2.7% 2.6%
0.7%1.7 XMORE
1.7 XMORE
2.0 XMORE
1.5%
1.4%
Significant differences in representation of Black tech women
Do not track usageTrack usage
ENTRY LEVEL MID-LEVEL SENIOR LEVEL
5. Scandura, T. A., & Lankau, M. J. (1997). Relationships of gender, family responsibility and flexible work hours to organizational commitment and job satisfaction. Journal of Organizational Behavior: The International Journal of Industrial, Occupational and Organizational Psychology and Behavior, 18(4), 377–391.

TOP COMPANIES FOR WOMEN TECHNOLOGISTS ©2021 AnitaB.org Page 26FLEX
IBLE
WOR
K
Remote work dramatically increased in response to COVID-19
Prior to the outbreak of COVID-19, 64.8% of companies provided a remote work option in their flex work policy, and an additional 27.8% of companies enacted remote work options in response to the pandemic. Although many of these new remote options were initially meant to be temporary, employees have grown accustomed to remote work and many are unwilling to return to an office full time. An April 2021 survey found that more than half of men and women would look for a new job if asked to return to the office, and 80% of women report that remote work is one of the most important factors when considering a new job.6
Asianwomen
Blackwomen
Latinxwomen
Pacific Islanderwomen
Overall
Retention
Entry
Exec
64.8% Policy in place before COVID-19
7.4% No remote work policy
16.7% Permanent policy enacted in response to COVID-19
11.1% Temporary policy enacted in response to COVID-19Percent of
companies with remote
work policies
6. Pelta, R. (2021, May). Survey: Men & Women Experience Remote Work Differently. https://www.flexjobs.com/blog/post/men-women-experience-remote-work-survey/
Providing a permanent remote work option positively predicts technical women of color’s representation across the following dimensions.
81.5% of companies offer permanent
remote work options.

TOP COMPANIES FOR WOMEN TECHNOLOGISTS ©2021 AnitaB.org Page 27
AnitaB.org’s 2019 Technical Equity Experiences Survey revealed that technical men earned more than technical women at every career level except entry, and that Black and Latinx tech women earned the least of all groups. Although 75.5% of companies have pay equity policies, far fewer engage in pay transparency practices, which are linked with reducing the wage gap.7 Only 40.4% of companies provide compensation ranges for open positions internally, and even fewer, 14.8%, include a salary range on job descriptions.
Companies with a pay equity policy have greater representation of Native American and Pacific Islander women
PAY EQUITY
More than 3/4 of companies
have a formal pay equity policy.
7. National Women’s Law Center. (2020, January). Salary range transparency reduces the wage gap.https://nwlc.org/wp-content/uploads/2018/06/Salary-Range-and-Transparency-FS-2020-1.17.2020-v2.pdf
Significant differences in representation of tech women
No policyPay equity policy
ENTRY LEVEL PACIFIC ISLANDER WOMEN
ENTRY LEVEL NATIVE AMERICAN WOMEN
0.06%
0.005%
12.0 XMORE
2.3 XMORE
0.03%
0.07%March 2019 March 2020 January 2021
Percent of companies with a pay equity policy
74.3% 70.6% 75.5%

TOP COMPANIES FOR WOMEN TECHNOLOGISTS ©2021 AnitaB.org Page 28
Although over 94% of companies conduct routine pay equity audits, only 58.8% analyze their pay data for pay inequities at the intersection of gender and race. Programs and metrics that focus on gender tend to benefit White women, while those that focus on race/ethnicity benefit men of color. Companies must approach pay equity with an intersectional lens to ensure that women of color are not being disadvantaged.
PAY
EQUI
TY
Intersectional pay audits are linked with increased hiring rates for tech women
Every 2 or more years 8.2%
Annually 65.3%
Twice a year 22.4%
Quarterly 4.1%
92.2%86.3%58.8%
Between gender
Between race/ethnicity
Intersectional gender & race
Percent of companies that audit their pay equity data for inequities across the following dimensions
94.2% of companies
perform routine pay equity audits at the following
frequencies:
1.2%
WOMEN NEW HIRES BLACK WOMEN NEW HIRES LATINX WOMEN NEW HIRES
34.5%
27.5%
3.2%2.2%
1.3 XMORE 1.9 X
MORE
1.8 XMORE
1.7%
Significant differences in representation of tech women
Audits not intersectionalIntersectional audits

TOP COMPANIES FOR WOMEN TECHNOLOGISTS ©2021 AnitaB.org Page 29
Companies are least likely to offer the ERG supports that require the most structural investmentEmployee resource groups (ERGs) are one of the most common organizational practices companies use to promote inclusion. ERGs allow employees with minority group holder identities to share a space with other employees of that same identity, thereby increasing a sense of belonging. However, many companies leverage their ERGs as focus groups, in outreach efforts, or for other types of unpaid labor that take time and resources away from work tasks. Companies must invest in their ERGs to ensure that their members receive formal recognition and benefits for their valuable labor.
INCLUSION
Recognition in the performance
review processAccess to
sponsorshipCompensation
for group leaders
Total tech women
Asian women
Black women
Latinx women
Native American women
Pacific Islander women
1.4x more overall 1.5x more mid
1.4x more senior
2.7x more exec
3.0x more overall 3.3x more mid
4.8x more senior
2.2x more overall 2.4x more mid
2.2x more new hires 2.2x more entry
3.0x more entry
2.5x more overall 6.5x more entry
1.3x more mid
1.5x more senior
Companies that offer the following supports have significantly more tech women across multiple dimensions than those that do not. Networking with leaders 96.3%
Input on org policies & programs 96.3%
Access to mentoring 94.4%
Access to professional development opportunities 90.7%
Recognition in the performance review process 71.7%
Access to funding 81.5%
Access to sponsorship 71.7%
Compensation for group leaders 18.9%
Affinity networking 92.5%
Percent of companies offering each ERG support

TOP COMPANIES FOR WOMEN TECHNOLOGISTS ©2021 AnitaB.org Page 30INCL
USIO
N
Significantly greater representation of women of color in companies that focus DEI training on unbiasing systems
Companies have greatly increased the availability of DEI training for their employees in recent years, from 79.5% in 2018 to 98.2% in 2021. Companies most commonly offer unconscious bias training, which raises awareness about the ways in which individuals contribute to inequities. However, awareness alone will not create behavior change; companies must also train employees to unbias specific systems. These trainings should be accompanied by formalized organizational policies, protocols, and tools that employees can apply to unbias systems.
76.4% of companies provide a
training on unbiasing
performance management.
83.6% of companies provide a
training on unbiasing
recruitment.
1.0%
ENTRY LEVEL PACIFIC ISLANDER
LATINX WOMEN OVERALL
BLACK WOMENOVERALL
0.05% 0.005%
1.8% 2.0%
10.0 XMORE
2.3 XMORE
2.0 XMORE
0.8%
Significant differences in representation of tech women
Do not provideProvide
0.5%0.8%
PACIFIC ISLANDER WOMEN OVERALL
LATINX WOMEN NEW HIRES
LATINX WOMENOVERALL
BLACK WOMENOVERALL
0.05% 0.01%
2.0%1.7%
1.9%
5.0 XMORE
3.3 XMORE
3.4 XMORE 2.4 X
MORE
0.6%
Significant differences in representation of tech women
Do not provideProvide

TOP COMPANIES FOR WOMEN TECHNOLOGISTS ©2021 AnitaB.org Page 31
Transparency and accountability mostly entail tracking and sharing data. As with pay equity audits, these data must be intersectional to capture the experiences of women of color. Companies with active transparency and accountability practices have a higher representation of Black and Latinx women technologists across multiple dimensions.
TRANSPARENCY
Transparency and accountability support Black and Latinx women technologists
Significant differences in representation of tech women
No policyHave a policy
1.4%
21.0%
WOMEN OVERALL
LATINX WOMEN OVERALL
ENTRY LEVELLATINX WOMEN
MID-LEVELWOMEN
28.4%
2.6%
27.9%
1.3 XMORE
2.0 XMORE
1.9 XMORE
1.3 XMORE
0.8%1.6%
22.0%
Significant differences in representation of tech women
Less frequently than once per quarter
At least once per quarter
0.3%
MID-LEVELBLACK WOMEN
MID-LEVELASIAN WOMEN
MULTIRACIAL WOMEN NEW HIRES
1.7% 0.9%
2.1 XMORE
1.9 XMORE
3.0 XMORE
5.3%9.9%
0.8% 1.2%
BLACK WOMENOVERALL
MID-LEVELBLACK WOMEN
BLACK WOMEN NEW HIRES
2.0%2.9%
2.2 XMORE
2.4 XMORE
2.4 XMORE
0.8%1.9%
0.9%
Significant differences in representation of tech women
Audits not intersectionalIntersectional audits
79.6% of companies have a formal policy that aims to eliminate gender and/or racial bias in performance reviews.
85.5% of companies have their executive team review workforce
diversity data at least once per quarter.
77.8% of companies regularly review diversity data that includes intersectional gender and race data as a standard metric.
TOP COMPANIES FOR WOMEN TECHNOLOGISTS ©2021 AnitaB.org Page 32
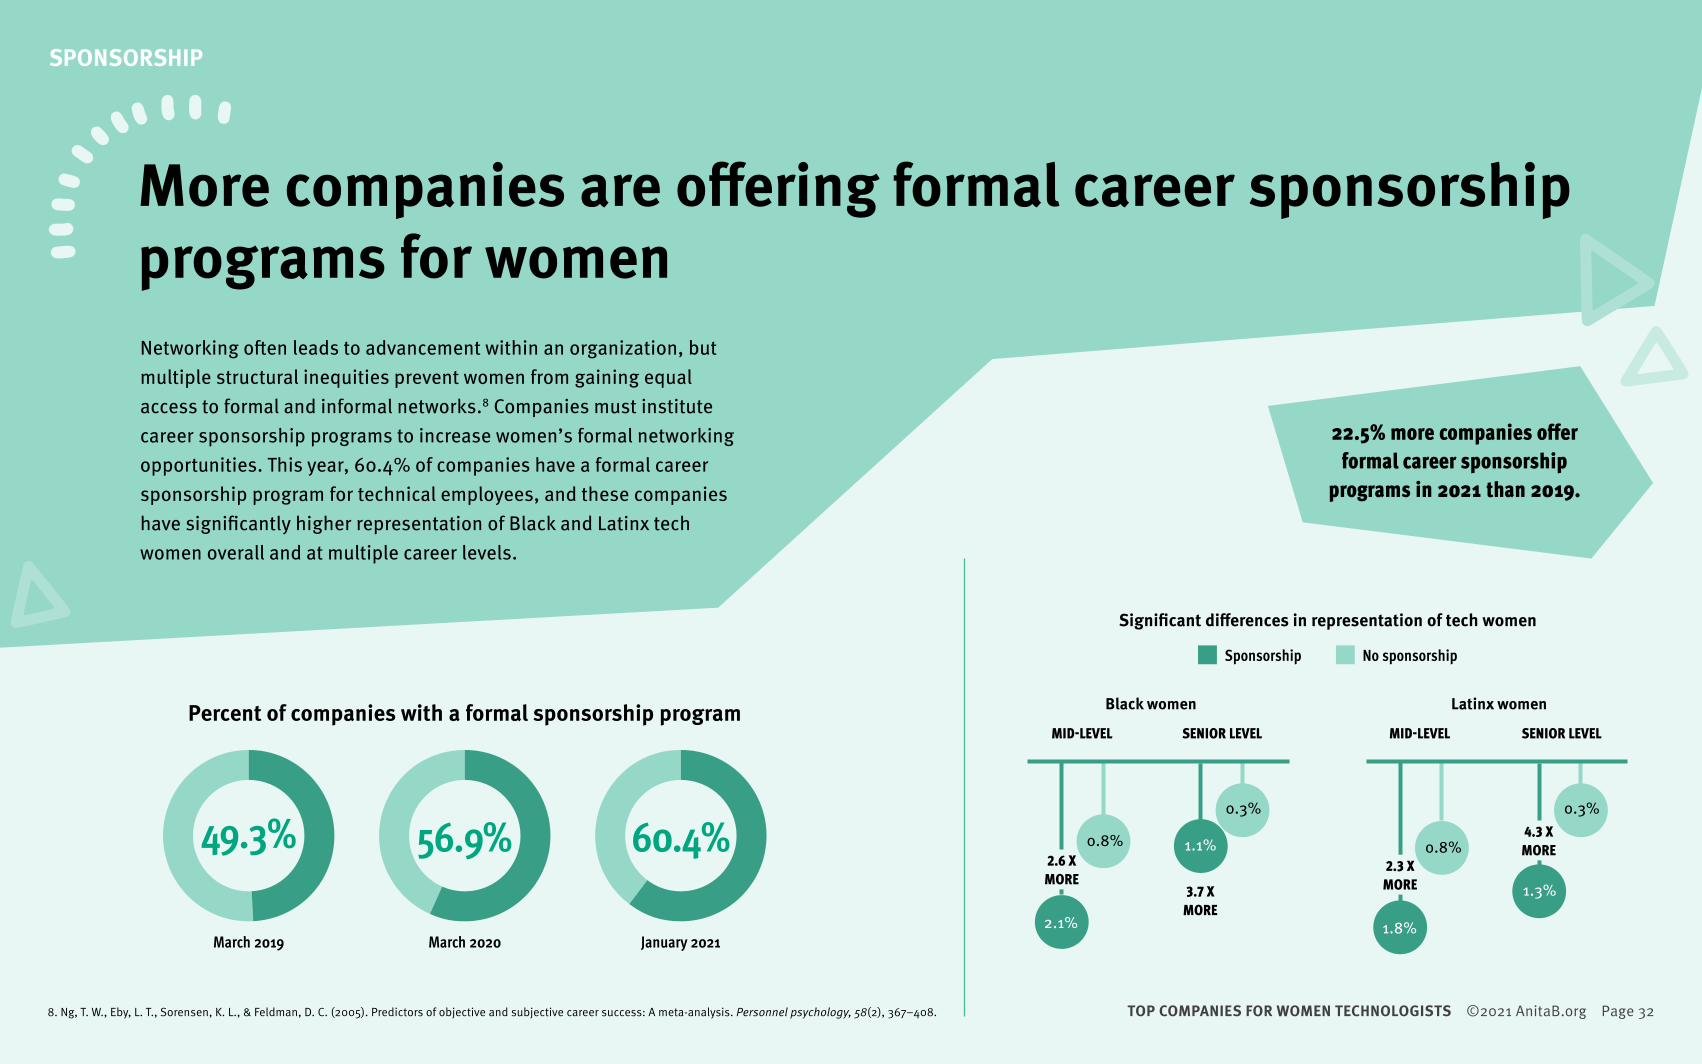
More companies are offering formal career sponsorship programs for women Networking often leads to advancement within an organization, but multiple structural inequities prevent women from gaining equal access to formal and informal networks.8 Companies must institute career sponsorship programs to increase women’s formal networking opportunities. This year, 60.4% of companies have a formal career sponsorship program for technical employees, and these companies have significantly higher representation of Black and Latinx tech women overall and at multiple career levels.
SPONSORSHIP
22.5% more companies offer formal career sponsorship
programs in 2021 than 2019.
March 2019 March 2020 January 2021
Percent of companies with a formal sponsorship program
8. Ng, T. W., Eby, L. T., Sorensen, K. L., & Feldman, D. C. (2005). Predictors of objective and subjective career success: A meta-analysis. Personnel psychology, 58(2), 367–408.
Significant differences in representation of tech women
Black women Latinx women
No sponsorshipSponsorship
MID-LEVEL SENIOR LEVEL
2.1%
2.6 XMORE
3.7 XMORE
0.3%
1.1%0.8%
MID-LEVEL SENIOR LEVEL
1.8%
2.3 XMORE
4.3 XMORE
0.3%
1.3%
0.8%49.3% 56.9% 60.4%

TOP COMPANIES FOR WOMEN TECHNOLOGISTS ©2021 AnitaB.org Page 33Page 33 TOP COMPANIES FOR WOMEN TECHNOLOGISTS — BUILDING A MORE INCLUSIVE FUTURE ©2020 AnitaB.org TOP COMPANIES FOR WOMEN TECHNOLOGISTS ©2021 AnitaB.org Page 33
ADP built leadership capabilities to recognize and mitigate unconscious bias in over 2,000 leaders globally through training.
ADP Large Technical Workforce Winner

TOP COMPANIES FOR WOMEN TECHNOLOGISTS ©2021 AnitaB.org Page 34
CALL TO ACTION: Dare to put the change where it belongsStructural inequities call for structural changes. However, many companies have tended to focus their DEI efforts at the individual level—using strategies such as ERGs, trainings, and conferences—because these are relatively cheap, quick to implement, and highly visible. Such surface-level efforts merely shift the burden of change away from organizations and onto individuals, including individuals from historically marginalized groups. To create true transformational change, companies should focus instead on unbiasing organizational policies, practices, systems, processes, and rewards. Companies should also target individual-level training at leaders and management, to ensure that structural changes are successfully implemented. Companies that do the hard work of building equity into their structures will be able to more effectively train individual employees how to access, utilize and maintain that equity.
EQUITABLE ACCESS • Create rubrics, tools and explicit criteria to reduce bias in hiring and performance management • Provide caregiving benefits equally available to all genders • Expand pathways to technology through bootcamps, apprenticeships, and reskilling programs • Formalize mentorship and sponsorship programs
ACCOUNTABILITY • Create formal roles tasked with driving equitable change and monitoring progress; ensure that these roles are well-resourced • Create safe processes for reporting harassment and abuse
• Compensate and reward participation in ERGs
METRICS • Provide pay transparency and conduct regular pay audits • Measure usage of leave and flex policies, as well as employee feelings of support for usage • Ensure all DEI metrics are intersectional and regularly reviewed by leadership • Track demographics at each stage of the recruitment process
ORGANIZATIONALMODELING VALUES • C-Suite and senior leaders must amplify need for and value of DEI
EDUCATION • Train managers on how to implement equity on a daily basis: > How to use the rubrics, tools, and explicit criteria for unbiasing hiring and performance management > How to mentor and sponsor with an equity lens > How to reduce bias (such as tone policing) and create equity (such as respecting domestic responsibilities)
METRICS • Track employee feedback and DEI metrics at the departmental and manager levels to isolate where equity issues may need to be addressed
MANAGEMENTEDUCATION • Train employees on how to report harassment and workplace abuse • Ensure that employees know all equity policies and practices and how they can access corresponding benefits and opportunities • Train majority group holders on how they can act as accomplices to historically excluded groups
INDIVIDUAL
Structural change must start with organizational change.

Top Companies for Women Technologists is the industry benchmark for the representation of women in technology.
CONTRIBUTERS IN ALPHABETICAL ORDER
Yamelith Aguilar, Leena Bhai, Hayley Brown, Madiha Haque, Lin Lu, Arby Mariano
Top Companies measures key areas that impact women in technology. In gathering this information, we learn what methods companies are using to increase representation and how these efforts are changing over time.
AnitaB.org is a nonprofit social enterprise committed to achieving equity across the global workforce. With a decade-long presence in India and outreach in more than 20 cities worldwide, AnitaB.org engages with tens of thousands of women and leading organizations around the world to build diverse and inclusive workplace cultures.
www.AnitaB.org
Learn how to participate in Top Companies 2022 Top Companies 2022
View the data broken down by tech workforce size Top Companies 2021: Dare to Explore Dashboard
Learn more about AnitaB.org’s continued response to COVID-19 AnitaB.org/Covid-19
Become an AnitaB.org Member Membership.AnitaB.org
Join AnitaB.org as a Corporate Partner AnitaB.org/Sponsors-Partners/Partners
Donate to AnitaB.org AnitaB.org/Donate
Contact AnitaB.org’s Evidence & Influence team with any questions about the report [email protected]
AnitaB.org. (2021). Top Companies for Women Technologists Key Findings & Insights Report. https://anitab.org/research-and-impact/top-companies/2021-results/