top-down strategies for the structural elucidation of … top-down strategies for the structural...
TRANSCRIPT

1
Top-Down Strategies for the Structural Elucidation of Intact Gram-negative
Bacterial Endotoxins
John P. O’Brien, Brittany D. Needham, Dusty B. Brown, M. Stephen Trent and Jennifer S. Brodbelt
Electronic Supplementary Material (ESI) for Chemical Science.This journal is © The Royal Society of Chemistry 2014

2
Figure S1. Histograms showing the distribution of multiply charged E. coli Kdo2‐Lipid A fragment ions and
singly changed fragment ions. Singly charged fragments are shown as blue bars, doubly charged
fragments as red bars and triply charged fragments are shown as green bars.

3
Figure S2. A) ESI‐mass spectra of LOS separated within the BN1 ΔwaaQwaaG sample and B) the
extracted ion chromatograms of the key LOS identified.

4
Figure S3. UVPD/HCD mass spectrum of penta‐acyl waaQwaaG (z = 3‐) [Mr = 2411.27] from BN1
ΔwaaQwaaG. The corresponding fragmentation map is shown on the right.

5
Figure S4. UVPD/HCD mass spectrum of tetra‐acyl waaQwaaG (z = 3‐) [Mr = 2185.07] BN1
ΔwaaQwaaG. The corresponding fragmentation map is shown on the right.

6
Figure S5. UVPD/HCD mass spectrum of tetra‐acyl waaQwaaG + PPEtN (z = 3‐) [Mr = 2388.06] BN1
ΔwaaQwaaG. The corresponding fragmentation map is shown on the right.

7
Figure S6. UVPD/HCD mass spectrum of waaQwaaG + PPEtN (z = 3‐) [Mr = 2824.44] BN1 ΔwaaQwaaG.
The corresponding fragmentation map is shown on the right.

8
Figure S7. HCD mass spectrum of hexa‐acylated waaQwaaG (z = 3‐) [Mr = 2621.46] from BN1
ΔwaaQwaaG. The corresponding fragmentation map is shown on the right.

9
Figure S8. HCD mass spectrum of penta‐acyl waaQwaaG (z = 3‐) [Mr = 2411.27] from BN1 ΔwaaQwaaG.
The corresponding fragmentation map is shown on the right.

10
Figure S9. HCD mass spectrum of tetra‐acyl waaQwaaG (z = 3‐) [Mr = 2185.07] from BN1 ΔwaaQwaaG.
The corresponding fragmentation map is shown on the right.

11
Figure S10. HCD mass spectrum of waaQwaaG + PPEtN (z = 2‐) [Mr = 2824.44] from BN1 ΔwaaQwaaG.
The corresponding fragmentation map is shown on the right.

12
Figure S11. UVPD mass spectrum of tetra‐acyl waaQwaaG (z = 3‐) [Mr = 2185.07] from BN1
ΔwaaQwaaG. The corresponding fragmentation map is shown on the right.

13
Figure S12. UVPD mass spectrum of penta‐acyl waaQwaaG (z =3‐) [Mr = 2411.27] from BN1
ΔwaaQwaaG. The corresponding fragmentation map is shown on the right.

14
Figure S13: LC‐MS trace and extracted ion chromatograms of the UVPD/HCD fragment ions associated
with the identified BN1 LOS lipid A anchors . The structures of the different fragment ions are shown
below.

15
Table S1. List of fragment ions from UVPD of triply deprotonated Kdo2‐lipid A [Mr = 2237.34] and their
corresponding cleavage sites. The fragmentation cleavage map is shown in Figure 3.

16
Table S2. Calculated acylation patterns and glycoforms observed for LOS identified within the BN1
ΔwaaQwaaG sample. Percentages were calculated using the extracted ion chromatogram areas listed
in Supplemental Table 3, based on the LCMS data in Figure 4A.
17
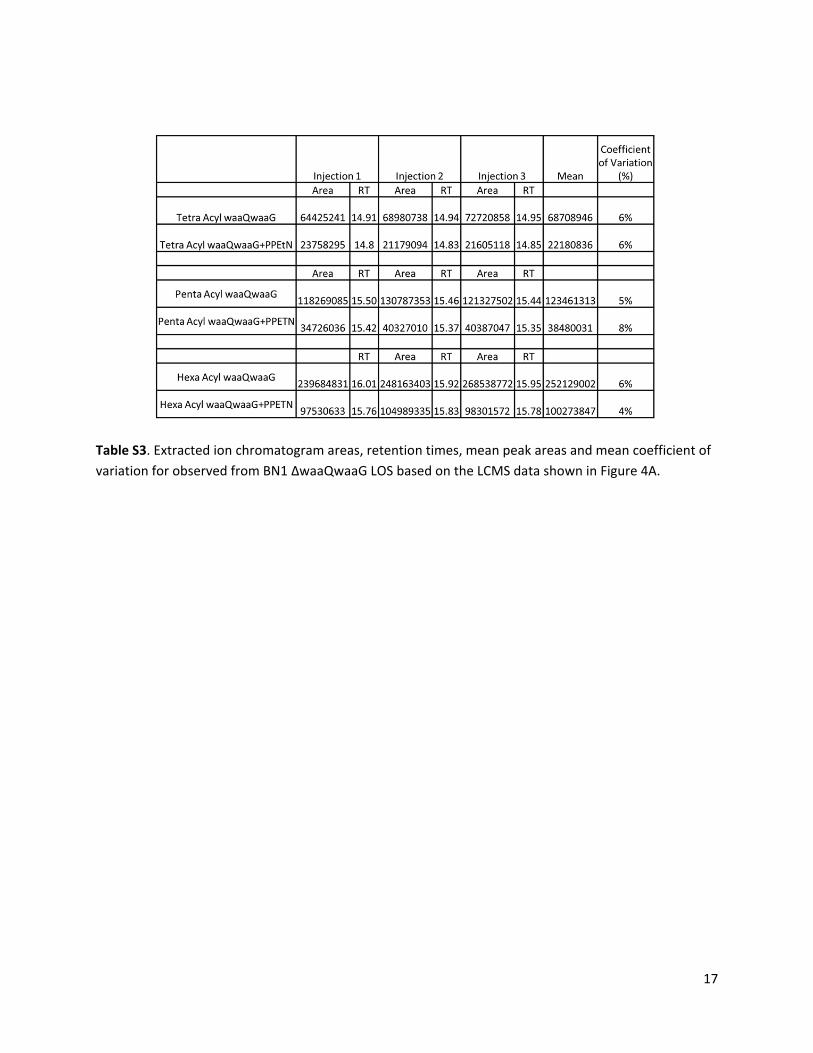
Table S3. Extracted ion chromatogram areas, retention times, mean peak areas and mean coefficient of
variation for observed from BN1 ΔwaaQwaaG LOS based on the LCMS data shown in Figure 4A.
18
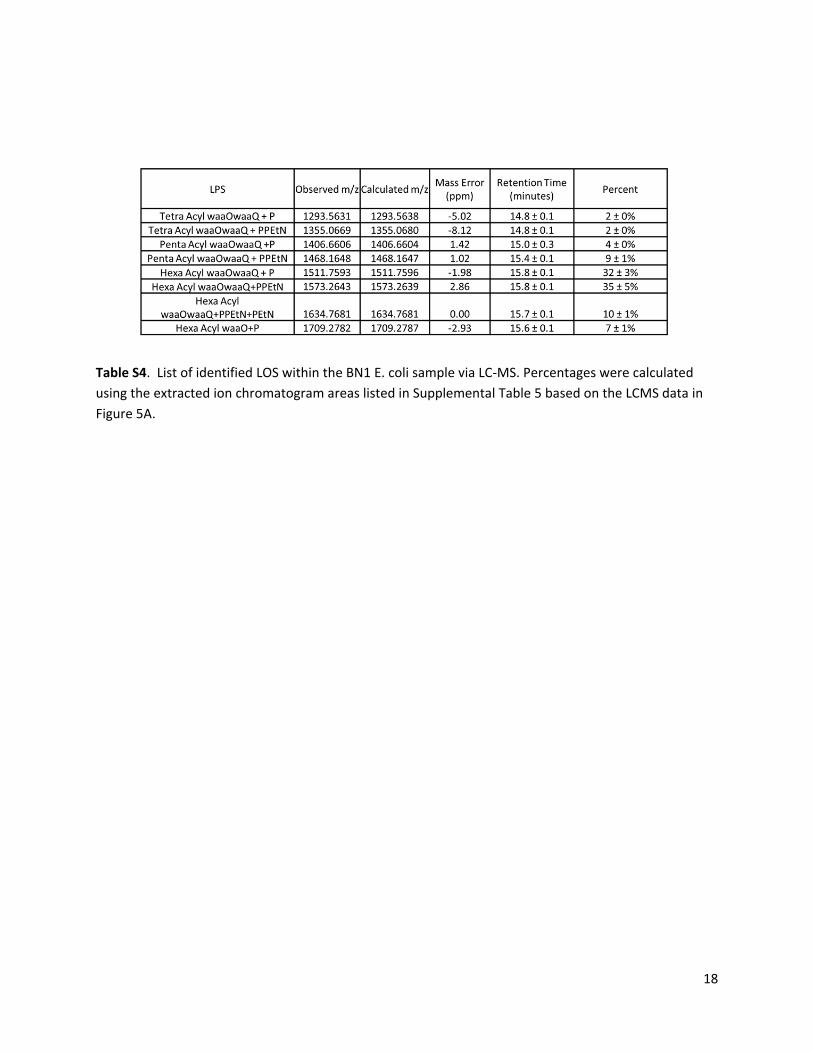
Table S4. List of identified LOS within the BN1 E. coli sample via LC‐MS. Percentages were calculated
using the extracted ion chromatogram areas listed in Supplemental Table 5 based on the LCMS data in
Figure 5A.

19
Table S5. Extracted ion chromatogram areas, mean peak areas and mean coefficient of varaiation
observed from BN1 based on the LCMS data shown in Figure 5A.