top glove corporation bhd investor presentation
TRANSCRIPT

Page 1/36Bursa Malaysia : 7113 SGX : BVA Reuters : TPGC.KL Bloomberg : TOPG MK ADR United States : TGLVY
TOP GLOVE CORPORATION BHD
Investor Presentation13th September 2021
The World’s Largest Manufacturer of Nitrile Gloves, Natural Rubber Gloves and Surgical Gloves

Page 2/36
TOP GLOVE BUSINESS ETHICS CLAPS
Thumbs up, Ready, 1 2 3
Claps, 2x 3x 2x Initiated By: Tan Sri Dr. Lim Wee Chai @ 17/07/2017Revised By: Ng Kai Yee @ 21/09/2020Verified By: Melissa Cheoh @ 21/09/2020

Page 3/36
TOP GLOVE 5 HEALTHY WELLS CLAPS
Thumbs Up, Ready, 1 2 3
Claps, 2x 3x 2x
HEALTHY! HEALTHY! HEALTHY!
EAT WELL
WORK WELL
EXERCISE WELL
Initiated By: Tan Sri Dr Lim Wee Chai @ 18/05/2021 Prepared By: Andy Ting @ 18/05/2021Verified By: Melissa Cheoh @ 18/05/2021
CLEAN WELL
SLEEP WELL
TOP GLOVE

Page 4/36
100 billion gloves pa 48 factories
812 production lines(As at September 2021)
Over 1,600 customersacross 195 countries
Current market capitalisation(1) of
RM 26.26 bil,
USD 6.34 bil
The World largest manufacturer of
Nitrile, Natural Rubber and Surgical gloves
Over 22,000 employees
Source: Bloomberg
Note: (1) Market capitalisation as at 13 September 2021
9MFY2021
Revenue RM14.3bil, USD3.5bil
PAT RM7.4bil, USD1.8bil
The World’s Largest Manufacturer of Gloves
Top Glove Corporation Bhd. (“Top Glove”) at a glance
Page 5/36
1994 2002
2004 2011
2007 2013 2017
2016 20202001 2018
2019
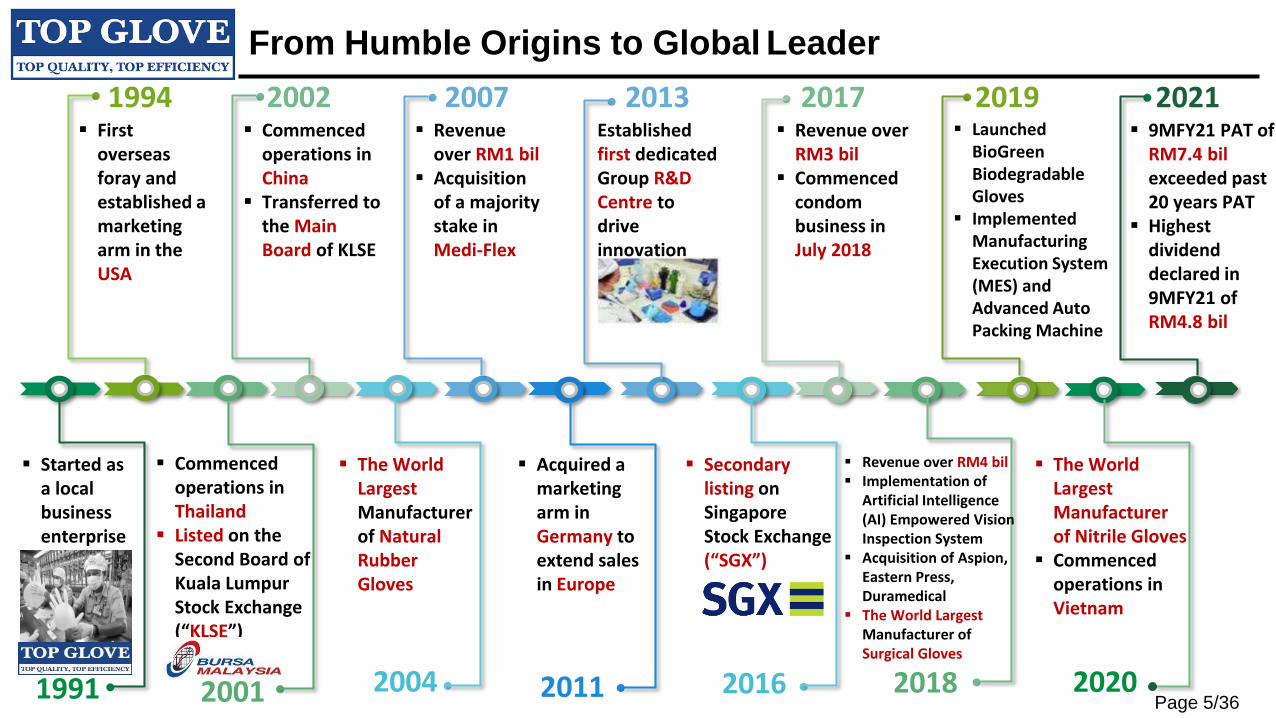
From Humble Origins to Global Leader
2021
1991
▪ Started as a local business enterprise
▪ First overseas foray and established a marketing arm in the USA
▪ Commenced operations in Thailand
▪ Listed on the Second Board of Kuala Lumpur Stock Exchange (“KLSE”)
▪ Commenced operations in China
▪ Transferred to the Main Board of KLSE
▪ The World Largest Manufacturer of Natural Rubber Gloves
▪ Revenue over RM1 bil
▪ Acquisition of a majority stake in Medi-Flex
▪ Acquired a marketing arm inGermany to extend sales in Europe
Establishedfirst dedicated Group R&D Centre to drive innovation
▪ Secondary listing on Singapore Stock Exchange (“SGX”)
▪ Revenue over RM3 bil
▪ Commenced condom business in July 2018
▪ Revenue over RM4 bil▪ Implementation of
Artificial Intelligence (AI) Empowered Vision Inspection System
▪ Acquisition of Aspion, Eastern Press, Duramedical
▪ The World Largest Manufacturer of Surgical Gloves
▪ Launched BioGreenBiodegradable Gloves
▪ Implemented Manufacturing Execution System (MES) and Advanced Auto Packing Machine
▪ The World Largest Manufacturer of Nitrile Gloves
▪ Commenced operations in Vietnam
▪ 9MFY21 PAT of RM7.4 bilexceeded past 20 years PAT
▪ Highest dividend declared in 9MFY21 of RM4.8 bil

Page 6/36
Distribution Across 195 Countries: % of 9MFY21 Sales Volume by geographic
North America
Latin America
18%
9%
EasternEurope 18%
Japan 8%
WesternEurope 21%
Asiaex Japan 20%
Middle East
5%
Distribution
▪ 7 distribution hubs globally
▪ Over 1,600 customers
▪ An OEM manufacturer in every region
▪ Top 5 customers represent c.16% of total revenue
▪ No single customer contributes more than 5% of revenue
▪ Comprising distributors across 195 countries
▪ A geographically diverse customer base
Africa 1%
USA
Brazil
Germany
China
Vietnam
Thailand
Malaysia
Top Glove’s Distribution Hubs

Page 7/36
500
743
247
637
663
1,307
4,346
North America
Europe
Middle East
Latin America and the Caribbean
Southeast Asia
Africa
Asia and Pacific
Healthcare Spending Will Continue to Increase in Emerging Market
300
208180
133
9 7 6
UnitedStates
Germany UnitedKingdom
Japan China India Indonesia
[1]
Glove per Capita Consumption in 2020, Pieces
High glove usage indeveloped countries
Low glove usage indeveloping countries
Population by Region in 2020, ‘mil People
High Population in developing countries
Population in developed countries
Strong growth opportunity in developing countries on the back of large population but current low glove usage
Source: Frost and Sullivan, March 2021[1] Germany and United Kingdom refer to 2019 data Source: Frost and Sullivan, March 2021
[1]

Page 8/36
Natural rubber powder-free glove
55%
27%22%
22%
26%
19% 20%
23%
11%
43%47%
43%
7%9% 8%
10%
1% 2% 3%2%
0%
10%
20%
30%
40%
50%
60%
FY11 FY12 FY13 FY14 FY15 FY16 FY17 FY18 FY19 FY20 9MFY21
Nitrile glove
Natural rubber powdered glove
Surgical glove
Vinyl/TPE/CPE
A Diverse Glove Range for Diverse Market Preferences
% of Product Mix By Volume from FY2011 to 9MFY21Global Market Position
Since 2018
Since 2004
Since 2020

Page 9/36
To commence production by
Calendar QuarterCountry Glove Type
Number of production linesCapacity,
pcs per annum1 Double Former (DF) Line
= 2 Equivalent Single Former (SF) LinesCurrent: 37 glove factories All 812 Equivalent Single Former Lines 100 bil
1Q CY2022 Jan22 to Mar22
Malaysia Nitrile / Latex 16 DF lines 4.8 bil
2Q CY2022 Apr22 to Jun22
MalaysiaNitrile 4 DF lines 1.2 bil
Surgical 2 DF lines 0.6 bilChina PVC 2 DF lines 0.6 bil
3Q CY2022 Jul22 to Sep22
Malaysia Nitrile / Latex 4 DF lines 1.0 bil
4Q CY2022 Oct22 to Dec22
Malaysia Nitrile / Latex 24 DF lines 7.2 bilVietnam PVC 10 DF lines 2.6 bil
Additional new capacity in CY2022 62 DF lines 18 bil (+18%)Total capacity 31 December 2022 : 40 glove factories 936 Equivalent Single Former Lines 118 bil
1Q CY2023 Jan23 to Mar23
Malaysia Nitrile / Latex 29 DF lines 8.9 bil
2Q CY2023 Apr23 to Jun23
MalaysiaNitrile / Latex
12 DF lines 3.7 bilThailand 14 DF lines 4.2 bil
3Q CY2023 Jul23 to Sep23
Vietnam PVC 10 DF lines 2.6 bil
4Q CY2023 Oct23 to Dec23
Malaysia Nitrile / Latex 38 DF lines 11.6 bil
Additional new capacity in CY2023 103 DF lines 31 bil (+26%)Total capacity 31 December 2023 : 43 glove factories 1,142 Equivalent Single Former Lines 149 bil
Malaysia
▪ Headquarters▪ 32 Glove Factories▪ 3 Chemical Factories▪ 1 Glove Former▪ 2 Packaging Factories▪ 1 Dental Dam Factory▪ 1 Condom Factory▪ 1 Mask FactoryProducing:1) Latex & Nitrile Examination Gloves2) Surgical, Household, Cleanroom Gloves3) CPE/TPE Gloves4) Former & Chemical Manufacturing5) Dental Dam6) Condom7) Face MaskThailand
▪ 2 Latex Concentrate Plants▪ 3 Glove FactoriesProducing:1) Latex Examination Gloves2) Latex ConcentrateChina
▪ 1 Glove FactoryProducing:1) Vinyl GlovesVietnam
▪ 1 Glove FactoryProducing:1) Vinyl Gloves
Continuous Growth in Manufacturing Capabilities
Total: 48 Factories

Page 10/36
To commence production by Calendar Quarter
Country Glove TypeNumber of production lines
Capacity, pcs per annum
1 Double Former (DF) Line = 2 Equivalent Single Former (SF) Lines
1Q CY2024 Jan24 to Mar24
MalaysiaNitrile / Latex 23 DF lines 6.8 bil
Surgical 4 DF lines 1.2 bil2Q CY2024
Apr24 to Jun24Malaysia Nitrile / Latex 36 DF lines 10.8 bil
3Q CY2024 Jul24 to Sep24
Vietnam PVC 10 DF lines 2.6 bil
4Q CY2024Oct24 to Dec24
Malaysia Nitrile / Latex 12 DF lines 3.6 bil
Additional new capacity in CY2024 85 DF lines 25 bil (+17%)Total capacity 31 December 2024: 44 glove factories 1,312 Equivalent Single Former Lines 174 bil
1Q CY2025 Jan25 to Mar25
MalaysiaNitrile / Latex
14 DF lines 4.4 bilThailand 30 DF lines 9.2 bil
2Q CY2025 Apr25 to Jun25
Malaysia Nitrile / Latex 31 DF lines 9.8 bil
3Q CY2025 Jul25 to Sep25
Vietnam PVC 10 DF lines 2.9 bil
4Q CY2025 Oct25 to Dec25
Malaysia Nitrile / Latex 12 DF lines 3.7 bil
Additional new capacity in CY2025 97 DF lines 30 bil (+17%)Total capacity 31 December 2025: 47 glove factories 1,506 Equivalent Single Former Lines 204 bil
Continuous Growth in Manufacturing Capabilities (Con’t)

Page 11/36
0.91
1.19
1.66
1.241.13
2.422.04
1.22
1.48
73.45
45.85
61.16
73.68
69.29
0
10
20
30
40
50
60
70
80
0.2
0.6
1.0
1.4
1.8
2.2
2.6
3.0
3.4
Sep-18 Sep-19 Sep-20 Sep-21
NR Latex & Nitrile & Butadiene Price
(USD/KG)Latex Nitrile Butadiene Crude Oil
Crude Oil Price (WTI)
(USD/bbl)
Raw Material
53%
Other Overhead
14%
Fuel10%
Labour9%
Chemical8%
Packaging6%
Cost
Breakdown
Key Highlights:
a) Expecting a lower nitrile latex price as Butadiene and Acrylonitrile forecasted to decline
b) Lower natural rubber latex concentrate price expected with wintering season ended in May 2021
c) Natural gas tariff increase by 12% for the period of 1 July 2021 to 30 September 2021
d) Electricity tariff reduced by 6% for the period of 1 January 2021 to 30 June 2021
Cost of Production and Raw Material Price Trend
9MFY21 Cost Breakdown Raw Material Price Trend

Page 12/36
28.3%70.5% 64.1%
Financial Highlights for 3QFY21 and 9MFY21
Revenue, RM’mil EBITDA, RM’mil & Margins % PAT, RM’mil & margin %
1,688
5,365 4,163
3QFY20 2QFY21 3QFY21
477
3,785 2,668
3QFY20 2QFY21 3QFY21
350
2,902 2,064
3QFY20 2QFY21 3QFY21
20.7%54.1% 49.6%YoY: +147%
QoQ: -22%
YoY: +459%
QoQ: -30%
YoY: +490%
QoQ: -29%
4,127
14,287
9MFY20 9MFY21
878
9,602
9MFY20 9MFY21
578
7,353
9MFY20 9MFY21
14.0%51.5%
Revenue, RM’mil EBITDA, RM’mil PAT, RM’mil & margin %
+246%
+994%+1,172%
21.3%67.2%
3QFY21 3QFY21 3QFY21
9MFY21 9MFY21 9MFY21

Page 13/36
Performance Highlights
1) Key Highlights for 3QFY21:
Weaker QoQ performance in 3QFY21 mainly due to:
a) lower sales quantity following a temporary halt in shipments to the U.S. from Malaysia, in
compliance with requirements of the U.S. Customs and Border Protection
b) decline in the average selling prices by 16% due to:
i. price adjustment in line with market pricing trend
ii. lower sales to the U.S. from Malaysia, as U.S. pricing is higher than non U.S. market
2) Key Highlights for 9MFY21:
Strong business performance in 9MFY21 mainly attributed to:
a) sales quantity increased by 12% on the back of the global COVID-19 pandemic and a higher
production utilisation
b) higher ASPs inline with strong market demand
c) improvement in operational efficiency from ongoing innovation

Page 14/36
Stellar 3QFY21 quarterly results for the period 1/3 to 31/5/21
3QFY21
1/3 to 31/5
2QFY21
1/12/20 to 28/2/21
Variance3QFY21 vs 2QFY21
3QFY20
1/3 to 31/5
Variance3QFY21 vs 3QFY20
Revenue, RM’mil 4,163 5,365(22%)
1,688147%
Revenue, USD’mil 1,010 1,326 390EBITDA, RM’mil 2,668 3,785
(30%)477
459%EBITDA, USD’mil 647 935 110
EBITDA margin 64% 71% 28%
PBT, RM’mil 2,604 3,725(30%)
422517%
PBT, USD’mil 632 920 98
PBT margin 63% 69% 25%
PAT, RM’mil 2,064 2,902(29%)
350490%
PAT, USD’mil 501 717 81
PAT margin 50% 54% 21%
EPS, sen 25.4 35.8 4.4
3QFY21 Highlights:1) Sales quantity softened by 4% QoQ. 2) Improvement in operational efficiency from ongoing innovation. 3) NR latex concentrate price up 8% QoQ and up 45% YoY.4) NBR latex price up by 0.4% QoQ and up 138% YoY.

Page 15/36
9MFY21 results for the period 1/9/20 to 31/5/21
9MFY21
1/9/20 to 31/5/21
9MFY20
1/9/19 to 31/5/20
Variance9MFY21 vs 9MFY20
Revenue, RM’mil 14,287 4,127246%
Revenue, USD’mil 3,482 980
EBITDA, RM’mil 9,602 878994%
EBITDA, USD’mil 2,341 208
EBITDA margin 67% 21%
PBT, RM’mil 9,413 6781,288%
PBT, USD’mil 2,294 161
PBT margin 66% 16%
PAT, RM’mil 7,353 5781,172%
PAT, USD’mil 1,792 137
PAT margin 51% 14%
EPS, sen 90.2 7.4
9MFY21 performance highlights:a) Strong growth in sales quantity of 12% vs 9MFY20.b) Attributed to ongoing enhancements across its operations, through digital transformation, continuous R&D and innovation, quality and
productivity initiatives and talent acquisition and development. Raw Material Price:a) NR latex concentrate price increased by 31% vs 9MFY20. b) NBR latex price increased by 104% vs 9MFY20.

Page 16/36
in RM’mil 2009 2010 2011 2012 2013 2014 2015 2016 2017 2018 2019 2020 9MFY21
Revenue 1,529.1 2,079.4 2,053.9 2,314.5 2,313.2 2,275.4 2,510.5 2,888.5 3,409.2 4,220.7 4,801.1 7,237.4 14,286.6
EBITDA 287.5 364.7 196.7 297.7 310.6 301.8 441.7 524.7 489.3 694.0 687.5 2,421.5 9,601.7
EBITDA margin 18.8% 17.5% 9.6% 12.9% 13.4% 13.3% 17.6% 18.2% 14.4% 16.4% 14.3% 33.5% 67.2%
PBT 222.0 305.0 145.5 240.7 242.2 216.3 363.5 442.2 393.4 522.8 423.6 2,165.6 9,413.2
PBT margin 14.5% 14.7% 7.1% 10.4% 10.5% 9.5% 14.5% 15.3% 11.5% 12.4% 8.8% 29.9% 65.9%
Taxation 53.9 54.6 30.3 33.4 39.4 32.7 82.3 79.8 54.5 89.6 56.1 376.7 2,059.8
PAT 168.1 250.4 115.1 207.3 202.8 183.6 281.2 362.4 338.9 433.2 367.5 1,788.8 7,353.4
PAT margin 11.0% 12.0% 5.6% 9.0% 8.8% 8.1% 11.2% 12.5% 9.9% 10.3% 7.7% 24.7% 51.5%
ROE, % 20.5% 22.4 % 10.0% 16.2% 14.9% 13.1% 17.4% 19.9% 16.3% 18.1% 14.4% 28.9% 103.9%
in RM’mil in RM’mil
High Growth Company Since Listing in 2001Double in Size Every 3 Years with Revenue CAGR of 28%
31 August Financial Year End
Over 20 Years Since Listing in 2001
Compound Annual Growth Rate, CAGRAverage PAT Margin
Revenue PAT
28% 38% 24%
Note: # Based on latest 12 months PAT
#

Page 17/36
in USD’mil 2009 2010 2011 2012 2013 2014 2015 2016 2017 2018 2019 2020 9MFY21
Revenue 362.4 492.8 486.8 548.5 548.2 539.2 595.0 684.5 807.9 1,000.3 1,137.8 1,715.2 3,482.4
EBITDA 68.1 86.4 46.6 70.6 73.6 71.5 104.7 124.3 116.0 164.5 162.9 573.9 2,340.5
EBITDA margin 18.8% 17.5% 9.6% 12.9% 13.4% 13.3% 17.6% 18.2% 14.4% 16.4% 14.3% 33.5% 67.2%
PBT 52.6 72.3 34.5 57.0 57.4 51.3 86.1 104.8 93.2 123.9 100.4 513.2 2,294.5
PBT margin 14.5% 14.7% 7.1% 10.4% 10.5% 9.5% 14.5% 15.3% 11.5% 12.4% 8.8% 29.9% 65.9%
Taxation 12.8 12.9 7.2 7.9 9.3 7.7 19.5 18.9 12.9 21.2 13.3 89.3 502.1
PAT 39.8 59.3 27.3 49.1 48.1 43.5 66.6 85.9 80.3 102.7 87.1 423.9 1,792.4
PAT margin 11.0% 12.0% 5.6% 9.0% 8.8% 8.1% 11.2% 12.5% 9.9% 10.3% 7.7% 24.7% 51.5%
ROE, % 20.5% 22.4 % 10.0% 16.2% 14.9% 13.1% 17.4% 19.9% 16.3% 18.1% 14.4% 28.9% 103.9%
in USD’mil
High Growth Company Since Listing in 2001Double in Size Every 3 Years with Revenue CAGR of 28%
31 August Financial Year End
Over 20 Years Since Listing in 2001
Compound Annual Growth Rate, CAGRAverage PAT Margin
Revenue PAT
28% 38% 24% in USD’mil
#
Note: # Based on latest 12 months PAT

Page 18/36
Strong Balance Sheet and High Cash Generation
Return on Equity, % Net Asset, RM’bil Net Asset Per Share Attributable to Owners , RM
Net Cash Flow from Operating Activities, RM’mil
Net Cash, RM’mil
28.9%
83.6%*103.9%
31/8/2020 28/2/2021 31/5/2021
6.2
8.2 8.2
31/8/2020 28/2/2021 31/5/2021
0.60
0.86 0.86
31/8/2020 28/2/2021 31/5/2021
3,456
5,776
8,316
31/8/2020 28/2/2021 31/5/2021
2,343
4,063 4,230
31/8/2020 28/2/2021 31/5/2021
Net cash will be used for:
▪ CAPEX of estimated RM2 bil per annum
▪ Dividend payout of approximately RM2 bilper quarter
*Based on latest
12 months PAT
Page 19/36
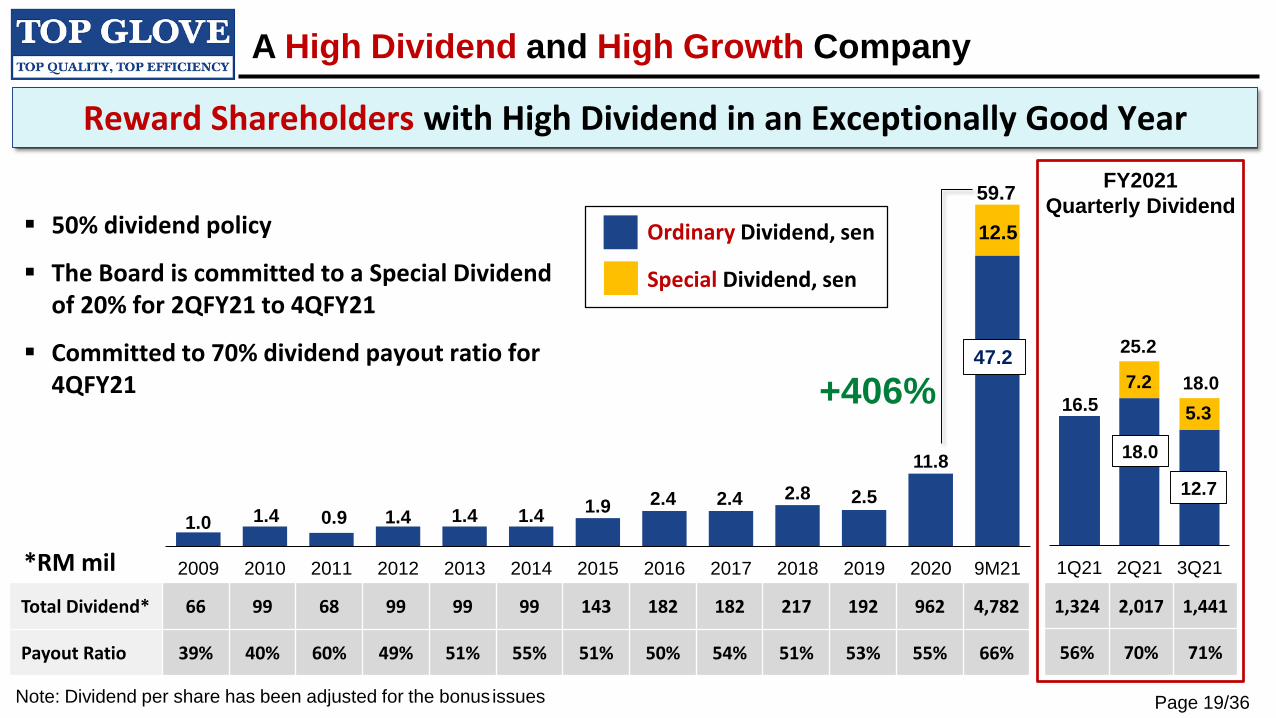
16.5 5.3
1Q21 2Q21 3Q21
7.2
25.2
18.0
18.0
12.7
1.0 1.4 0.9 1.4 1.4 1.41.9 2.4 2.4 2.8 2.5
11.8
20.0
2009 2010 2011 2012 2013 2014 2015 2016 2017 2018 2019 2020 9M21
+406%
12.5
59.7
47.2
Note: Dividend per share has been adjusted for the bonus issues
A High Dividend and High Growth Company
Reward Shareholders with High Dividend in an Exceptionally Good Year
▪ 50% dividend policy
▪ The Board is committed to a Special Dividend of 20% for 2QFY21 to 4QFY21
▪ Committed to 70% dividend payout ratio for 4QFY21
FY2021
Quarterly Dividend
Total Dividend* 66 99 68 99 99 99 143 182 182 217 192 962 4,782
Payout Ratio 39% 40% 60% 49% 51% 55% 51% 50% 54% 51% 53% 55% 66%
*RM mil
1,324 2,017 1,441
56% 70% 71%
Ordinary Dividend, sen
Special Dividend, sen

Page 20/36
U.S. Customs and Border Protection (CBP) Uplifted
Import Ban on Top Glove Effective 10 September 2021
Top Glove Malaysia Can Resume Export to USA Immediately from 10 September 2021
CBP Modified Finding

Page 21/36
Number of shares held(1) Market value
(as at 13 September 2021)
Accumulated
Dividends
Investment cost
(as at 27 March 2001)
Capital
appreciation(2)
Total shareholder
return
# RM RM RM RM %
122,304 401,157 113,268 2,700 511,725 18,953%
With initial investment of 1,000 shares made based on IPO price of RM2.70 on 27 March 2001, the return would be:
Bursa: Shareholder Value Track RecordsTotal Shareholders Return of 18,953% Over 20 Years Since Listing in Year 2001
As at 13/9/2021:
16th highest market capitalization in Bursa
19th highest market capitalization in SGX
Source: Registrar of Depository
Number of CDS and CDP
account
Number of account
as at
Total CDS Account, Bursa 127,042 (30 Aug 21)
Total CDP Account, SGX 9,267 (1 Sep 21)
Grand Total 136,309
Source: Reuters as at 13 September 2021
Notes: (1) 1,000 shares at IPO, adjusted for bonus issue and share split since IPO
(2) Calculated based on adding market value and accumulated dividends and subtracting the investmentcost
Page 22/36
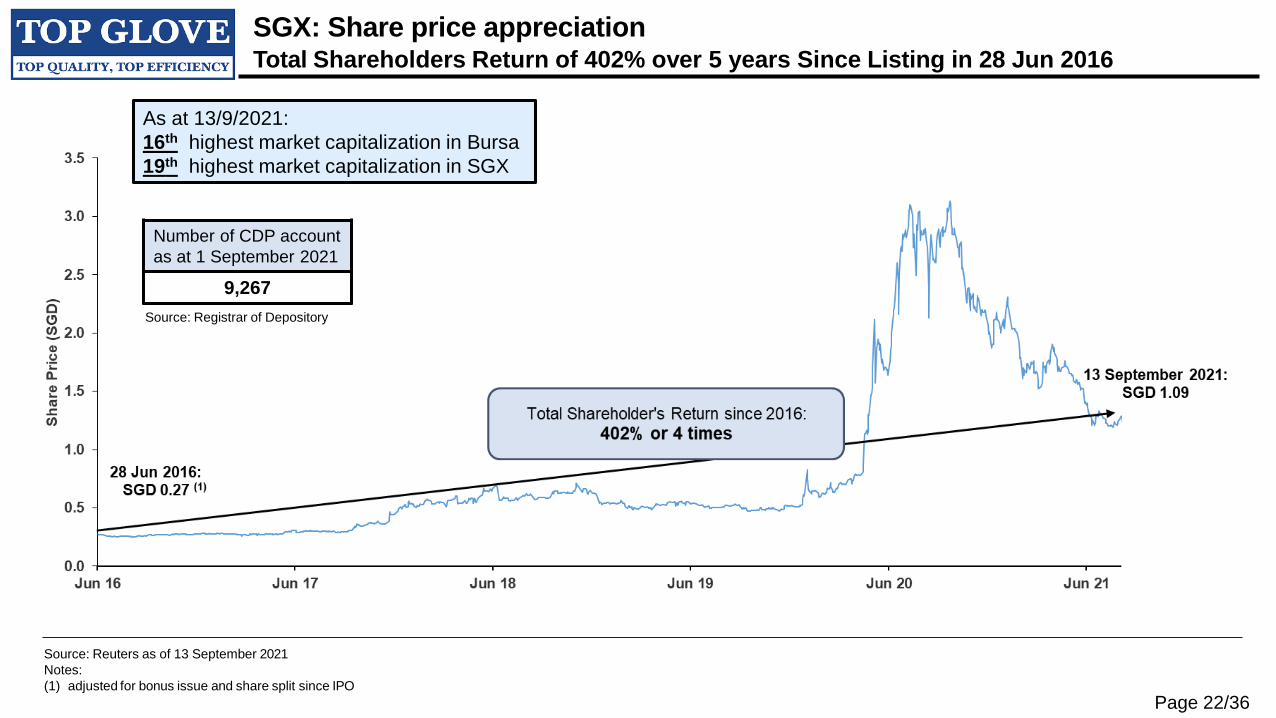
SGX: Share price appreciation Total Shareholders Return of 402% over 5 years Since Listing in 28 Jun 2016
Source: Reuters as of 13 September 2021
Notes:
(1) adjusted for bonus issue and share split since IPO
As at 13/9/2021:
16th highest market capitalization in Bursa
19th highest market capitalization in SGX
Source: Registrar of Depository
Number of CDP account
as at 1 September 2021
9,267

90
140
190
240
290
340
390
440
490
Bo
nd
Pri
ce
Date
Top Glove Convertible Bond Price PerformanceIssued on 1st March 2019 and Fully Redeemed on 16th October 2020
Convertible Bond Price as at 16th Oct 2020:USD 452.12
Convertible Bond Price as at 1st March 2019:USD 100.00
Top Glove Convertible Bond price appreciated by 352.12% or 3.52 times
Prepared by: Khoo Bee HuiVerified by: Yap Rueh YinnDate: 10 March 2021Source: Thomson Reuters Eikon
Issuer: Top Glove Labuan LtdIsin: XS1941677764Issuance size: USD200 millionCoupon: 2% Issued Date: 1st March 2019Maturity Date: 1st March 2024 (5 years) Redemption Date: 16th Oct 2020
Page 23/35
Page 24/36
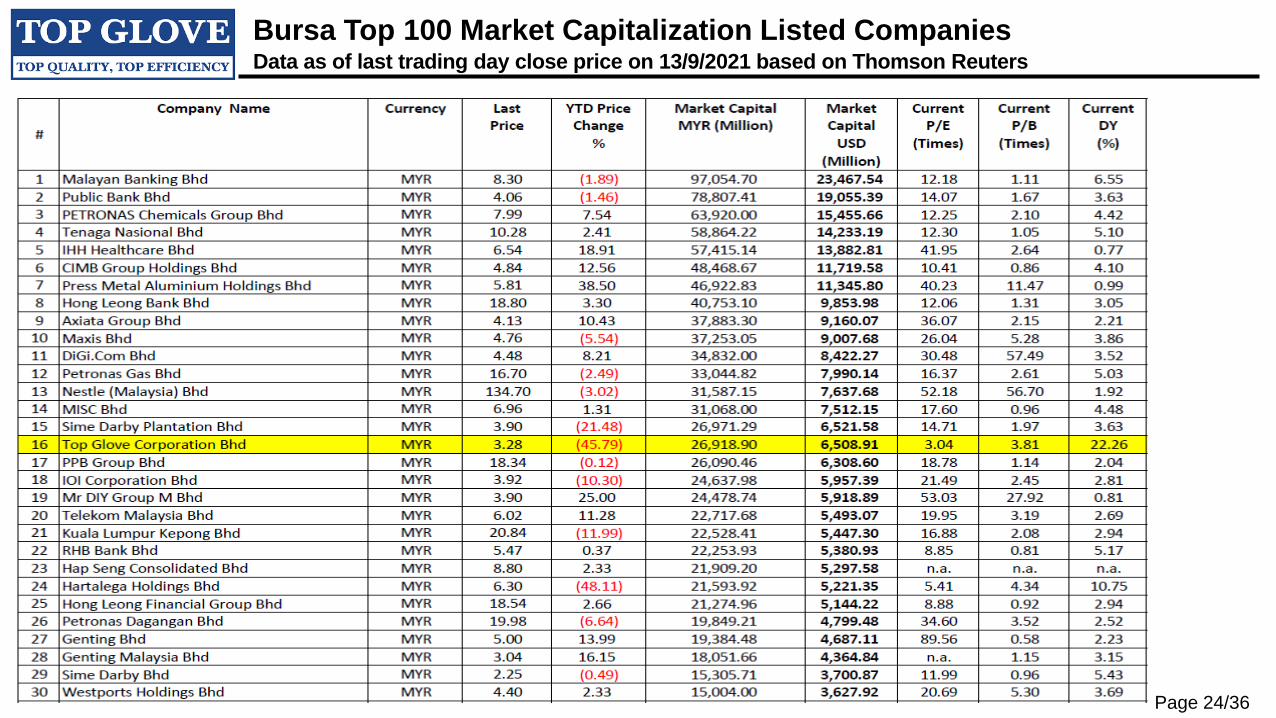
Bursa Top 100 Market Capitalization Listed CompaniesData as of last trading day close price on 13/9/2021 based on Thomson Reuters

Page 25/36
Bursa Top 100 Market Capitalization Listed Companies (Con’t)Data as of last trading day close price on 13/9/2021 based on Thomson Reuters

Page 26/36
Bursa Top 100 Market Capitalization Listed Companies (Con’t)Data as of last trading day close price on 13/9/2021 based on Thomson Reuters

Page 27/36
SGX Top 100 Market Capitalization Listed CompaniesData as of last trading day close price on 13/9/2021 based on Thomson Reuters

Page 28/36
SGX Top 100 Market Capitalization Listed Companies (Con’t)Data as of last trading day close price on 13/9/2021 based on Thomson Reuters
Page 29/36
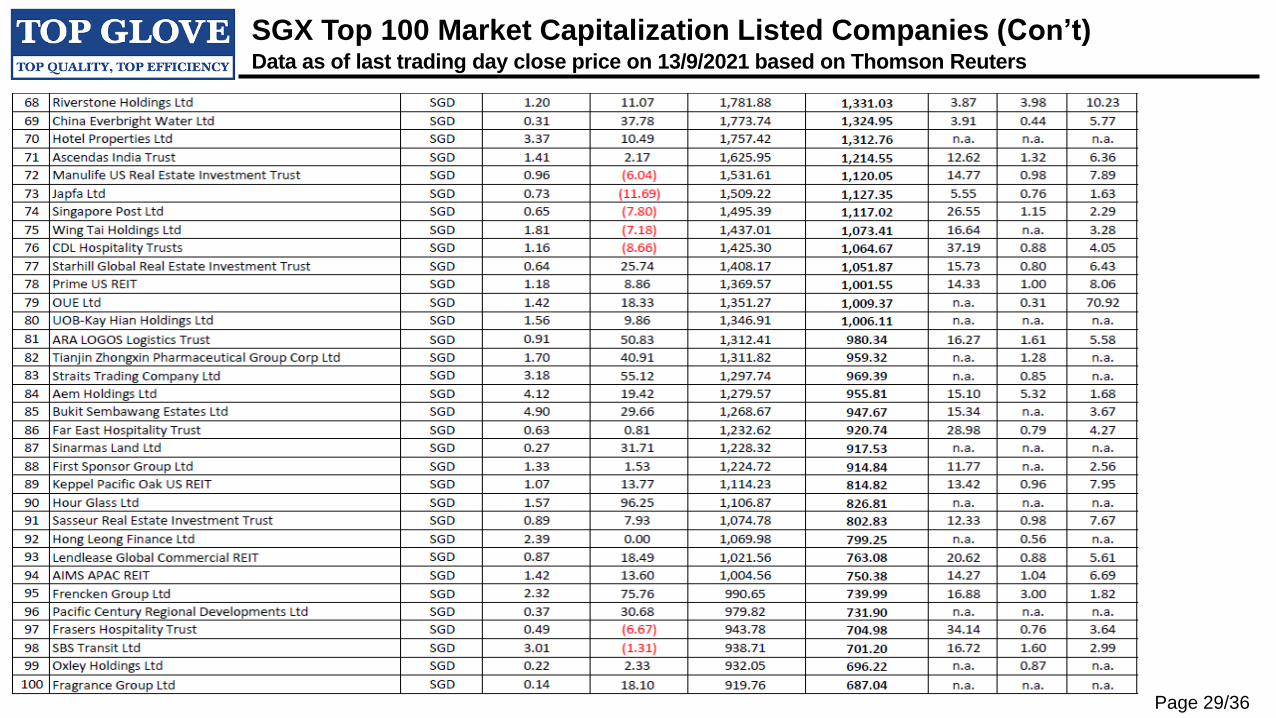
SGX Top 100 Market Capitalization Listed Companies (Con’t)Data as of last trading day close price on 13/9/2021 based on Thomson Reuters

Page 30/36
Summary of Research Reports RatingTarget price (TP), Target PE and Projected Profit After Tax (PAT)
Summary of Research Reports Rating as at 13/9/2021
Num. Report Research New TP Prev TP Call Previous
Date House RM RM FY21F FY22F FY21F FY22F FY23F rating Call
1 10-Jun-21 DBS 7.25 7.25 7.6 18.6 9,299.0 3,772.0 3,272.0 Buy Buy
2 09-Jun-21 Citi 7.00 8.60 6.1 10.1 9,154.0 5,565.0 3,015.0 Buy Buy
3 02-Jul-21 HLIB 6.72 6.76 5.6 10.7 9,341.4 4,911.0 3,456.4 Buy Buy
4 09-Jun-21 Credit Suisse 6.20 6.40 5.5 10.9 9,231.0 4,673.6 3,120.0 Buy Buy
5 10-Jun-21 BIMB 6.10 7.40 5.6 14.5 8,801.3 3,370.3 1,457.1 Buy Buy
6 09-Jun-21 DZT 5.70 16.34 5.1 8.6 9,066.0 5,401.0 NA Buy Buy
7 01-Jul-21 Kenanga 5.60 5.60 5.0 11.2 9,238.0 4,066.0 NA Buy Buy
8 09-Jun-21 UBS 5.60 5.60 4.8 14.7 9,490.0 3,114.0 1,246.0 Hold Hold
9 10-Sep-21 Nomura 5.34 5.34 5.1 16.9 8,520.0 2,555.0 2,024.0 Hold Hold
10 09-Jun-21 HSBC 5.20 5.20 5.1 23.6 7,775.0 1,659.0 1,291.0 Hold Hold
11 10-Jun-21 JF Apex 5.20 5.80 4.6 11.9 9,265.3 3,585.8 NA Hold Hold
12 10-Mar-21 Affin Hwang 5.10 6.65 4.6 10.7 9,003.7 3,903.5 2,923.7 Hold Buy
13 09-Jun-21 Macquarie 4.80 4.90 4.0 18.5 9,537.0 2,323.0 1,230.0 Hold Hold
14 24-Jun-21 MIDF 4.55 5.73 4.1 18.9 8,962.9 1,950.1 1,623.7 Hold Buy
15 10-Jun-21 Public Investment 4.45 7.60 4.1 9.7 8,991.4 3,776.7 2,381.0 Hold Buy
16 15-Jul-21 UOB Kay Hian 4.10 4.10 4.1 8.8 8,162.0 3,760.0 1,612.0 Hold Hold
17 12-Jul-21 TA Securities 4.00 4.02 3.8 8.2 8,340.5 3,951.2 2,540.0 Hold Hold
18 07-Jul-21 MBB 3.98 3.98 3.2 6.0 10,152.0 5,888.0 2,193.0 Hold Hold
19 13-Sep-21 AmInvest 3.77 3.66 3.9 11.9 8,536.1 2,801.8 1,510.9 Hold Hold
20 13-Sep-21 CIMB 3.48 7.80 3.5 10.2 8,141.0 2,809.0 1,815.0 Hold Buy
21 13-Sep-21 RHB 3.30 4.38 3.3 11.0 8,077.0 2,373.0 1,364.0 Hold Hold
5.12 6.34 4.7 12.7 8,908.8 3,629.0 2,115.3
22 10-Sep-21 J.P. Morgan 2.80 2.80 2.5 13.3 8,922.0 1,686.0 1,226.0 Sell Sell
23 06-Sep-21 CLSA 2.70 3.70 2.6 15.9 8,253.0 1,329.0 1,226.0 Sell Sell
24 13-Sep-21 KAF 2.34 4.70 2.4 17.3 7,932.3 1,079.4 802.7 Sell Hold
4.80 6.01 4.4 13.0 8,841.3 3,346.0 1,968.1
* Average for TP above market price @ 13/9/2021 RM3.28
Target PE based Proj PAT, RM'mil
Average from rank 1 to 21*
Total Average from rank 1 to 24

Page 31/36
We Provide the Best Healthcare to Our Employees
Top Glove has 41 Wellness Team Members as at 31 July 2021
Fitness
Professionals3
Wellness
Professionals11
Medical
Professionals &
2 Ambulances
2710 Medical Doctors
1 Dentist
2 Mental Health Counselor
4 Medical Assistants
1 Assistant Pharmacist
3 Nurses
3 Clinic Admins
2 Paramedics
1 Radiographer
7 Nutritionists
1 Dietitian
1 Naturopathy Wellness Consultant
1 Food Service Executive
1 Health Admin Executive
1 xxx
1 Fitness Trainer
2 Fitness Assistants

Page 32/36
We aspire to be the Glove Manufacturer of Choice for customers which
driven by the integration of sustainability into every aspect of our business. Good business starts with strong ethics and the Group is linking Executive Compensation to ESG Metrics.
Commitment
2021 is Year of ESG for Top Glove:
Environmental, Social & Governance
Product Quality and Safety
Occupational Health & Safety
Talent RetentionHuman Rights and Labour Practices
Reduce Carbon Emission
40% of KPIs linked to ESG metrics in 5 focus areas
▪ Performance indicator: Customer complaints rate
▪ Performance indicator: Occupational accident rate
▪ Performance indicator: Top performing employee turnover
▪ Performance indicator: Social ethical audit scoring
▪ Performance indicator:Scope 1 & 2 emission intensity reduction
Good Business champions
Good Environmental Practices
Good Business is Supported by
Good People
Good Business Starts with
Strong Ethics
Link to Top Glove’s Sustainability page: https://www.topglove.com/sustainability/

Page 33/36
Must know, Must do, Must teach
Top Glove’s Business Direction, Ethics, Rules & Philosophies
To produce consistently high quality
gloves at efficient low cost.
1. Do not lose our shareholders’ money;
2. Do not lose our health;
3. Do not lose our temper;
4. Do not lose our customers.
1. We work for our customers;
2. We take care of the interest of our
shareholders;
3. We ensure that our employees continue
to contribute positively to the company
and we care for their well-being; and
4. We work closely with our bankers,
suppliers, business associates and
friends.
1. Honesty
2. Integrity
3. Transparency
Business rules
Business direction Business philosophies
Business ethics
Investment direction
Guiding principles for growth and success
To invest 1 efficient dollar and earn 2
healthy dollars.

Page 34/36
Top Glove’s Medium and Long Term Objectives
Healthy workforce living 5 Wells with quality and
safety mindset
Diversify to glove related and healthcare
businesses
Embrace Industry 4.0 digital eco-systems
using the power of data
Focus on Product Innovation, Operational Excellence to achieve
customer delight
Good and Prudent Financial Discipline
to achieve target financial ratios
Our Vision :
To be your world class partner in
gloves and healthcare products
Our Mission :
Ensuring safe human protection
globally supported by our values
OUR PEOPLE OUR PRODUCTS,
PROCESS & CUSTOMERSOUR FINANCIALS
Ensure the well being
of our employees, our
greatest assets
Continue to innovate and deliver world class products with
improved processes and ensure ultimate customers satisfaction
Deliver sustainable financial
goals and create value for
our investors and financial
partners

Page 36/36
TOP GLOVE ESG CLAPS
Thumbs Up, Ready, 1 2 3
TOP GLOVE
Claps, 2x 3x 2x
IMPROVE! IMPROVE! IMPROVE!
Top Environment
Top Social
Top Governance
Initiated By: TG Year of ESG Committee @ 19/04/2021Verified By: Mr. Ng Yong Lin @ 18/05/2021Approved By: Tan Sri Dr Lim Wee Chai @ 18/05/2021