top risk executives share their practices - erm · pdf filetop risk executives share their...
TRANSCRIPT
1
REPORTING KEY RISK INFORMATION TO THE BOARD OF DIRECTORS
Reporting Key Risk Information to the Board of Directors
Top Risk Executives Share Their Practices
2015
Bruce BransonAssociate Director
ERM InitiativeNorth Carolina State University
2801 Founders DriveRaleigh, NC 27695
919.513.0901 | www.erm.ncsu.edu

REPORTING KEY RISK INFORMATION TO THE BOARD OF DIRECTORS
1
CONTENTS
INTRODUCTION ........................................................................................................................................................ 2
WHO, WHAT, WHEN ................................................................................................................................................ 3
PRIORITIZING & CATEGORIZING RISKS FOR BOARD REVIEW ................................................................................... 4
BOARD PRE-READ MATERIALS ................................................................................................................................. 9
PRESENTATIONS AT BOARD MEETINGS ................................................................................................................. 17
IDEAS FOR FUTURE RISK REPORTING TO BOARD ................................................................................................... 23
CONCLUSIONS ........................................................................................................................................................ 24
PARTICIPATING ORGANIZATIONS .......................................................................................................................... 25
ABOUT ERM INITIATIVE ......................................................................................................................................... 26
AUTHOR BIO .......................................................................................................................................................... 26
REPORTING KEY RISK INFORMATION TO THE BOARD OF DIRECTORS
2
Introduction
Reporting Key Risk Information to the Board of Directors
Top Risk Executives Share Their Practices
One of the big challenges in an organization’s enterprise risk management (ERM) process is determining
how to effectively and concisely communicate risk information identified by the ERM process to the
organization’s board of directors. Given the complexity of the global business world today, distilling risk
information down to that which is most pertinent for disclosure to the organization’s board of directors
can be difficult. ERM leaders have to walk a fine line that avoids overwhelming the board with too much
granular detail about risks without summarizing risks at such a high level that no one is able to really
understand the underlying risk concern.
To obtain insight about board reporting practices used by a number of organizations, we surveyed chief
risk officers and other executives leading enterprise risk management efforts at a number of major U.S.
corporations serving on North Carolina State University’s ERM Initiative Advisory Board (all participating
organizations are identified on the final page of this report). We asked our Advisory Board members
about their organizations’ practices in regard to reporting enterprise-level key risk information to their
boards of directors. We queried respondents as to whom they reported risk information, how often that
information was updated and when these reports are made. We also asked who was responsible for
leading the risk discussion with the board of directors and how this information was filtered, categorized
and prioritized for reporting purposes.
We received extensive feedback and examples on the nature of that reporting, from its format to its
length to the specific information included about individual key risks, to the nature of follow-up
reporting. Finally, these executives shared the evolution of their risk reporting and their views on
changes they foresee over the near term.
This thought paper summarizes our key findings.

REPORTING KEY RISK INFORMATION TO THE BOARD OF DIRECTORS
3
Who, What, When More than half of the respondents reported that the full board of directors receives an update on their
organization’s top risks at least annually. Two-thirds indicated that the audit committee of the board
receives such a report, and one-third noted that they have a board risk committee that is regularly
updated. Two mentioned additional committees (public policy and compliance and an ERM steering
committee) as receiving regular reports on top risk exposures.
The reports, which are provided at least annually by most organizations, reflect a list or grouping of the
top risks facing their organization. Nearly 50% of our respondents said reports are presented more
frequently (quarterly or semi-annually), with none indicating a reporting frequency greater than
quarterly. Numerous respondents stated that they reported to the risk and/or audit committees of the
board more frequently (quarterly or semi-annually) in addition to an annual report provided to the full
board.
No consistent pattern emerged regarding the timing of these reports. Several respondents noted the
scheduling of risk reporting coincided with the planning cycle of the organization. That is, the reports
were made concurrent with, or sometimes in preparation for, board discussion of strategic initiatives.
Some indicated that the timing of risk reporting was linked to review of the Form 10K, either prior to
filing with the Securities and Exchange Commission (SEC) or immediately afterward (as a start to the
next reporting cycle). Some organizations designate a specific meeting of the board each year for risk
reporting.
When the report of top risks is presented to the full board, respondents indicated the discussion is
typically led by the ERM lead (Chief Risk Officer (CRO), VP of Strategic Planning, Chief Audit Executive
(CAE), Internal Audit Director were common titles of the ERM lead). In some cases, the person
responsible for ERM made the presentation to the audit or risk committee and then the chair of that
committee was responsible for leading the discussion with the full board. In other responses, the CFO,
CAE, and in a few cases, the CEO, were tasked with the actual presentation to the full board.
In terms of board meeting agenda time typically allocated to the discussion of top risks, there was
interesting variation in responses — as little as 10 minutes in one case, 15 to 20 minutes in several
cases, and most commonly, approximately 30 minutes. There were a few outliers as well; two hours was
noted by one respondent, 90 minutes by another. Three more stated that the discussion was typically
allocated about one hour.

REPORTING KEY RISK INFORMATION TO THE BOARD OF DIRECTORS
4
Prioritizing & Categorizing Risks for Board Review We observed some interesting variation in the number of “top” risks typically reported to the board —
as low as three to five risks and up to as many as 35. Most responses were in the 10-to-15 risks range.
Reported risks are typically prioritized by combinations of likelihood and impact scores, and where more
risks are enumerated, separation by tiers of risks is common. Top tier risks generally numbered in the 10
to 15 range, with tier two and tier three lists varying in number from 10 to 200. Numerous respondents
indicated that only top-tier risks were presented to the full board, while lower-tier risks may be reported
only to the audit committee or risk committee. This prioritization is most often presented graphically
using a heat map or risk dashboard.
One respondent reported segregating risks into corporate risks, business unit risks and emerging risks,
with priority given to corporate risks. Another specifically noted that multiple prioritized lists were
presented based on the following factors:
Financial Impact
“Other” Impact
Risk Management Maturity
Risk Velocity
The next two pages include two examples of these report styles are provided. These examples represent
two common report types that are frequently used in both “pre-read” materials provided to the board
in advance and/or are used during board-level presentations to convey information in a succinct manner
to the board or board committee.
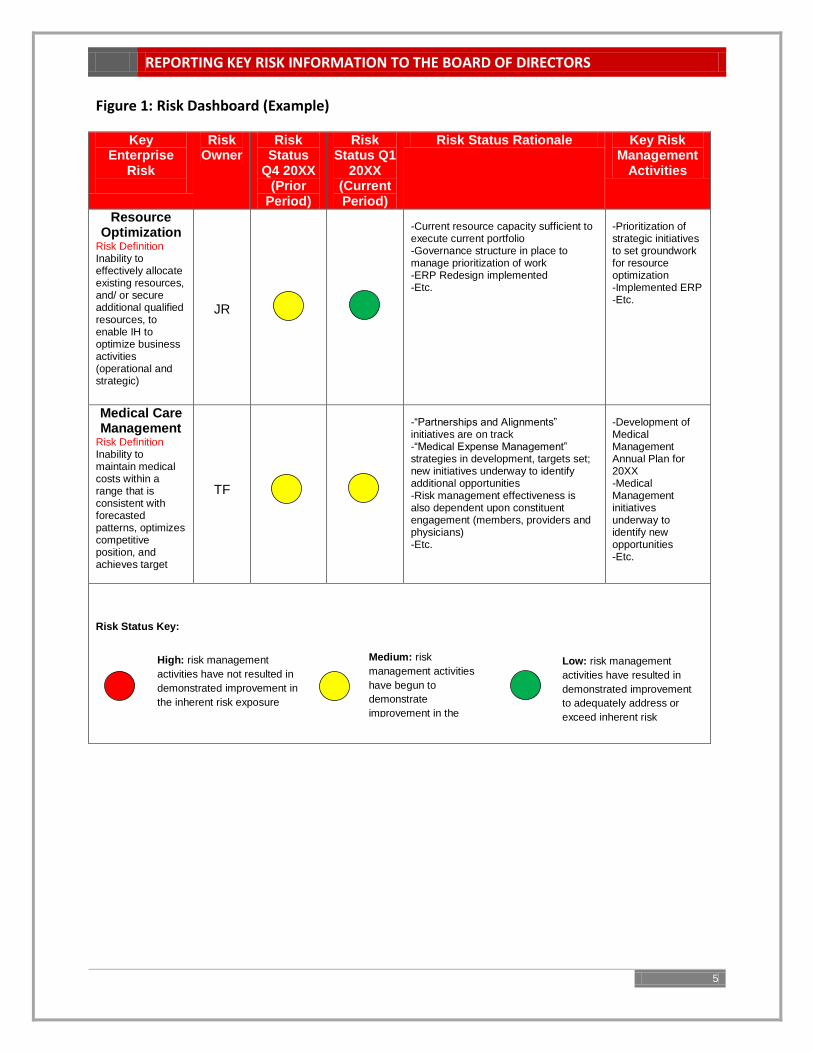
Figure 1 represents a risk dashboard that includes information such as the risk definition, the risk owner
(i.e., the individual responsible for developing and implementing risk responses), risk status and planned
risk management mitigation activities. Each top risk is identified and is often supported by more detailed
information available on a “drill-down” basis if more information is needed by the board to understand
and assess each risk.
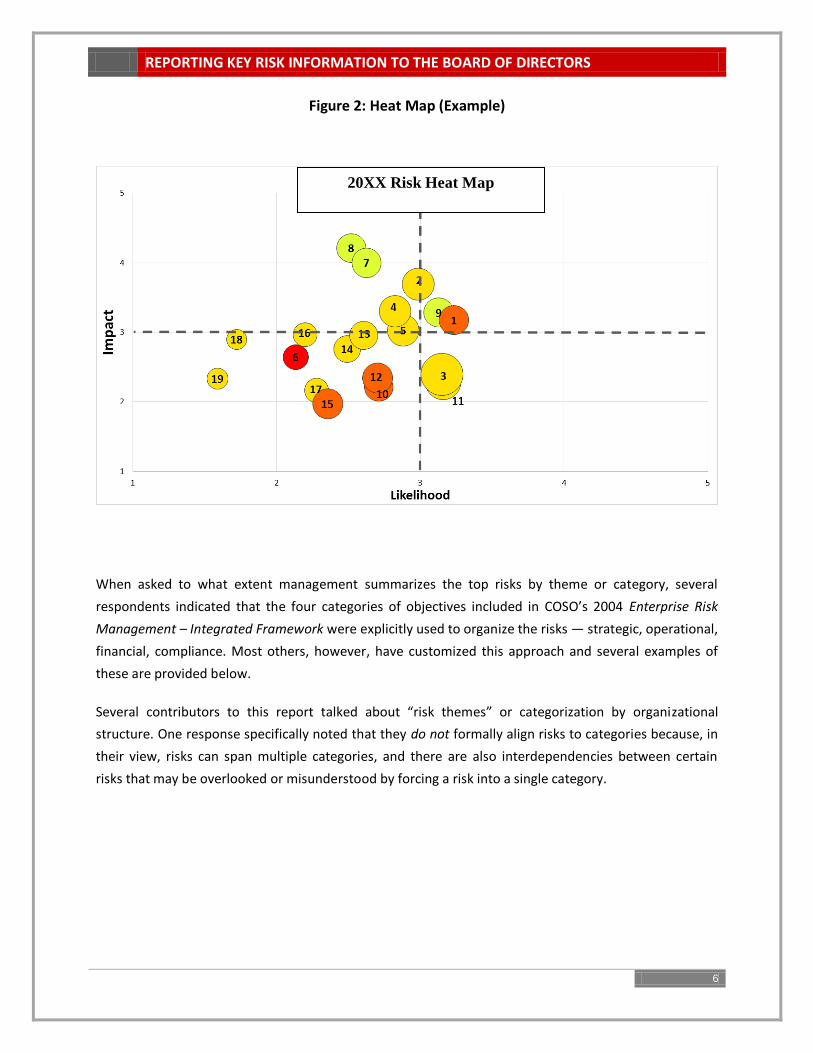
A heat map, as illustrated in Figure 2, on the other hand, combines in a single graphic the set of top tier
risks facing the organization and visually communicates priority based on which quadrant of the heat
map each key risk falls. Those risks in the upper right quadrant have been identified as the highest
impact, highest likelihood risks and demand most attention. Heat maps are intuitively appealing and can
be augmented by color and size of “risk bubbles” (as in the example) to communicate additional
dimensions such as risk velocity and/or management’s assessment of preparedness.
REPORTING KEY RISK INFORMATION TO THE BOARD OF DIRECTORS
5
Figure 1: Risk Dashboard (Example)
Key Enterprise
Risk
Risk Owner
Risk Status
Q4 20XX (Prior
Period)
Risk Status Q1
20XX (Current Period)
Risk Status Rationale Key Risk Management
Activities
Resource Optimization
Risk Definition Inability to effectively allocate existing resources, and/ or secure additional qualified resources, to enable IH to optimize business activities (operational and strategic)
JR
-Current resource capacity sufficient to execute current portfolio -Governance structure in place to manage prioritization of work -ERP Redesign implemented -Etc.
-Prioritization of strategic initiatives to set groundwork for resource optimization -Implemented ERP -Etc.
Medical Care Management
Risk Definition Inability to maintain medical costs within a range that is consistent with forecasted patterns, optimizes competitive position, and achieves target
TF
-“Partnerships and Alignments” initiatives are on track -“Medical Expense Management” strategies in development, targets set; new initiatives underway to identify additional opportunities -Risk management effectiveness is also dependent upon constituent engagement (members, providers and physicians) -Etc.
-Development of Medical Management Annual Plan for 20XX -Medical Management initiatives underway to identify new opportunities -Etc.
Risk Status Key:
High: risk management
activities have not resulted in
demonstrated improvement in
the inherent risk exposure
Medium: risk
management activities
have begun to
demonstrate
improvement in the
inherent risk exposure
Low: risk management
activities have resulted in
demonstrated improvement
to adequately address or
exceed inherent risk
exposure
REPORTING KEY RISK INFORMATION TO THE BOARD OF DIRECTORS
6
Figure 2: Heat Map (Example)
When asked to what extent management summarizes the top risks by theme or category, several
respondents indicated that the four categories of objectives included in COSO’s 2004 Enterprise Risk
Management – Integrated Framework were explicitly used to organize the risks — strategic, operational,
financial, compliance. Most others, however, have customized this approach and several examples of
these are provided below.
Several contributors to this report talked about “risk themes” or categorization by organizational
structure. One response specifically noted that they do not formally align risks to categories because, in
their view, risks can span multiple categories, and there are also interdependencies between certain
risks that may be overlooked or misunderstood by forcing a risk into a single category.
20XX Risk Heat Map
REPORTING KEY RISK INFORMATION TO THE BOARD OF DIRECTORS
7
Here are two examples of risk categories used by different organizations.
Example #1: Risk Categories:
Process Risks
External Risks
Information for Decision Makers
Example #2: Risk Categories:
Operational
Compliance
Black Swan
Strategic
Operations
Financial Reporting
Legal & Compliance
Content of Risk Presentation to Board
Almost all respondents confirmed utilizing a combination of narrative discussion, bullet points and
supporting graphic elements for presenting information to their boards. Narrative discussion included
bullet points and one-page executive summaries of each of the “top 10” risks, in addition to descriptions
of the organization’s ERM methodology, definitions of risks, outlines of the risk management approach
and framework used by management, including aspects of its program and practices, risk culture, key
controls or mitigating activities, mitigation progress and accountability for monitoring, among others.
Figure 3 (on the next page) provides an illustration of a high-level summary of progress towards specific
goals that is used to communicate effectively to the board on the evolution of the enterprise risk
management process. This type of summary can provide an easily understood “roadmap” for board
members to gain confidence that the ERM process is continuing to develop and provide assurance that
important elements are in place. The three items in the 20X3 column with an asterisk indicate that those
activities are currently underway.

REPORTING KEY RISK INFORMATION TO THE BOARD OF DIRECTORS
8
Figure 3: Report On The Organization’s ERM Process (Example)
Progress against Strategic Risk Management Improvement Plan
SET FOUNDATION
(20X1)
BUILD CAPABILITIES
(20X2)
EXPAND RISK MGMT
ASSURANCE (20X3)
Complete:
Complete:
Complete:
Establish risk management
direction
Risk MGMT Process gaps
connected
Risks integrated with strategic
planning
Gain executive commitment
Regular reports to MGMT and
Board
Provide assurance that ERM
processes are adequate and
appropriate:
Establish risk management
framework
Risk owners have clearly
defined roles support, training on
risk concepts
*Complete external assessment
of ERM program
Risk Management Charter and
Policy
Risk mitigation plans
communicated via month
operations reviews
*Complete Internal Audit of Risk
Management process
Develop templates for
identifying, assessing, and
monitoring risks
Risk register for strong and
tracking risk mitigation activities
and progress
*Conduct benchmarking of ERM
program
Develop risk mitigation
responses
Uniform process defined and
documented
Risk management awareness
training
Mitigation and oversight applied
Develop Black Swan Risk
Process
Documented accountabilities
(RACI Chart)
Risk management activities
identified in the business
planning calendar
E-Room for risk sharing and
training
Agreed risk appetite/tolerance
levels for raising issues with
Board

REPORTING KEY RISK INFORMATION TO THE BOARD OF DIRECTORS
9
Board Pre-Read Materials Respondents reported that no additional materials were typically provided to the board beyond the
advance reading package. The typical length of that package varied quite a bit, with one respondent
stating the pre-read was one to two pages, while another respondent was at the other extreme where
85 pages of material was provided. Most (fully two-thirds of the respondents) limited the length of the
pre-read materials to 15 pages or less. One respondent noted that they had been furnishing
approximately 55 pages of material but were changing their approach and, going forward, the pre-read
would be 10 pages or less.
In terms of the number of risks addressed in their report, almost all respondents included only their top
tier risks, which generally consisted of 10 to 15 individual risks. A few noted that they augment the top
tier with any “black swan” risks they’ve identified or other significant emerging risks of note.
For those who prepare a more detailed pre-read (30 pages and up), it is typically organized as an
executive summary with supporting appendices. For some, the pre-read is in the form of presentation
slides while others provide a simple narrative report. One company organized their presentation
according to its ERM organizational structure. Another arranged material in decreasing order of
importance. Some respondents mentioned highlighting year-over-year changes. One respondent
reported organizing their full-board presentation slide deck as follows:
Purpose and Overview
Key Success Drivers for the Organization
Key Enterprise Risk Categories
Significant Risk Drivers/Events
Key Mitigation Strategies
Dashboard Capturing the Key Risks, Exposure and Trajectory
Most respondents have developed templates or standardized profile slides/cards for reporting on an
individual risk, to include such components as:
Category
Impact/Likelihood
Velocity
Owner
Control/Mitigation Treatment and Progress
Accountability for monitoring

REPORTING KEY RISK INFORMATION TO THE BOARD OF DIRECTORS
10
Also mentioned were key risk indicators, identified risk drivers, subject matter experts and 10K reporting
(i.e., Item 1A risk factors disclosed in the 10K). One respondent provided an example of a “dashboard
template” that included the following:
Risk definition
Significance of risk
Board oversight responsibility (e.g., committee with primary oversight)
Monitoring responsibility (risk owner)
Risk prevention activities
Risk response
Key Risk Indicators and KRI status
After presentations to the board regarding the top risks facing an organization, follow-ups or “deeper
dives” are generally at the request of the board, prepared by the risk owner, management or internal
audit and reported at the committee level. Items reported on included progress on executing risk
mitigation strategies, significant near misses, limit violations and risk score impacts. One respondent
stated that at each board meeting (five per year), detailed risk discussions were held at the committee
level.
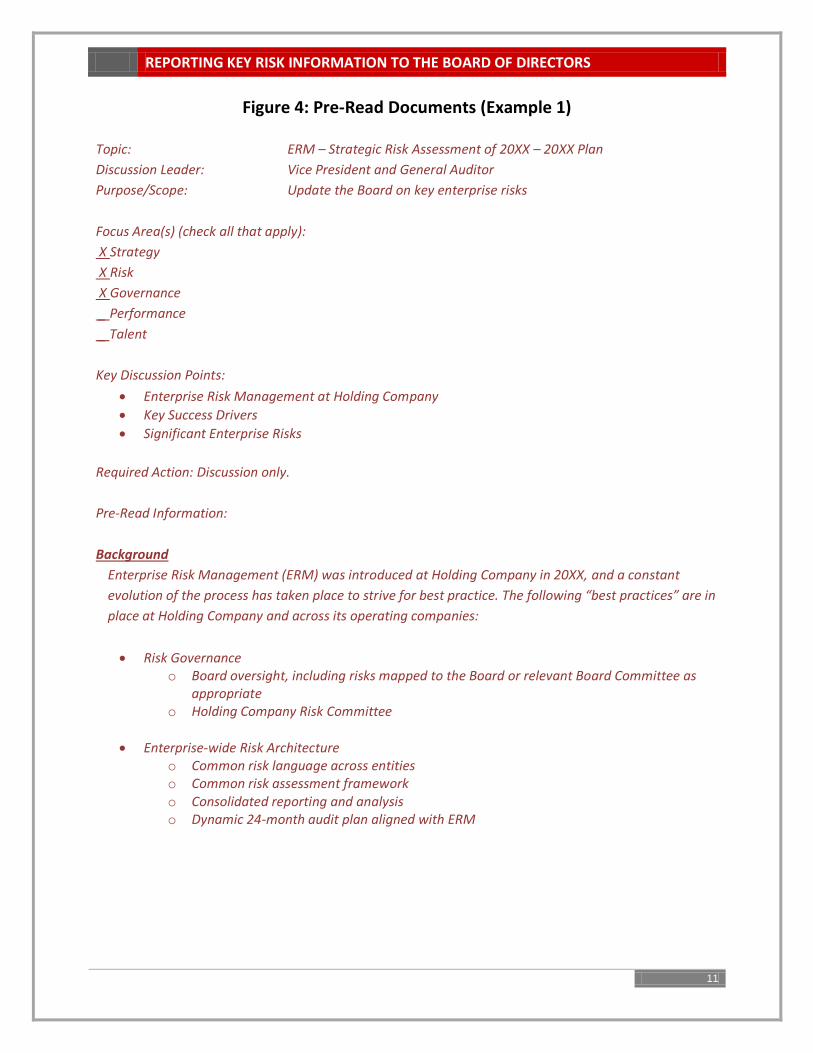
Figure 4 (begins on next page) provides two examples of pre-read documents provided by one
organization to their board. These examples illustrate how a pre-read document can be used to help the
board obtain a high level understanding of the current status of significant enterprise risks faced by the
company and then serve as a basis for a conversation between the board and the risk discussion leader
(VP and General Auditor in this example).
REPORTING KEY RISK INFORMATION TO THE BOARD OF DIRECTORS
11
Figure 4: Pre-Read Documents (Example 1)
Topic: ERM – Strategic Risk Assessment of 20XX – 20XX Plan
Discussion Leader: Vice President and General Auditor
Purpose/Scope: Update the Board on key enterprise risks
Focus Area(s) (check all that apply):
X Strategy
X Risk
X Governance
_ Performance
_ Talent
Key Discussion Points:
Enterprise Risk Management at Holding Company
Key Success Drivers
Significant Enterprise Risks
Required Action: Discussion only.
Pre-Read Information:
Background
Enterprise Risk Management (ERM) was introduced at Holding Company in 20XX, and a constant
evolution of the process has taken place to strive for best practice. The following “best practices” are in
place at Holding Company and across its operating companies:
Risk Governance o Board oversight, including risks mapped to the Board or relevant Board Committee as
appropriate o Holding Company Risk Committee
Enterprise-wide Risk Architecture o Common risk language across entities o Common risk assessment framework o Consolidated reporting and analysis o Dynamic 24-month audit plan aligned with ERM
REPORTING KEY RISK INFORMATION TO THE BOARD OF DIRECTORS
12
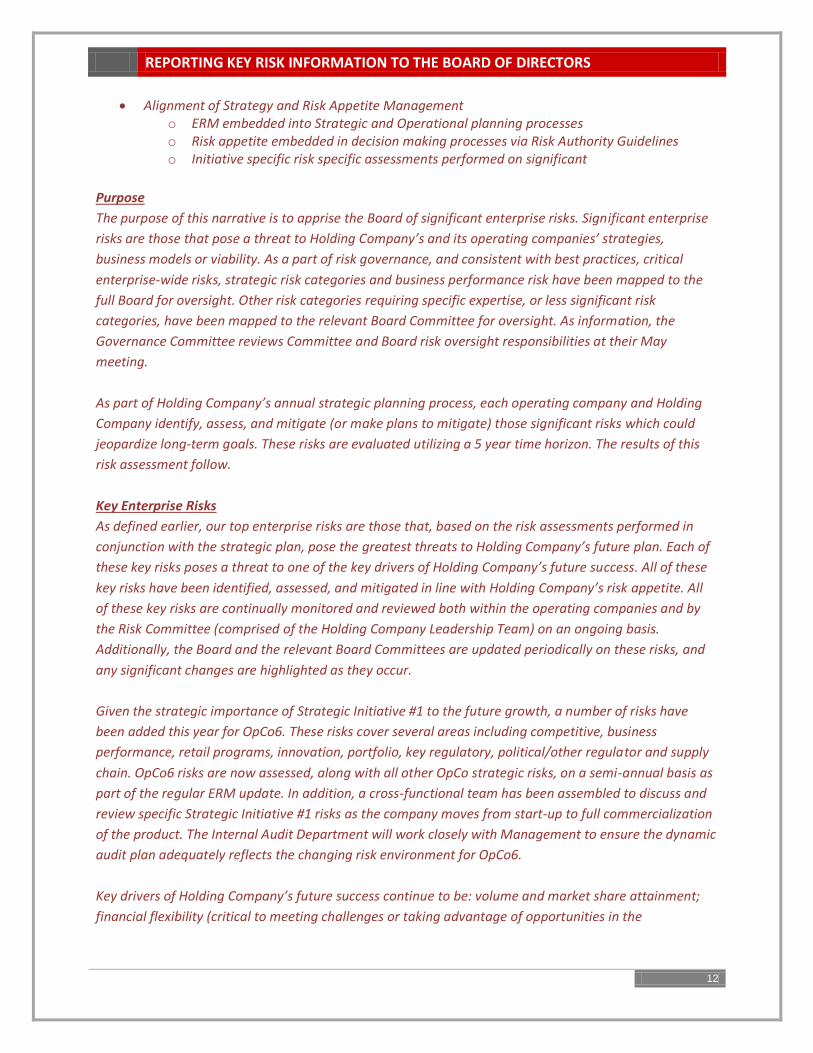
Alignment of Strategy and Risk Appetite Management o ERM embedded into Strategic and Operational planning processes o Risk appetite embedded in decision making processes via Risk Authority Guidelines o Initiative specific risk specific assessments performed on significant
Purpose
The purpose of this narrative is to apprise the Board of significant enterprise risks. Significant enterprise
risks are those that pose a threat to Holding Company’s and its operating companies’ strategies,
business models or viability. As a part of risk governance, and consistent with best practices, critical
enterprise-wide risks, strategic risk categories and business performance risk have been mapped to the
full Board for oversight. Other risk categories requiring specific expertise, or less significant risk
categories, have been mapped to the relevant Board Committee for oversight. As information, the
Governance Committee reviews Committee and Board risk oversight responsibilities at their May
meeting.
As part of Holding Company’s annual strategic planning process, each operating company and Holding
Company identify, assess, and mitigate (or make plans to mitigate) those significant risks which could
jeopardize long-term goals. These risks are evaluated utilizing a 5 year time horizon. The results of this
risk assessment follow.
Key Enterprise Risks
As defined earlier, our top enterprise risks are those that, based on the risk assessments performed in
conjunction with the strategic plan, pose the greatest threats to Holding Company’s future plan. Each of
these key risks poses a threat to one of the key drivers of Holding Company’s future success. All of these
key risks have been identified, assessed, and mitigated in line with Holding Company’s risk appetite. All
of these key risks are continually monitored and reviewed both within the operating companies and by
the Risk Committee (comprised of the Holding Company Leadership Team) on an ongoing basis.
Additionally, the Board and the relevant Board Committees are updated periodically on these risks, and
any significant changes are highlighted as they occur.
Given the strategic importance of Strategic Initiative #1 to the future growth, a number of risks have
been added this year for OpCo6. These risks cover several areas including competitive, business
performance, retail programs, innovation, portfolio, key regulatory, political/other regulator and supply
chain. OpCo6 risks are now assessed, along with all other OpCo strategic risks, on a semi-annual basis as
part of the regular ERM update. In addition, a cross-functional team has been assembled to discuss and
review specific Strategic Initiative #1 risks as the company moves from start-up to full commercialization
of the product. The Internal Audit Department will work closely with Management to ensure the dynamic
audit plan adequately reflects the changing risk environment for OpCo6.
Key drivers of Holding Company’s future success continue to be: volume and market share attainment;
financial flexibility (critical to meeting challenges or taking advantage of opportunities in the

REPORTING KEY RISK INFORMATION TO THE BOARD OF DIRECTORS
13
marketplace or M&A); competitive landscape, including competitive reactions; and high performing
culture.
Overall, the risk profile for Holding Company and its operating companies continues to be moderate. A
sustained, though stable, level of pricing and promotional activity continues to drive a competitive
operating environment for OpCo1, OpCo2, and OpCo3. Key regulatory risk remains elevated. Legal risk at
OpCo1 is negatively impacted by developments in the anonymous case. In addition, the financial risk
profile for Holding Company has improved due to recent activities in the bond market and with the
revolving credit facility. A discussion of each risk category follows.
Key Regulatory: Although an external risk, the key regulatory risk category continues to be assessed as one of the highest enterprise risks to Holding Company’s future success. This risk category has been rated medium/high for several years and continues to be assessed at the same medium/high level. Supporting this risk at the medium//high level for 20XX and beyond are the strategic risks related to the implementation of the requirements of the key regulatory agency. The risk in this category was negatively impacted in March 20XX by the change in leadership at the key regulatory agency, foreshadowing a heightened regulatory risk for the industry. (Medium/High);
Business Performance: The internal risk exists across all operating companies, and refers to risks associated with the marketplace performance of operating companies’ brands, competitive pricing promotions, cost and margin structure, industry dynamics or unfavorable economic conditions that could impair the ability to deliver operating plans. For OpCo1 and OpCo2, the challenging pricing environment, as well as continued down-trading and volume softness, keeps this risk at an elevated level. Significant investment is required by OpCo1 to remain competitive in the marketplace while at OpCo2, competitive activity remains strong in that brand’s geographies. At OpCo3, Brand1 is impacted by continued competitive investment. In addition, near-term support of strategic growth initiatives will require balancing investment with business results. (Medium/High);
Competitive / Retail Programs: These external risk categories refer to risks arising from changes in the competitive and retail environment that could negatively impact brand success in the marketplace or drive an operating company’s retail programs to be less compelling to retailers. The risk in this category remains unchanged as competitors continue a high level of pricing and promotional activity on key competitive brands. (Medium/High);
Legal: Also externally driven, the legal risk category refers to potential adverse outcomes in litigation and/or novel legal theories which could drive liquidity restraints, thereby limiting financial flexibility and potentially jeopardize the ability to respond to or take advantage of marketplace opportunities, M&A, or meet other extraordinary needs. (Medium);
Portfolio / Innovation: These internal risk categories, although assessed separately to ensure appropriate focus and mitigation, are related in that innovation strategy is meant to identify, develop, and leverage innovations to fill projected gaps within Holding Company’s portfolio of brands and companies. For OpCo1, the risk in this category remains medium as there is continued pressure on Brand1 and Brand2 to deliver share and profit growth in a competitive environment.
REPORTING KEY RISK INFORMATION TO THE BOARD OF DIRECTORS
14
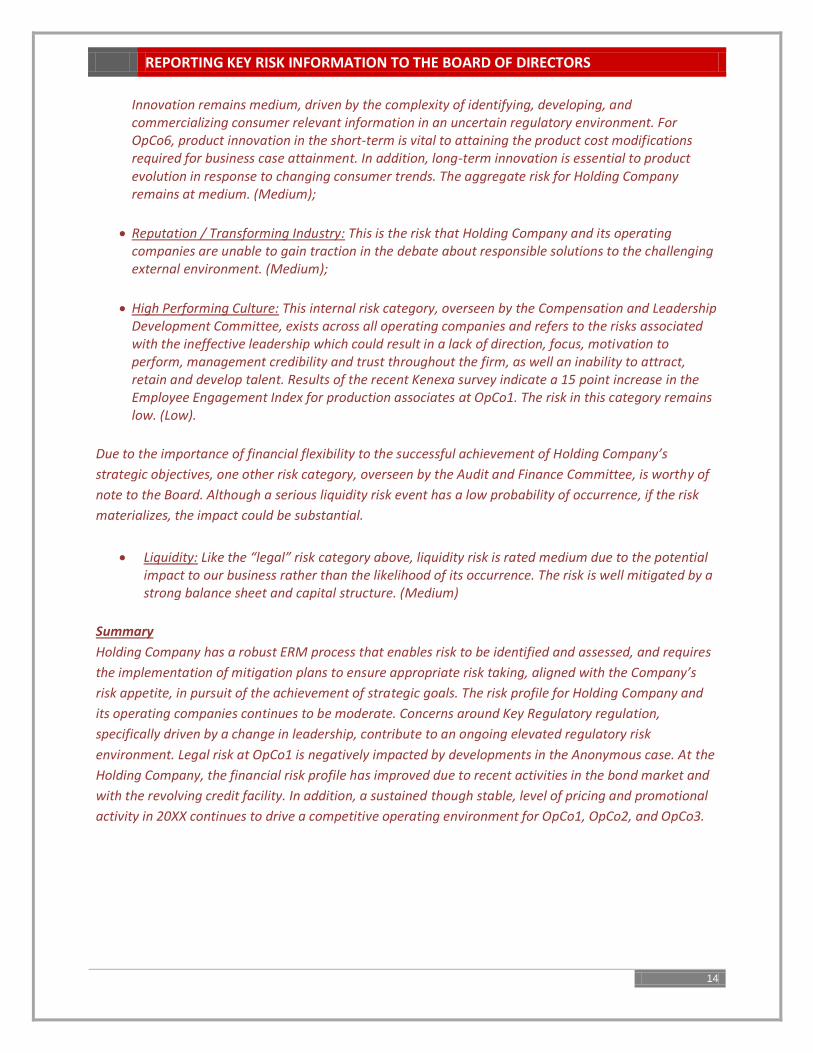
Innovation remains medium, driven by the complexity of identifying, developing, and commercializing consumer relevant information in an uncertain regulatory environment. For OpCo6, product innovation in the short-term is vital to attaining the product cost modifications required for business case attainment. In addition, long-term innovation is essential to product evolution in response to changing consumer trends. The aggregate risk for Holding Company remains at medium. (Medium);
Reputation / Transforming Industry: This is the risk that Holding Company and its operating companies are unable to gain traction in the debate about responsible solutions to the challenging external environment. (Medium);
High Performing Culture: This internal risk category, overseen by the Compensation and Leadership Development Committee, exists across all operating companies and refers to the risks associated with the ineffective leadership which could result in a lack of direction, focus, motivation to perform, management credibility and trust throughout the firm, as well an inability to attract, retain and develop talent. Results of the recent Kenexa survey indicate a 15 point increase in the Employee Engagement Index for production associates at OpCo1. The risk in this category remains low. (Low).
Due to the importance of financial flexibility to the successful achievement of Holding Company’s
strategic objectives, one other risk category, overseen by the Audit and Finance Committee, is worthy of
note to the Board. Although a serious liquidity risk event has a low probability of occurrence, if the risk
materializes, the impact could be substantial.
Liquidity: Like the “legal” risk category above, liquidity risk is rated medium due to the potential impact to our business rather than the likelihood of its occurrence. The risk is well mitigated by a strong balance sheet and capital structure. (Medium)
Summary
Holding Company has a robust ERM process that enables risk to be identified and assessed, and requires
the implementation of mitigation plans to ensure appropriate risk taking, aligned with the Company’s
risk appetite, in pursuit of the achievement of strategic goals. The risk profile for Holding Company and
its operating companies continues to be moderate. Concerns around Key Regulatory regulation,
specifically driven by a change in leadership, contribute to an ongoing elevated regulatory risk
environment. Legal risk at OpCo1 is negatively impacted by developments in the Anonymous case. At the
Holding Company, the financial risk profile has improved due to recent activities in the bond market and
with the revolving credit facility. In addition, a sustained though stable, level of pricing and promotional
activity in 20XX continues to drive a competitive operating environment for OpCo1, OpCo2, and OpCo3.

REPORTING KEY RISK INFORMATION TO THE BOARD OF DIRECTORS
15
Figure 4: Pre-Read Documents (Example 2)
Holding Company
Enterprise Risk Management (ERM) Update
Background
As part of the Enterprise Risk Management process, a semi-annual update for strategic risks was
provided to the Holding Company Risk Committee in April and will be provided to the Audit & Finance
Committee at the May A&FC meeting. The scorecard and dashboards are included behind this narrative
in Agenda Item I of the book in BoardVantage. However, the drill-down will not work from this location;
please follow instructions at the end of the narrative to drill down to the detailed risks.
Holding Company’s ERM process continues to function as intended and in support of Holding Company’s
strategic objectives. Holding Company has a mature ERM process in risk governance, enterprise-wide risk
architecture, and alignment of strategy and risk appetite management. The ERM risk universe provides
risk assessment and analysis against strategic risks, business and financial performance risks,
operational risks, and compliance and financial reporting risks and is driven by a robust ERM process
which is embedded in the Holding Company culture.
Executive Summary
Overall, the risk profile for Holding Company and its operating companies continues to be moderate.
Regulatory risk for Holding Company, OpCo1 and OpCo3 is increasing based upon the Key Regulatory
risk. Management identified this risk in 20XX, however, recent events have increased the likelihood and
velocity of realization. Competitive risk also continues to be elevated relative to net pricing. A sustained,
though stable, high level or pricing and promotional activity in both product category 1 and product
category 2 continues to drive a competitive operating environment for OpCo1 and OpCo2. However,
Competitive and Business Performance risk for OpCo1 are decreasing in trajectory and overall exposure
based upon the improved environment experienced over the last year. In addition, risks for OpCo4
continue to be developed, mitigated and tracked as Innovation 1 moves closer to additional expansion.
At OpCo1, the risk profile is stable and progress continues on the key business initiatives relative to
legislative outcomes, media coverage and public policy debate.
Significant Risk Assessment Update Results by Entity (detail omitted):
Holding Company
OpCo1
OpCo2
OpCo3 …..through OpCo6
REPORTING KEY RISK INFORMATION TO THE BOARD OF DIRECTORS
16
Summary
The risk profile for Holding Company and its operating companies continues to be moderate. Concerns
around regulation, specifically driven by xxxxx and xxxx contribute to an increasing and ongoing elevated
regulatory risk environment. In addition, a sustained, though stable, high level of pricing and
promotional activity result in a competitive operating environment for OpCo1 and OpCo2 although this is
viewed as a decreasing risk for OpCo1 for this cycle. Finally, OpCo3 political/other regulatory risk is
decreasing based on lower likelihood and impact that specific legislation puts OpCo3 at commercial risk.

REPORTING KEY RISK INFORMATION TO THE BOARD OF DIRECTORS
17
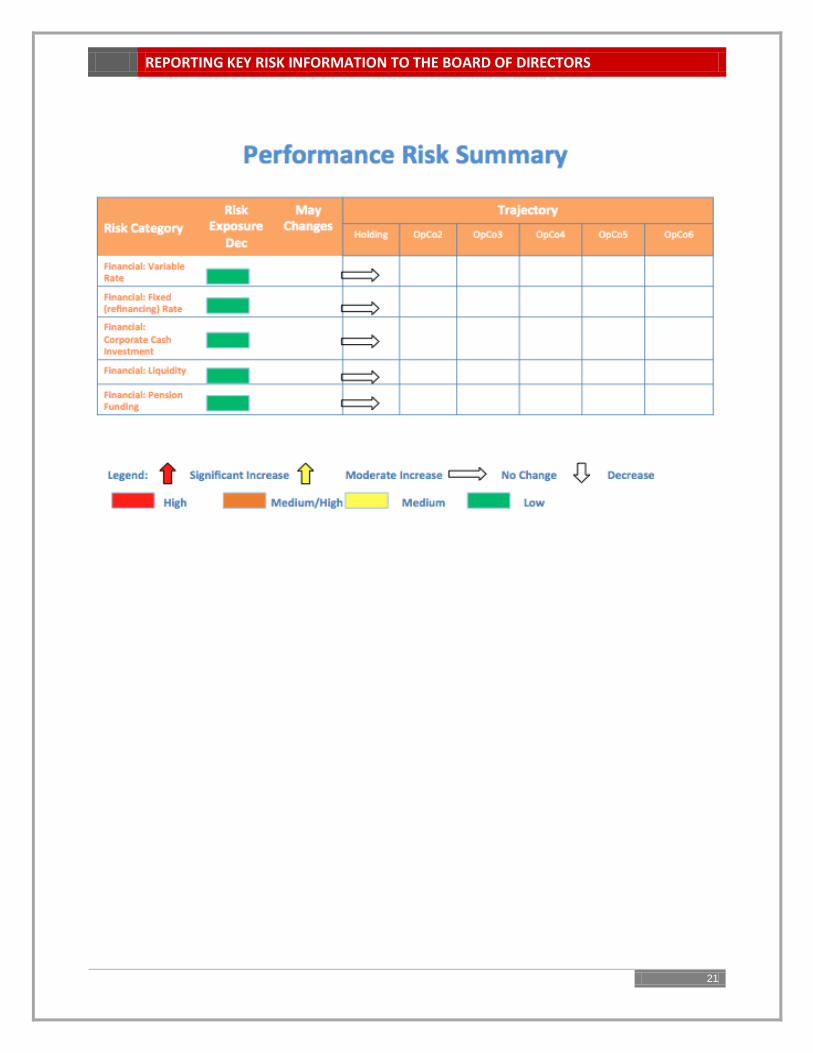
Presentations at Board Meetings Almost all respondents discussed utilizing visual formats in their presentation to the board, such as heat
maps, dashboards, scorecards, charts and graphs, with heat maps explicitly mentioned by the majority.
These were presented as supporting documentation in pre-reads and Power Point slide decks. Several
examples of these presentation visuals are illustrated in Figures 5 – 8 that follow.
Figure 5: Risk Scorecard (Example)
Risk Statement Risk Owner
Risk Assessment
Data Security: The potential risk of a data breach (internal or vendor) that results in a significant compromise of client data
Executive
Primary
Financial Impact
Reputation
Likelihood
Smith
Jones
$100+ million
Severe
Possible
Speed of Onset
Trend
Objective
High
Increasing
Reduce
Emerging Risks & Factors Influencing the Risk Trend
Source
Weaker protections in the US have resulted in escalating rates of reported breaches involving payment card data.
External
Etc.
Key Risk Response Activities
Description of Activity Status
Deployed new POS terminals eliminating client payment card data at point of sale
Complete
Etc.
Key Risk Indicators
Metric / Description
Current Quarter
Prior(-1) Quarter
Prior(-2) Quarter
Prior(-3) Quarter
# of open high-risk findings in risk register
#
#
#
#
Etc.
Additional Comments / Related Risks
An optional cybersecurity framework was issued by NIST in February 20XX; we will be conducting a mapping/gap exercise over the course of the coming year Etc.

REPORTING KEY RISK INFORMATION TO THE BOARD OF DIRECTORS
18
Figure 6: Risk Dashboard (Example 1)
Risk Category
Risk Description
Risk Owner
Last Assess
Ment Date
Near Term Risk
(Ability to
Deliver Plan)
Strategic Impact to Business
Model
FailureRisk
Trend (1 – 3 years)
Overall Future Assess
ment (1 – 3 years)
Strategic
Global Growth August 20XX
Competition
August 20XX
Product
August 20XX
Brand
August 20XX
Financial
Finance August 20XX
Fin’l Svcs
August 20XX
Operational
People
August 20XX
Parts & Accessories
August 20XX
Supply Chain
August 20XX
Manufacturing
August 20XX
Information Technology
August 20XX
Compliance
Regulatory Compliance
August 20XX
Reputation
August 20XX

REPORTING KEY RISK INFORMATION TO THE BOARD OF DIRECTORS
19
Figure 7: Risk Dashboard (Example 2)
.
Risk Dashboard
Food Borne Illnes Risk: The risk that food or water that contains bacteria, parasites, viruses or toxins
made by these germs is inadvertently served to a customer, which could result in fines, liability and
reputational costs.
Oversight: Board of Directors Food Safety Committee
Monitoring Risk Committee Branch/District Mangement
Risk Prevention Risk Reponse
Training on safe food handling practices Customer care line
Refrigerator and coller system maintenance Media response plans
Ownership: Vendor selection process Incident investigations
-Marketing Inspection programs
-Distribution
-Supply Effectivenes of prevention and response:
Low concern moderate concern high concern
Threat Potential:-Major
-Moderate-Minor
Key risk Indicators (KRIs): Assurance:
M A M J J A Internal Audit
FDA
Health Department
Low Concern Moderate concern High concern Data not available
Number of customer complaints
% of new employees trained
Average daily inspection results
Food Borne Illness Risk: Supporting Documentation
Risk Prevention:
Risk Response:
KRIs (As of August):
Training on safe food handling practices: Currently the safe food handling practices training has been rolled out to one
restaurant. The original deadline was to have all restaurants trained by Q2 20XX. A consulting group has been engaged to
complete the training. Anticipated completion date in 4Q 20XX.
Refrigerator and cooler system maintenance: Recent audit findings show that annual refrigerator and cooler maintenance is
past due at 4 of our locations. Procedures are being reviewed and employees will be trained by February 20XX.
Incident Investigations: The current electronic solution for tracting food borne illness incidents has not been properly configured
at all locations. Some locations are unable to use the system, resulting in poor trending and reporting.
Number of new employees trained: 90% of new hires completed orientation in the month of August. The remaining 10% are
scheduled to be trained in September. (Green = 100%, Yellow = 90%-99%, Red = < 90%).
Average Daily Inspection Results: 25 Daily Inspection Reports were not completed or had missing information. The Inspection
Manager will review the incomplete reports with the respective inspectors by year end 20XX. (Green = <5, Yellow = 6-20, Red =
>20 reports)

REPORTING KEY RISK INFORMATION TO THE BOARD OF DIRECTORS
20
Figure 8: Risk Summaries (Examples)
Business Unit Dashboard
As of 20XX
REPORTING KEY RISK INFORMATION TO THE BOARD OF DIRECTORS
21

REPORTING KEY RISK INFORMATION TO THE BOARD OF DIRECTORS
22

REPORTING KEY RISK INFORMATION TO THE BOARD OF DIRECTORS
23
Ideas for Future Risk Reporting to Board As one would predict given the nature of the firms participating in this survey, most respondents
indicated that they have been working on ERM for some time. Fourteen years was the longest time
explicitly reported. Others said 10 years, nine years, seven years, six years, and several at five years. Two
stated that they had been engaged for around only two years and characterized their programs as not
very mature.
No one claimed that they were done, but several used terms such as mature, advanced, comfortable,
practical and effective. Several talked about continued evolution even though they had been at ERM in
excess of five years. One response stated that they had transitioned from simply assessing risks to now
having a solid understanding of how risks are managed in their organization. Another talked about the
movement from qualitative to more quantitative risk assessment. One respondent commented that
reports have become shorter over time, concentrating more on top operational and compliance risks
and utilizing business unit and corporate dashboards for more effective risk reporting.
Most respondents noted that they have received positive feedback from senior leadership and the
board. They reported their boards indicated satisfaction with the level of detail they were receiving and
with the frequency of reporting. One comment indicated that their board was significantly more
engaged in risk oversight than had been previously true.
When asked about anticipated changes to improve risk reporting, several items were mentioned. One
organization is working on an expanded look at risk velocity, additional stress testing and further
development and refining of key risk indicators. Another organization hopes to facilitate a shift in the
board conversation to better focus on strategic risks. Two others also indicated a desire to focus more
on emerging and strategic risks. One mentioned a renewed effort in refining risk appetite statements.
One respondent noted that they have just introduced a new risk dashboard format and have recently
modified their heat maps, so no new changes are likely in the next few years. Another related a plan to
roll out a common risk assessment methodology across business units and to develop and conduct more
stress tests. One respondent did note that they were considering a change from an MS Office platform
to a dedicated ERM software platform — though that software product was not identified.

REPORTING KEY RISK INFORMATION TO THE BOARD OF DIRECTORS
24
Conclusions This report provides a number of data points that may prove useful in benchmarking your organization’s
current risk reporting practices against those followed by a number of large organizations with mature
ERM programs. How often does your board receive (or request) information concerning the top risk
exposures your organization faces? How effective are your current reports in communicating this
information to the board? What can you change or adjust to better inform your board of these key
risks? Thoughtful reflection on these questions may lead to an improved communications process for
your organization that will benefit all stakeholders.
As ERM processes mature within an organization, meaningful, effective communication of enterprise-
wide risk management objectives to the board of directors is critical to their success. As well, significant
external pressures continue to build that has driven most boards of directors to more fully engage in risk
oversight activities. This report hopefully provides helpful example illustrations of effective risk
reporting tools and strategies that organizations with less mature ERM processes may incorporate to
expand their board’s engagement with key risk exposures they face.

REPORTING KEY RISK INFORMATION TO THE BOARD OF DIRECTORS
25
Participating Organizations The Coca-Cola Company
Cree Inc.
CSX Corporation
Devon Energy Corporation
Eli Lilly and Company
Genworth Financial, Inc.
Grant Thornton LLP
H&R Block
Harley-Davidson
Hospital Corporation of America (HCA)
Humana
IBM
Independent Health
Independent Purchasing Cooperative (IPC) Inc.
Lockheed Martin
Pentagon Federal Credit Union
Protiviti Inc.
Provident Financial Services
Reynolds American
RTI International
Southern Company
Tesoro Corporation
The ERM Initiative thanks the participating organizations for providing their responses to our survey
questions and for providing illustrative examples of the tools they use to effectively communicate key
risk information to senior leadership and the board of directors of their organizations.

REPORTING KEY RISK INFORMATION TO THE BOARD OF DIRECTORS
26
About ERM Initiative
The Enterprise Risk Management (ERM) Initiative in the Poole College of Management at North Carolina
State University is pioneering thought-leadership about the emergent discipline of enterprise risk
management, with a particular focus on the integration of ERM in strategy planning and governance.
The ERM Initiative conducts outreach to business professionals through executive education and its
internet portal (http://www.erm.ncsu.edu); research advancing knowledge and understanding of ERM
issues; and undergraduate and graduate business education for the next generation of business
executives. Faculty in the ERM Initiative frequently work with boards of directors and senior
management teams helping them link ERM to strategy and governance.
Author Bio Bruce C. Branson, is Professor of Accounting and Associate Director of the ERM Initiative in the Poole
College of Management at North Carolina State University. His teaching and research is focused on
enterprise risk management and financial reporting, and includes an interest in the use of derivative
securities and other hedging strategies for risk reduction/risk sharing. He also has examined the use of
various forecasting and simulation tools to form expectations used in financial statement audits and in
earnings forecasting research. He earned his Ph.D. at Florida State University.
Contact the ERM Initiative at: [email protected] or 919.513.0901.