topic 2 (2012-13a)mp final
TRANSCRIPT

7/29/2019 Topic 2 (2012-13A)MP Final
http://slidepdf.com/reader/full/topic-2-2012-13amp-final 1/94
Corporate Financial Policy
Semester A 2012-13City University of Hong Kong
AC4331 – Week 2

7/29/2019 Topic 2 (2012-13A)MP Final
http://slidepdf.com/reader/full/topic-2-2012-13amp-final 2/94
Topic 2
.

7/29/2019 Topic 2 (2012-13A)MP Final
http://slidepdf.com/reader/full/topic-2-2012-13amp-final 3/94
1-2
Introduction to Financial Management
Free Cash Flow
Financial Planning and Forecasting
Financial Assets and Time Value of Money etc.
Bond and Stock Valuation Cost of Capital
Cash Flow Estimation and Risk Analysis
Capital Structure and Leverage
Treasury and Valuation
Enterprise Risk Management
Dividends and Share Repurchase Merger and Acquisitions
Working Capital Management

7/29/2019 Topic 2 (2012-13A)MP Final
http://slidepdf.com/reader/full/topic-2-2012-13amp-final 4/94
Extra Ref: Financial Management, Theory and Practice, 12e Eugene and
Brigham
7/29/2019 Topic 2 (2012-13A)MP Final
http://slidepdf.com/reader/full/topic-2-2012-13amp-final 5/94
Understand and calculate a firm’s free cashflow
Understand techniques and models forforecasting financial statements
4

7/29/2019 Topic 2 (2012-13A)MP Final
http://slidepdf.com/reader/full/topic-2-2012-13amp-final 6/94
5
Company managers, investors, and outside analystsuse financial statements to conduct…
Cash flow analysis Performance (ratio) analysis

7/29/2019 Topic 2 (2012-13A)MP Final
http://slidepdf.com/reader/full/topic-2-2012-13amp-final 7/94

7/29/2019 Topic 2 (2012-13A)MP Final
http://slidepdf.com/reader/full/topic-2-2012-13amp-final 8/94
Free Cash Flow
1. What is Free Cash Flow?
2. Why is FCF an importantdeterminant of a firm’s value?
3. Calculating FCF
Ref: Eugene Ch 2 Pg 44
7

7/29/2019 Topic 2 (2012-13A)MP Final
http://slidepdf.com/reader/full/topic-2-2012-13amp-final 9/94
8
What are key measures of cash flow?
Profit is based on accrual accounting,focusing on past periods.
Finance emphasizes the importance of timing. “You can’t deposit net income, only cash.”
Timing of cash flow matters.
Accrual accounting may obscure timing.

7/29/2019 Topic 2 (2012-13A)MP Final
http://slidepdf.com/reader/full/topic-2-2012-13amp-final 10/94
9
2011 2012
Sales 3,432,000 5,834,400
COGS 2,864,000 4,980,000
Other expenses 340,000 720,000
Deprec. 18,900 116,960
Tot. op. costs 3,222,900 5,816,960
EBIT 209,100 17,440
Int. expense 62,500 176,000
EBT 146,600 (158,560)
Taxes (40%) 58,640 (63,424)
Net income 87,960 (95,136)
7/29/2019 Topic 2 (2012-13A)MP Final
http://slidepdf.com/reader/full/topic-2-2012-13amp-final 11/9410
Sales increased by over $2.4 million. Costs shot up by more than sales.
Net income was negative.
However, the firm received a tax refund sinceit paid taxes of more than $63,424 duringthe past two years.

7/29/2019 Topic 2 (2012-13A)MP Final
http://slidepdf.com/reader/full/topic-2-2012-13amp-final 12/94
11
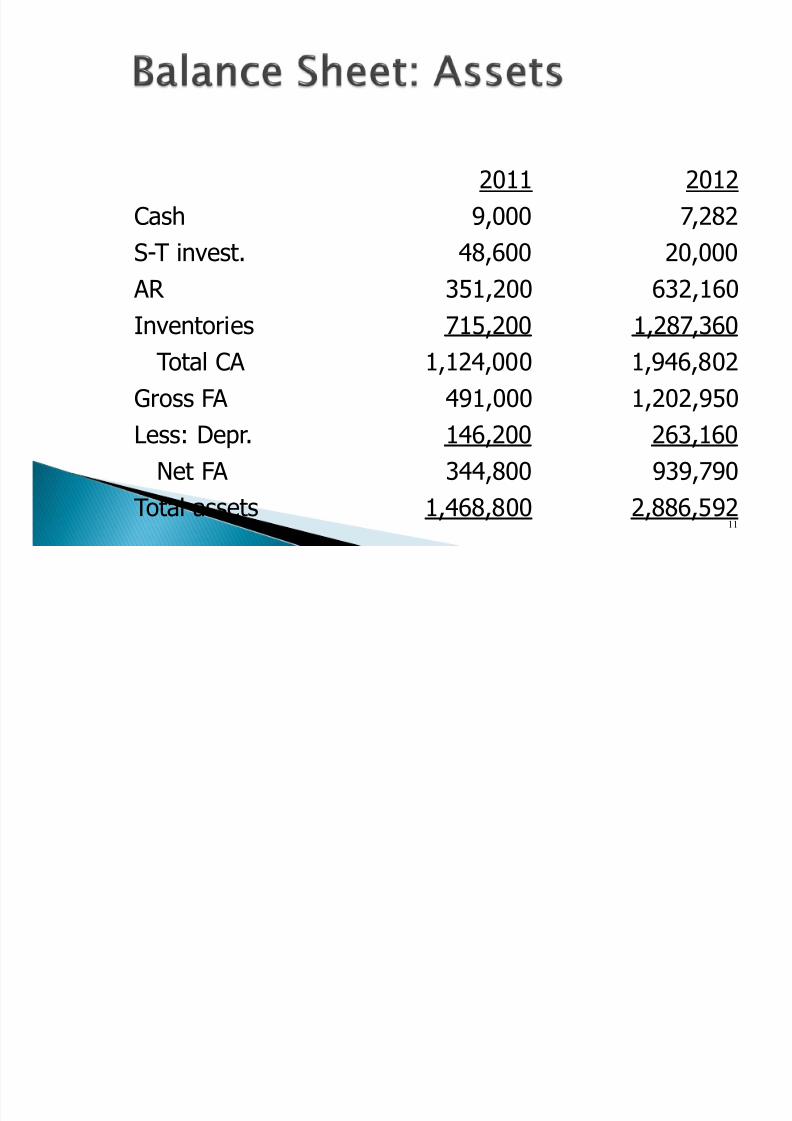
2011 2012
Cash 9,000 7,282
S-T invest. 48,600 20,000 AR 351,200 632,160
Inventories 715,200 1,287,360
Total CA 1,124,000 1,946,802
Gross FA 491,000 1,202,950
Less: Depr. 146,200 263,160
Net FA 344,800 939,790
Total assets 1,468,800 2,886,592
7/29/2019 Topic 2 (2012-13A)MP Final
http://slidepdf.com/reader/full/topic-2-2012-13amp-final 13/94
12
Net fixed assets almost tripled in size. AR and inventory almost doubled.
Cash and short-term investments fell.

7/29/2019 Topic 2 (2012-13A)MP Final
http://slidepdf.com/reader/full/topic-2-2012-13amp-final 14/94
13
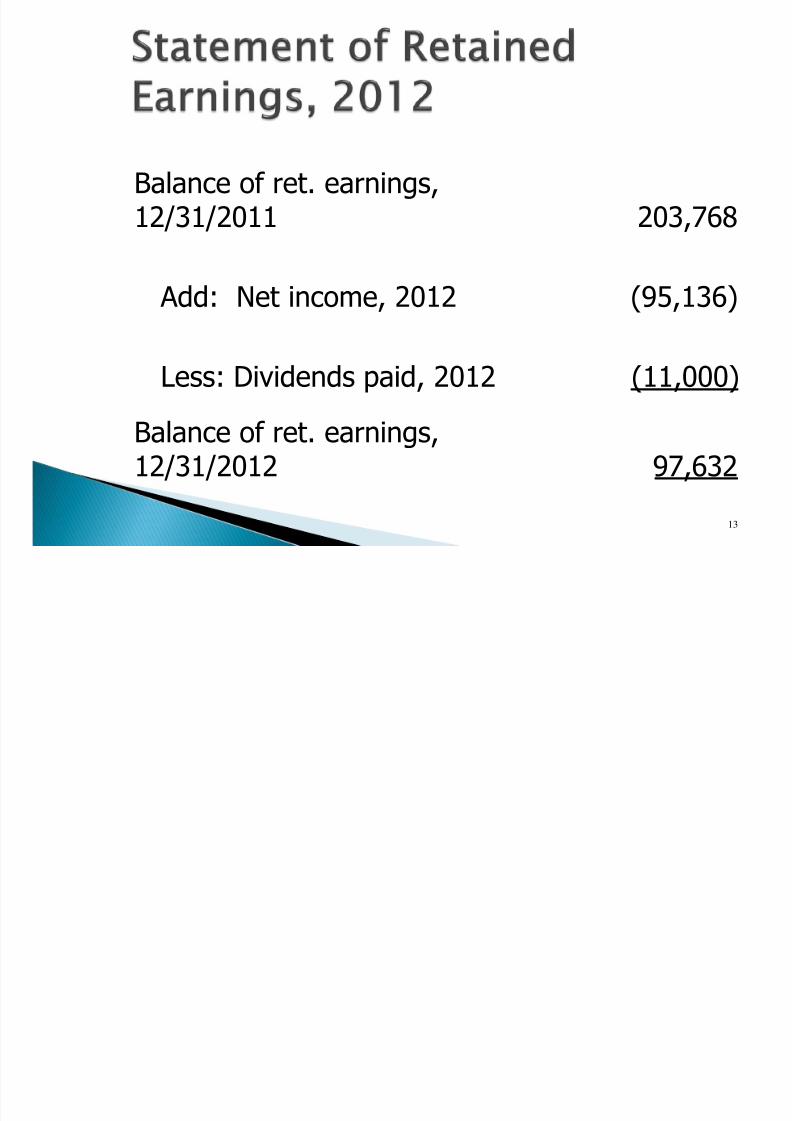
Balance of ret. earnings,12/31/2011 203,768
Add: Net income, 2012 (95,136)
Less: Dividends paid, 2012 (11,000)
Balance of ret. earnings,12/31/2012 97,632
7/29/2019 Topic 2 (2012-13A)MP Final
http://slidepdf.com/reader/full/topic-2-2012-13amp-final 15/94
14
2011 2012
Accts. payable 145,600 324,000
Notes payable 200,000 720,000 Accruals 136,000 284,960
Total CL 481,600 1,328,960
Long-term debt 323,432 1,000,000
Common stock 460,000 460,000
Ret. earnings 203,768 97,632
Total equity 663,768 557,632
Total L&E 1,468,800 2,886,592

7/29/2019 Topic 2 (2012-13A)MP Final
http://slidepdf.com/reader/full/topic-2-2012-13amp-final 16/94
15
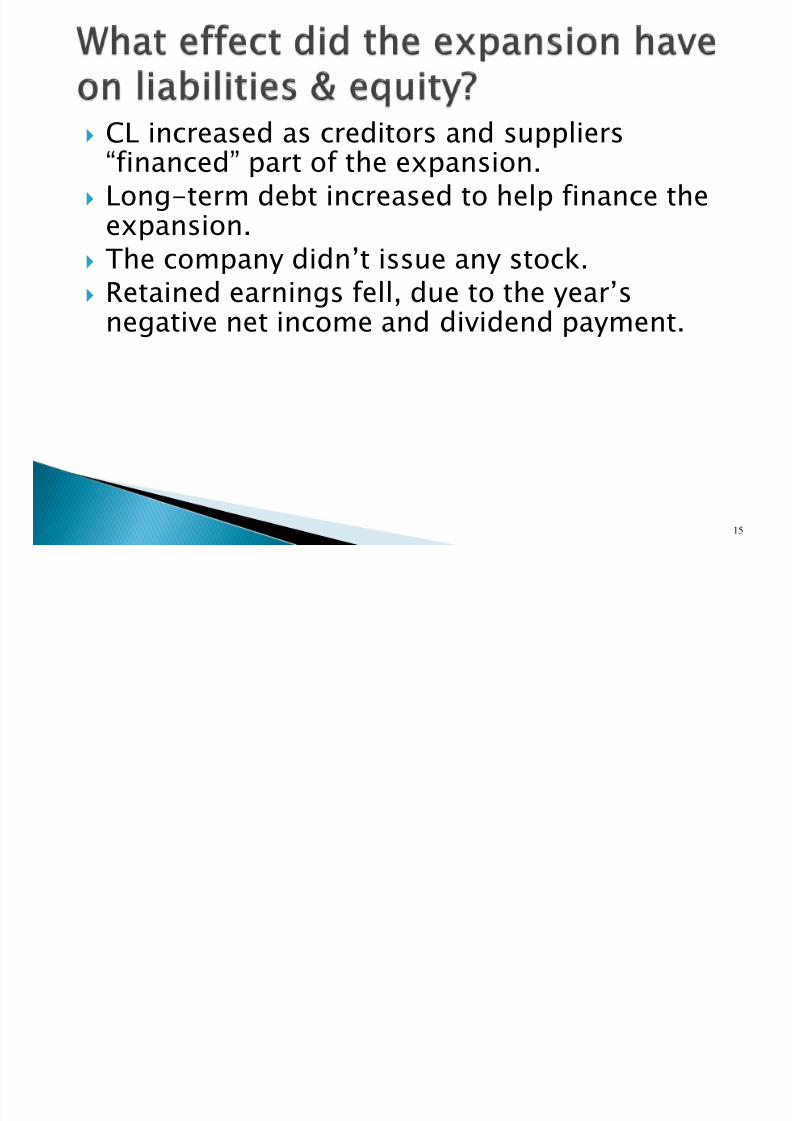
CL increased as creditors and suppliers“financed” part of the expansion.
Long-term debt increased to help finance theexpansion.
The company didn’t issue any stock. Retained earnings fell, due to the year’s
negative net income and dividend payment.

7/29/2019 Topic 2 (2012-13A)MP Final
http://slidepdf.com/reader/full/topic-2-2012-13amp-final 17/94
16
Operating Activities
Net Income (95,136)
Adjustments:
Depreciation 116,960
Change in AR (280,960)
Change in inventories (572,160)Change in AP 178,400
Change in accruals 148,960
Net cash provided by ops. (503,936)

7/29/2019 Topic 2 (2012-13A)MP Final
http://slidepdf.com/reader/full/topic-2-2012-13amp-final 18/94
17
Investing Activities
Cash used to acquire FA (711,950)
Change in S-T invest. 28,600
Net cash provided by inv. act. (683,350)

7/29/2019 Topic 2 (2012-13A)MP Final
http://slidepdf.com/reader/full/topic-2-2012-13amp-final 19/94
18
Financing Activities
Change in notes payable 520,000
Change in long-term debt 676,568
Payment of cash dividends (11,000)
Net cash provided by fin. act. 1,185,568

7/29/2019 Topic 2 (2012-13A)MP Final
http://slidepdf.com/reader/full/topic-2-2012-13amp-final 20/94
19
Net cash provided by ops. (503,936)
Net cash to acquire FA (683,350)
Net cash provided by fin. act. 1,185,568
Net change in cash (1,718)
Cash at beginning of year 9,000
Cash at end of year 7,282

7/29/2019 Topic 2 (2012-13A)MP Final
http://slidepdf.com/reader/full/topic-2-2012-13amp-final 21/94
20
Net CF from operations = -$503,936,because of negative net income andincreases in working capital.
The firm spent $711,950 on FA. The firm borrowed heavily and sold some
short-term investments to meet its cashrequirements.
Even after borrowing, the cash account fell
by $1,718.
7/29/2019 Topic 2 (2012-13A)MP Final
http://slidepdf.com/reader/full/topic-2-2012-13amp-final 22/94
21
FCF is the amount of cash available fromoperations for distribution to all investors(including stockholders and debtholders)after making the necessary investments to
support operations. A company’s value depends upon the amount
of FCF it can generate.

7/29/2019 Topic 2 (2012-13A)MP Final
http://slidepdf.com/reader/full/topic-2-2012-13amp-final 23/94
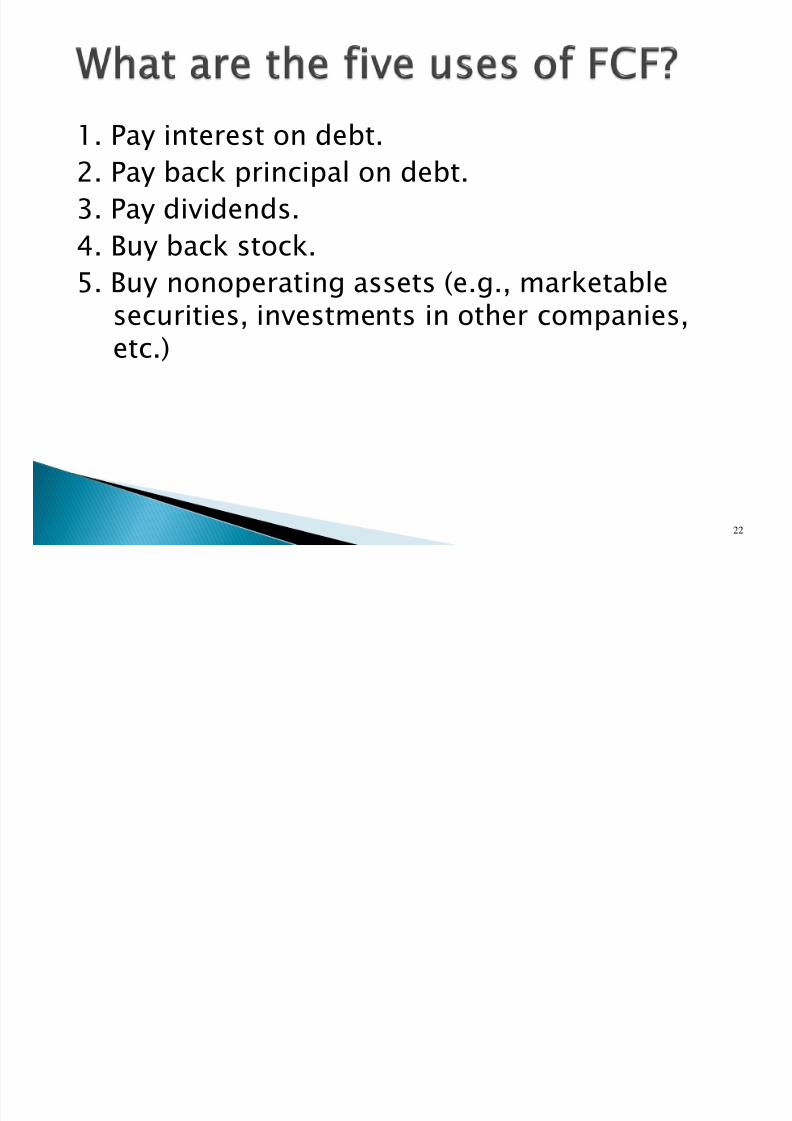
22
1. Pay interest on debt.2. Pay back principal on debt.
3. Pay dividends.
4. Buy back stock.5. Buy nonoperating assets (e.g., marketablesecurities, investments in other companies,etc.)

7/29/2019 Topic 2 (2012-13A)MP Final
http://slidepdf.com/reader/full/topic-2-2012-13amp-final 24/94
23
Operating current assets are the CA neededto support operations.◦ Op CA include: cash, inventory, receivables.
◦ Op CA exclude: short-term investments, because
these are not a part of operations.
7/29/2019 Topic 2 (2012-13A)MP Final
http://slidepdf.com/reader/full/topic-2-2012-13amp-final 25/94
24
Operating current liabilities are the CLresulting as a normal part of operations.◦ Op CL include: accounts payable and accruals.
◦ Op CL exclude: notes payable, because this is a
source of financing, not a part of operations.
7/29/2019 Topic 2 (2012-13A)MP Final
http://slidepdf.com/reader/full/topic-2-2012-13amp-final 26/94
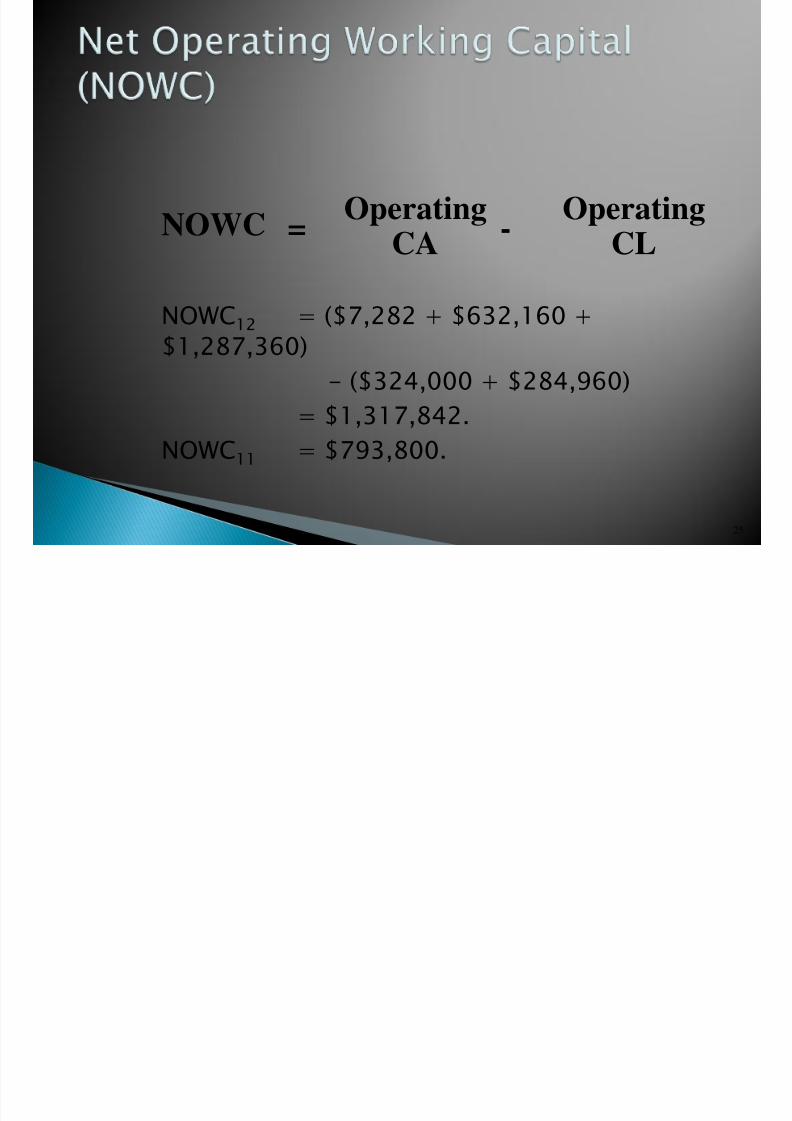
25
NOWC12 = ($7,282 + $632,160 +
$1,287,360)
- ($324,000 + $284,960)= $1,317,842.
NOWC11 = $793,800.
= -Operating
CA
Operating
CL
NOWC

7/29/2019 Topic 2 (2012-13A)MP Final
http://slidepdf.com/reader/full/topic-2-2012-13amp-final 27/94
26
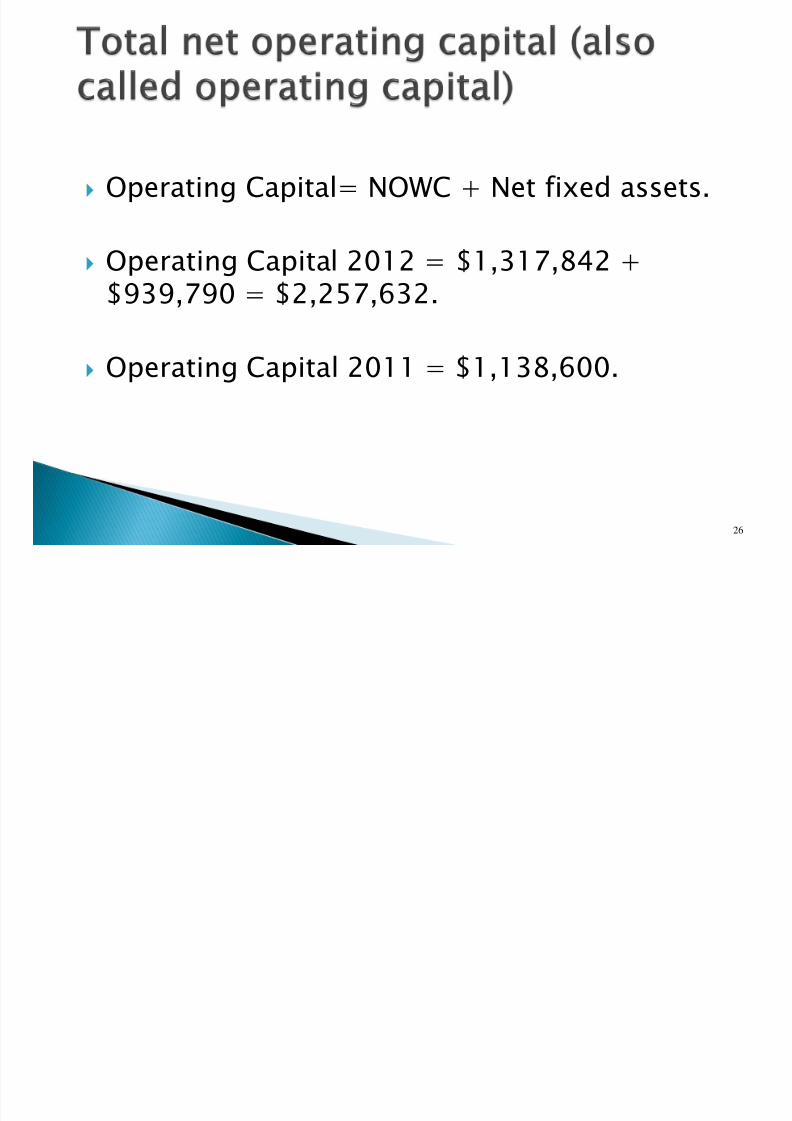
Operating Capital= NOWC + Net fixed assets.
Operating Capital 2012 = $1,317,842 +$939,790 = $2,257,632.
Operating Capital 2011 = $1,138,600.
7/29/2019 Topic 2 (2012-13A)MP Final
http://slidepdf.com/reader/full/topic-2-2012-13amp-final 28/94
27
NOPAT = EBIT(1 - Tax rate)
NOPAT12 = $17,440(1 - 0.4)
= $10,464.
NOPAT11 = $125,460.

7/29/2019 Topic 2 (2012-13A)MP Final
http://slidepdf.com/reader/full/topic-2-2012-13amp-final 29/94
28
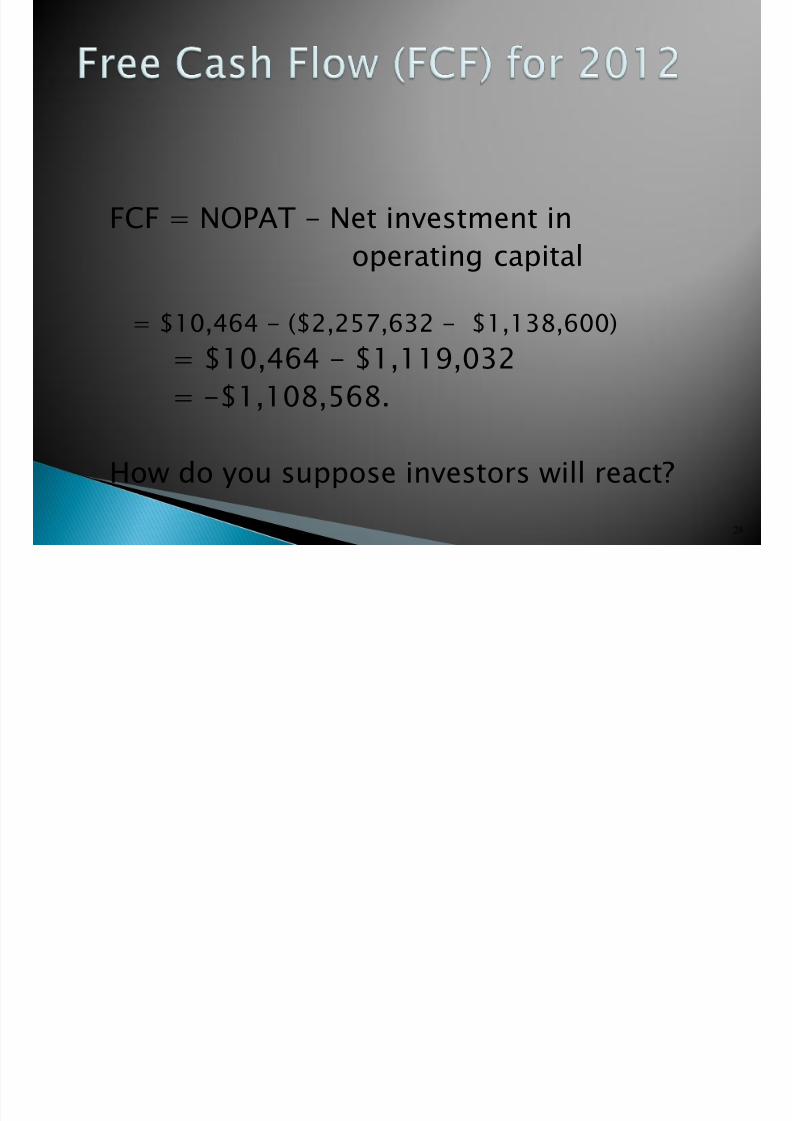
FCF = NOPAT - Net investment in
operating capital
= $10,464 - ($2,257,632 - $1,138,600)
= $10,464 - $1,119,032
= -$1,108,568.
How do you suppose investors will react?

7/29/2019 Topic 2 (2012-13A)MP Final
http://slidepdf.com/reader/full/topic-2-2012-13amp-final 30/94
29
ROIC = NOPAT / operating capital
ROIC12 = $10,464 / $2,257,632 = 0.5%.
ROIC11 = 11.0%.

7/29/2019 Topic 2 (2012-13A)MP Final
http://slidepdf.com/reader/full/topic-2-2012-13amp-final 31/94
30
No. The ROIC of 0.5% is less than the WACCof 10%. Investors did not get the return theyrequire.
Note: High growth usually causes negativeFCF (due to investment in capital), but that’sok if ROIC > WACC. For example, HomeDepot had high growth, negative FCF, but ahigh ROIC.
7/29/2019 Topic 2 (2012-13A)MP Final
http://slidepdf.com/reader/full/topic-2-2012-13amp-final 32/94
31
Net operating profitafter taxes (NOPAT)
= EBIT (1 – T)
Operating cashflow (OCF)
= NOPAT + Depreciation
= EBIT (1 – T) + Depreciation
Free cashflow (FCF)
= OCF – FA – (CA – AP – Accruals)

7/29/2019 Topic 2 (2012-13A)MP Final
http://slidepdf.com/reader/full/topic-2-2012-13amp-final 33/94
Extra Ref: Financial Management, Theory and Practice, 12e Eugene and
Brigham
7/29/2019 Topic 2 (2012-13A)MP Final
http://slidepdf.com/reader/full/topic-2-2012-13amp-final 34/94
Financial Planning and Forecasting
Chapter 4

7/29/2019 Topic 2 (2012-13A)MP Final
http://slidepdf.com/reader/full/topic-2-2012-13amp-final 35/94
Develop a financial plan using the percentageof sales approach
Discern how capital structure and dividendpolicies affect a firm’s ability to grow

7/29/2019 Topic 2 (2012-13A)MP Final
http://slidepdf.com/reader/full/topic-2-2012-13amp-final 36/94
4.1 Forecasting Sales 4.2 Projecting the Assets and Internally
Generated Funds 4.3 Projecting Outside Funds Needed 4.4 Deciding How to Raise Funds

7/29/2019 Topic 2 (2012-13A)MP Final
http://slidepdf.com/reader/full/topic-2-2012-13amp-final 37/94
2012 2013ECash and equivalents $ 20 $ 25
Accounts receivable 240 300
Inventories 240 300Total current assets $ 500 $ 625
Net fixed assets 500 625
Total assets $1,000 $1,250
4-36

7/29/2019 Topic 2 (2012-13A)MP Final
http://slidepdf.com/reader/full/topic-2-2012-13amp-final 38/94
2012 2013E Accts payable & accrued liab. $ 100 $ 125
Notes payable 100 190
Total current liabilities 200 315Long-term debt 100 190
Common stock 500 500
Retained earnings 200 245Total liabilities & equity $1,000 $1,250
4-37

7/29/2019 Topic 2 (2012-13A)MP Final
http://slidepdf.com/reader/full/topic-2-2012-13amp-final 39/94
2012 2013ESales $2,000.0 $2,500.0Less: Variable costs 1,200.0 1,500.0
Fixed costs 700.0 875.0EBIT $ 100.0 $ 125.0Interest 16.0 16.0EBT $ 84.0 $ 109.0
Taxes (40%) 33.6 43.6Net income $ 50.4 $ 65.40Dividends (30% of NI) $15.12 $19.62
Addition to retained earnings $35.28 $45.784-38

7/29/2019 Topic 2 (2012-13A)MP Final
http://slidepdf.com/reader/full/topic-2-2012-13amp-final 40/94
2012 2013E Ind Avg Comment
Basic earning power 10.00% 10.00% 20.00% Poor
Profit margin 2.52% 2.62% 4.00% Poor
Return on equity 7.20% 8.77% 15.60% Poor
Days sales outstanding 43.8 days 43.8 days 32.0 days Poor
Inventory turnover 8.33x 8.33x 11.00x Poor
Fixed assets turnover 4.00x 4.00x 5.00x Poor
Total assets turnover 2.00x 2.00x 2.50x Poor
Debt/assets 30.00% 40.40% 36.00% OK Times interest earned 6.25x 7.81x 9.40x Poor
Current ratio 2.50x 1.99x 3.00x Poor
Payout ratio 30.00% 30.00% 30.00% OK
4-39

7/29/2019 Topic 2 (2012-13A)MP Final
http://slidepdf.com/reader/full/topic-2-2012-13amp-final 41/94
Financial Models
Projection of Future Plans◦ Short Term or Long Term
◦ Results in Pro-Forma Statements
Influenced by:
◦ Investment in new assets – capital budgetingdecisions
◦ Degree of financial leverage – capital structuredecisions
◦
Cash paid to shareholders – dividend policydecisions
◦ Liquidity requirements – net working capitaldecisions

7/29/2019 Topic 2 (2012-13A)MP Final
http://slidepdf.com/reader/full/topic-2-2012-13amp-final 42/94
Sales Forecast –cash flows depend directly on thelevel or estimated growth rate of sales
Pro Forma Statements –Presenting the plan asprojected financial statements (pro forma) allowsfor consistency and ease of interpretation
Asset Requirements – additional assets required tomeet sales projections
Financial Requirements – financing needed to payfor the required assets
Plug Variable – depends on type of financing to beused (makes the balance sheet balance)
7/29/2019 Topic 2 (2012-13A)MP Final
http://slidepdf.com/reader/full/topic-2-2012-13amp-final 43/94
Some items vary directly with sales, othersdo not.
Income Statement◦ Costs may vary directly with sales - if this is the
case, then the profit margin is constant◦ Depreciation and interest expense may not vary
directly with sales – if this is the case, then theprofit margin is not constant
◦ Dividends are a management decision and
generally do not vary directly with sales – thisaffects additions to retained earnings

7/29/2019 Topic 2 (2012-13A)MP Final
http://slidepdf.com/reader/full/topic-2-2012-13amp-final 44/94
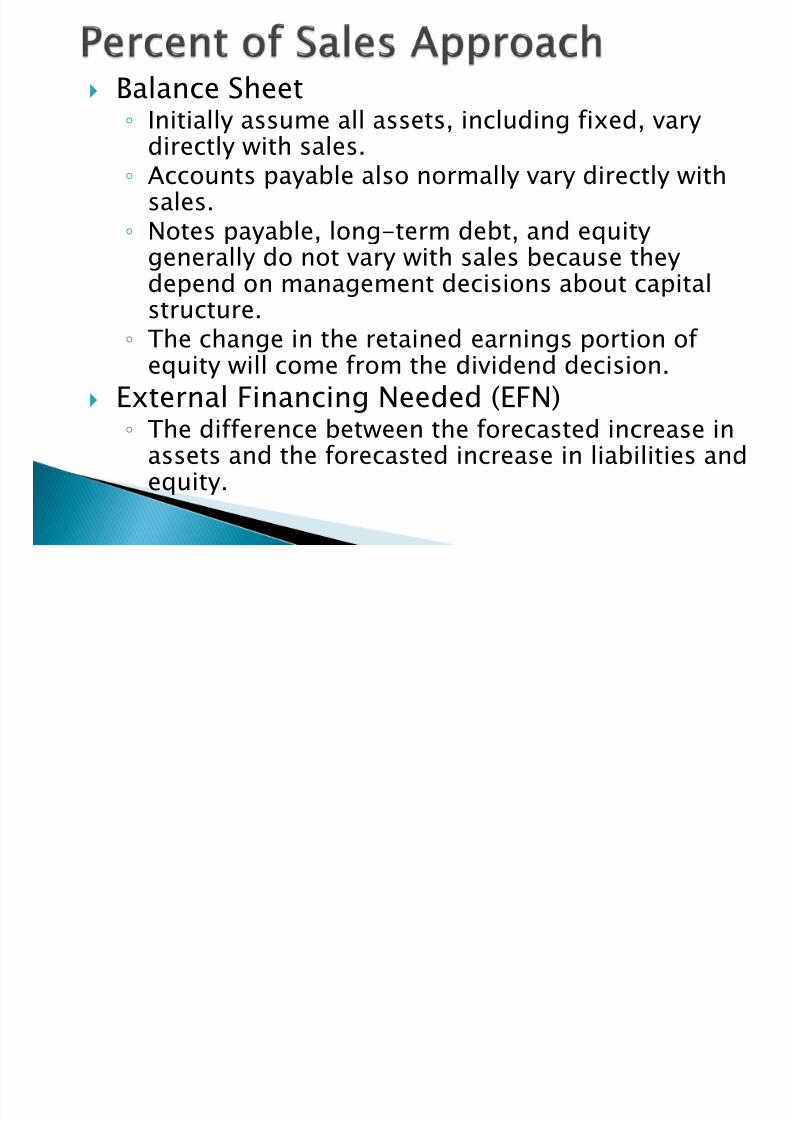
Balance Sheet◦ Initially assume all assets, including fixed, vary
directly with sales.◦ Accounts payable also normally vary directly with
sales.◦ Notes payable, long-term debt, and equity
generally do not vary with sales because theydepend on management decisions about capitalstructure.
◦ The change in the retained earnings portion of equity will come from the dividend decision.
External Financing Needed (EFN)◦ The difference between the forecasted increase in
assets and the forecasted increase in liabilities andequity.

7/29/2019 Topic 2 (2012-13A)MP Final
http://slidepdf.com/reader/full/topic-2-2012-13amp-final 45/94
Operating at full capacity in 2012.
Each type of asset grows proportionallywith sales.
Payables and accruals grow proportionallywith sales.
2013 profit margin (2.52%) and payout(30%) will be maintained.
Sales are expected to increase by $500million. (%S = 25%)
4-44

7/29/2019 Topic 2 (2012-13A)MP Final
http://slidepdf.com/reader/full/topic-2-2012-13amp-final 46/94
Spontaneous Liabilities: Accounts Payables +Accrued Liabilities PM = Profit Margin D = payout ratio
AFN = (A0*/S0)S – (L0*/S0)S – M(S1)(RR)
= ($1,000/$2,000)($500)– ($100/$2,000)($500)– 0.0252($2,500)(0.7)
= $180.9 million
4-45
)1(Sales)Projected(ΔSalesSales
LiabSponSales
Sales
Assetsd PM
7/29/2019 Topic 2 (2012-13A)MP Final
http://slidepdf.com/reader/full/topic-2-2012-13amp-final 47/94
4-46
Consultation with some key managers hasyielded the following revisions:
◦ Firm expects customers to pay quicker next year,thus reducing DSO to 34 days without affectingsales.
◦ A new facility will boost the firm’s net fixed assetsto $700 million.
◦ New inventory system to increase the firm’sinventory turnover to 10x, without affecting sales.
7/29/2019 Topic 2 (2012-13A)MP Final
http://slidepdf.com/reader/full/topic-2-2012-13amp-final 48/94
4-47
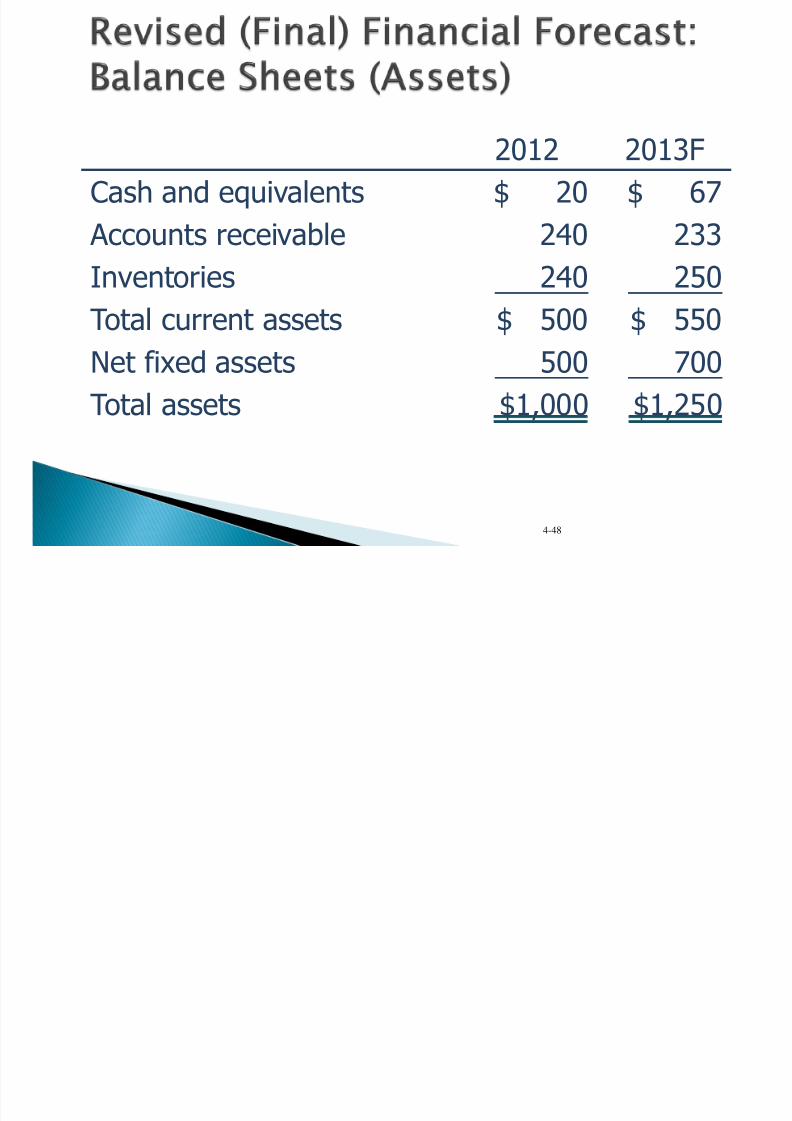
These changes will lead to adjustments in thefirm’s assets and will have no effect on thefirm’s liabilities and equity section of thebalance sheet or its income statement.
7/29/2019 Topic 2 (2012-13A)MP Final
http://slidepdf.com/reader/full/topic-2-2012-13amp-final 49/94
2012 2013F
Cash and equivalents $ 20 $ 67
Accounts receivable 240 233
Inventories 240 250
Total current assets $ 500 $ 550
Net fixed assets 500 700
Total assets $1,000 $1,250
4-48

7/29/2019 Topic 2 (2012-13A)MP Final
http://slidepdf.com/reader/full/topic-2-2012-13amp-final 50/94
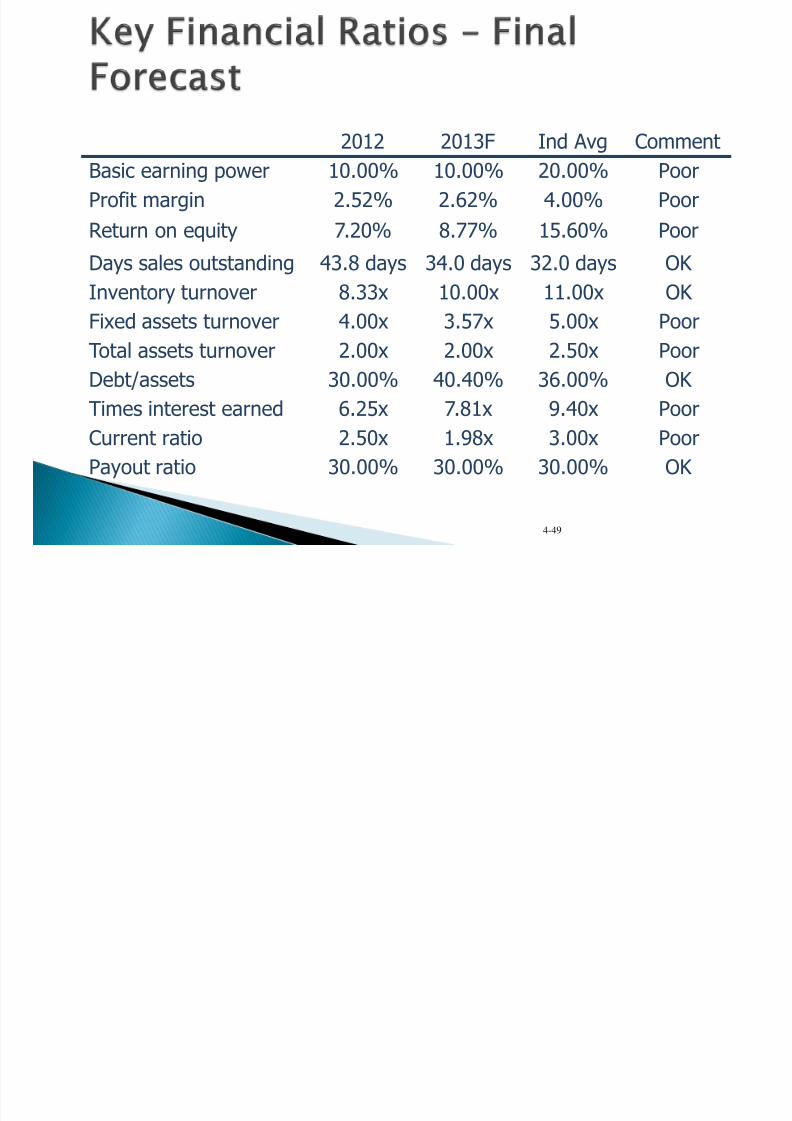
2012 2013F Ind Avg Comment
Basic earning power 10.00% 10.00% 20.00% Poor
Profit margin 2.52% 2.62% 4.00% Poor
Return on equity 7.20% 8.77% 15.60% Poor
Days sales outstanding 43.8 days 34.0 days 32.0 days OK Inventory turnover 8.33x 10.00x 11.00x OK
Fixed assets turnover 4.00x 3.57x 5.00x Poor
Total assets turnover 2.00x 2.00x 2.50x Poor
Debt/assets 30.00% 40.40% 36.00% OK
Times interest earned 6.25x 7.81x 9.40x Poor
Current ratio 2.50x 1.98x 3.00x Poor
Payout ratio 30.00% 30.00% 30.00% OK
4-49

7/29/2019 Topic 2 (2012-13A)MP Final
http://slidepdf.com/reader/full/topic-2-2012-13amp-final 51/94
4-50
$1,125
625$125$$625
(NFA)AssetsFixedNet(NWC)CapitalgNet WorkinCapital2013
900$2012Capital
225$
900$$1,125capitalininvestmentNet

7/29/2019 Topic 2 (2012-13A)MP Final
http://slidepdf.com/reader/full/topic-2-2012-13amp-final 52/94
FCF = EBIT(1 – T) – Net investment in capital
= $125(0.6) – $225
= $75 – $225
= -$150
4-51
7/29/2019 Topic 2 (2012-13A)MP Final
http://slidepdf.com/reader/full/topic-2-2012-13amp-final 53/94
The maximum amount of sales that can besupported by the 2012 level of assets is:
4-52
$2,3535$2,000/0.8
capacityof %sales/ ActualsalesCapacity
2013 forecast sales exceed the capacity
sales, so new fixed assets are required tosupport 2013 sales.

7/29/2019 Topic 2 (2012-13A)MP Final
http://slidepdf.com/reader/full/topic-2-2012-13amp-final 54/94
Sales wouldn’t change but assets would belower, so turnovers would improve.
Less new debt, hence lower interest andhigher profits◦ EPS, ROE, debt ratio, and TIE would improve.
4-53

7/29/2019 Topic 2 (2012-13A)MP Final
http://slidepdf.com/reader/full/topic-2-2012-13amp-final 55/94
Higher dividend payout ratio?
◦ Increase AFN: Less retained earnings.
Higher profit margin?
◦ Decrease AFN: Higher profits, more retainedearnings.
Higher capital intensity ratio?
◦ Increase AFN: Need more assets for given sales.
Pay suppliers in 60 days, rather than 30days?
◦ Decrease AFN: Trade creditors supply more capital
(i.e., L0*/S0 increases). 4-54

7/29/2019 Topic 2 (2012-13A)MP Final
http://slidepdf.com/reader/full/topic-2-2012-13amp-final 56/94
External Financing Needed (EFN) can alsobe calculated as:
)1(Sales)Projected(ΔSalesSales
LiabSponSalesSalesAssets d PM
The first term measures the increase in assets, which is
based on the capital intensity ratio.The second and third terms capture the increase in
liabilities and equity, respectively.
7/29/2019 Topic 2 (2012-13A)MP Final
http://slidepdf.com/reader/full/topic-2-2012-13amp-final 57/94
External Financing and Growth
At low growth levels, internal financing(retained earnings) may exceed the requiredinvestment in assets.
As the growth rate increases, the internal
financing will not be enough, and the firm willhave to go to the capital markets forfinancing.
Examining the relationship between growthand external financing required is a usefultool in financial planning.
7/29/2019 Topic 2 (2012-13A)MP Final
http://slidepdf.com/reader/full/topic-2-2012-13amp-final 58/94
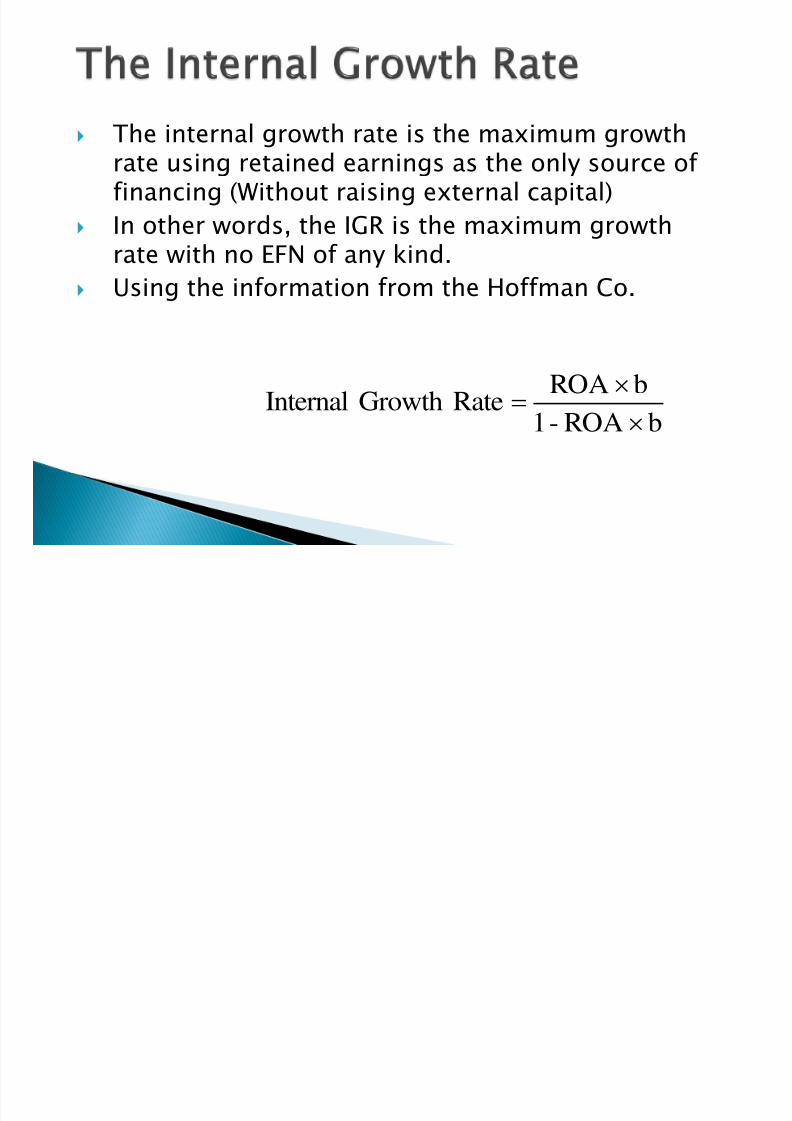
The internal growth rate is the maximum growthrate using retained earnings as the only source of financing (Without raising external capital)
In other words, the IGR is the maximum growth
rate with no EFN of any kind. Using the information from the Hoffman Co.
bROA-1bROA RateGrowthInternal

7/29/2019 Topic 2 (2012-13A)MP Final
http://slidepdf.com/reader/full/topic-2-2012-13amp-final 59/94
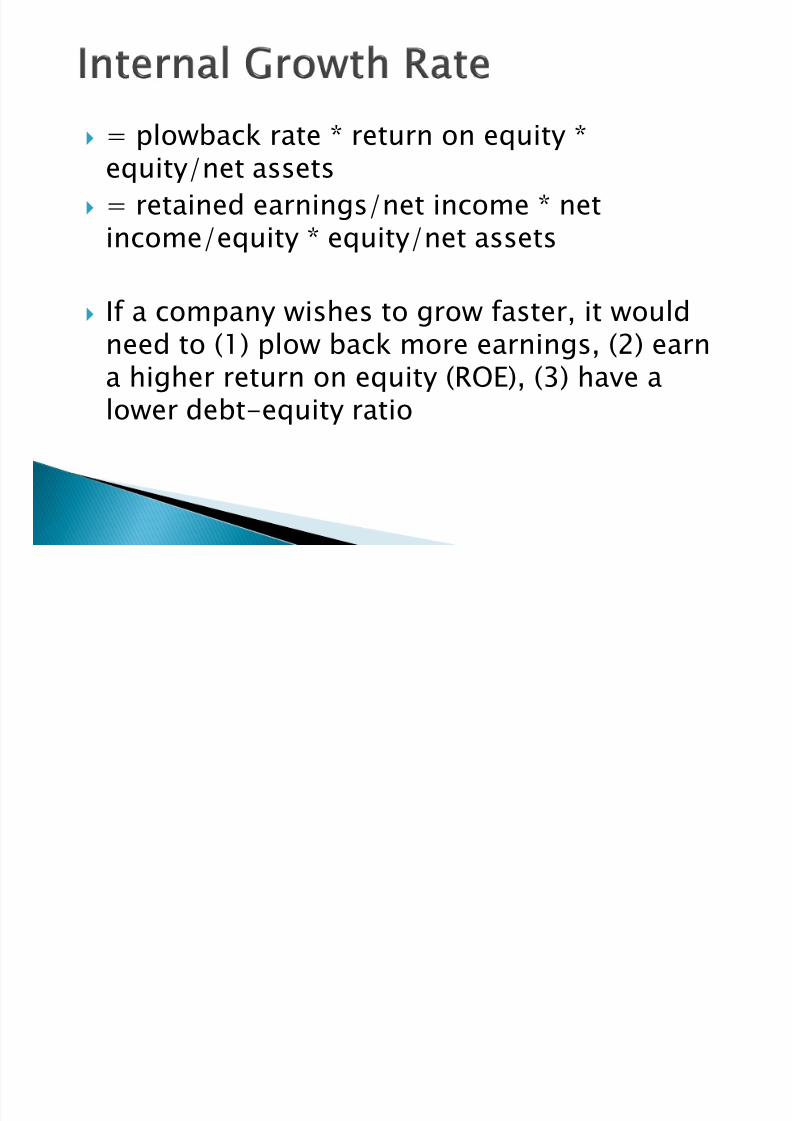
= plowback rate * return on equity *equity/net assets
= retained earnings/net income * netincome/equity * equity/net assets
If a company wishes to grow faster, it wouldneed to (1) plow back more earnings, (2) earna higher return on equity (ROE), (3) have alower debt-equity ratio

7/29/2019 Topic 2 (2012-13A)MP Final
http://slidepdf.com/reader/full/topic-2-2012-13amp-final 60/94
The sustainable growth rate tells us howmuch the firm can grow by using internallygenerated funds and issuing debt to maintaina constant debt ratio (not increasing financial
leverage) = plowback ratio * return on equity
= Retained earnings/net income * return onequity (debt-equity ratio remains unchanged)

7/29/2019 Topic 2 (2012-13A)MP Final
http://slidepdf.com/reader/full/topic-2-2012-13amp-final 61/94
bROE-1
bROE RateGrowtheSustainabl
7/29/2019 Topic 2 (2012-13A)MP Final
http://slidepdf.com/reader/full/topic-2-2012-13amp-final 62/94
Profit margin – operating efficiency Total asset turnover – asset use efficiency
Financial leverage – choice of optimal debtratio
Dividend policy – choice of how much to payto shareholders versus reinvesting in thefirm
7/29/2019 Topic 2 (2012-13A)MP Final
http://slidepdf.com/reader/full/topic-2-2012-13amp-final 63/94
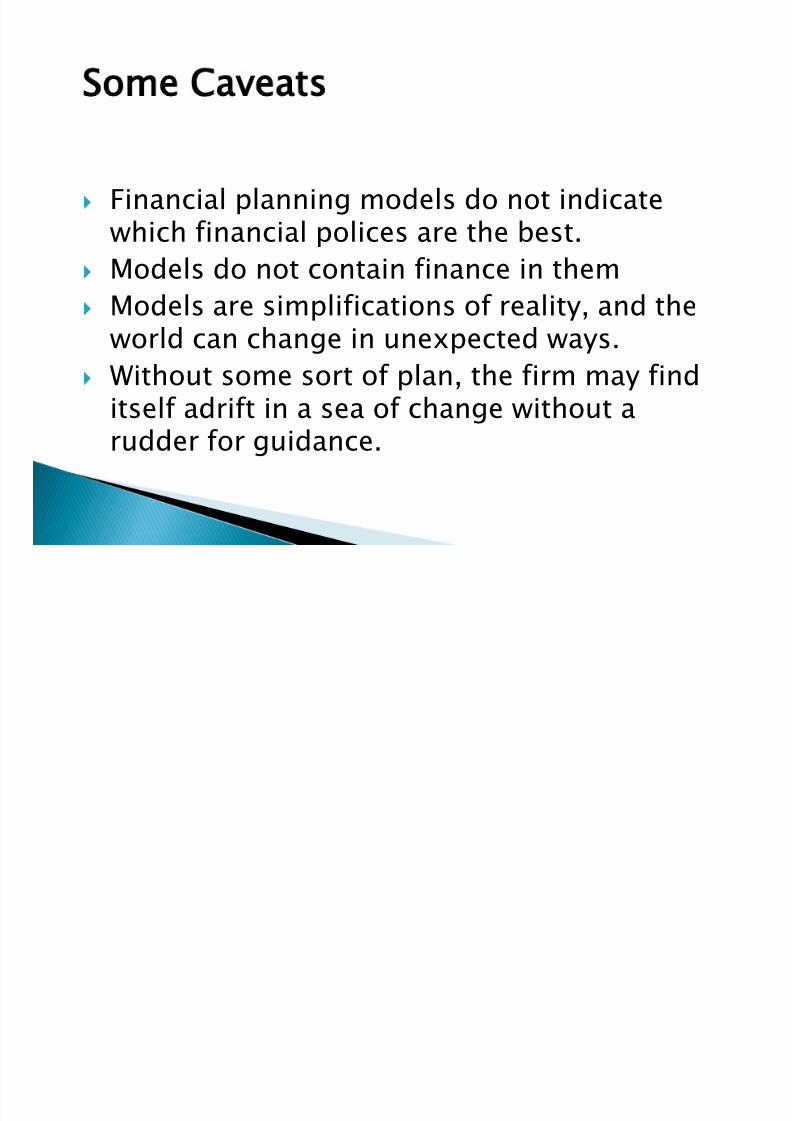
Some Caveats
Financial planning models do not indicatewhich financial polices are the best.
Models do not contain finance in them Models are simplifications of reality, and the
world can change in unexpected ways.
Without some sort of plan, the firm may finditself adrift in a sea of change without arudder for guidance.

7/29/2019 Topic 2 (2012-13A)MP Final
http://slidepdf.com/reader/full/topic-2-2012-13amp-final 64/94
Standardize financial statements forcomparison purposes
Compute and interpret important financialratios including the famous DuPont Identity

7/29/2019 Topic 2 (2012-13A)MP Final
http://slidepdf.com/reader/full/topic-2-2012-13amp-final 65/94
Financial Statements Analysis
Must develop a good working knowledge of financial statements
Making financial statements useful for users
is one finance role In order to make meaningful comparisons
of companies of different size financialprofessionals use two key techniques:
◦ Common-Size Statements◦ Financial Ratios
7/29/2019 Topic 2 (2012-13A)MP Final
http://slidepdf.com/reader/full/topic-2-2012-13amp-final 66/94
Common-Size Balance Sheets
Compute all accounts as a percent of total assets
Common-Size Income Statements
Compute all line items as a percent of sales
Standardized statements make it easier to comparefinancial information, particularly as the companygrows.
They are also useful for comparing companies of different sizes, particularly within the sameindustry.
Practice Hint: You may have round percentages in
Common-Size Statements

7/29/2019 Topic 2 (2012-13A)MP Final
http://slidepdf.com/reader/full/topic-2-2012-13amp-final 67/94
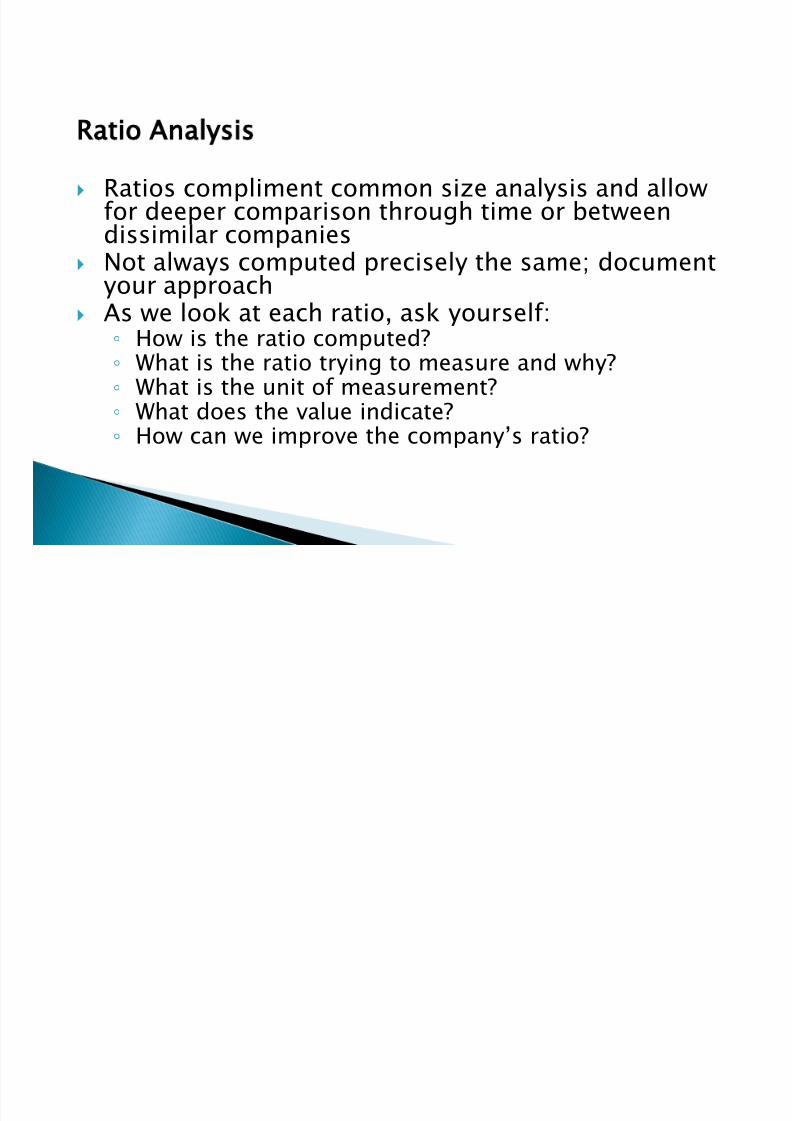
Ratio Analysis
Ratios compliment common size analysis and allowfor deeper comparison through time or betweendissimilar companies
Not always computed precisely the same; documentyour approach As we look at each ratio, ask yourself:
◦ How is the ratio computed?◦ What is the ratio trying to measure and why?◦
What is the unit of measurement?◦ What does the value indicate?◦ How can we improve the company’s ratio?
7/29/2019 Topic 2 (2012-13A)MP Final
http://slidepdf.com/reader/full/topic-2-2012-13amp-final 68/94
67
Liquidity RatiosCurrent Ratio
Quick Ratio
Turnover Ratios
Collection/Payment Period
Debt-to-Equity Ratio
Times Interest Earned Ratio
Profit Margin
Return on Assets
P/E Ratio
Market-to-Book Ratio
Activity Ratios
Debt Ratios
Profitability Ratios
Market Ratios
7/29/2019 Topic 2 (2012-13A)MP Final
http://slidepdf.com/reader/full/topic-2-2012-13amp-final 69/94
Short-term solvency or liquidity ratios Asset management or turnover ratios
Long-term solvency or financial leverageratios
Profitability ratios
Market value ratios
Following Examples all Based on Tables 3.1 & 3.4

7/29/2019 Topic 2 (2012-13A)MP Final
http://slidepdf.com/reader/full/topic-2-2012-13amp-final 70/94
69
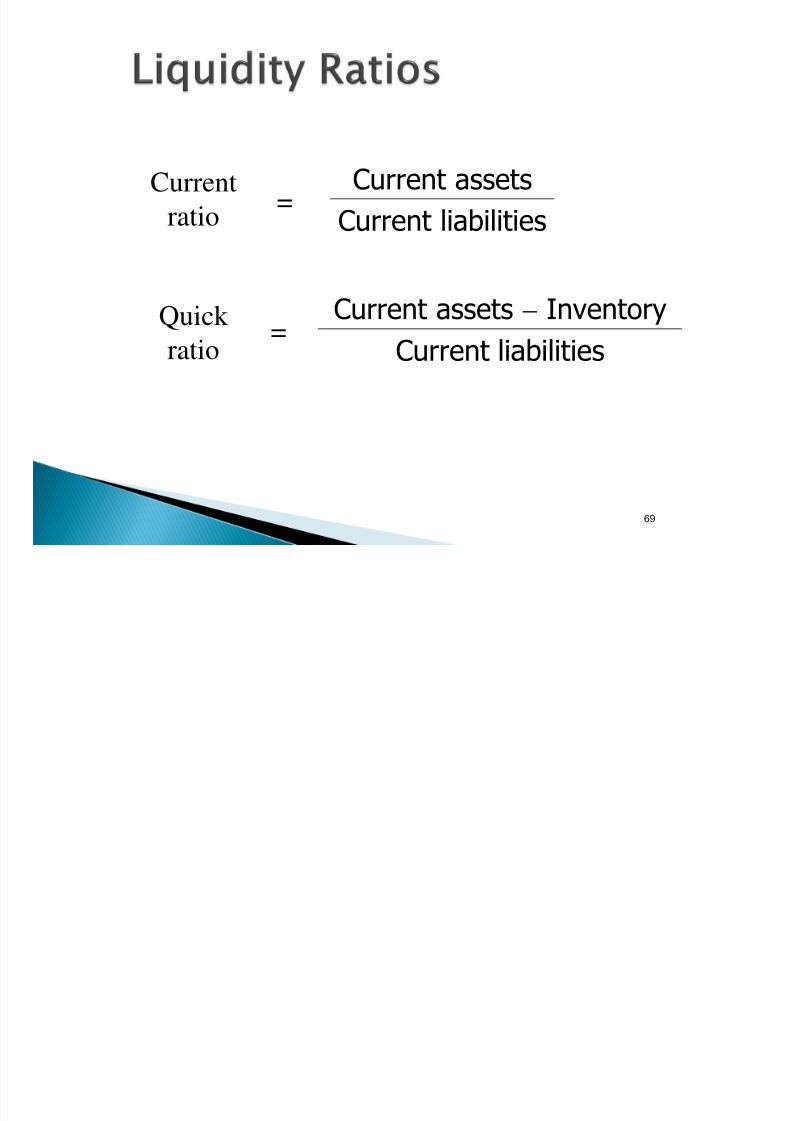
Current
ratio=
Current assets
Current liabilities
Quick
ratio=
Current assets Inventory
Current liabilities

7/29/2019 Topic 2 (2012-13A)MP Final
http://slidepdf.com/reader/full/topic-2-2012-13amp-final 71/94
70
Inventory
turnover=
Cost of goods sold
Inventory
Averagecollection
period=
Accounts receivable
Average daily sales
Average
payment
period=
Accounts payable
Average daily purchases
7/29/2019 Topic 2 (2012-13A)MP Final
http://slidepdf.com/reader/full/topic-2-2012-13amp-final 72/94
71
Fixed asset
turnover=
Sales
Net fixed assets
Total asset
turnover=
Sales
Total assets

7/29/2019 Topic 2 (2012-13A)MP Final
http://slidepdf.com/reader/full/topic-2-2012-13amp-final 73/94

7/29/2019 Topic 2 (2012-13A)MP Final
http://slidepdf.com/reader/full/topic-2-2012-13amp-final 74/94
73
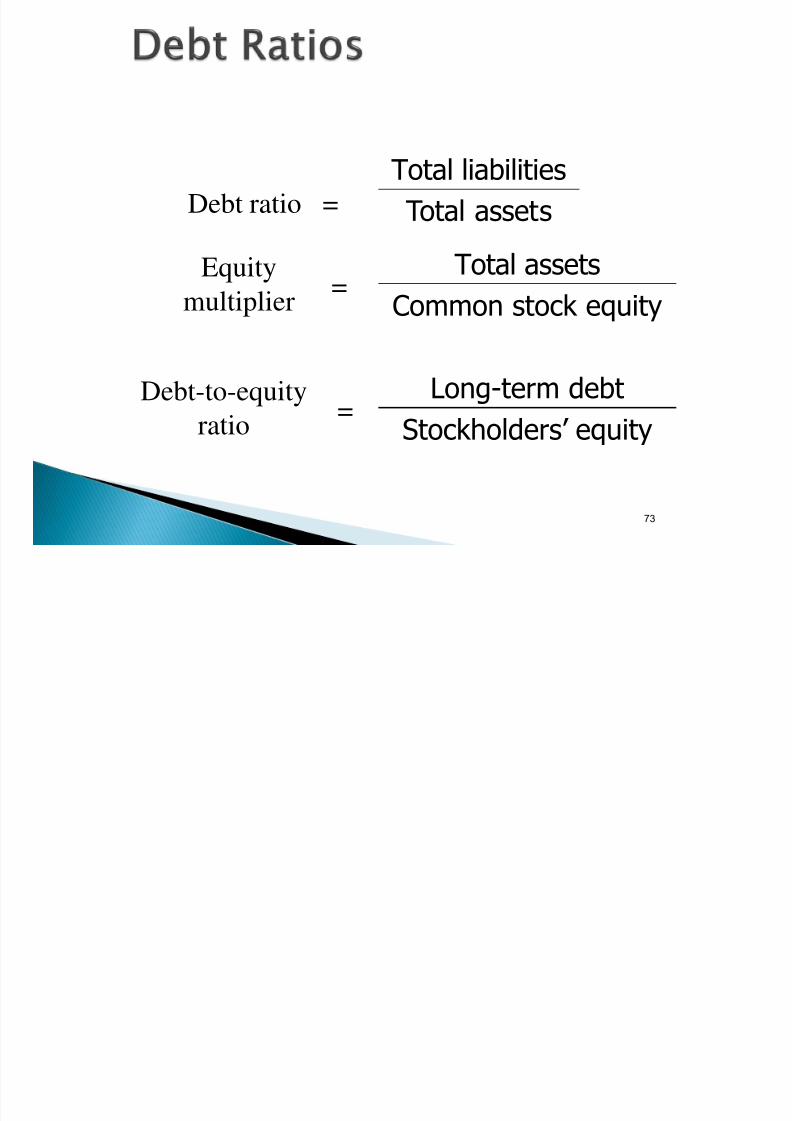
Debt ratio =
Total liabilities
Total assets
Equitymultiplier
= Total assetsCommon stock equity
Debt-to-equityratio
= Long-term debtStockholders’ equity

7/29/2019 Topic 2 (2012-13A)MP Final
http://slidepdf.com/reader/full/topic-2-2012-13amp-final 75/94
74
Times
interest
earned
=EBIT
Interest expense

7/29/2019 Topic 2 (2012-13A)MP Final
http://slidepdf.com/reader/full/topic-2-2012-13amp-final 76/94
75
Gross profit
margin
= Gross profit
Sales
Operatingprofit
margin=
Operating profit
Sales
Net profit
margin=
Earnings available forcommon shareholders
Sales
7/29/2019 Topic 2 (2012-13A)MP Final
http://slidepdf.com/reader/full/topic-2-2012-13amp-final 77/94
76
Earnings per
share (EPS) =Earnings available for common stockholders
Number of common shares outstanding
Return on totalassets (ROA) =
Earnings available for common stockholders
Total assets
Return oncommon equity
(ROE)=
Earnings available for common stockholders
Common stock equity
7/29/2019 Topic 2 (2012-13A)MP Final
http://slidepdf.com/reader/full/topic-2-2012-13amp-final 78/94
Current Ratio = CA / CL Quick Ratio = (CA – Inventory) / CL
Cash Ratio = Cash / CL
7/29/2019 Topic 2 (2012-13A)MP Final
http://slidepdf.com/reader/full/topic-2-2012-13amp-final 79/94
Total Debt Ratio = (TA – TE) / TA Debt/Equity = TD / TE
Equity Multiplier = TA / TE = 1 + D/E
7/29/2019 Topic 2 (2012-13A)MP Final
http://slidepdf.com/reader/full/topic-2-2012-13amp-final 80/94
Times Interest Earned = EBIT / Interest
Cash Coverage = (EBIT + Depreciation +Amortization) / Interest

7/29/2019 Topic 2 (2012-13A)MP Final
http://slidepdf.com/reader/full/topic-2-2012-13amp-final 81/94
Inventory Turnover = Cost of Goods Sold /Inventory
Days’ Sales in Inventory = 365 / InventoryTurnover
7/29/2019 Topic 2 (2012-13A)MP Final
http://slidepdf.com/reader/full/topic-2-2012-13amp-final 82/94
Receivables Turnover = Sales / AccountsReceivable
Days’ Sales in Receivables = 365 /Receivables Turnover

7/29/2019 Topic 2 (2012-13A)MP Final
http://slidepdf.com/reader/full/topic-2-2012-13amp-final 83/94
Total Asset Turnover = Sales / Total Assets

7/29/2019 Topic 2 (2012-13A)MP Final
http://slidepdf.com/reader/full/topic-2-2012-13amp-final 84/94
Profit Margin = Net Income / Sales Return on Assets (ROA) = Net Income /
Total Assets
Return on Equity (ROE) = Net Income / TotalEquity
EBITDA Margin = EBITDA / Sales
7/29/2019 Topic 2 (2012-13A)MP Final
http://slidepdf.com/reader/full/topic-2-2012-13amp-final 85/94
Market Capitalization = $Market value per share xno. of shares = $million
PE Ratio = Price per share / Earnings per share
Market-to-book ratio = market value per share /
book value per share Enterprise Value (EV) = Market capitalization +
Market value of interest bearing debt – cash
EV Multiple = EV / EBITDA

7/29/2019 Topic 2 (2012-13A)MP Final
http://slidepdf.com/reader/full/topic-2-2012-13amp-final 86/94
Ratios are not very helpful by themselves: theyneed to be compared to something
Time-Trend Analysis
◦ Used to see how the firm’s performance is
changing through time Peer Group Analysis
◦ Compare to similar companies or withinindustries
◦ Go to www.reuters.com/finance/stocks Use the ratios link to get comparative ratios for many
companies

7/29/2019 Topic 2 (2012-13A)MP Final
http://slidepdf.com/reader/full/topic-2-2012-13amp-final 87/94
The DuPont Identity
Popularized by the DuPont Corporation A more sophisticated method of evaluating
return
Illustrates the interaction between profit,assets and leverage
Holds that ROE is actually a function of 3measures:◦
Operating Efficiency (Profit Margin)◦ Asset Use Efficiency (Total Asset Turnover)
◦ Financial Leverage (Equity Multiplier)
7/29/2019 Topic 2 (2012-13A)MP Final
http://slidepdf.com/reader/full/topic-2-2012-13amp-final 88/94
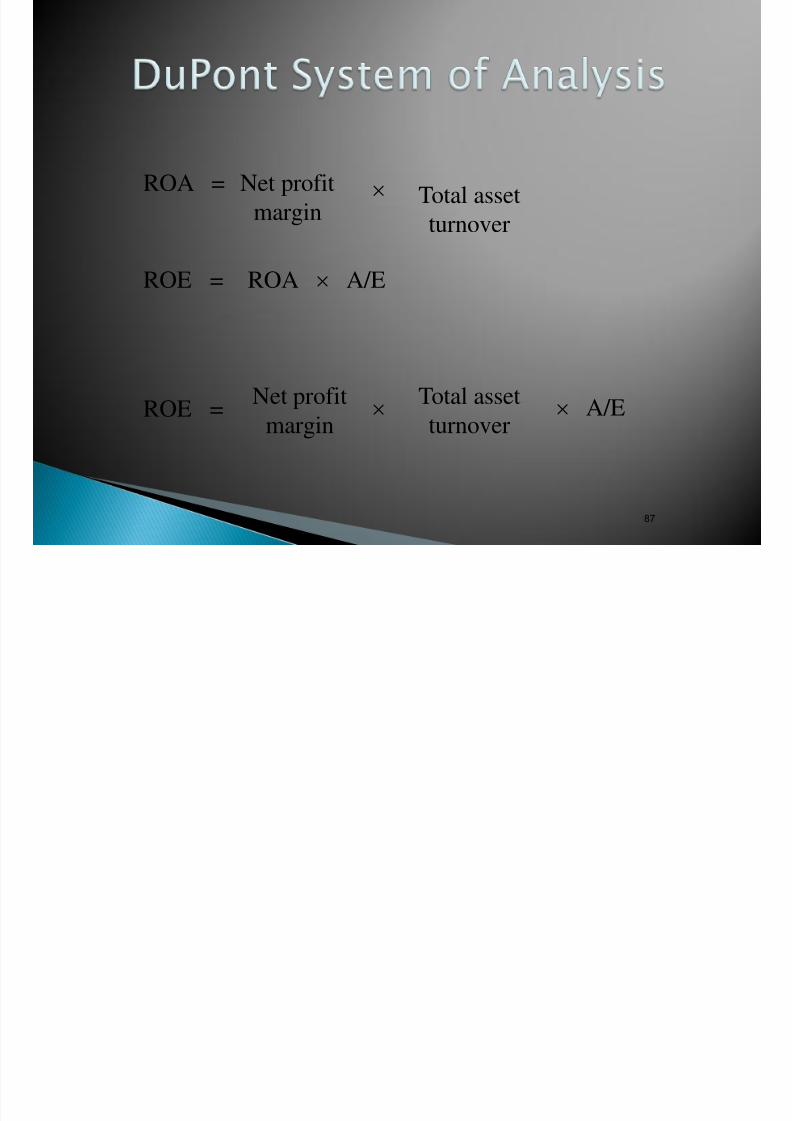
87
ROA = Net profit
margin Total asset
turnover
ROE = ROA A/E
ROE = Net profitmargin
Total assetturnover
A/E
7/29/2019 Topic 2 (2012-13A)MP Final
http://slidepdf.com/reader/full/topic-2-2012-13amp-final 89/94
ROE = NI / TE Multiply by 1 and then rearrange:
◦ ROE = (NI / TE) (TA / TA)
◦ ROE = (NI / TA) (TA / TE) = ROA * EM
Multiply by 1 again and then rearrange:◦ ROE = (NI / TA) (TA / TE) (Sales / Sales)
◦ ROE = (NI / Sales) (Sales / TA) (TA / TE)
◦ ROE = PM * TAT * EM
7/29/2019 Topic 2 (2012-13A)MP Final
http://slidepdf.com/reader/full/topic-2-2012-13amp-final 90/94
ROE = PM * TAT * EM◦ Profit margin is a measure of the firm’s operating
efficiency – how well it controls costs.
◦ Total asset turnover is a measure of the firm’sasset use efficiency – how well it manages itsassets.
◦ Equity multiplier is a measure of the firm’sfinancial leverage.

7/29/2019 Topic 2 (2012-13A)MP Final
http://slidepdf.com/reader/full/topic-2-2012-13amp-final 91/94

7/29/2019 Topic 2 (2012-13A)MP Final
http://slidepdf.com/reader/full/topic-2-2012-13amp-final 92/94
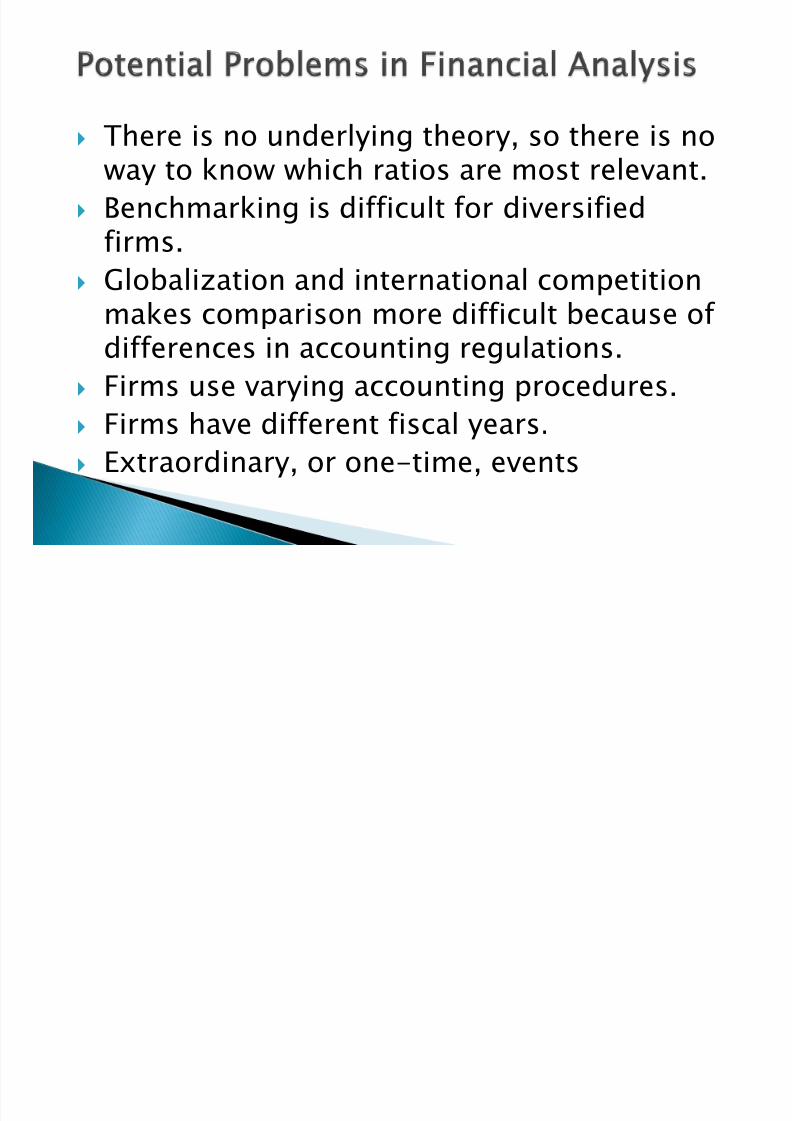
There is no underlying theory, so there is noway to know which ratios are most relevant.
Benchmarking is difficult for diversifiedfirms.
Globalization and international competitionmakes comparison more difficult because of differences in accounting regulations.
Firms use varying accounting procedures. Firms have different fiscal years.
Extraordinary, or one-time, events

7/29/2019 Topic 2 (2012-13A)MP Final
http://slidepdf.com/reader/full/topic-2-2012-13amp-final 93/94
How do you standardize balance sheetsand income statements?
Why is standardization useful? What are the major categories of financial
ratios? How do you compute the ratios within
each category? What are some of the problems
associated with financial statementanalysis?

7/29/2019 Topic 2 (2012-13A)MP Final
http://slidepdf.com/reader/full/topic-2-2012-13amp-final 94/94
What is the purpose of financial planning? What are the major decision areas
involved in developing a plan? What is the percentage of sales approach? What is the internal growth rate? What is the sustainable growth rate?
What are the major determinants of growth?