topographic maps september, 2011. map a model of earth’s surface. best model is a globe (no...
TRANSCRIPT

Topographic Maps Topographic Maps
September, 2011September, 2011

MAP
• A model of Earth’s surface.
• Best model is a globe (no distortion).
• Flat maps are made but they usually contain some distortion (like flattening an orange peel).
• The smaller the area drawn (or of curvature) the less the distortion.

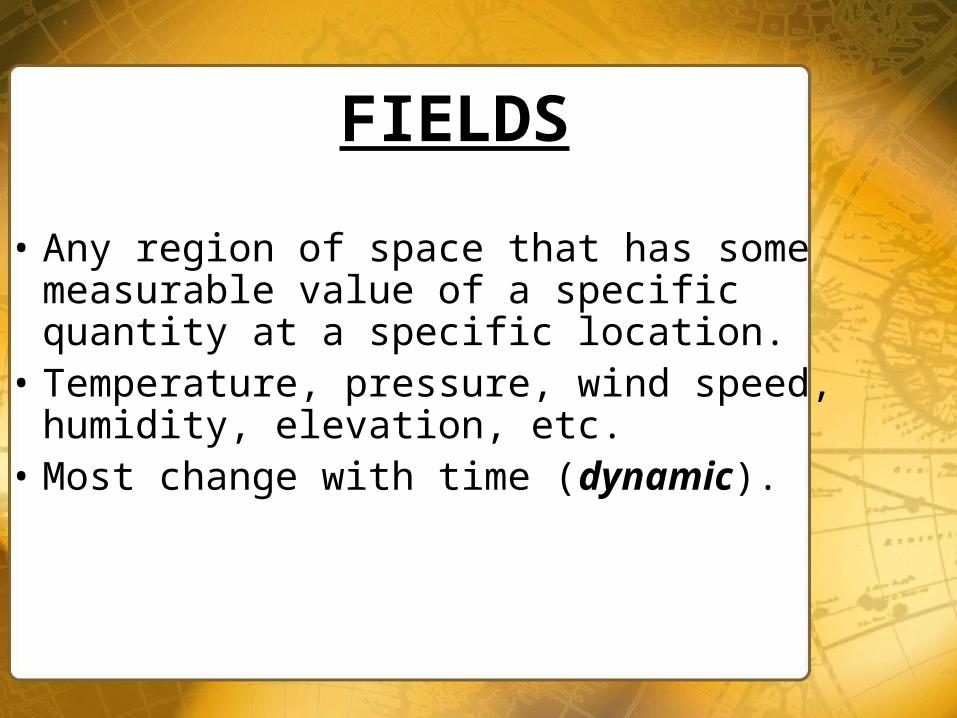
FIELDS
• Any region of space that has some measurable value of a specific quantity at a specific location.
• Temperature, pressure, wind speed, humidity, elevation, etc.
• Most change with time (dynamic).

Representation of Fields
• Types include . . .
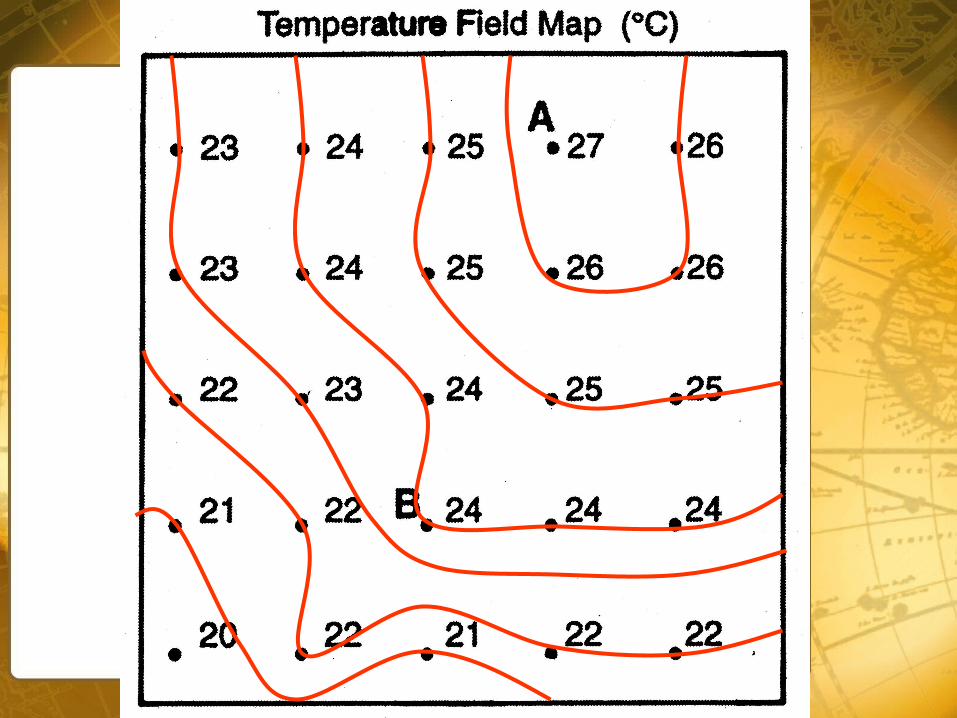
• Isotherms – connect equal temperatures.
• Isobars – connect equal pressures.
• Contour Lines – connect equal elevations.
ISOLINE – a line that connects equal values in a field.


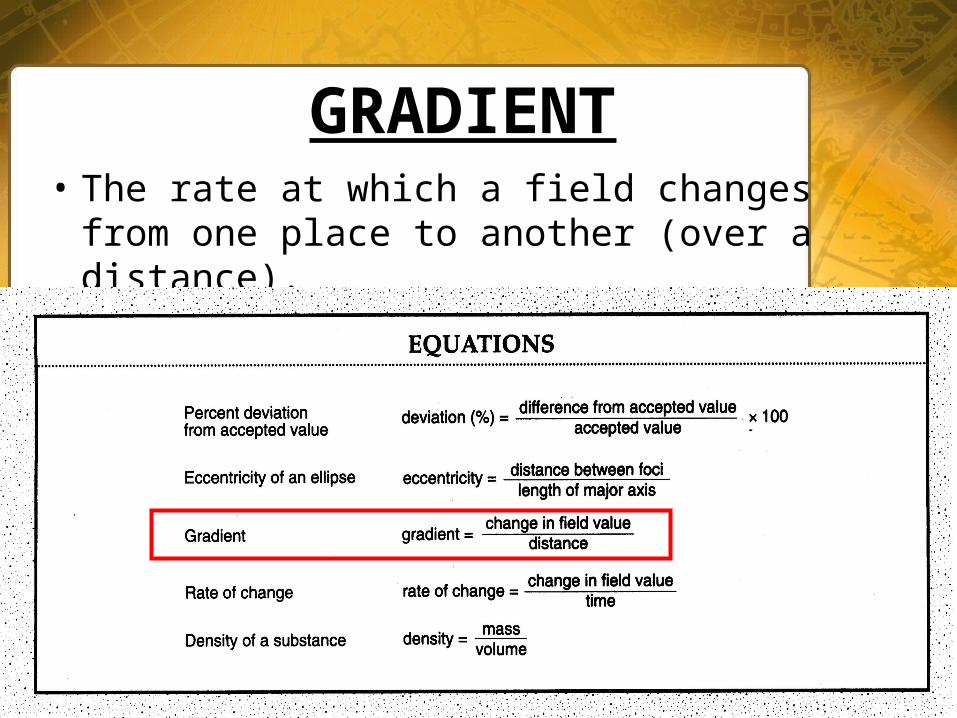
GRADIENT• The rate at which a field changes from one
place to another (over a distance).

GRADIENT
• The closer the isolines, the steeper or greater the gradient.
• The further apart the isolines, the gentler or lesser the gradient.
10 miles 2 miles
Gradient = 10°F/10 miles = Gradient = 10°F/2 miles =1°F/mile 5°F/mile

TOPOGRAPHIC MAPS
• A two-dimensional model of Earth’s surface that shows elevation at various locations.
• Also called Contour Maps.

Rules For Reading Topographic Maps
1. Topographic maps have lines on the surface connecting points of equal elevation (contour lines).

Rules For Reading Topographic Maps
2. The difference in elevation between any two adjacent contour lines in the contour interval.
CONTOURINTERVAL:
10,10010,400
10,300
10,200
10,60010,700 100 meters

22°C24°C
26°C
28°C
18°C
32°C

Rules For Reading Topographic Maps
3. Hill tops are indicated by closed loops.

What is the highest contour line? _________________What is the highest elevation of the hill? ____________________________________________
10,700
Must be above 10,700 but below 10,800

Rules For Reading Topographic Maps
4. A bench mark is a location whose exact elevation is known and is noted on a brass aluminum plate.

Rules For Reading Topographic Maps
5. Topographic maps are usually oriented so that North is at the top.
6. Many maps have map scales at the bottom to show linear distance.

Rules For Reading Topographic Maps
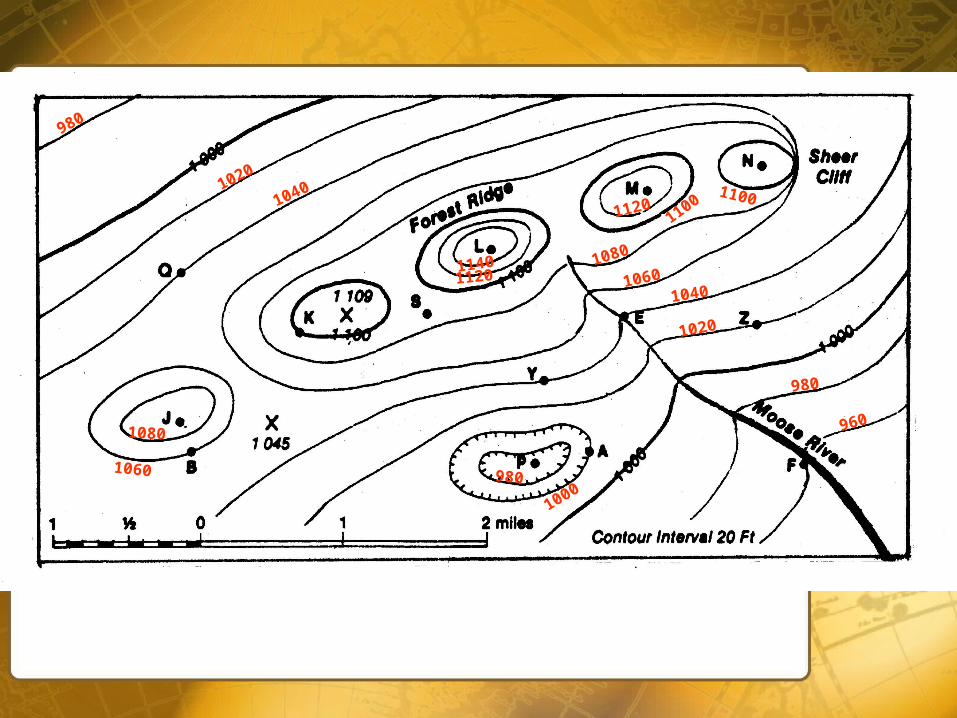
7. Depressions are usually indicated by closed loops with hachured lines inside.
• The first line of a depression contour has the same value as the contour line just crossed before the depression was come upon.

Rules For Reading Topographic Maps
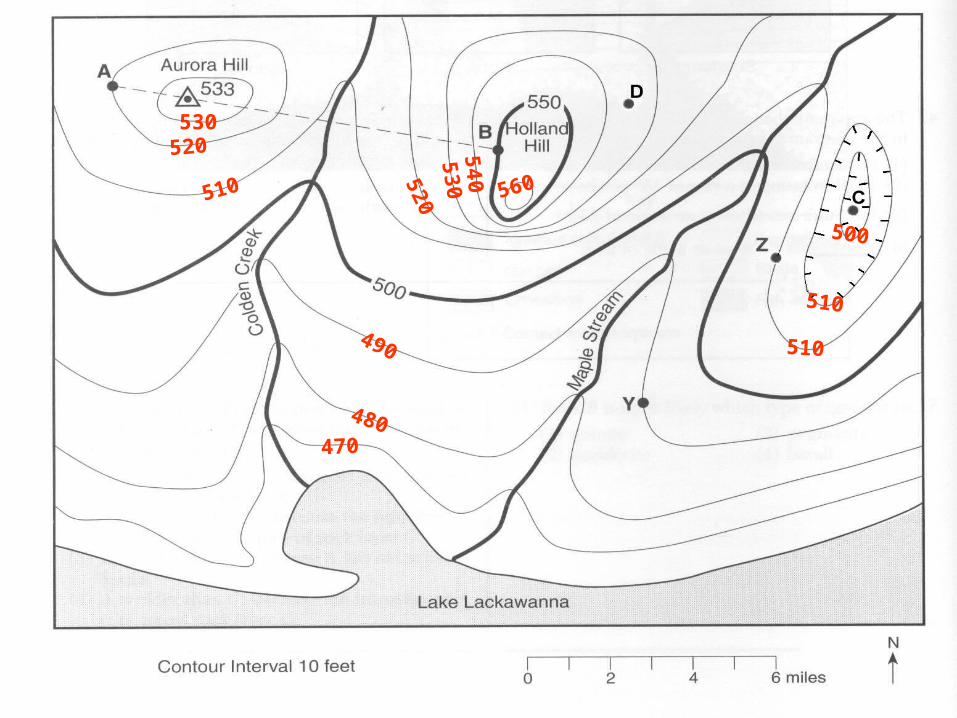
8. Contour lines bend to form a “V” in a valley with the point of the “V” pointing uphill. A stream always flows out of the “V” if it crosses a contour line.
Cold Creek

Rules For Reading Topographic Maps
9. The spacing of contour lines can show gradient. The closer the contour lines, the steeper the gradient. The further apart the contour lines, the gentler the gradient.
B to C = Steep Gradient
A to B = Lesser Gradient
C to D = Least Gradient

GRADIENT =
28°F – 22°F3 meters
= 2°F/meter
22°F
28°F
120
140
16018
0
80 60 40
20
0
220240260
280
280
300
320
320
340
360380
180200220 120
10080

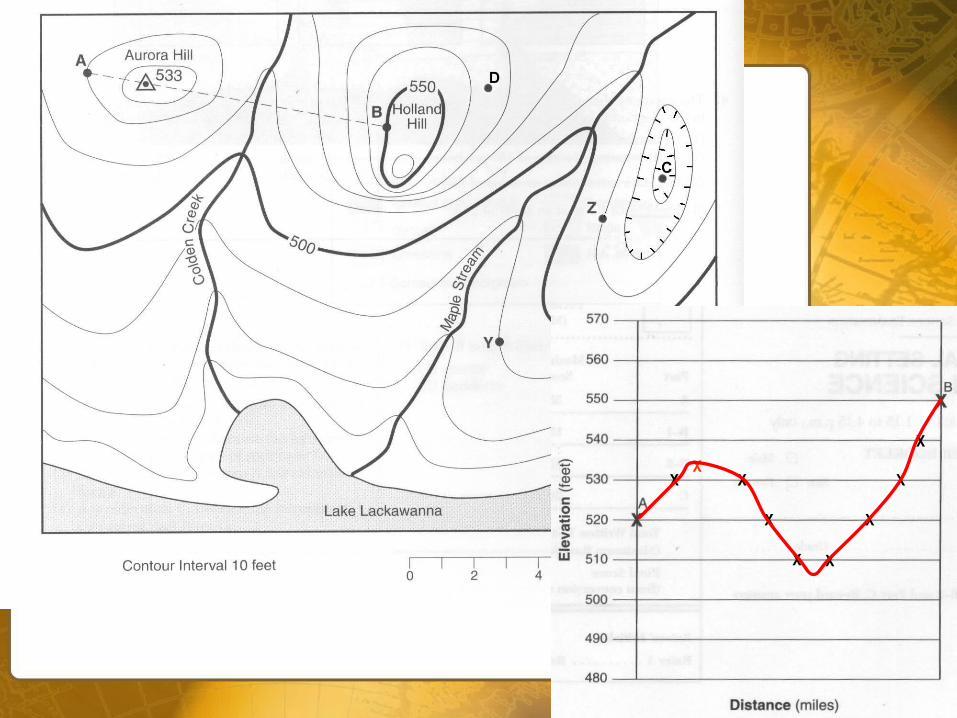
PROFILES• A side view of a section of a contour map showing
the slopes in the region.
3900

980
960
1000980
1020
1040
10401020
980
1060
1060
1080
1080
11001100
1120
11201140


0
130

530
510
520
510
520530
540
560
490
480470
510
500
XX
X
X
X X
X
X
X

530
510
520
510
520530
540
560
490
480470
510
500


X
X
X X
XX
X
X
X
X
650640
630
620
610600
590

620
630