topological vulnerability analysis - volgenau...
TRANSCRIPT
Topological Vulnerability Analysis
Sushil Jajodia and Steven Noel
Traditionally, network administrators rely on labor-intensive processes for trackingnetwork configurations and vulnerabilities. This requires a great deal of expertise,and is error prone because of the complexity of networks and associated securitydata. The interdependencies of network vulnerabilities make traditional point-wisevulnerability analysis inadequate. We describe a Topological Vulnerability Analysis(TVA) approach that analyzes vulnerability dependencies and shows all possible at-tack paths into a network. From models of the network vulnerabilities and potentialattacker exploits, we compute attack graphs that convey the impact of individual andcombined vulnerabilities on overall security. TVA finds potential paths of vulnera-bility through a network, showing exactly how attackers may penetrate a network.From this, we identify key vulnerabilities and provide strategies for protection ofcritical network assets. TVA provides predictive context for network hardening, in-trusion detection deployment and alarm correlation, and optimal attack response.Further, it employs efficient algorithms that scale well to larger networks.
1 Introduction
By their very nature, security concerns on networks are highly interdependent. Eachmachines susceptibility to attack depends on the vulnerabilities of the other ma-chines in the network. Attackers can combine vulnerabilities in unexpected ways,allowing them to incrementally penetrate a network and compromise critical sys-tems. To protect our critical infrastructure networks, we must understand not onlyour individual system vulnerabilities, but also their interdependencies.
While we cannot predict the origin and timing of attacks, we can reduce theirimpact by knowing the possible attack paths through our networks. We need totransform raw security data into roadmaps that let us proactively prepare for attacks,
Center for Secure Information Systems, George Mason University, Fairfax, VA 22030-4444, USA,e-mail: {jajodia, snoel}@gmu.edu
1

2 Jajodia and Noel
manage vulnerability risks, and have real-time situational awareness. We cannot relyon manual processes and mental models. We need automated tools to analyze andvisualize vulnerability dependencies and attack paths, so we can understand ouroverall security posture, providing context over the full security life cycle.
Our approach to such full-context security is called Topological VulnerabilityAnalysis (TVA) [1][2]. TVA monitors the state of network assets, maintains modelsof network vulnerabilities and residual risk, and combines these to produce modelsthat convey the impact of individual and combined vulnerabilities on overall securityposture. The central product of this tool is an attack graph showing all possible waysan attacker can penetrate the network.
Our TVA approach provides a unique new capability, transforming raw securitydata into a roadmap that lets one proactively prepare for attacks, manage vulnerabil-ity risks, and have real-time situational awareness. It supports both offensive (e.g.,penetration testing) and defensive (e.g., network hardening) applications. The map-ping of attack paths through a network via TVA provides a concrete understandingof how individual and combined vulnerabilities impact overall network security. Forexample, we can
• Compare possible expenditures of resources to determine which will have thegreatest impact on overall security
• Determine how much a new vulnerability will impact overall security• Determine whether risk-mitigating efforts have a significant impact on overall
security• Analyze how changes to individual machines may increase overall risk to the
enterprise
We have implemented our approach as a security tool that transforms raw secu-rity data into a model of all possible network attack paths. In developing this tool,we have met key technical challenges, including the design of appropriate models,efficient model population, effective visualizations and decision support tools, andthe development of scalable mathematical representations and algorithms. The re-sult is a working software tool that offers truly unique capabilities.
In the design of computers and networks, security is often not given adequate pri-ority. This is compounded by the fact that each machines exposure to attack dependson the vulnerabilities of the other machines in the network. Attackers can combinevulnerabilities in unexpected ways, allowing them to incrementally penetrate a net-work and compromise critical systems.
To protect critical networks, we must understand not only individual system vul-nerabilities, but also their interdependencies. TVA places vulnerabilities and theirprotective measures within the context of overall network security by modeling theirinterdependencies via attack graphs. The analysis of attack graphs provides alterna-tive sets of protective measures that guarantee safety of critical systems. Throughthis unique new capability, administrators are able to determine the best sets of pro-tective measures that should be applied in their environment.
Still, we must understand that not all attacks can be averted in advance, and theremust usually remain some residual vulnerability even after reasonable protective

Topological Vulnerability Analysis 3
measures have been applied. We then rely on the detect phase to identify actual at-tack instances. But the detection process needs to be tied to residual vulnerabilities,especially ones that lie on paths to critical network resources as discovered by TVA.
Once attacks are detected, comprehensive capabilities are needed to react tothem. TVA can reduce the impact of attacks by providing knowledge of the pos-sible vulnerability paths through the network. TVA attack graphs can be used tocorrelate and aggregate network attack events, across platforms as well as acrossthe network. These attack graphs also provide the necessary context for optimalresponse to attacks.
The next section shows the architecture of our TVA tool. Section 3 illustratesthe TVA approach through a simple example. Section 4 describes the process forbuilding models of the security environment for TVA, for generating multi-step at-tack graphs. Section 5 explains the visualization and analysis of TVA attack graphs.Section 6 examines scalability of TVA. Section 7 reviews related work, and Section8 summarizes our approach.
2 System Architecture
Because of vulnerability interdependencies across networks, a topological attackgraph approach is needed for defense against multi-step attacks. The traditional ap-proach that treats network data and events in isolation without the context providedby attack graphs is clearly insufficient. TVA combines vulnerabilities in ways thatreal attackers might do, discovering all attack paths through a network.
Figure 1 shows the architecture of our software tool for TVA attack graph anal-ysis. Network Capture builds a model of the network, in terms of relevant secu-rity attributes. Vulnerability Database represents a comprehensive repository of re-ported vulnerabilities, with each vulnerability record listing the affected software(and hardware).
The Exploit Specifications encode how each vulnerability may be exploited (pre-conditions) and the result of its exploitation (postconditions). Network Capture rep-resents data collection for a network to be defended, in terms of corresponding el-ements in Vulnerability Reporting and Exploit Specifications. Together, all theseinputs are used to build an Environment Model for multi-step attack graph simula-tion.
In particular, the Graph Engine uses the Environment Model to simulate multi-step attacks through the network, for a given user-defined Attack Scenario. This en-gine analyzes vulnerability dependencies, matching exploit preconditions and post-conditions, thus generating all possible paths through the network for a given attackscenario. The scenario may define particular starting and/or ending points for theattack, so that the graph is constrained to lie between them, or may be completelyunconstrained (all possible starting and ending points).
The TVA tool provides sophisticated capabilities for interactive Visual Analysisof attack graphs [3]. It also computes Optimal Counter Measures, e.g., minimum

4 Jajodia and Noel
Network Capture
VisualAnalysis
OptimalCounter
Measures
Vulnerability Database
NVD
ExploitConditions
AttackScenario
GraphEngine
EnvironmentModel
Vulnerability Scanning
FoundScan
Asset Inventory
Firewall Rules
Fig. 1 Topological Vulnerability Analysis (TVA). Data from network scans and known vulnera-bilities are combined into a model of the network security environment. Multi-step attack graphfor this environment provides context for overall network security.
number of network changes to thwart the attack scenario [4]. TVA attack graphs canalso support proactive planning for optimal responses to attacks, based on knownpaths of residual vulnerability through the network. For example, attack graphs canguide the placement of intrusion detection sensors to cover all attack paths, whileminimizing sensors redundancy [5].
TVA attack graphs can filter false intrusion alarms, based on known paths ofresidual vulnerability. They also provide the context for correlating isolated alarmsas part of a larger multi-step attack penetration [6]. The attack graph shows the nextpossible vulnerabilities that could be exploited by an attacker. This in turn supportsoptimal planning and response against attacks, while minimizing effects of falsealarms and attacker misdirection.
As shown in Figure 1, our TVA tool integrates with vulnerability scanners Nessus[7], Retina [8], and FoundScan [9] for populating its network model. TVA processesdata from the Sidewinder firewall [10] to capture network connectivity to vulnerablehost services. TVA also integrates with host-based asset inventory technology, suchas Centennial Discovery [11] and Symantec Altiris [12].
TVA matches the network model against a database of reported vulnerabilities.There are a number of such vulnerability databases, maintained by the govern-ment, commercial companies, and the security community. Examples include NISTs

Topological Vulnerability Analysis 5
National Vulnerability Database (NVD) [13], the Bugtraq security database [14],Symantec DeepSight [15], the Open Source Vulnerability Database (OSVDB) [16],and the Common Vulnerabilities and Exposure (CVE) referencing standard [17].We can thus leverage a storehouse of knowledge gathered by security researchersaround the world, rather than being limited to vulnerabilities detected by a singletool like Nessus.
3 Illustrative Example
In Figure 2, a network is separated from the Internet by a firewall. The network isdivided into 3 subnets, with one host in each subnet: a DMZ web server, an internalclient, and an internal server. We wish to generate an attack graph showing whetheran attacker can compromise the internal server from the Internet.
Fig. 2 Example network. Firewall is intended to protect network from Internet attackers.

6 Jajodia and Noel
The DMZ web server is running Microsoft Windows Server, with Internet Infor-mation Services (IIS), Apache/MySQL/PHP, and Tomcat servlets. The client is run-ning Microsoft Windows XP, client security software, an office productivity suite,and other utilities. The internal server is running Apache/ MySQL/PHP, the Syman-tec Discovery asset inventory server, and Altiris Inventory Solution with associatedsoftware (e.g., IIS, Microsoft SQL Server). The Altiris Agent is deployed on eachinternal machine to collect asset inventory data.
The firewall blocks direct access to the internal server and client subnets fromthe Internet. Thus, from the outside, network vulnerability scanners such as Nessusare unable to detect any vulnerabilities on the internal server and client. In fact,if the firewall has network address translation (NAT) enabled, Nessus cannot evendiscover the existence of machines on these 2 subnets.
From the outside of the firewall, the only machine exposed is the DMZ server. Inparticular, the firewall blocks all traffic except HTTP to the DMZ servers TCP port80. From behind the firewall, Nessus shows a variety of vulnerabilities on the DMZserver. But from the Internet, only the web server vulnerability is exposed. A Nessusscan from the DMZ to the internal subnets identifies any internal vulnerabilities per-mitted through the firewall. In our network, MySQL traffic is permitted between theDMZ web server and the internal server, and two exposed MySQL vulnerabilitiesallow an attacker to access the internal server (from the DMZ web server).
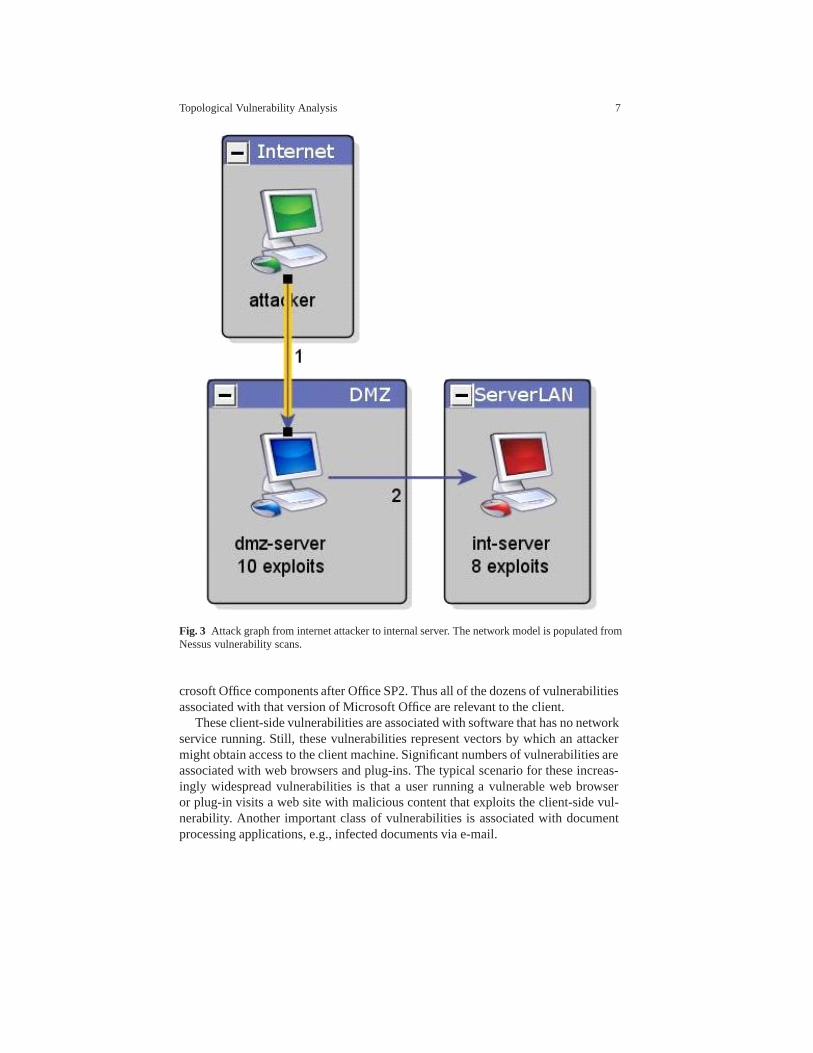
The question is whether an attacker can compromise the internal server from theInternet. Figure 3 shows the resulting attack graph for this network, using a TVAmodel populated by Nessus scans alone. This shows that an attacker starting on theInternet can first penetrate through the firewall and compromise the DMZ server,exploiting a vulnerability on its web server installation. Then, from the DMZ server,the attacker can access the internal server via exploitation of the two vulnerabilities.
A Nessus scan from the Internet would reveal no vulnerabilities on the internalserver or client, so that there is no direct attack from the Internet to the internalmachines. Because the firewall blocks traffic originating from the server subnet tothe client subnet, and blocks all traffic from the DMZ to the client subnet, thereis no attack path to the client at all. That is, a Nessus scan from the DMZ to theclient reveals no vulnerabilities. In this case, a Nessus scan of the client within itsown subnet (no intervening firewalls) detects no vulnerabilities (or even open ports),because of the clients personal firewall (part of the security suite).
We then augment the Nessus-based model, using software inventory data fromAltiris. In particular, we compare products and versions from Altiris against a vul-nerability database to determine the vulnerabilities associated with each application.For Microsoft products, this correlation process involves an extra step. We first de-termine how many vulnerabilities are associated with the Microsoft product and ver-sion installed, and then compare the Microsoft patches and hotfixes installed (col-lected by Altiris). This determines which Microsoft vulnerabilities are unpatched.
So, for example, while there are almost 200 vulnerabilities associated with Mi-crosoft Windows XP SP2, many of the older vulnerabilities are patched on the clientmachine. On the other hand, no Microsoft hotfixes are applied on the client for Mi-
Topological Vulnerability Analysis 7
Fig. 3 Attack graph from internet attacker to internal server. The network model is populated fromNessus vulnerability scans.
crosoft Office components after Office SP2. Thus all of the dozens of vulnerabilitiesassociated with that version of Microsoft Office are relevant to the client.
These client-side vulnerabilities are associated with software that has no networkservice running. Still, these vulnerabilities represent vectors by which an attackermight obtain access to the client machine. Significant numbers of vulnerabilities areassociated with web browsers and plug-ins. The typical scenario for these increas-ingly widespread vulnerabilities is that a user running a vulnerable web browseror plug-in visits a web site with malicious content that exploits the client-side vul-nerability. Another important class of vulnerabilities is associated with documentprocessing applications, e.g., infected documents via e-mail.

8 Jajodia and Noel
Figure 4 shows the attack graph augmented with Altiris data. This shows that itis actually possible to attack the client directly from the Internet, via 12 differentclient-side vulnerabilities. Strictly speaking, the client needs to make an outboundconnection (e.g., web site visit) to a compromised server. But the firewall allowsthis, so it is correct to model the server as the attacker and the client as the victim.The attacker on the client can then compromise the internal server, through a firewallhole allowing access from client to server.
Fig. 4 Attack graph augmented with Altiris data. The host-based asset inventory uncovers addi-tional client-side vulnerabilities.
This example illustrates the importance of accounting for such client-side vul-nerabilities. Services on an internal server would typically be exposed to internalclients, and may be vulnerable. In this case, our augmented model has uncoveredattack paths that would have otherwise been undetected by a vulnerability scanner.
Our attack graphs show how hosts on a network can be exploited through mul-tiple steps, even when the attacker cannot access them directly. It is not directlypossible to compromise the internal server from the outside because of the pol-
Topological Vulnerability Analysis 9
icy enforced by the firewall. But TVA shows that the attack goal can be reachedindirectly, through two different attack paths. While it may be possible for an ex-perienced analyst to find such paths manually for a small network, for enterprisenetworks an automated tool is needed.
4 Network Attack Modeling
In TVA, the environment model includes aspects of the network configuration rele-vant to attack penetration, as well as a set of potential attacker exploits that matchattributes of the configuration. The TVA approach can apply to many different typesof attack models (even non-cyber models) as long as a common schema is employedacross the model.
Typically, we model a network as machines and collections of machines intoprotection domains. Protection domains capture the idea that the set of machines ina domain have (implicitly) unrestricted access to one anothers vulnerable services.A machine may include attributes for modeling network attack penetration, such asoperating system, application programs, and connections to vulnerable services.
A connection describes how a machine connects to potentially vulnerable ser-vices across the network, to ports on other machines or to its own ports. This mirrorsthe Transmission Control Protocol/Internet Protocol (TCP/IP) reference model, inwhich a layered connectivity structure represents the various network architecturesand protocols [18].
To keep pace with emerging threats, we continually monitor sources of reportedvulnerabilities, and add those to our database of modeled TVA exploits. We modelan attacker exploit in terms of preconditions and postconditions, for generic attackerand victim machines, which are subsequently mapped to the target network.
The detection of a host vulnerability (e.g., via Nessus) represents a preconditionfor a corresponding TVA modeled exploit. In reality, the vulnerability exists be-cause of a particular combination of software components. A detected vulnerabilityis thus a convenient higher level abstraction, in comparison to the combination ofcomponents that causes it. There are usually many possible software componentsand configurations that can cause a particular vulnerability.
We can thus model vulnerable software components themselves in TVA. Inparticular, host-based asset management solutions like Centennial Discovery andSymantec Altiris collect specific information such as operating system, servicepacks, and installed software through on-host agents. Many exploits work only withspecific versions of operating systems and/or applications, and vulnerabilities canbe removed by applying the appropriate patches.
To keep TVA exploits continually updated as new vulnerabilities are reported,we may leverage the component-to-vulnerability mapping information provided bySymantec DeepSight. Also, while TVA incorporates exploits against known vulner-abilities into its analysis, it is a general modeling approach that can also accommo-date unknown vulnerabilities. Anything that can be described in terms of precondi-

10 Jajodia and Noel
tions and postconditions can be included in the model. Also, tools such as Nessusgenerate many alerts that are merely informational, i.e., irrelevant to network pene-tration. We carefully exclude these from our database of modeled exploits.
One important class of vulnerabilities detected by our approach is client applica-tions. Client-side vulnerabilities have a major impact on enterprise network securityposture, a trend that will no doubt continue. For example, web applications (an im-portant source of client-side vulnerabilities) represent about 60% of vulnerabilitiesdocumented in 2007 [19].
In our approach, the correctness of attack graphs depends on the quality of the in-put datasets. The network scanning tools must have a complete and current databaseof detected software and/or vulnerabilities. Standardization efforts such as SecurityContent Automation Protocol (SCAP) [20] help facilitate the management of map-ping data between asset inventory and vulnerabilities. Otherwise, each tool mayuse its own naming conventions. Within SCAP, the Common Platform Enumera-tion (CPE) [21] provides standard naming of operating systems and applications,and CVE provides mappings to CPE for vulnerable software. The OVAL Language[22] standardizes the vulnerability assessment process and results. Adoption of suchstandards among tool vendors will greatly facilitate the building of attack models forTVA.
The purpose of modeling network configuration in TVA is to support precondi-tions of modeled attacker exploits. Machines are explicitly included in the modelonly if they offer services over the network that can be exploited. The effects ofother network devices such as routers and firewalls is captured implicitly, in theway that connectivity is modeled at the various network layers, i.e., in the way thatthey provide/restrict connectivity to vulnerable services on other machines.
For remote (versus host-based) scanners such as Nessus, Retina, and FoundScan,we can capture the implicit effects of devices such as firewalls by scanning fromdifferent network vantage points, targeting hosts through the firewall. We can thencombine multiple scans from various network locations, building a complete mapof connectivity to vulnerable services throughout the network. Alternatively, we cananalyze firewall rules directly, adding the resulting vulnerable connections to themodel, eliminating the need for scanning through firewalls.
5 Analysis and Visualization
Based on a given attack scenario, the attack graph may be constrained by specificstarting and ending points. The scenario may also be less constrained, such as find-ing all possible attack starts leading to one or more goals, or finding all possiblepaths from particular starting points. For example, one may wish to know how aparticular critical system can be compromised from all possible starting points. Or,one may want to know all systems that could be compromised from a particularstarting point, or even from all possible starting points. Our TVA tool supports eachcombination of specified/unspecified attack start/goal.

Topological Vulnerability Analysis 11
In their raw form, attack graphs can be much too complex for easy understanding.Figure 5 is an example of such a raw attack graph, for a network of only 20 hostsin four subnets. Computational complexity for this graph is quadratic in the numberof hosts, and we compute it in a fraction of a second. Still, it is difficult to foran analyst to understand its complexity. To help manage this, we aggregate attackgraphs, providing better situational awareness at higher levels of abstraction. Wedefine multiple levels of abstraction by recursively aggregating elements from onelevel to the next, forming a hierarchy of abstraction levels.
Figure 6 illustrates our hierarchy of attack graph abstractions. From the bottom,the preconditions or postconditions for an exploit are aggregated into a conditionset. This provides the higher-level viewpoint that exploits depend on one another,without showing the particular conditions that cause the dependency.
Sets of conditions for a machine are aggregated into a machine abstraction, sothat one can consider a machine without knowing its particular conditions. Exploits,with their preconditions and postconditions, are aggregated if they involve the samepair of attacker/victim machines. This shows that there are exploits from one ma-chine to another, while hiding the details about them.
Fig. 5 Raw attack graph. This graph is computed quickly, but cannot be quickly understood.
An important high-level abstraction in TVA is the protection domain, which rep-resents a set of machines that have full access to one anothers vulnerabilities. Ingeneral, connectivity can be restricted across a network through a variety of mech-anisms, such as firewalls, trust relationships, etc. But within a protection domain,implicitly there are no connectivity limitations among machines. Thus all of a ma-

12 Jajodia and Noel
chines vulnerabilities are potentially exploitable from anywhere within the protec-tion domain.
In a raw non-aggregated form, the attack graph is fully connected within a pro-tection domain. Through this implicit full connectivity, we employ a much moreefficient representation. The machines in a domain are listed, along with exploitsagainst each of their vulnerabilities. Then implicitly, once an attacker takes controlof a machine within a protection domain, he can exploit all vulnerabilities on ma-chines within it. In this way, we avoid explicitly listing every n2 (fully-connected)exploit dependency within the protection domain. Thus, within each domain, com-plexity is linear in the number of hosts.
Same Exploit (Pre or Post)
Connected Subgraph
Exploit
ExploitSet
Machine
Machine-Exploit Set
Condition
ConditionSet
ProtectionDomain
ProtectionDomain Set
SameMachine
ConnectedSubgraph Machine/
ExploitClique
SameAttacker/VictimMachines
AmongMachine Set
AmongExploit Set
Higher-LevelAbstractions
Lower-LevelAbstractions
Fig. 6 Levels of attack graph aggregation. Lower-level details are aggregated into progressivelysummarized sets.
Figure 7 demonstrates the effectiveness of our graph aggregation approach. Thisis an attack graph for a network of six subnets, with 150 hosts. In its raw form, thisattack graph is actually much more complex than Figure 5. But through our graphaggregation, the flow of the attack paths is clear. Individual machines appear withinprotection domains, and are visible when a domain is expanded. Graph edges from

Topological Vulnerability Analysis 13
one machine to another represent the set of exploits from attacker to victim machine.Graph edges between domains are aggregated exploit sets between domain pairs.
Our TVA software tool includes a full-featured attack graph visualization inter-face. In this interface, a high-level view clearly displays attack relationships amongprotection domains, which can be opened individually or in groups for deeper viewsof attack properties and relationships. In this process, no graph information is lost;one has merely to expand a folder to acquire information at a lower level.
A complete listing of exploits and associated details for any selected compo-nent is available at all times. This supports in-depth analysis of exploit details,while overall topology and network relationships are kept simple and understand-able within the main graph view.
Fig. 7 Aggregated attack graph. This is much easier to understand overall attack flow.
Our TVA tool also emulates the hardening of machines and exploitable vulner-abilities to study the effects of remediation and what-if scenarios. Exploring theattack graph, the analyst is often faced with multiple options for remediation. Thisinvolves choosing a machine or set of machines to protect (harden), or identifyingspecific exploits to protect against.
We display the attack graph effects that occur when a specific machine or pro-tection domain is hardened or when a specific exploit is neutralized. Hardened el-ements are maintained in a log, e.g., for reporting. The TVA tool also generatesrecommendations automatically, i.e., first layer (from start), last layer (from goal),and minimum set that that separates start from goal.
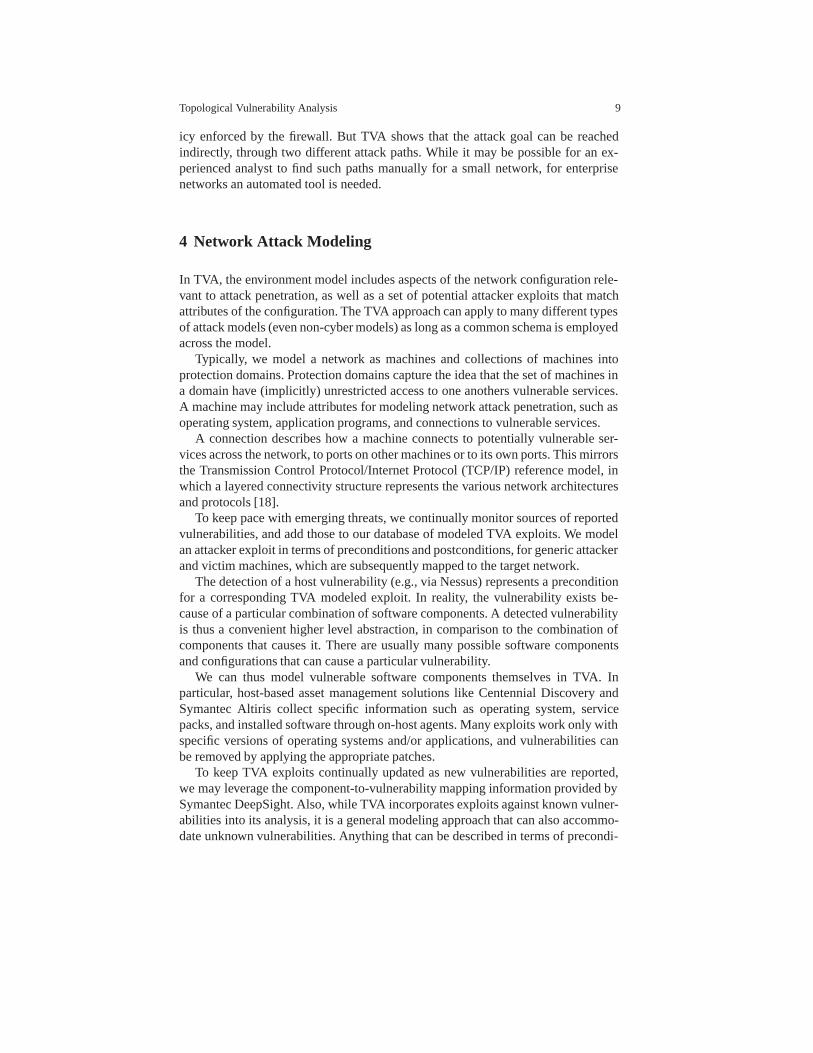
To aid user navigation, the TVA tool maintains a global overview of the entireattack graph at all times, which can be used to pan the main graph view. The toolalso has a graphical (tree) attack dictionary of all graph elements. The various graphviews are linked, so that selecting an element in one view cause it to be selected inall view. A variety of toolbars are available for commonly used tools. This includes
14 Jajodia and Noel
a suite of interactive layout tools, with manual repositioning as well as full-scalelayout algorithms, continuously available to restructure the display.
Fig. 8 Attack graph visualization. Supports graph navigation with high-level overviews and detaildrilldowns.
6 Scalability
For computing attack graphs for larger networks, we need scalable mathematicalrepresentations and algorithms. We assume the attackers control over the networkincreases monotonically over time. This corresponds to the conservative assump-tion that once an attacker gains control of a network resource, there is no need torelinquish it to further advance the attack.
Under this monotonicity, it is sufficient to represent the dependencies amongexploits, rather than explicitly enumerating every sequence of exploits [23]. Theresulting exploit-dependency attack graphs grow quadratically rather than exponen-tially [24]. In particular, worst-case complexity for n network hosts is O(n 2) Bygrouping hosts into protection domains, complexity is reduced to O(n) within eachdomain. In terms of the database of potential attacker exploits, complexity is O(e),for e exploits.
Figure 9 shows attack graph computation times for networks of various sizes. Ineach case, a subnet contains 200 hosts, and each host has 5 vulnerabilities. Each sub-net has incoming vulnerable connections from 2 other subnets, and symmetrically,

Topological Vulnerability Analysis 15
outgoing vulnerable connections to 2 other subnets. This is a ring topology, in whichthe number of network connections grows linearly with the number of subnets.
0
8
16
24
Number of Subnets
Com
pute
Tim
e (s
econ
ds)
40,000Hosts
Fig. 9 Computation time for attack graph generation. Network complexity grows linearly with thenumber of subnets. Attack graph generation time is proportional to the size of the network.
From one subnet to another, there are 500 connections to vulnerabilities in thevictim subnet. Thus there are 2 * 500=1,000 incoming and 2 * 500=1,000 outgoingvulnerable connections (a grand total of 2,000) for each subnet. Computation times(total run time in seconds) are based on increasing numbers of subnets, from 20subnets (4,000 hosts) to 200 subnets (40,000 hosts). Run times are for a quad-coreIntel Xeon CPU at 1.86 GHz, with 4 GB RAM.
In this experiment, overall network size (number of vulnerable connections)grows linearly with the number of subnets (and hosts). This clearly shows howgraph generation time depends proportionally on the size of the input network. Thisexcludes any time for generating the input model (network and exploits) itself, al-though this has the same worse-case complexity, and these can be pre-computed.
Graph visual layout performance is a separate issue, and is not included in theexecution times of Figure 9. For example, Figure 10 shows a layout of the 20-subnetcase (4,000 hosts) of Figure 9. Computing this layout only a few seconds, but com-puting layout for the 100-subnets case (20,000 hosts) takes 14 minutes. But in allcases, once the initial layout is computed, performance of user interaction (reposi-tioning, drilldown, etc.) is immediate.
Visual layout computation is needed for a cyber view of network attack graphs.Such layout induces spatial coordinates onto an abstract information graph. But insome situations, understanding the actual physical location of attacks may be im-portant. We can embed the attack graph in a geo-spatial visualization, as illustratedin Figure 11. When spatial coordinates are given, no additional graph layout com-putation is needed. In such cases, visualizing complex attack graphs is much fasterthan for abstract cyber views.

16 Jajodia and Noel
Fig. 10 Attack graph layout solution. For this 20-subnet case (4,000 hosts), graph visual layout iscomputed in only a few seconds.
Fig. 11 Geo-spatial attack graph visualization. When spatial coordinates are given, computationalrequirements are reduced.

Topological Vulnerability Analysis 17
7 Related Work
In early attack graph formalisms, algorithmic complexity is exponential [25][26][27][28] because paths are explicitly enumerated. Under reasonable assumptions attackgraph analysis can be formulated as monotonic logic, making it unnecessary to ex-plicitly enumerate states. This leads to polynomial rather than exponential complex-ity [29]. Our protection domain abstraction reduces complexity further, to linearwithin each domain [30]. Complexity can be further reduced based on host config-uration regularities [31].
Attack graph research has largely focused on scalability, with relatively littlework on aspects of model population. Notable exceptions include [18][32][33],although these are more theoretical frameworks than practical model population.Commercial capabilities for attack graph analysis remain limited, especially in thearea of visualization for large-scale graphs [34][35]. A review of attack graph re-search circa 2005 is given in [36].
8 Summary
TVA shows paths of vulnerability allowing attackers to penetrate through a network.It identifies critical vulnerabilities and provides strategies for protection of criticalnetwork assets. This allows us to harden networks before attacks occur, and handleintrusion detection more effectively, and respond appropriately to attacks.
TVA captures the network configuration, including software, their vulnerabili-ties, and connectivity to vulnerable services. It then matches the network configura-tion against a database of modeled attacker exploits for simulating multi-step attackpenetration.
During simulation, the attack graph can be constrained according to user-definedattack scenarios. From the resulting attack graphs, TVA computes recommendationsfor optimal network hardening. It also provides sophisticated visualization capabil-ities for interactive attack graph exploration and what-if analysis. TVA employsalgorithms with worst-case quadratic complexity in the number of network hosts.
Further, TVA attack graphs then provide the necessary context for correlatingand prioritizing intrusion alerts, based on known paths of vulnerability through thenetwork. Overall, TVA offers powerful capabilities for proactive network defense,transforming raw security data into actionable intelligence.
Acknowledgements
This material is based upon work supported by Homeland Security Advanced Re-search Projects Agency under the contract FA8750-05-C-0212 administered by theAir Force Research Laboratory/Rome; by Air Force Research Laboratory/Rome un-

18 Jajodia and Noel
der the contract FA8750-06-C-0246; by Federal Aviation Administration under thecontract DTFAWA-08-F-GMU18; by Air Force Office of Scientific Research un-der grant FA9550-07-1-0527 and FA9550-08-1-0157; and by the National ScienceFoundation under grants CT-0716567, CT-0716323, and CT-0627493. Any opin-ions, findings, and conclusions or recommendations expressed in this material arethose of the authors and do not necessarily reflect the views of the sponsoring orga-nizations.
References
[1] S. Jajodia, S. Noel, and B. O’Berry, “Topological Analysis of Network Attack Vulnerability,”in Managing Cyber Threats: Issues, Approaches and Challenges, V. Kumar, J. Srivastava, A.Lazarevic (eds.), Kluwer Academic Publisher, 2005, pages 248-266.
[2] S. Jajodia, S. Noel, Topological Vulnerability Analysis: A Powerful New Approach for Net-work Attack Prevention, Detection, and Response, in Algorithms, Architectures and Informa-tion Systems Security (Indian Statistical Institute Platinum Jubilee Series), B. B. Bhattacharya,S. Sur-Kolay, S. C. Nandy, A. Bagchi, eds., World Scientific, New Jersey, 2009, pages 285–305.
[3] S. Noel, M. Jacobs, P. Kalapa. S. Jajodia, Multiple Coordinated Views for Network AttackGraphs, in IEEE Workshop on Visualization for Computer Security (VizSEC2005), Minneapolis,MN, October, 2005, pages 99–106.
[4] L. Wang, S. Noel, S. Jajodia, Minimum-Cost Network Hardening Using Attack Graphs, Com-puter Communications, 29(18), 2006, pages 3812–3824.
[5] S. Noel, S. Jajodia, Optimal IDS Sensor Placement and Alert Prioritization Using AttackGraphs, Journal of Network and Systems Management, 16(3), 2008, pages 259–275.
[6] S. Noel, E. Robertson, S. Jajodia, Correlating Intrusion Events and Building Attack Scenariosthrough Attack Graph Distances, in Proceedings of the 20th Annual Computer Security Appli-cations Conference (ACSAC), 2004, pages 350–359.
[7] R. Deraison, Nessus, http://www.nessus.org.[8] eEye Digital Security, Retina Network Security Scanner,
http://www.eeye.com/html/Products/Retina/index.html.[9] Foundstone, FoundScan Frequently Asked Questions, http://www.foundstone.com/us/index.asp.[10] Secure Computing, Sidewinder Firewall Device, http://www.securecomputing.com/.[11] Centennial Software, Discovery Asset Management, http://www.centennial-software.com/.[12] Symantec, Altiris, http://www.altiris.com/.[13] NIST, National Vulnerability Database (NVD), http://nvd.nist.gov/.[14] Security Focus, Bugtraq Vulnerabilities, http://www.securityfocus.com/vulnerabilities.[15] Symantec Corporation, Symantec DeepSight Threat Management System,
https://tms.symantec.com/Default.aspx.[16] Open Source Vulnerability Database, http://osvdb.org/.[17] MITRE Corporation, CVE - Common Vulnerabilities and Exposures, http://cve.mitre.org/.[18] R. Ritchey, B. OBerry, S. Noel, Representing TCP/IP Connectivity for Topological Analy-
sis of Network Security, in Proceedings of the 18th Annual Computer Security ApplicationsConference (ACSAC), 2002, pages 156–165.
[19] D. Turner, M. Fossi, E. Johnson, T. Mack, J. Blackbird, S. Entwisle, M. K. Low, D. McKin-ney, C. Wueest, Symantec Global Internet Security Threat Report Trends, 2008.
[20] NIST, Security Content Automation Protocol (SCAP), http://nvd.nist.gov/scap.cfm.[21] MITRE, Common Platform Enumeration (CPE), http://cpe.mitre.org/.[22] MITRE, Oval Language, http://oval.mitre.org/.[23] P. Ammann, D. Wijesekera, S. Kaushik, “Scalable, Graph-Based Network Vulnerability
Analysis,” in Proceedings of the 9th ACM Conference on Computer and Communications Se-curity, Washington, DC, pages 217–224.
Topological Vulnerability Analysis 19
[24] S. Noel, J. Jajodia, Understanding Complex Network Attack Graphs through Clustered Adja-cency Matrices, in Proceedings of the 21st Annual Computer Security Applications Conference(ACSAC), 2005, pages 160–169.
[25] D. Zerkle, K. Levitt, Netkuang A Multi-Host Configuration Vulnerability Checker, in Pro-ceedings of the 6th USENIX Unix Security Symposium, 1996.
[26] R. Ritchey, P. Ammann, Using Model Checking to Analyze Network Vulnerabilities, in Pro-ceedings of the IEEE Symposium on Security and Privacy, 2000.
[27] L. Swiler, C. Phillips, D. Ellis, S. Chakerian, Computer-Attack Graph Generation Tool, inProceedings of the DARPA Information Survivability Conference & Exposition II, 2001.
[28] O. Sheyner, J. Haines, S. Jha, R. Lippmann, J. Wing, “Automated Generation and Analysisof Attack Graphs,” in Proceedings of the IEEE Symposium on Security and Privacy, Oakland,CA.
[29] R. Lippmann, K. Ingols, C. Scott, K. Piwowarski, K. Kratkiewicz, M. Artz, R. Cunning-ham, Validating and Restoring Defense in Depth Using Attack Graphs, in Proceedings of theMILCOM Military Communications Conference, 2006.
[30] S. Noel, S. Jajodia, “Managing Attack Graph Complexity through Visual Hierarchical Ag-gregation,” in Proceedings of the ACM CCS Workshop on Visualization and Data Mining forComputer Security Fairfax, Virginia.
[31] W. Li, An Approach to Graph-Based Modeling of Network Exploitations, PhD dissertation,Department of Computer Science, Mississippi State University, 2005.
[32] F. Cuppens, R. Ortalo, LAMBDA: A Language to Model a Database for Detection of Attacks,in 3rd International Workshop on Recent Advances in Intrusion Detection, 2000.
[33] S. Templeton, K. Levitt, A Requires/Provides Model for Computer Attacks, in New SecurityParadigms Workshop, 2000.
[34] Skybox Security, http://www.skyboxsecurity.com/.[35] RedSeal Systems, http://www.redseal.net/.[36] R. Lippmann, K. Ingols, An Annotated Review of Past Papers on Attack Graphs, Lincoln
Laboratory, Technical Report ESC-TR-2005-054, 2005.