tornadoes of 16 november 2011 - national weather …...1 tornadoes of 16 november 2011 laurence g....
TRANSCRIPT
1
Tornadoes of 16 November 2011
Laurence G. Lee
National Weather Service
Greer, SC
1. Introduction
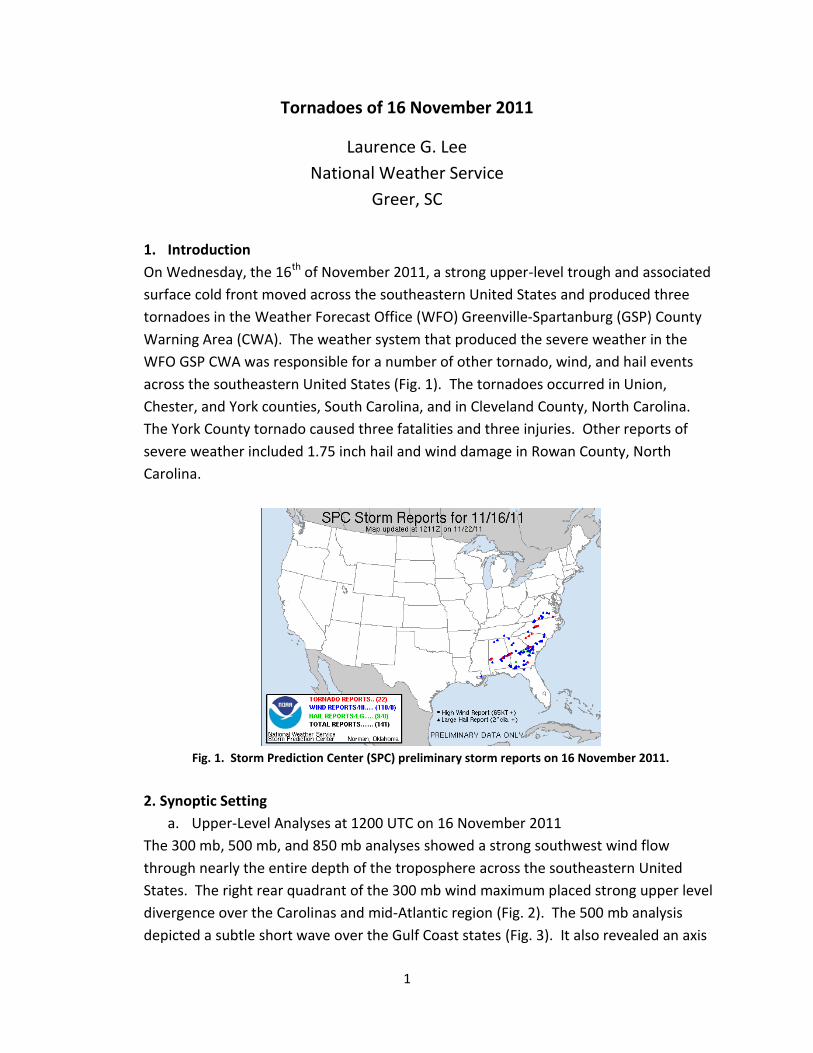
On Wednesday, the 16th of November 2011, a strong upper-level trough and associated
surface cold front moved across the southeastern United States and produced three
tornadoes in the Weather Forecast Office (WFO) Greenville-Spartanburg (GSP) County
Warning Area (CWA). The weather system that produced the severe weather in the
WFO GSP CWA was responsible for a number of other tornado, wind, and hail events
across the southeastern United States (Fig. 1). The tornadoes occurred in Union,
Chester, and York counties, South Carolina, and in Cleveland County, North Carolina.
The York County tornado caused three fatalities and three injuries. Other reports of
severe weather included 1.75 inch hail and wind damage in Rowan County, North
Carolina.
Fig. 1. Storm Prediction Center (SPC) preliminary storm reports on 16 November 2011.
2. Synoptic Setting
a. Upper-Level Analyses at 1200 UTC on 16 November 2011
The 300 mb, 500 mb, and 850 mb analyses showed a strong southwest wind flow
through nearly the entire depth of the troposphere across the southeastern United
States. The right rear quadrant of the 300 mb wind maximum placed strong upper level
divergence over the Carolinas and mid-Atlantic region (Fig. 2). The 500 mb analysis
depicted a subtle short wave over the Gulf Coast states (Fig. 3). It also revealed an axis

2
of colder air that extended from east Tennessee to the Florida panhandle. The
northeastward progression of the colder air assisted in destabilizing the air mass over
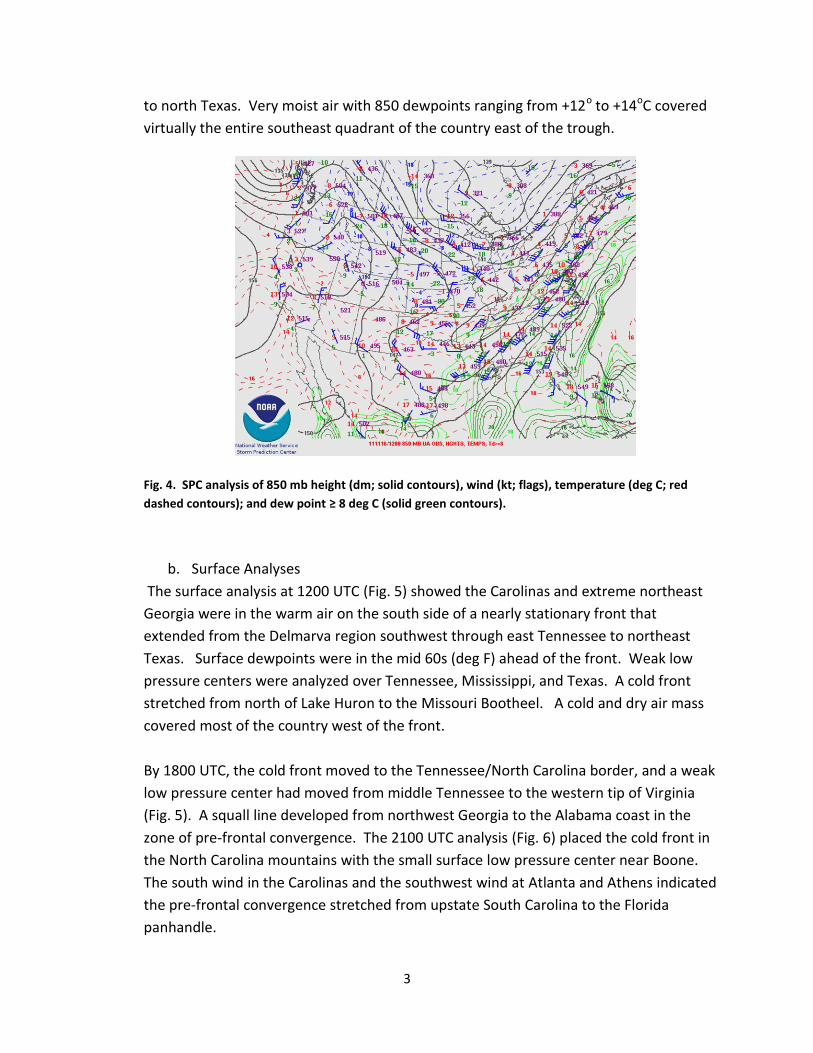
the Carolinas later in the day. The 850 mb analysis featured a southwest to northeast
axis of 40 kt winds across north Georgia and the western Carolinas (Fig. 4). The strong
low-level winds were just ahead of a sharp trough that extended from Ohio southwest
Fig. 2. SPC 300 mb analysis of wind (kt; flags), isotachs (kt; color fill), streamlines, and divergence
(yellow contours) at 1200 UTC on 16 November 2011.
Fig. 3. SPC 500 mb analysis of heights (dm; solid contours), wind (kt; flags), and temperature (deg C; red
dashed contours) at 1200 UTC on 16 November 2011.
3
to north Texas. Very moist air with 850 dewpoints ranging from +12o to +14oC covered
virtually the entire southeast quadrant of the country east of the trough.
Fig. 4. SPC analysis of 850 mb height (dm; solid contours), wind (kt; flags), temperature (deg C; red
dashed contours); and dew point ≥ 8 deg C (solid green contours).
b. Surface Analyses
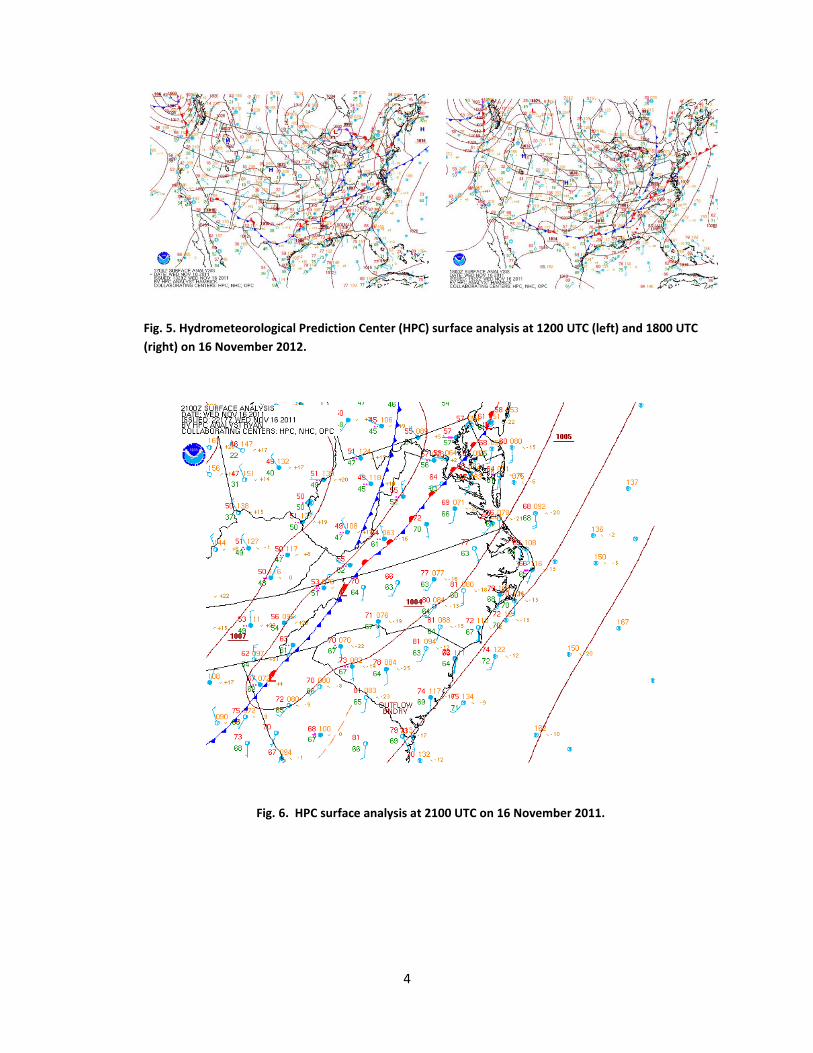
The surface analysis at 1200 UTC (Fig. 5) showed the Carolinas and extreme northeast
Georgia were in the warm air on the south side of a nearly stationary front that
extended from the Delmarva region southwest through east Tennessee to northeast
Texas. Surface dewpoints were in the mid 60s (deg F) ahead of the front. Weak low
pressure centers were analyzed over Tennessee, Mississippi, and Texas. A cold front
stretched from north of Lake Huron to the Missouri Bootheel. A cold and dry air mass
covered most of the country west of the front.
By 1800 UTC, the cold front moved to the Tennessee/North Carolina border, and a weak
low pressure center had moved from middle Tennessee to the western tip of Virginia
(Fig. 5). A squall line developed from northwest Georgia to the Alabama coast in the
zone of pre-frontal convergence. The 2100 UTC analysis (Fig. 6) placed the cold front in
the North Carolina mountains with the small surface low pressure center near Boone.
The south wind in the Carolinas and the southwest wind at Atlanta and Athens indicated
the pre-frontal convergence stretched from upstate South Carolina to the Florida
panhandle.
4
Fig. 5. Hydrometeorological Prediction Center (HPC) surface analysis at 1200 UTC (left) and 1800 UTC
(right) on 16 November 2012.
Fig. 6. HPC surface analysis at 2100 UTC on 16 November 2011.
5
3. Radiosonde Data
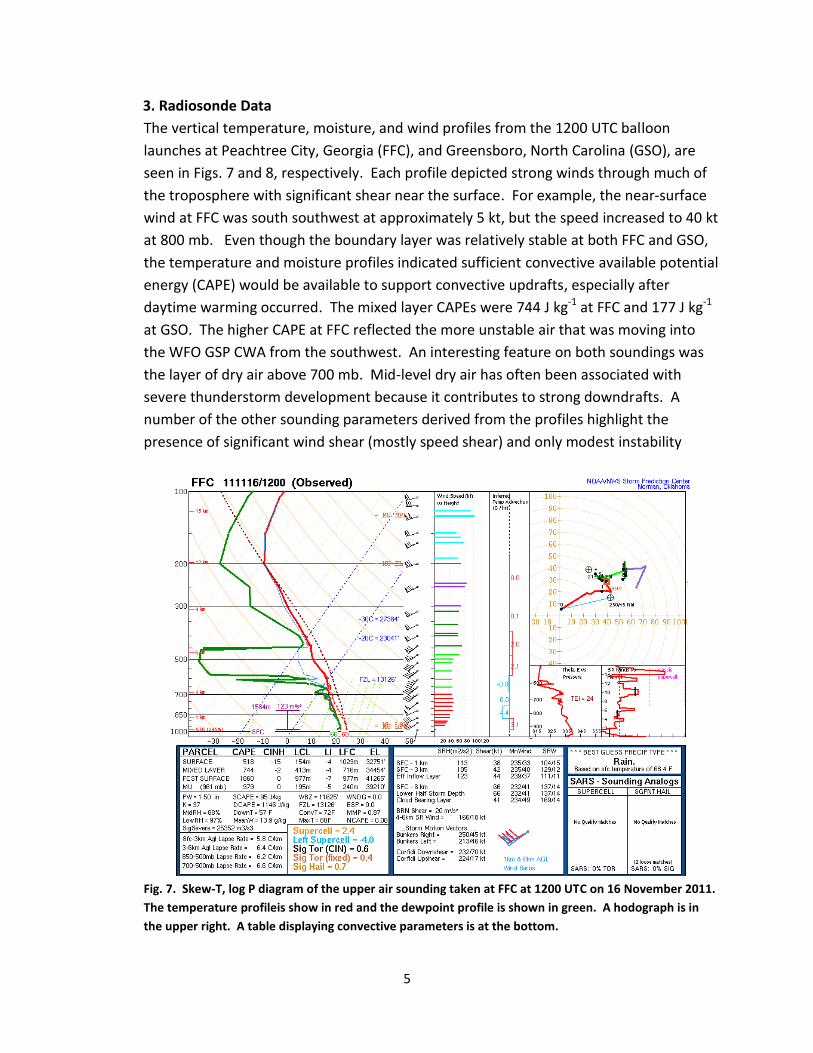
The vertical temperature, moisture, and wind profiles from the 1200 UTC balloon
launches at Peachtree City, Georgia (FFC), and Greensboro, North Carolina (GSO), are
seen in Figs. 7 and 8, respectively. Each profile depicted strong winds through much of
the troposphere with significant shear near the surface. For example, the near-surface
wind at FFC was south southwest at approximately 5 kt, but the speed increased to 40 kt
at 800 mb. Even though the boundary layer was relatively stable at both FFC and GSO,
the temperature and moisture profiles indicated sufficient convective available potential
energy (CAPE) would be available to support convective updrafts, especially after
daytime warming occurred. The mixed layer CAPEs were 744 J kg-1 at FFC and 177 J kg-1
at GSO. The higher CAPE at FFC reflected the more unstable air that was moving into
the WFO GSP CWA from the southwest. An interesting feature on both soundings was
the layer of dry air above 700 mb. Mid-level dry air has often been associated with
severe thunderstorm development because it contributes to strong downdrafts. A
number of the other sounding parameters derived from the profiles highlight the
presence of significant wind shear (mostly speed shear) and only modest instability
Fig. 7. Skew-T, log P diagram of the upper air sounding taken at FFC at 1200 UTC on 16 November 2011.
The temperature profileis show in red and the dewpoint profile is shown in green. A hodograph is in
the upper right. A table displaying convective parameters is at the bottom.

6
Fig. 8. Same as Fig. 7 except for GSO.
4. Evolution of Synoptic Features
The weak short wave trough embedded in the fast flow aloft moved quickly northeast
during the day and helped to trigger the development of thunderstorms along the
prefrontal convergence zone. The location of the prefrontal convergence beneath the
upper level divergence provided a favorable setting for vertical motion through a deep
layer (Fig. 9).
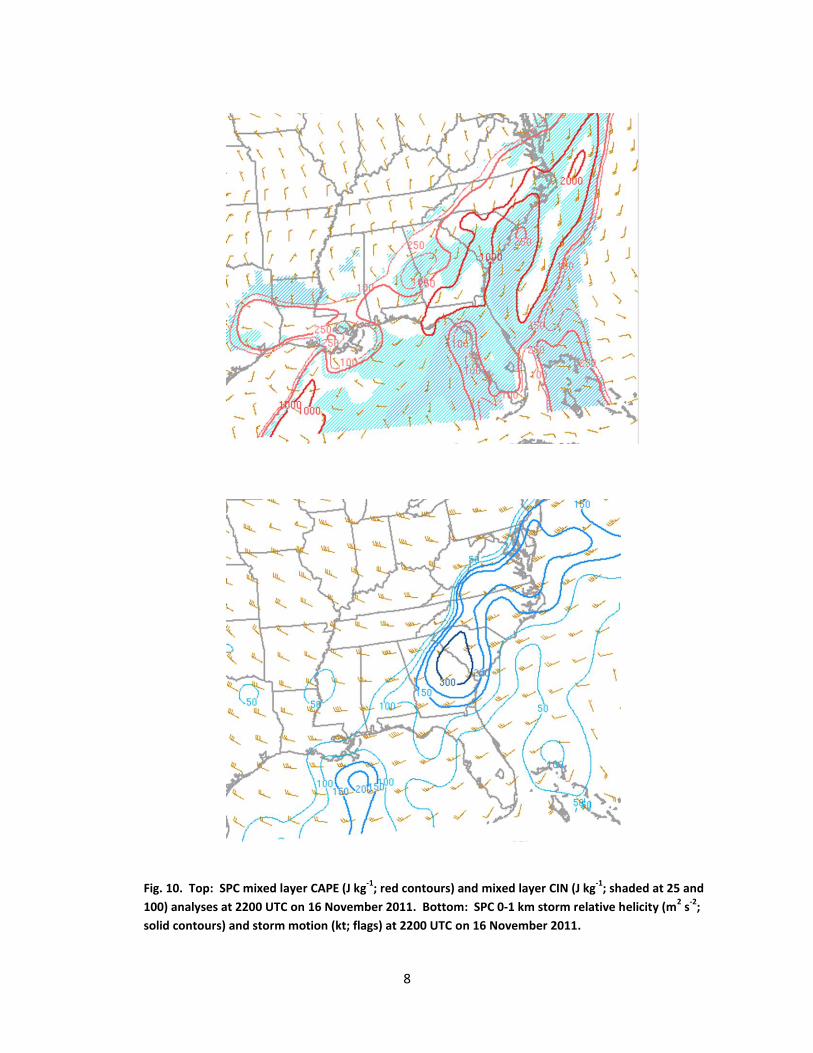
Warming surface air contributed to mixed layer CAPE increasing to 250 to 500 J kg-1 and
virtually no convective inhibition (CIN) which led to the development of strong updrafts
in the convective storms. The axis of high 0-1 km storm relative helicity, which can exist
when wind speed and directional sheer are significant, extended from east central
Georgia through South Carolina into central North Carolina (Fig. 10). The low-level wind
shear in combination with the modest CAPE was sufficient to produce strong
mesocyclones in some of the thunderstorms.

7
Fig. 9. Top: SPC 300 mb analysis of height (black contours), wind (kt; flags), isotachs (kt; blue contours
and shades), and divergence (purple contours) at 2200 UTC on 16 November 2011. Bottom: SPC 850
mb analysis of height (black contours), temperature (deg C; dashed contours), and dew point (deg C;
color fill ≥ 10) at 2200 UTC on 16 November 2011.
8
Fig. 10. Top: SPC mixed layer CAPE (J kg
-1; red contours) and mixed layer CIN (J kg
-1; shaded at 25 and
100) analyses at 2200 UTC on 16 November 2011. Bottom: SPC 0-1 km storm relative helicity (m2 s
-2;
solid contours) and storm motion (kt; flags) at 2200 UTC on 16 November 2011.

9
5. Regional Radar Data
The regional radar at 1757 UTC (Fig. 11) depicted only scattered rain showers over
extreme northeast Georgia and the western Carolinas. A more substantial area of rain
and isolated thunderstorms extended from northwest Georgia to southeast Alabama.
This precipitation was aligned with the pre-frontal axis of convergence.
Fig. 11. Radar reflectivity mosaic at 1757 UTC (top) and 2058 UTC (bottom) on 16 November 2011.
Arrow in bottom image points to the storm that produced the Cleveland County tornado at 2118 UTC.

10
At 2058 UTC, the pre-frontal precipitation had developed northeastward into western
North Carolina and upstate South Carolina (Fig. 11). The tapering line of precipitation
from extreme western Virginia to northeast Alabama was along the cold front. Several
small elements of enhanced reflectivity in upstate South Carolina were indicative of
strengthening updrafts. The cell highlighted by the arrow was the storm that moved
into Cleveland County and produced the EF1 tornado 20 minutes later at 2118 UTC. The
strongest and most numerous thunderstorms were over central Georgia.
The 2159 UTC radar image showed the small convective storm that produced tornado
damage in Union, Chester, and York counties (Fig. 12). The storm produced a brief EF0
tornado in Union County then moved northeast into Chester and York counties where
the EF2 tornado caused three fatalities and three injuries at approximately 2225 UTC.
The tornadic storms over the Carolinas continued to present a much less imposing visual
impression in the regional radar display than the thunderstorms over Georgia.
Fig. 12. Radar reflectivity mosaic at 2159 UTC on 16 November 2011. Arrow points to storm that
produced Union County tornado at 2206 UTC and subsequently moved into Chester and York counties.
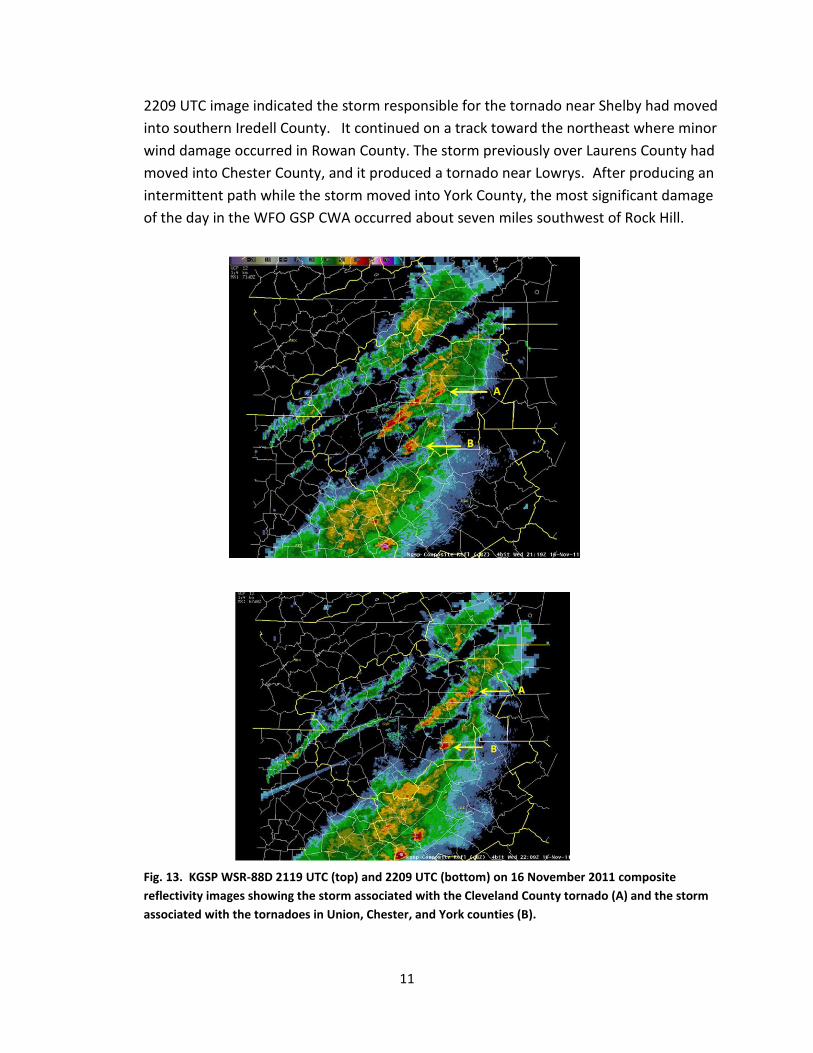
6. KGSP Radar
The WSR-88D radar at the Greenville-Spartanburg Airport (KGSP) provided a more
detailed view of the convective storms associated with the tornadoes (Fig. 13). At 2119
UTC, the composite reflectivity image showed two significant features: 1) The parent
storm of the Cleveland County tornado, and 2) a thunderstorm over Laurens County
that was destined to spawn the tornadoes in Union, Chester, and York counties. The
11
2209 UTC image indicated the storm responsible for the tornado near Shelby had moved
into southern Iredell County. It continued on a track toward the northeast where minor
wind damage occurred in Rowan County. The storm previously over Laurens County had
moved into Chester County, and it produced a tornado near Lowrys. After producing an
intermittent path while the storm moved into York County, the most significant damage
of the day in the WFO GSP CWA occurred about seven miles southwest of Rock Hill.
Fig. 13. KGSP WSR-88D 2119 UTC (top) and 2209 UTC (bottom) on 16 November 2011 composite
reflectivity images showing the storm associated with the Cleveland County tornado (A) and the storm
associated with the tornadoes in Union, Chester, and York counties (B).

12
The 0.5 degree reflectivity and storm relative velocity images at 2123 UTC (Fig. 14)
detected a strong mesocyclone signature over Cleveland County in conjunction with the
tornado near Shelby. The tornado occurred about three miles northeast of Shelby
where it downed and snapped pine trees. Structural damage was confined to a portion
of a tin roof blown off a house, gutter damage to another house, and minor shingle
damage to a third building.
Fig. 14. KGSP WSR-88D 0.5 degree reflectivity (top) and storm relative velocity (bottom) at 2123 UTC on
16 November 2011. Yellow arrow points toward storm that produced the small tornado near Shelby in
Cleveland County. Strong mesocyclonic rotation was evident in the inbound (green) / outbound (red)
couplet in the storm relative velocity image. The location of the KGSP WSR-88D radar is indicated by
the white arrow in the lower left-hand portion of the reflectivity image.
13
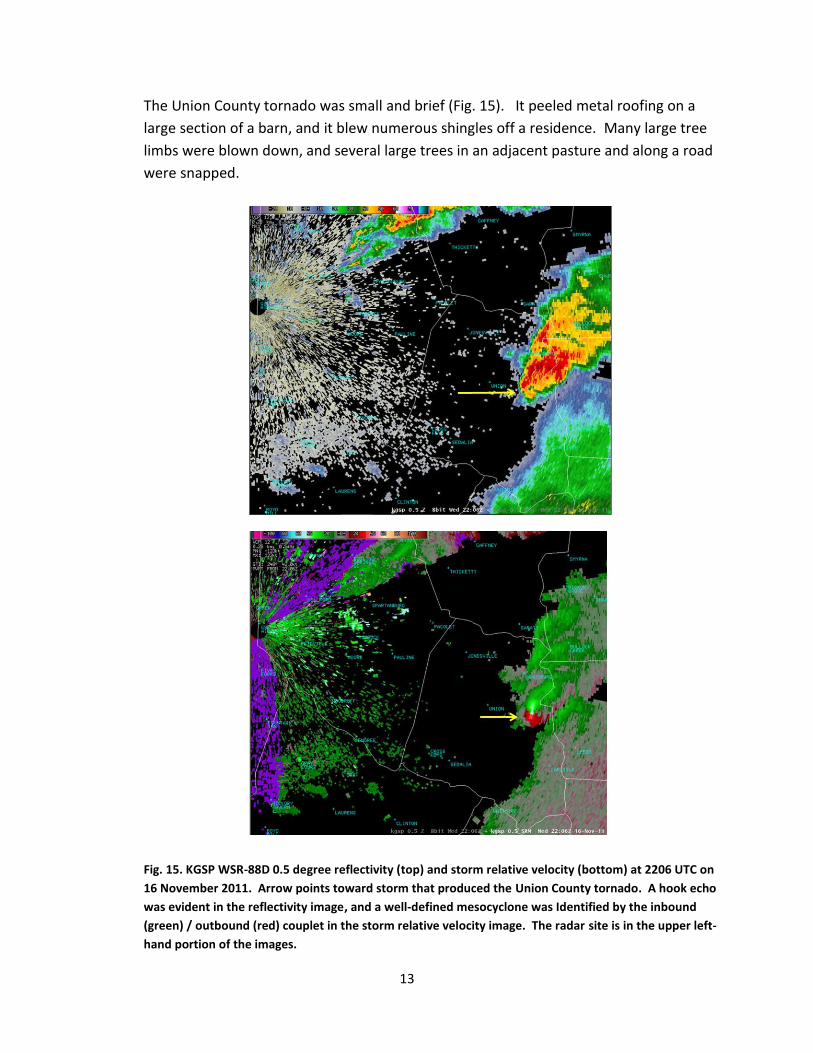
The Union County tornado was small and brief (Fig. 15). It peeled metal roofing on a
large section of a barn, and it blew numerous shingles off a residence. Many large tree
limbs were blown down, and several large trees in an adjacent pasture and along a road
were snapped.
Fig. 15. KGSP WSR-88D 0.5 degree reflectivity (top) and storm relative velocity (bottom) at 2206 UTC on
16 November 2011. Arrow points toward storm that produced the Union County tornado. A hook echo
was evident in the reflectivity image, and a well-defined mesocyclone was Identified by the inbound
(green) / outbound (red) couplet in the storm relative velocity image. The radar site is in the upper left-
hand portion of the images.
14
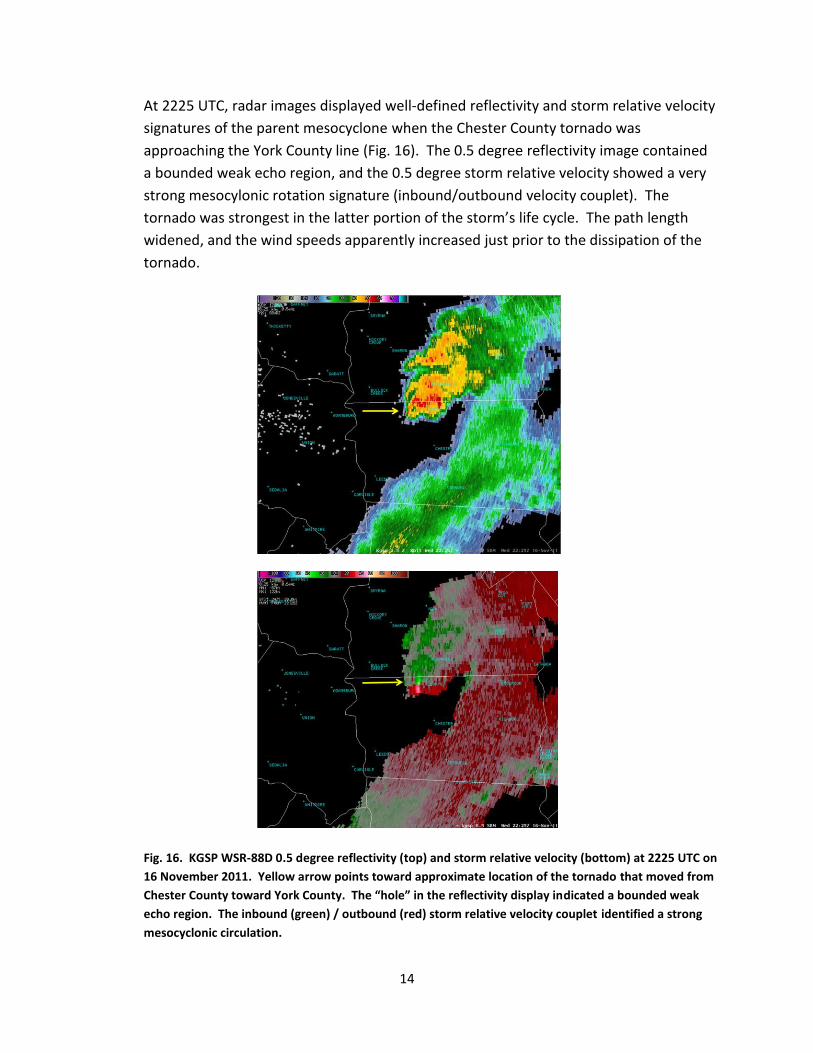
At 2225 UTC, radar images displayed well-defined reflectivity and storm relative velocity
signatures of the parent mesocyclone when the Chester County tornado was
approaching the York County line (Fig. 16). The 0.5 degree reflectivity image contained
a bounded weak echo region, and the 0.5 degree storm relative velocity showed a very
strong mesocylonic rotation signature (inbound/outbound velocity couplet). The
tornado was strongest in the latter portion of the storm’s life cycle. The path length
widened, and the wind speeds apparently increased just prior to the dissipation of the
tornado.
Fig. 16. KGSP WSR-88D 0.5 degree reflectivity (top) and storm relative velocity (bottom) at 2225 UTC on
16 November 2011. Yellow arrow points toward approximate location of the tornado that moved from
Chester County toward York County. The “hole” in the reflectivity display indicated a bounded weak
echo region. The inbound (green) / outbound (red) storm relative velocity couplet identified a strong
mesocyclonic circulation.

15
7. Summary
Three tornadoes occurred in the WFO GSP CWA on 16 November 2011. One of the
tornadoes caused three fatalities and three injuries in York County, South Carolina. The
tornadoes were small and rather brief, but their parent mesocylonic circulations had
much longer lifetimes and produced identifiable radar rotation tracks (Fig. 17). The
tornadoes occurred in an environment characterized by only modest instability but very
strong vertical wind shear. Upper level divergence in the fast winds aloft combined
with low level convergence ahead of a surface cold front to produce the vertical motion
that triggered the storms.
Fig. 17. National Severe Storm Laboratory (NSSL) rotation tracks for 16 November 2011. The North
Carolina Piedmont and South Carolina Piedmont supercell tracks are highlighted.
The Cleveland County tornado, which occurred in the southwest portion of the “NC
Piedmont supercell track” in Fig. 17, had an Enhanced Fujita scale rating of EF1. Its path
length and width were only about one third mile and 50 yards, respectively. After the
tornado dissipated, the parent storm caused hail 1.75 inches in diameter and damaging
winds gusts in Rowan County. Both the Union County tornado and the Chester/York
counties tornado developed on the “SC Piedmont supercell track” in Fig. 17. The Union
County tornado was rated EF0, and it had a path length of just 200 yards and a path
width of 50 yards. The strongest and most damaging event of the day was the EF2
tornado that moved from northern Chester County into southern York County. That
tornado track was 5.7 miles long, and it was 200 yards wide.
16
Acknowledgments
The upper air maps and mesoanalysis images were obtained from the NCEP/Storm
Prediction Center. The surface analyses came from the NCEP/Hydrometeorological
Prediction Center. The UCAR/NCAR Research Applications Laboratory created the
regional radar reflectivity mosaics. The rotation tracks were provided by the NSSL
Warning Decision Support System – Integrated Information Multi-Radar/Multi-Sensor
platform. Patrick Moore provided a critical review and quality control of this event
summary.