toronto employment survey 2016 - city of toronto · the toronto employment survey has successfully...
TRANSCRIPT

profile TORONTO - 1
This bulletin summarizes the highlights of the 2016 City of Toronto annual Employment Survey, marking its 34th year.
This information resource presents a picture of change in Toronto’s economy throughout the past three decades.
For more information, please visit us at www.toronto.ca/demographics/surveys
• The 2016 survey counted1,461,020 jobs, an increase of38,740 jobs or 2.7% fromToronto’s employment base in2015.
• Full-time employment has sur-passed the 1 million mark for the11th consecutive year.
• Part-time jobs increased by 8.4%from 2015, an addition of 28,760jobs.
• The Office category remainsthe largest sector in Toronto,accounting for almost 1 out ofevery 2 jobs.
• In 2016, approximately 600,560jobs were located in Toronto’sDowntown and Centres, 41.1%of all jobs.
• North York Centre, with 40,320jobs, remains Toronto’slargest employment Centre afterDowntown.
• Yonge-Eglinton Centre hasToronto’s highest employmentdensity with over 30,000 jobs perkm2.
• In 2016, 398,350 jobs werelocated in Employment Areas,27.3% of jobs in Toronto.
• The survey counted 75,290establishments in 2016, a netloss of 420 establishments.
• 79.5% of all Manufacturingestablishments and 92.8% of allManufacturing jobs are in Em-ployment Areas.
• The Community andEntertainment categoryadded the most establishmentsin 2016, increasing by 550 or27.6% since 2015.
Highlights
75,290total establishments
79.5%of Manufacturing establishments are in Employment Areas
550more Community and Entertainment establishments
1,461,020total jobs
38,740more jobs since 2015
35%of jobs are located in the Downtown
398,350jobs are concentrated in Employment Areas
Toronto Employment Survey 2016
Attachment 1

2 - Toronto City Planning - December 2016
Introduction
The City of Toronto, at 634.5 km2, is home to 2.8 million people, making it Canada’s largest city and the fourth largest urban area in North America.1 Toronto has 8.1% of Canada’s workforce and is a major national economic driver.2 The city’s gross domestic product (GDP) is 162.0 billion dollars annually, and accounted for 26.3% of Ontario’s GDP and 9.9% of Canada’s output in 2015.3 In the past year, the Toronto region’s GDP is estimated to have grown by 2.6%, outpacing both Ontario’s rate of growth of 2.1% and Canada’s rate of growth of 1.2%.4
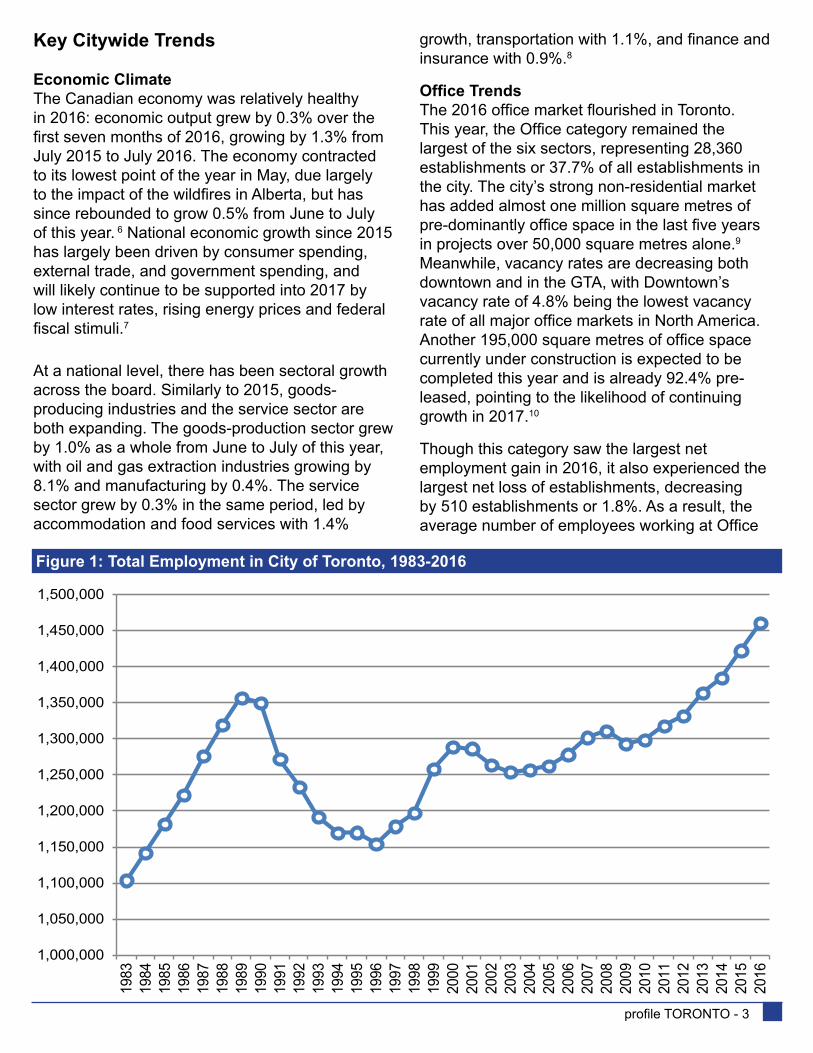
In 2016, the Toronto Employment Survey counted 1,461,020 jobs in the City of Toronto, adding 38,740 jobs or 2.7% to Toronto’s employment base (see Figure 1).5 This is tied with 2015 for Toronto’s highest growth rate over the last ten years. The city’s total employment has increased significantly during the past decade, growing by 14.3% or 183,010 jobs (see Table 1).
This bulletin summarizes the results of the 2016 Toronto Employment Survey. It highlights key citywide trends, findings by category and emerging patterns in Downtown, the Centres, Secondary Plan Areas and Employment Areas. The results from the Employment Survey are used to gauge the city’s economic and investment health and to monitor the progress of Official Plan policies. The survey results are also used for the forecasting and planning of infrastructure and services, to provide key insights into Toronto’s business climate and economic growth.
Map 1 shows the distribution of employment across the city, with distinct concentrations in Downtown, the Centres, and Employment Areas demonstrating their continued vitality.
How Employment Information is Collected by the City of Toronto The Toronto Employment Survey has successfully marked its thirty-fourth year. Since 1983, it has provided a rich resource of time-series data for the longitudinal analysis of employment activity in the city, based on the use of a consistent coding system of parcel uses and occupant activities.
Beginning in 2011, employment activity has been classified by NAICS (North American Industry Classification System) codes to enable comparison of employment activity across municipalities, provinces, and other countries. This is in addition to the occupant activity code standard of the Regional Information Systems Working Group of the Regional Planning Commissioners of Ontario, which has been used and updated over the past three decades.
Between May and August, a team of surveyors visit all business establishments located in commercial, industrial, institutional and mixed use areas throughout the City of Toronto. In 2016, employment data was acquired from 88.5% of business establishments that were identified. This marks a slight decrease over 2015’s response rate of 89.3%. Data collected include the number of full-time and part-time employees, the primary type of employment activity taking place, and the length of time the business has been at that location. In the case of major, multi-branch employers, the information is collected through a questionnaire mailed to the primary contact at the head office.
The result is a rich dataset which provides a valuable profile of the economic activity across the City of Toronto. This survey does not currently capture all those people who work from home or employment activities that are “footloose” or not place-specific on a daily basis.
The return of the long-form Census in 2016 will enable the comparison of employment data once it is released by Statistics Canada. A detailed comparison of 2016 data will be forthcoming in the 2017 Bulletin.
Table 1: Total Employment - 2006, 2015, 2016
Employment Total Number of Employees Net Change
GrowthRate %
Net Change
Annual Growth Rate %
2006 2015 2016 2006-2016 2015-2016Full-time 1,001,060 1,077,930 1,087,930 86,870 8.7% 10,000 0.9%Part-time 276,950 344,350 373,090 96,140 34.7% 28,740 8.3%Total 1,278,010 1,422,280 1,461,020 183,010 14.3% 38,740 2.7%
Note: Numbers have been rounded to the nearest ten.
profile TORONTO - 3
Key Citywide Trends
Economic Climate The Canadian economy was relatively healthy in 2016: economic output grew by 0.3% over the first seven months of 2016, growing by 1.3% from July 2015 to July 2016. The economy contracted to its lowest point of the year in May, due largely to the impact of the wildfires in Alberta, but has since rebounded to grow 0.5% from June to July of this year. 6 National economic growth since 2015 has largely been driven by consumer spending, external trade, and government spending, and will likely continue to be supported into 2017 by low interest rates, rising energy prices and federal fiscal stimuli.7
At a national level, there has been sectoral growth across the board. Similarly to 2015, goods-producing industries and the service sector are both expanding. The goods-production sector grew by 1.0% as a whole from June to July of this year, with oil and gas extraction industries growing by 8.1% and manufacturing by 0.4%. The service sector grew by 0.3% in the same period, led by accommodation and food services with 1.4%
growth, transportation with 1.1%, and finance and insurance with 0.9%.8
Office Trends The 2016 office market flourished in Toronto. This year, the Office category remained the largest of the six sectors, representing 28,360 establishments or 37.7% of all establishments in the city. The city’s strong non-residential market has added almost one million square metres of pre-dominantly office space in the last five years in projects over 50,000 square metres alone.9 Meanwhile, vacancy rates are decreasing both downtown and in the GTA, with Downtown’s vacancy rate of 4.8% being the lowest vacancy rate of all major office markets in North America. Another 195,000 square metres of office space currently under construction is expected to be completed this year and is already 92.4% pre-leased, pointing to the likelihood of continuing growth in 2017.10
Though this category saw the largest net employment gain in 2016, it also experienced the largest net loss of establishments, decreasing by 510 establishments or 1.8%. As a result, the average number of employees working at Office
Figure 1: Total Employment in City of Toronto, 1983-2016
1,000,000
1,050,000
1,100,000
1,150,000
1,200,000
1,250,000
1,300,000
1,350,000
1,400,000
1,450,000
1,500,000
1983
1984
1985
1986
1987
1988
1989
1990
1991
1992
1993
1994
1995
1996
1997
1998
1999
2000
2001
2002
2003
2004
2005
2006
2007
2008
2009
2010
2011
2012
2013
2014
2015
2016

4 - Toronto City Planning - December 2016
sector establishments rose to 25.2 in 2016 from 24.0 in 2015 and 23.1 in 2011. Of the 20 major sectors of the economy, the three sectors with the highest growth in average number of employees per establishment since 2011 all typically occur in the office market. These are Real Estate and Rental and Leasing, which had 27.3% growth in average number of employees per establishment over the last five years, Information and Cultural Industries (18.7%), and Finance and Real Estate (16.9%).
Toronto has experienced decreasing vacancy rates despite increasing and sustained office space supply, indicating strong demand for office space. The concurrent employment growth paired with establishment shrinkage suggests a concentration of Office sector employees at each establishment. One recent example is the consolidation of professional services firm Deloitte Canada. In 2016, the firm moved 4,000 employees from multiple offices in the Toronto area to a newly constructed, 19-floor office in the Bay Adelaide Centre East building in downtown Toronto with room for employment expansion.11
Retail Trends Since 2006, the Retail category has lost 2,010 establishments, a drop of 11.8%. This was the
Location 2015 2016 Category 2015 2016
Centres 200 150 Manufacturing 220 150
Downtown 1,070 820 Retail 800 560
Employment Areas 1,390 1,090 Service 1,080 830
Rest of the City 1,800 1,610 Office 1,780 1,280
Institutional 230 170
Community & Entertainment 340 680
City Total 4,460 3,670 City Total 4,460 3,670
Note: Numbers have been rounded to the nearest ten.
Figure 3: Total Number of Establishments, 1983-2016
Figure 2: Change in Number of Establishments, 2006-2016
Table 2: New Establishments, 2015-2016
-2,500
-2,000
-1,500
-1,000
-500
0
500
1,000
1,500
2,000
Service Office Institutional Cmty & Ent
Esta
blis
hmen
ts
-6.8%
-11.8%
8.2%
4.0% 19.3%
98.4%
(Growth Rate)
Manufacturing Retail
60,000
65,000
70,000
75,000
80,000
85,000
1983
1984
1985
1986
1987
1988
1989
1990
1991
1992
1993
1994
1995
1996
1997
1998
1999
2000
2001
2002
2003
2004
2005
2006
2007
2008
2009
2010
2011
2012
2013
2014
2015
2016
Esta
blis
hmen
ts
Year

profile TORONTO - 5
largest net establishment loss of any category during this period, outpacing the Manufacturing category’s loss of 350 establishments or 6.6% (see Figure 2). However, in 2016, the number of Retail establishments decreased by only 290 establishments or 1.9%. The Retail category has also lost fewer establishments in 2016 than over the past five years, during which 920 establishments or 5.8% of the total were lost.
Despite the decline in establishments, retail employment has grown, increasing by 2,260 jobs or 1.6% since 2015 and 6,000 jobs or 4.2% since 2011. Additionally, retail sales increased 2.2% from July 2015 to July 2016 to top $6.8 billion.12 As in the Office sector, the reduction of establishments along with the growth of employment has resulted in an increase in the average number of employees per Retail establishment: from 2011 to 2016, the average number of employees per Retail establishment increased from 8.9 to 9.8. This trend suggests the continued growth of larger retail formats, as demonstrated by the introduction of large retailers such as Nordstrom and Saks Fifth Avenue and related investment in flagship retail centres in Toronto such as the Eaton Centre and Yorkdale Mall.13
Manufacturing Trends Toronto’s Manufacturing category employment has declined over the last decade, reflecting a similar decline internationally as the North American economy continues to shift from a goods-producing economy to a service-based economy. Toronto’s categorical composition reflects an evolving urban economy which continues to be competitive in a changing national and global market.
The decline of Manufacturing establishments in Toronto has slowed since the economic downturn of 2008. This decline halted briefly in 2015, but resumed in 2016 with the loss of 110 establishments or 2.2%. At present, there are 4,920 Manufacturing establishments, representing 6.5% of the city’s total.
However, the industrial market in the city has been strengthening: the industrial vacancy rate fell to 1.0% in the second quarter of this year, at the same time as the city saw the largest amount of industrial space under construction since 2008
(over 40,000 square metres). Toronto’s vacancy rate is the lowest of all markets in the Greater Toronto Area, with demand in the North York and Etobicoke areas contributing the most to low vacancy rates.14
Number of Establishments In 2016, the Employment Survey identified 75,290 business establishments in the City of Toronto (see Figure 3). After steadily declining during the 2008-2009 global recession, the number of businesses in Toronto began to grow again after 2012, and continued to grow until this year. Since 2015, the city’s number of establishments decreased slightly by 420 businesses or 0.6%. The number of establishments has stayed relatively stable over a five-year period, increasing by 190 or 0.3% since 2011.
Toronto’s employment has grown more quickly over this time period, adding 143,720 jobs or 10.9% since 2011 and 38,740 jobs or 2.7% since 2015. As a result, the average number of people employed per establishment in Toronto increased to 19.4 in 2016 from 18.8 in 2015 and 17.5 in 2011 (see Figure 4). The number of “large” establishments, those with more than 100 employees, has grown by 43 or 2.0% this year. Currently, 3.0% of employers in Toronto have more than 100 employees.
New Establishments in the City
In 2016, the Toronto Employment Survey counted 3,670 new establishments or 4.9% of the city total over the past year (see Table 2). The number of new establishments decreased by 790 or 17.7% from 2015’s total of 4,460 new establishments. These new establishments include not only newly started businesses, but also relocations and new locations of existing firms. Of the 3,670 new establishments, more than half (52.1%) were

6 - Toronto City Planning - December 2016
Total Employment!( < 100
!( 100 - 499
!( 500 - 2,499
!( 2,500 +
Core Employment Area
General Employment Area
Downtown and Centres
Map 1: 2016 Employment Concentration
Toronto City Planning, Research and Information - November 2016
Downtown
i

profile TORONTO - 7
Total Employment!( < 100
!( 100 - 499
!( 500 - 2,499
!( 2,500 +
Core Employment Area
General Employment Area
Downtown and Centres
Map 1: 2016 Employment Concentration
Toronto City Planning, Research and Information - November 2016
Downtown
i

8 - Toronto City Planning - December 2016
located in Downtown and in Employment Areas, with 820 and 1,090 establishments respectively. Another 150 new establishments are located in the Centres, while the balance of 1,600 establishments are located elsewhere in the city (see Figure 5).
The greatest proportion of new establishments belongs to the Office category, which represented 34.9% of all new establishments in 2016. This is a slightly lower share than in 2015, when the Office category accounted for 39.9% of new establishments, reinforcing the previously discussed trend of employee centralization within Office establishments. The Service category accounted for 22.5% of new establishments, while the Community and Entertainment category more than doubled its share of new establishments to 18.4% in 2016 from 7.7% in 2015 (see Figure 6).
The Retail and Institutional sectors contributed 15.3% and 4.7% of new establishments respectively. From 2013 to 2016, the number of new Institutional establishments dropped by almost half (47.7%). The Retail sector had the second largest decline in new establishments in this period, with 31.5% fewer new establishments in 2016 compared to 2013.
The remaining 4.1% of new establishments belong to the Manufacturing sector. Despite broader declines in North American manufacturing, Toronto remains an attractive location for industrial establishments with 150 new Manufacturing establishments choosing to locate in Toronto in 2016, representing 930 new Manufacturing jobs.
Longevity Toronto remains an attractive place for new start-ups and for business relocations. In 2016, 36.2% of Toronto’s business establishments were less than 5 years old (in the same location, see Figure
Figure 4: Average Number of Employees Per Establishment, 1983-2016
Figure 5: New Establishments by Location, 2016
Figure 6: New Establishments by Category, 2016
4.2%
22.3%
29.8%
43.7%CentresDowntownEmployment AreasRest of the City
4.1%
15.3%
22.5%
34.9%
4.7%
18.4%Manufacturing
Retail
Service
Office
Institutional
Community & Entertainment
15.0
15.5
16.0
16.5
17.0
17.5
18.0
18.5
19.0
19.5
20.0
1983
1984
1985
1986
1987
1988
1989
1990
1991
1992
1993
1994
1995
1996
1997
1998
1999
2000
2001
2002
2003
2004
2005
2006
2007
2008
2009
2010
2011
2012
2013
2014
2015
2016

profile TORONTO - 9
7). Over one-fifth of the city’s establishments (22.4%) have remained in the same location for more than twenty years, while nearly one-third (32.5%) of establishments have been located in Toronto for more than fifteen years. This demonstrates a strong degree of stability in the local economy despite economic cycles and recessions.
Full-Time and Part-Time Employment Of the 1.46 million jobs in the city, 74.5% are classified as full-time jobs. Full-time employment increased 0.9% in 2016. In comparison, 25.5% of jobs in Toronto are classified as part-time (less than 30 hours per week). Part-time employment increased 8.4% in 2016. The proportion of part-time jobs has increased steadily over thirty years to almost double its 13.3% share in 1986, which translates to an increase of 210,550 part-time jobs. Since 2011, part-time employment has increased by 80,010 jobs or 27.3%.
Toronto Employment by Category
Over the last year, the number of jobs in Toronto has increased by 2.7%, representing 38,740 jobs. It should be noted that a significant component of this growth in 2016 is due to the new inclusion of 25,000 part-time Toronto District School Board (TDSB) employees, which accounts for approximately 1.8% out of the 2.7% total growth rate. Without this addition, net growth is approximately 1.0% or 13,740 jobs.
As an establishment-based survey, the Toronto Employment Survey does not fully capture employment that does not have a regular location. The 25,000 TDSB employees were not previously counted in the Toronto Employment Survey because of their status as footloose employment, or employment without a regular place of work, such as substitute teachers and other travelling staff who could not be spatially located. The new inclusion of the TDSB employees at several district offices around the city is a significant step towards reducing the footloose employment undercount and represents the success of our ongoing relationship-building efforts with major, multi-location employers such as the TDSB. This relationship-building process has increased the accuracy of data collected over time, as organizations become more familiar with the Survey’s methodology and purpose.
The Office category remains Toronto’s largest, accounting for nearly half (48.9%) of all jobs found in Toronto (see Table 3), growing 2.9% and adding 20,050 jobs from 2015 (see Figure 8). The Institutional category is Toronto’s second largest employment category, with 16.8% of the city’s jobs. The Institutional category gained more jobs than any other category in 2016, an increase of 14,000 jobs or 6.0%, which is particularly less noteworthy given the slower growth in new establishments.
Figure 7: Longevity of Existing Establishments
0
5
10
15
20
25
30
35
40
0-5 6-10 11-15 16-20 21-25 26-50 51+
% o
f Est
ablis
hmen
ts
Years at Present Location
2013 2014 2015 2016
Figure 8: Change in Total Employment by Category, 2015-2016
-10,000
0
10,000
20,000
30,000
40,000
50,000
60,000
70,000
80,000
90,000
100,000
Manufacturing Retail Service Off ice Institutional Cmty & Ent
Jobs
-3.6%
16.1%
13.7%
11.8%
12.0%4.2%
(Growth Rate)

10 - Toronto City Planning - December 2016
The Service category represents 12.4% of the city’s jobs and grew by 3,740 jobs or 2.1%. Employment in the Retail category also grew over the past year, increasing by 2,260 jobs or 1.6%. The Manufacturing category contains 8.5% of jobs in Toronto and is stable, down just 10 jobs from 2015.
The smallest category in Toronto is the Community and Entertainment category, which includes entertainment venues, community and recreational uses and was called the ‘Other’ category in previous editions of the Employment Bulletin. It represents 3.4% of jobs in the city and lost the highest percentage of employment in Toronto over 2016, decreasing by 2.6% and 1,300 jobs.
The Past Decade Over the decade, the number of jobs in Toronto has grown from 1.28 million to 1.46 million jobs, an increase of 14.3%. All categories except Manufacturing and Retail have grown over the last ten years.
The Office Category Nearly half of all jobs in Toronto reside in the Office category, representing 48.9% of Toronto’s jobs. The Office category has been Toronto’s predominant category for over thirty
years. Over the last ten years, Toronto employment has continued to concentrate in the Office category, adding 129,780 jobs and growing by 22.6%. Over the last five years, the Office category has grown steadily
from 627,900 jobs in 2011 to 713,930 jobs in 2016, adding 86,030 jobs and growing by 13.7% (see Figure 9).
The Institutional Category The Institutional category has been Toronto’s second largest employment category for over twenty years, overtaking the Retail category in 1984 and the Manufacturing category in 1992. Currently, the Institutional category represents 16.8% of Toronto’s employment. Over the last decade it has added 40,230 jobs, growing by 19.6%. Since 2011, the Institutional category has grown by 25,940 jobs or 11.8%. After a dip in employment in 2015 when the category lost 1,990 jobs, employment recovered by 6.0% in 2016 to show the highest percentage of growth of all categories.
Total Number of Employees Net Change
GrowthRate %
Net Change
GrowthRate %
Net Change
GrowthRate %
Category 2006 2011 2015 2016 2006-2016 2011-2016 2015-2016Manufacturing 155,160 128,600 124,000 123,990 -31,170 -20.1% -4,610 -3.6% -10 0.0%Retail 149,780 141,600 145,340 147,600 -2,180 -1.5% 6,000 4.2% 2,260 1.6%Service 145,460 155,500 176,850 180,590 35,130 24.2% 25,090 16.1% 3,740 2.1%Office 584,150 627,900 693,880 713,930 129,780 22.2% 86,030 13.7% 20,050 2.9%Institutional 205,510 219,800 231,740 245,740 40,230 19.6% 25,940 11.8% 14,000 6.0%Community & Entertainment 37,960 43,900 50,470 49,170 11,210 29.5% 5,270 12.0% -1,300 -2.6%
Total 1,278,020 1,317,300 1,422,280 1,461,020 183,000 14.3% 143,720 10.9% 38,740 2.7%
Note: Numbers have been rounded to the nearest ten. Totals may differ from sum of full-time and part-time employment.
Table 3: Employment by Category, 2006, 2011, 2015, 2016
Figure 9: Change in Total Employment by Category, 2011-2016
-10,000
0
10,000
20,000
30,000
40,000
50,000
60,000
70,000
80,000
90,000
100,000
Manufacturing Retail Service Off ice Institutional Cmty & Ent
Jobs
-3.6%
16.1%
13.7%
11.8%
12.0%4.2%
(Growth Rate)

profile TORONTO - 11
The Service Category The Service category continues to represents 12.4% of Toronto’s employment, as it did in 2015. Over the last five years, the category has grown by 25,090 jobs or 16.1%. Most of this growth has occurred
over the last ten years, as the Service category has added 35,130 jobs or 24.2% since 2006. From 2015, the category added 3,740 jobs.
The Retail Category Toronto’s Retail category has changed significantly since 2006. At that time, the Retail category was growing, but during the global recession, Retail employment declined sharply, by more than 10,990 jobs between 2007 and 2010. As a result, the Toronto Employment Survey recorded a net decline of 2,180 Retail jobs or 1.5% between the years of 2006 and 2016. However, by 2011, the category began to recover and has grown steadily since. From 2015, the category gained 2,260 jobs, growing by 1.6%. In 2016, the Retail category accounted for 10.1% of all employment in Toronto.
The Manufacturing Category Once Toronto’s second largest employment category, Manufacturing is now Toronto’s second smallest category. Manufacturing employment has continued to decline, reflecting the evolution of the North American economy from goods production to services. Toronto’s employment in the Manufacturing category includes warehousing employment and is primarily concentrated in the Processed Goods Processing and the Product Assembly subcategories, together accounting for 65.5% of Manufacturing employment in Toronto.
Manufacturing employment declined by 31,170 or 20.1% from 2006 to 2016. Over the last five years, this decline slowed, totaling 4,610 jobs lost or 3.6%. In 2016 the Manufacturing category lost just 10 jobs.
The Community and Entertainment Category The Community and Entertainment category is Toronto’s smallest employment category. This category includes entertainment venues, community and recreation uses, and other activities
such as construction. This category has grown as a whole over the last ten years, adding 11,210 jobs or 29.5%. Since 2011, the category has added 5,270 jobs or 12.0%. However, in 2016 the category decreased by 2.6% or 1,300 jobs.
Despite the decline in employment, the Community and Entertainment category grew by 550 establishments or 27.6% since 2015, suggesting a decentralization of employees across establishments. Community and Entertainment also added the highest percentage of new businesses of any category, with new businesses accounting for 26.6% of all establishments in the category in 2016. Almost three quarters (71.9%) of new businesses in this sector that have been classified by NAICS belong to one of two major economic sectors: Construction or Arts, Entertainment and Recreation.
Employment by Economic Sector
In 2011, City Planning incorporated the North American Industry Classification System (NAICS) into the data collection processes of the Toronto Employment Survey. NAICS was established by Statistics Canada and the statistical agencies of Mexico and the United States to provide a coding standard that allows for data analysis and comparison across municipal, provincial and national boundaries. NAICS coding is extremely detailed and highly specific, articulating the industrial structure of the economy, while the Regional Information Systems Working Group’s Land Use Activity Codes profile the city’s use and occupancy of land.
Coding the data to the lowest, most detailed level enables it to be aggregated to higher levels during analysis and for comparative purposes. The NAICS coding for establishments is now quite stable, enabling comparisons over time as well as comparisons to other municipalities in Canada

12 - Toronto City Planning - December 2016
and elsewhere, which is discussed further in the Insights section of this Bulletin. In 2016, the Employment Survey was extremely successful in coding Toronto’s establishments with 98.8% of businesses assigned a full 6-digit code.
The Urban Economy At the broadest level the urban economy can be grouped into three major industries: Goods Producing; Service-Based; and Government and Institutional (see Figure 10). More than three quarters (77.5%) of all jobs in the city are in Service-Based industries while 13.9% of employment is in Government and Institutional-Based industries. The remaining 8.6% of jobs in the city are in the Goods Producing industries.
Both the Service-Based and the Government and Institutional industries experienced growth in 2016. Service-Based Industries grew by 1.8%, adding 19,930 jobs, while Government and Institutional industries grew by 20,780 jobs or 11.4%. Goods Producing Industries showed a small decrease in employment over 2016, declining by 1.5% or 1,900 jobs.
These trends remain unchanged since 2011, when the Employment Survey began recording NAICS codes. Service-Based industries have gained the highest number of jobs, increasing by 150,540 jobs and 15.3%. Government and Institutional industries have grown by the largest percentage since 2011, adding 34,160 jobs or 20.2%. Goods Producing industries shrank slightly over the last five years, losing 3,750 jobs or 2.9%.
Major Economic Sectors NAICS classifies the economy into 20 major sectors. In 2016, over half (50.1%) of all jobs in Toronto fell into the top five NAICS sectors, indicating that while Toronto’s economy is varied, there is a large concentration in certain fields (see Figure 11).
The top five categories are: Health Care and Social Assistance; Professional, Scientific and Technical Services; Finance and Insurance; Retail Trade; and Educational Services.
From 2015, the Educational Services sector saw the greatest net gains in employment, adding
10,980 jobs or 10.7%. As a result, it has overtaken the Accommodation and Food Services sector to become the fifth largest sector in Toronto by a margin of 580 jobs. The Health Care and Social Assistance sector also grew since 2015, adding 10,560 jobs or 6.1%. It remains Toronto’s largest NAICS sector, accounting for 12.5% of jobs citywide.
The Professional, Scientific and Technical Services and Finance and Insurance sectors are currently the second and third largest sectors in Toronto, representing 10.6% and 9.8% of all jobs respectively. Both sectors have remained relatively stable over the last year, with Professional, Scientific and Technical Services declining by 1,310 jobs or 0.8%, and Finance and Insurance increasing slightly by 570 or 0.4%. Also stable is the Retail Trade sector, which grew by 0.6% or 800 jobs to remain Toronto’s fourth largest sector.
Since NAICS data began to be recorded in 2011, a number of sectors have experienced significant growth in employment. The Management of Companies and Enterprises sector has the highest percentage of growth in this period, increasing by 12,790 jobs or 33.5%. Also showing strong growth rates of over 20% since 2011 are the Real Estate and Rental and Leasing, Educational Services, Accommodation and Food Services,
77.5%
13.9%
8.6%
Service-BasedGovernment & InstitutionalGoods Producing
Figure 10: 2016 Employment by NAICS Sector

profile TORONTO - 13
and Information and Cultural Industries sectors. The Real Estate and Rental and Leasing sector grew by 8,740 jobs or 26.6%, Educational Services by 21,970 jobs and 24.0%, Accommodation and Food Services by 21,420 jobs and 23.4%, and the Information and Cultural Industries sector by 8,590 jobs or 20.2%.
Urban Economic Structure
Toronto’s Official Plan directs growth and development towards specific areas of the city, including Downtown, the Centres, and Employment Areas. Together, these areas form the backbone of the city’s urban economic structure,
connected by transit and transportation arteries, maximizing existing infrastructure and services in order to best accommodate growth.
As areas with a range of uses, Downtown and the Centres encourage both residential and employment growth, while Employment Areas are designated for employment-related land uses and activities.
Additionally, Secondary Plan areas adapt Official Plan policies to the local contexts of defined areas.This bulletin will review employment change in the growth management areas of the Official Plan .
0 20,000 40,000 60,000 80,000 100,000 120,000 140,000 160,000 180,000 200,000
Health Care and Social Assistance
Professional, Scientific and Technical Services
Finance and Insurance
Retail Trade
Educational Services
Accommodation and Food Services
Manufacturing
Public Administration
Other Services (Except Public Administration)
Administrative, Support, and Waste Services
Information and Cultural Industries
Management of Companies and Enterprises
Transportation and Warehousing
Real Estate and Rental and Leasing Wholesale
Trade
Construction
Arts, Entertainment and Recreation
Utilities
Agriculture, Forestry, Fishing and Hunting
Mining and Resource Extraction
2016 2015 2014 2013
Figure 11: Total Employment by Economic Sector

14 - Toronto City Planning - December 2016
Employment in Downtown and the Centres Downtown
Toronto’s Downtown is a local and national economic hub.
It contains 511,200 jobs within 21.4km2. The Downtown accounts for
35.0% of Toronto’s jobs with 23,888 jobs per km2. Employment in the
Downtown increased by 2,560 jobs or 0.5% in 2016, growing by 69,280 jobs or 15.7% from 2011 to 2016 (see Figure 12 and Table 4). Downtown continues to attract new establishments: in 2016, 22.3% of business
establishments new to the city chose to locate in Toronto’s Downtown.
The Office category is Downtown’s largest, accounting for two of every three jobs (65.4%). Though the category shrank in 2016, losing 4,510 jobs or 1.3%, these losses were balanced by gains in the Institutional category. Institutional jobs account for 14.2% of employment, the second largest share in Downtown, and grew by 9.2% over the last year from 66,650 to 72,810 jobs. The smallest category is Manufacturing, representing just 0.9% of employment in Downtown. While the category lost 140 jobs or 3.1% since 2015, Manufacturing
employment has grown slightly in Downtown since 2011, adding 50 jobs or 1.1%.
Since 2011, all six categories have experienced employment growth in Downtown. The Institutional sector showed the highest percentage of growth between 2011 and 2016, gaining 24.7% or 14,400 jobs Downtown. The Service category also grew significantly, adding 9,070 jobs or 19.7%. Office employment experienced the largest net gain with 41,650 new jobs or 14.3%, while the Retail sector grew by 10.0% or 2,500 jobs, and the Community and Entertainment sector grew by 9.7% or 1,600 jobs.
0
50,000
100,000
150,000
200,000
250,000
300,000
350,000
400,000
450,000
500,000
550,000
Downtown North York Centre Scarborough Centre
Yonge-Eglinton Etobicoke Centre
Jobs
2011 2016 Net Change
0
5,000
10,000
15,000
20,000
25,000
30,000
35,000
40,000
45,000
North York Centre
Scarborough Centre
Yonge-Eglinton Etobicoke Centre
Jobs
Figure 12: Employment & Net Change in Downtown & Centres, 2011 - 2016
2011-2016 2015-20162011 2012 2013 2014 2015 2016 Net Change % Change Net Change % Change
Downtown 441,920 446,840 467,820 482,710 508,640 511,200 69,280 15.7% 2,560 0.5%North York Centre 36,520 36,060 35,350 34,830 35,000 40,320 3,800 10.4% 5,320 15.2%Scarborough Centre 15,030 15,400 16,870 16,440 16,690 22,070 7,040 46.8% 5,380 32.2%Yonge-Eglinton 16,820 17,740 19,760 19,010 17,390 17,510 690 4.1% 120 0.7%Etobicoke Centre 8,840 8,660 8,690 9,380 9,770 9,460 620 7.0% -310 -3.2%
Downtown and the Centres 519,130 524,700 548,490 562,370 587,490 600,560 81,430 15.7% 13,070 2.2%Rest of City 798,170 806,870 815,360 822,020 834,790 860,460 62,290 7.8% 25,670 3.1%
City Total 1,317,300 1,331,570 1,363,850 1,384,390 1,422,280 1,461,020 143,720 10.9% 38,740 2.7%
Note: Numbers have been rounded to the nearest ten. Centres are in descending order by size of employment base.
Table 4: Total Employment in the Centres and Downtown, 2011-2016

profile TORONTO - 15
The Centres Overall, the Centres are home to 89,360 jobs or 6.1% of employment in the city. Since 2015, employment in the Centres experienced a net gain of 10,510 jobs or 13.3%. Over the last five years, the Centres gained 12,150 jobs or 15.7%. Employment growth has mostly been located in Scarborough and North York Centres, with each adding over 5,000 jobs since 2015 and Scarborough adding more than 7,000 jobs since 2011 (see Figure 13).
Some 12,500 of the new jobs counted within Scarborough and North York Centres (6,250 jobs each) can be attributed to the inclusion of Toronto District School Board (TDSB) employees not previously counted, as both Centres contain TDSB district offices where those employees without a regular place of work are generally based. Employment in the Centres excluding the footloose TDSB jobs amounts to 76,860 jobs in 2016, which is 1,990 jobs or 2.5% less than in 2015, and 350 jobs or 0.5% less than in 2011. Employment in the Centres is predominantly office-related, with Office category jobs accounting for more than three quarters (78.6%) of all employment (see Figure 14).
North York Centre North York Centre is Toronto’s largest Centre with 40,320 jobs, accounting for 2.8% of jobs in the city. From 2011 to 2014, employment in the Centre was on the decline, but has since exceeded 2011 levels. Employment grew by 15.2% or
5,320 jobs over the past year (including the TDSB footloose employees), and by 10.4% or 3,800 jobs since 2011.
The Office category is the largest category in North York Centre, representing 84.7% of employment or 34,170 jobs. A gain of 5,580 jobs or 19.5% in the Office category, due largely to the addition of the 6,250 Office-identified TDSB footloose jobs described earlier, accounted for more than the total of North York Centre’s net employment gains over the past year. This increase off-set employment losses in the Retail, Service, and Community and Entertainment categories. The Institutional sector remained stable, and the small pre-existing Manufacturing sector grew by 50 jobs to reach 70 jobs.
Since 2011, all categories except Retail and Community and Entertainment have grown in North York Centre. While the Community and Entertainment sector lost 340 jobs or 41.5%, the Retail sector remained stable. Over the past five years, Manufacturing had a modest gain of 10 jobs or 16.7%, while the Institutional and Service sectors grew by 10.3% and 11.1% respectively to 1,710 and 2,310 jobs. The strongest growth was experienced in the Office category, which grew by 12.3% since 2011 or by 3,750 jobs.
0
1,000
2,000
3,000
4,000
5,000
6,000
7,000
8,000
North York Centre Scarborough Centre Yonge-Eglinton Etobicoke Centre
Jobs
Figure 13: Net Employment Change in Centres, 2011 - 2016
. .

16 - Toronto City Planning - December 2016
Yonge-Eglinton Yonge-Eglinton Centre is the second largest Centre in Toronto and contains the highest density of employment in the city with over 30,000 jobs per square kilometre. The Centre contains 17,510 jobs or 1.2% of employment in the city. Since 2015, employment in this Centre increased slightly by 120 jobs or 0.7%. Over the last five years, employment in Yonge-Eglinton has grown by 4.1% to add 690 jobs.
Employment in Yonge-Eglinton Centre is mainly Office-related, accounting for nearly 8 out of every 10 jobs (77.7%). The Office category has grown 4.9% over five years and 1.3% in the last year. The Retail and Institutional sectors also grew, by 14.4% and 7.4% respectively, while Manufacturing, Service and Community and Entertainment sectors experienced net losses of 100 or fewer employees.
Some of the employment change in Yonge-Eglinton Centre can be attributed to the renovation and expansion of 2300 Yonge Street, a project that is expected to add an additional 19,700 m2 of office space and an additional 3,960 m2 of retail
space to the Centre.15 While construction work coincided with a decline in jobs in Yonge-Eglinton Centre in 2015 as establishments were closed for renovations, the project is nearing completion and employment at this location increased from 3,930 to 4,150 or by 5.6% over the past year. Scarborough Centre
Scarborough Centre contains 22,070 jobs, or 1.5% of employment found in Toronto. In 2016, the Centre
experienced the highest rate of employment growth of all the
Centres since both 2015 and 2011, growing by 5,380 jobs or 32.2% over the past year and 7,040 jobs or 46.8% over the past five years.
As seen in North York Centre, a significant gain in the Office category of 7,170 jobs or 82.8% resulted largely from the addition of 6,250 Office-identified TDSB jobs. This gain accounted for more than the total of Scarborough Centre’s net employment gains over the past year and offset employment losses in the Manufacturing and Retail categories. As a result, the Office sector has increased its share of employment in Scarborough Centre
Figure 14: Total Employment in Downtown & Centres by Category, 2011-2016
0
100,000
200,000
300,000
400,000
500,000
600,000
700,000
2011 2012 2013 2014 2015 2016
Jobs
Manufacturing Retail Service Off ice Institutional Cmty & Ent

profile TORONTO - 17
from under 6 in 10 jobs (59.6%) in 2015 to over 7 in 10 jobs (71.8%) in 2016. The Retail sector has the second highest share of employment in Scarborough Centre with 14.8% of jobs, due to the presence of the Scarborough Town Centre.
Etobicoke Centre Etobicoke Centre is the
smallest Centre in Toronto. It is home to 9,460
jobs, representing just 0.6% of employment in
Toronto. It was the only Centre to experience a decline in employment
since 2015, losing 310 jobs or 3.2%. However, over the last five years, the Centre
has gained 620 jobs to grow by 7.0% since 2011. Similarly to Toronto’s other Centres, the majority of jobs are Office-related, with almost 7 out of every 10 jobs (69.7%) in the Office category in Etobicoke Centre. Employment in Secondary Plan Areas Secondary Plans guide growth and development in specific areas of the city, adapting the policies and objectives of the Official Plan to the local contexts of the defined areas. There are currently thirty-two Secondary Plans in force (see Map 2). Secondary Plan areas contain a range of land use designations and cover diverse geographic areas across Toronto. They also necessarily overlap the geographic areas of Downtown, the Centres and Employment Areas. As a result, the employment and establishment data in Secondary Plan areas should be understood in relation to the City as a whole, rather than compared to data for Downtown, the Centres, or Employment Areas.16
In combination, Secondary Plan areas contribute roughly one-fifth (20.7%) of all employment in Toronto, or 296,070 jobs. This includes 24.5% of all Office employment in the city, as well as 25.7% of all Community and Entertainment employment in the city (see Figure 15). More than half (52.8%) of employment within Secondary Plan areas is concentrated in the five largest areas by employment: King-Spadina (42,440 jobs), North York Centre (40,860 jobs), Yonge Eglinton (32,480 jobs), Scarborough Centre (22,070 jobs), and Garrison Common North (18,330 jobs).
Three of these five areas are Centres while the remaining two, King-Spadina and Garrison Common North, are respectively within or adjacent to the Downtown. This distribution of employment reflects the success of the Official Plan’s growth management policies in directing growth to appropriate areas.
The thirty-two Secondary Plan areas can be classified into three groups according to their total employment (see Table 5). Those with 10,000 or more employees include King-Spadina, North York Centre, Yonge Eglinton, Scarborough Centre, Garrison Common North, Railway Lands East, Lawrence-Allen, Sheppard East Subway Corridor, Yonge St. Clair, King-Parliament, York University, and University of Toronto. These areas are generally situated in or near the Downtown, the Centres, along the rapid transit network, or contain major post-secondary institutions. Office employment is the predominant employment category in these areas, with three exceptions: Lawrence-Allen has mostly Retail employment due to the presence of the Yorkdale and Lawrence Square shopping centres, and both York University and University of Toronto have predominantly Institutional employment.
A second group of Secondary Plan Areas with between 1,000 and 9,999 employees includes Etobicoke Centre, Downsview Area, Railway Lands Central, Agincourt, Central Don Mills, Highland Creek, Sheppard West/Dublin, Sheppard Avenue Commercial Area, and Fort York Neighbourhood. These Secondary Plan areas are generally either smaller in geographic area or further from the Downtown, but still contain significant concentrations of employment. As with the larger Secondary Plan areas, most areas in this group have predominantly Office employment. Highland Creek and Fort York Neighbourhood are the only exceptions, with each containing a majority of Institutional employment due to the presence of large institutional employers in each area.
Secondary Plan areas with less than 1,000 employees include Emery Village, Regent Park, Swansea, Central Finch, Motel Strip, Railway Lands West, Warden Woods, Queen River, Morningside Heights, Davenport Village, and Port Union Village Community.

18 - Toronto City Planning - December 2016
2
79
21
3
6
8
5
2432
25
1
10
4
1230
26
23
11
2222
29
27
29
Geo
grap
hies
Sec
onda
ry P
lan
Are
as:
Cor
e E
mpl
oym
ent A
rea
Gen
eral
Em
ploy
men
t Are
a
Dow
ntow
n an
d C
entre
s
Map
2: 2
016
Seco
ndar
y Pl
an A
reas
Toro
nto
City
Pla
nnin
g, R
esea
rch
and
Info
rmat
ion
- Nov
embe
r 201
6
6
1415
20
16
28
1713
1918
34
Dow
ntow
n
i
7 8 9 10 11 12 13 14 15 16 17 18 19
20 21 22 23 24 25 26 27 28 29 30 32 34
1 2 3 4 5 6
Agin
cour
tH
ighl
and
Cre
ekM
orni
ngsi
de H
eigh
tsPo
rt U
nion
Vill
age
Com
mun
itySc
arbo
roug
h C
entre
Yong
e S
t. C
lair
Dow
nsvi
ew A
rea
Nor
th Y
ork
Cen
treSh
eppa
rd E
ast S
ubw
ay C
orrid
orYo
rk U
nive
rsity
Mot
el S
trip
Etob
icok
e C
entre
Fort
York
Nei
ghbo
urho
odG
arris
on C
omm
on N
orth
King
-Par
liam
ent
King
-Spa
dina
Rai
lway
Lan
ds E
ast
Rai
lway
Lan
ds C
entra
lR
ailw
ay L
ands
Wes
t
Uni
vers
ity o
f Tor
onto
Yong
e E
glin
ton
Cen
tral F
inch
Shep
pard
Wes
t/Dub
linC
entra
l Don
Mill
sSw
anse
aEm
ery
Villa
geD
aven
port
Vill
age
Reg
ent P
ark
Shep
pard
Ave
nue
Com
mer
cial
Are
aW
arde
n W
oods
Law
renc
e-A
llen
Que
en R
iver

profile TORONTO - 19
These areas tend to be smaller in size, are located outside of Downtown and are more sectorally diverse than Secondary Plan areas with more employment. While Office employment is predominant in Emery Village, Regent Park, Swansea, Central Finch and Davenport Village, Service employment is predominant in Motel Strip, Railway Lands West, Queen River and Port Union Village Community have mostly Service employment. Employment in Warden Woods is primarily in the Manufacturing category. This diversity reflects the more local economic roles of these Secondary Plan areas.
Figure 15: Secondary Plan Area Employment by Category, 2016
Table 5: Secondary Plan Area Employment by 6 Sectors, 2016
Number Secondary Plan Area Manufacturing Retail Service Office Institutional Community &Entertainment Total
1 Agincourt 620 730 560 2,420 220 10 4,56024 Central Don Mills 0 90 350 300 1,660 380 2,78022 Central Finch 0 0 0 0 160 90 25027 Davenport Village 0 0 10 0 0 0 107 Downsview Area 570 3,270 1,340 15,830 700 360 22,07026 Emery Village 100 730 930 10,960 990 340 14,05012 Etobicoke Centre 200 810 1,520 4,670 1,460 150 8,82013 Fort York Neighbourhood 70 1,590 2,310 34,650 1,770 480 40,86014 Garrison Common North 10 4,230 1,470 5,490 3,560 320 15,0702 Highland Creek 0 30 480 250 10,350 100 11,210
15 King-Parliament 90 40 140 130 50 200 65016 King-Spadina 100 620 1,360 6,660 930 200 9,87032 Lawrence-Allen 0 10 50 60 930 60 1,1003 Morningside Heights 510 1,180 2,500 11,660 2,130 360 18,33011 Motel Strip 90 1,070 1,740 6,360 2,450 670 12,3908 North York Centre 430 3,040 6,470 30,070 830 1,620 42,4404 Port Union Village Community 250 480 1,670 11,590 130 3,710 17,83034 Queen River 0 90 1,650 1,970 20 890 4,62018 Railway Lands Central 0 170 290 110 10 30 62017 Railway Lands East 20 210 450 1,460 7,540 550 10,22019 Railway Lands West 150 3,150 3,980 20,980 3,170 1,060 32,48028 Regent Park 0 30 30 480 90 30 6505 Scarborough Centre 0 360 360 610 200 10 1,55029 Sheppard Avenue Commercial Area 0 810 920 1,210 580 200 3,7109 Sheppard East Subway Corridor 140 70 30 210 170 60 67023 Sheppard West/Dublin 50 70 230 290 250 0 88025 Swansea 0 0 0 20 0 0 2020 University of Toronto 0 110 60 360 150 100 78030 Warden Woods 0 40 60 1,000 140 20 1,24021 Yonge Eglinton 290 20 50 30 160 60 6006 Yonge St. Clair 20 5,520 1,850 4,750 2,560 580 15,27010 York University 40 190 140 70 0 10 450
All Secondary Plan Areas 3,740 28,750 32,990 174,610 43,340 12,640 296,070Note: Secondary Plan area numbers correspond to numbering in the Official Plan. Employment has been rounded to the nearest ten.
1.3%
9.7%
11.1%
59.0%
14.6%
4.3%
Manufacturing
Retail
Service
Off ice
Institutional
Community & Entertainment

20 - Toronto City Planning - December 2016
Employment Areas Employment Areas are specialized components of the City’s land use framework designated for employment use and growth. Among the permitted uses, the Employment Areas tend to be characterized by manufacturing, warehousing and product assembly activities as well as commercial business parks. These areas are regionally and globally competitive locations for national and international business as well as areas for business formation. As a result, Employment Areas provide a broad range of job opportunities for Toronto residents and the regional labour force.
Map 3 shows the location and boundaries of the Employment Areas identified in the City’s Official Plan at the time of the 2016 Toronto Employment Survey. The lands represented by the Employment Areas are important elements of Toronto’s economic future, helping to ensure a stable environment for investment and to maintain and grow the city’s revenue base.
The Importance of Employment Lands
The Places to Grow Act is the provincial government legislation that governs planning for growth and development in a way that supports economic prosperity, protects the environment and helps communities achieve a high quality of life in Ontario. The Places to Grow Act also enables the development of regional growth plans that guide government investments and policies, such as the Growth Plan for the Greater Golden Horseshoe, 2006.17
The Growth Plan for the Greater Golden Horseshoe was amended in 2013 with revised forecasts, with more extensive updates currently pending approval. Currently, the City of Toronto is forecasted to reach employment levels of 1,640,000 jobs by 2031 and 1,720,000 jobs by 2041. This anticipates that the city will add approximately 7,000 jobs per year over 40 years (2001-2041), increasing the employment base by 19.4%.18 Employment Areas are central to maintaining Toronto’s economic health and achieving the forecasted growth.
Currently, 21,570 establishments are located in Toronto’s Employment Areas. This accounts for more than a quarter (28.7%) of all business establishments in the city and accounts for 398,350 jobs, or 27.3% of all jobs in Toronto. Further, 79.5% of all establishments in the Manufacturing sector as classified by NAICS are in Employment Areas, accounting for 92.8% of all Manufacturing jobs in Toronto.
Employment in the Manufacturing sector and other major sectors such as Transportation and Warehousing or Utilities is concentrated within lands designated as Employment Areas. These sectors have limited alternative locations given the potential negative impacts to residential and other sensitive land uses, highlighting the need to protect employment lands for employment uses. The conversion of land to residential or other sensitive uses in an Employment Area can destabilize the entire area, resulting in losses of establishments and employment and a decline in the diversity of the city’s economy and tax base. The diversity of Toronto’s economy has enabled the city to weather the recent recession reasonably well, making the protection of Employment Areas imperative. Official Plan Amendment 231 On December 18, 2013, Council enacted Amendment 231 of the Official Plan (OPA 231) regarding Economic Health and Employment Lands Policies and Recommendations on Conversion Requests. OPA 231 amends Policy 2.1.2 of the Official Plan by deleting the term Employment Districts and replacing it with Employment Areas. Map 2 of the Official Plan, which depicts the Employment Districts, was
Toronto Official Plan
Growth Plan for the Greater
Golden Horseshoe
Planning ActProvincial Policy Statement

profile TORONTO - 21
E
SW
NE
NW
Geo
grap
hies
Empl
oym
ent M
onito
ring
Are
a
Cor
e Em
ploy
men
t Are
a
Gen
eral
Em
ploy
men
t Are
a
Map
3: 2
016
Empl
oym
ent A
reas
and
Em
ploy
men
t Mon
itorin
g A
reas
Toro
nto
City
Pla
nnin
g, R
esea
rch
and
Info
rmat
ion
- Nov
embe
r 201
6i

22 - Toronto City Planning - December 2016
replaced by a new Map 2 showing Employment Areas, and the Official Plan was amended with new land use designations. As a result, beginning in 2016 this bulletin no longer identifies Employment Districts but rather Employment Areas, with analysis dating back to their approval in 2013. Employment Area Activity Overview Toronto’s Employment Areas contain 398,350 jobs, or 27.3% of all jobs found in the city. Employment Areas continue to attract new businesses, with 1,090 or 29.8% of new establishments in the city locating in Employment Areas in 2016. As an employment-focused land use designation, Employment Areas contain a variety of employment activity that can be broken down into NAICS’ major economic sectors (see Table 6).
Employment Areas are particularly important to the Manufacturing sector as classified by NAICS, with 79.5% of all Manufacturing establishments and 92.8% of all Manufacturing jobs in the city residing in Employment Areas. More than one fifth (20.9%) of all Employment Area jobs are in the Manufacturing sector, a total of 83,320 jobs (see Figure 16). Other sectors that have a majority of their employment located within Employment Areas are Transportation and Warehousing, Construction, and Utilities. The Transportation and Warehousing sector contributes 8.1% of employment in Employment Areas or 32,240 jobs, which is over three quarters (75.8%) of the sector’s employment in Toronto. Construction sector jobs number 22,270 and represent 5.6% of employment in Employment Areas, with 71.1% of all Construction sector employment occurring in Employment Areas. In the Utility sector, 90.1% of all employment city-wide is located in Employment Areas, a total of 3,670 jobs or 0.9% of total employment in Employment Areas.
The Wholesale and Retail Trade sector has the second largest absolute share of employment in Employment Areas after the Manufacturing sector, accounting for 16.6% of all employment, 66,310 jobs, and about 4 out of every 10 (37.1%) jobs in the sector citywide. The Professional, Scientific, and Technical Services sector has the next largest share of jobs in Employment Areas, representing 9.9% or 39,580 jobs. Roughly one quarter (25.5%)
of the sector’s jobs are within Employment Areas. Finally, the Administrative and Support, Waste Management and Remediation Services sector contributes 22,590 jobs or 5.7% of employment to Employment Areas, which represent 33.2% of the sector’s jobs in Toronto. Core and General Employment Areas Section 4.6 of OPA 231 categorizes Employment Areas into two different designations: Core Employment Areas and General Employment Areas. These designations will come into force by a pending order of the Ontario Municipal Board. Core Employment Areas are typically geographically located within the interior of Employment Areas. Uses that would attract the general public into the interior of employment related lands and possibly disrupt existing operations are not generally permitted in the Core Employment Areas. General Employment Areas are usually located on the periphery of Employment Areas on major roads where retail stores, service shops and restaurants can serve workers in the Employment Areas and would also benefit from visibility and transit access to draw the broader public.19 Core Employment Areas In 2016, 63.0% of Employment Area jobs were located in Core Employment Areas. Manufacturing is the most prominent sector in Core Employment Areas, representing 27.6% of employment, 69,240 jobs, and 77.1% of all Manufacturing jobs in the city (see Figure 17). Both the Transportation and Warehousing and Construction sectors also have a majority of their employment city-wide in Core Employment Areas: 29,300 or 68.8% of all Transportation and Warehousing jobs and 18,520 or 59.2% of all Construction jobs are in Core Employment Areas. Respectively, these sectors represent 11.7% and 7.4% of employment within Core Employment Areas. General Employment Areas Employment activities in General Employment Areas support Core Employment Area industry functions and serve as a buffer between sensitive land uses and the heavy industrial land uses located in the Core Employment Areas. The top three sectors in General Employment Areas are

profile TORONTO - 23
Wholesale and Retail Trade, accounting for 19.2% of employment or 28,350 jobs; Professional, Scientific, and Technical Services, contributing 10.5% or 15,550 jobs; and Manufacturing, representing 9.5% and 14,070 jobs. Both the Administrative and Support, Waste Management and Remediation Services sector and the Finance and Insurance sector contribute a 7.2% share of employment in General Employment Areas. The only sector with a majority of its total employment within General Employment Areas is the Utilities sector, where 72.8% of all employment totaling 2,960 jobs is within General Employment Areas. Employment Monitoring Areas
Employment Monitoring Areas (EMAs) are a new geography created to enable a nuanced geographic description of employment activity occurring in Employment Areas across the
city. Map 3 shows the five EMAs that together represent the entirety of the city of Toronto: West, South, North-West, North-East, and East. Their boundaries were selected to follow major streets and group similar Employment Areas by general composition, such as the four predominantly office General Employment Areas within the North-East EMA. When referring to employment within EMAs, all references are to the employment located within Employment Areas unless noted otherwise. Figure 18 shows employment change in EMAs over the past five years. West The West EMA spans a similar area to that of the former municipality of Etobicoke and contains the largest amount of employment within Employment Areas of all the EMAs: 99,250 jobs or 24.9% of all employment within Employment Areas. The vast majority (89.1%) of these jobs are within Core
0%
10%
20%
30%
40%
50%
60%
70%
80%
90%
100%
2013 2014 2015 2016
Agriculture, Forestry, Fishing and Hunting
Mining and Resource Extraction
Utilities
Construction
Manufacturing
Wholesale and Retail Trade
Transportation and Warehousing
Information and Cultural Industries
Finance and Insurance
Real Estate and Rental and Leasing
Professional, Scientif ic and Technical Services
Management of Companies and Enterprises
Administrative, Support, and Waste Services
Educational Services
Health Care and Social Assistance
Arts, Entertainment and Recreation
Accommodation and Food Services
Other Services (Except Public Administration)
Public Administration
Figure 16: Employment in Employment Areas by Major Sector

24 - Toronto City Planning - December 2016
Employment Areas. Since 2015, employment within the West EMA has grown by 1.9% or 1,860 jobs, growing by 4.3% or 4,090 jobs since 2013.
The West EMA also includes a small portion of the larger employment node surrounding Pearson International Airport, which is primarily located in Mississauga. This employment node, which has been referred to as the Airport Corporate Centre and the Airport Megazone, is the second largest employment concentration in Canada after Toronto’s downtown according to the 2011 Census.20
Top sectors within the West EMA include Manufacturing, with 22.5% of employment; Wholesale and Retail Trade, with 17.3% of employment; and Transportation and Warehousing, with 10.6% of employment (see Figure 19). However, Manufacturing jobs are decreasing, losing 1.5% or 340 jobs over the last year and 2.7% or 610 jobs over the last three years. The Management of Companies and Enterprises sector added the most employment in the West EMA over the last year, growing by 26.1% or 680 jobs, while the Professional, Scientific and Technical Services sector added the most employment over the past three years, growing by 17.6% or 1,300 jobs. North-West Covering the western portion of the former municipality of North York, the North-West EMA contributes 93,390 jobs 23.4% of all employment within Employment Areas. Roughly three quarters (75.4%) of this employment is within Core Employment Areas. Employment has increased in the North-West EMA over both the past year and the past three years, growing by 1.3% or 930 jobs since 2015 and 3.8% or 2,580 jobs since 2013.
The most prominent sector within the North-West EMA is Manufacturing, with 28.6% of employment (see Figure 20). Wholesale and Retail Trade follows with 22.6% of employment, as well as Professional, Scientific and Technical Services, with 7.4% of employment. Manufacturing experienced the largest absolute growth of any sector since 2015, up 1.9% or 500 jobs, though it has declined since 2013 by 160 jobs or 0.6%. Information and Cultural Industries lost the most employment since both 2015 and 2013, declining
by 110 jobs or 13.4% over the past year and 300 jobs or 29.7% over the past three years. Similarly to the West EMA, the Professional, Scientific and Technical Services sector added the most employment over the past three years, growing by 15.0% or 900 jobs. North-East The North-East EMA spans the eastern portion of the former municipality of North York and represents 61,820 jobs or 15.5% of employment with Employment Areas across Toronto. Though employment shrunk by 2.2% or 1,370 jobs since 2015, it has increased by 6.6% or 3,850 jobs since 2013. The North-East EMA is the only EMA to contain purely General Employment Areas, and has a wider sectoral diversity than the other EMAs.
Figure 17: Core and General Employment, 2016
63%
37%
Core Employment AreasGeneral Employment Areas
Figure 18: Employment Change in Employment Monitoring Areas, 2013-2016
0
10,000
20,000
30,000
40,000
50,000
60,000
70,000
80,000
90,000
100,000
South North-East East West North-West
2013 2016 Net Change

profile TORONTO - 25
Professional, Scientific and Technical Services account for 16.5% of jobs, while Finance and Insurance accounts for 13.4% and Information and Cultural Industries account for 8.3% (see Figure 21). Several sectors in the North-East experienced employment fluctuations over the last year with the relocation of large establishments, leading Real Estate and Rental and Leasing to
grow by 60.8% or 1,850 jobs, while Finance and Insurance lost 12.2% or 1,150 jobs. Since 2013, both the Manufacturing and Information and Cultural Industries sectors have lost over 1,300 jobs (22.1% and 21.1% respectively). During the same time period, Real Estate and Rental and Leasing gained 1,970 jobs or 67.1%, Finance and Insurance gained 1,490 jobs or 21.9%, and Management of Companies and Enterprises gained 1,220 jobs or 39.0%. East The East EMA covers almost the same geography as the former municipality of Scarborough and contributes 92,200 jobs or 23.1% of all employment within Employment Areas. While it has the lowest proportion of jobs in Core Employment Areas compared to General Employment Areas, jobs in Core Employment Areas still represent a majority (60.4%). Employment has increased in the East EMA over both the past year and the past three years, growing by 1.5% or 1,350 jobs since 2015 and 2.1% or 1,870 jobs since 2013.
The East EMA has the same top three sectors as the West EMA: Manufacturing, with 24.3% of employment; Wholesale and Retail Trade, with 18.5% of employment; and Transportation and Warehousing, with 8.5% of employment (see Figure 22). In fact, Manufacturing employment is the largest component of each of the three largest EMAs (West, North-West, and East). Transportation and Warehousing has gained employment since both 2015 and 2013, growing by 550 jobs or 7.5% over the past year and by 700 jobs or 9.9% over the past three years. Manufacturing jobs have declined during the same time periods, by 100 jobs or 0.4% since 2015, and by 610 jobs or 2.7% since 2013. The Real Estate and Rental and Leasing sector added the most jobs since 2013 with 52.8% or 830 new jobs in the sector. South The South EMA encompasses approximately the same area as the former municipalities of the City of Toronto, York, and East York combined. At 13.0% and 51,680 jobs, it has the smallest share of employment within Employment Areas in the city. About 7 out of 10 of these jobs (70.4%) are within
22.5%
17.3%
10.6%8.7%
7.0%
33.9%
Manufacturing
Wholesale and Retail Trade
Transportation and Warehousing
Professional, Scientif ic and Technical Services
Construction
All other sectors
Figure 19: West EMA by NAICS Sector
Figure 20: North-West EMA by NAICS Sector
28.6%
22.6%7.4%
7.1%
6.5%
27.9%
Manufacturing
Wholesale and Retail Trade
Professional, Scientif ic and Technical Services
Construction
Transportation and Warehousing
All other sectors
Figure 21: North-East EMA by NAICS Sector
16.5%
13.4%
8.3%
8.0%7.9%
46.0%
Professional, Scientif ic and Technical Services
Finance and Insurance
Information and Cultural Industries
Administrative, Support and Waste Services
Real Estate and Rental and Leasing
All other sectors

26 - Toronto City Planning - December 2016
NA
ICS
EA T
ype
East
Nor
th-E
ast
Nor
th-W
est
Wes
t20
1320
1420
1520
1620
1320
1420
1520
1620
1320
1420
1520
1620
1320
1420
1520
16A
gric
ultu
re, F
ores
try, F
ishi
ng a
nd
Hun
ting
Cor
e10
1010
00
00
00
00
00
00
10
Gen
eral
00
00
00
00
00
00
00
00
Min
ing
and
Res
ourc
e E
xtra
ctio
nC
ore
00
00
00
00
00
00
00
00
Gen
eral
00
00
200
00
00
00
00
00
0U
tiliti
esC
ore
120
120
7070
00
00
00
00
310
500
510
590
Gen
eral
390
470
400
570
2,69
02,
570
2,72
02,
230
100
190
150
160
00
00
Con
stru
ctio
nC
ore
4,38
04,
440
4,50
04,
560
00
00
5,10
05,
340
5,44
05,
560
5,99
06,
830
6,65
06,
620
Gen
eral
1,30
01,
430
980
1,00
082
01,
070
1,04
01,
160
1,15
01,
300
1,26
01,
030
200
220
280
280
Man
ufac
turin
gC
ore
18,2
9018
,340
18,0
5017
,620
00
00
25,3
2024
,690
24,6
2025
,050
21,7
0020
,870
20,9
5020
,690
Gen
eral
4,76
04,
360
4,48
04,
810
5,90
05,
700
5,30
04,
600
1,51
01,
540
1,55
01,
610
1,28
01,
200
1,76
01,
680
Tran
spor
tatio
n an
d W
areh
ousi
ngC
ore
6,31
06,
330
6,35
06,
530
00
00
4,99
05,
630
5,70
05,
650
9,55
09,
380
10,0
8010
,020
Gen
eral
830
810
950
1,31
059
055
059
062
028
036
039
038
074
055
046
051
0In
form
atio
n an
d C
ultu
ral
Indu
strie
sC
ore
3,08
02,
820
2,95
02,
800
00
00
840
630
620
530
1,86
02,
150
2,65
02,
110
Gen
eral
860
860
860
930
6,48
05,
420
5,71
05,
120
140
170
180
160
210
280
270
320
Fina
nce
and
Insu
ranc
eC
ore
370
460
400
410
00
00
460
490
560
650
1,22
01,
570
1,00
01,
140
Gen
eral
1,22
01,
420
1,40
01,
580
6,78
06,
370
9,42
08,
270
480
460
470
390
240
250
220
240
Rea
l Est
ate
and
Ren
tal a
nd
Leas
ing
Cor
e59
061
077
076
00
00
086
090
097
01,
050
2,07
02,
210
2,01
02,
010
Gen
eral
990
1,28
01,
450
1,65
02,
930
2,65
03,
040
4,89
076
076
076
092
072
084
01,
040
1,12
0P
rofe
ssio
nal,
Sci
entifi
c an
d Te
chni
cal S
ervi
ces
Cor
e3,
640
3,39
03,
270
2,94
00
00
04,
220
4,75
04,
950
5,17
07,
210
7,79
08,
130
8,56
0
Gen
eral
1,48
01,
630
1,84
02,
020
9,64
010
,390
11,0
5010
,200
1,80
01,
700
1,60
01,
760
170
160
130
120
Man
agem
ent o
f Com
pani
es a
nd
Ent
erpr
ises
Cor
e2,
910
2,86
02,
930
2,94
00
00
01,
030
940
890
1,12
03,
240
2,55
02,
550
3,23
0
Gen
eral
7070
8070
3,12
02,
930
4,53
04,
340
870
650
680
830
3030
3030
Adm
inis
trativ
e, S
uppo
rt an
d W
aste
Ser
vice
sC
ore
3,25
03,
170
3,05
02,
820
00
00
3,01
03,
310
3,29
03,
130
4,30
04,
390
4,18
04,
890
Gen
eral
1,63
02,
050
1,74
02,
070
4,52
04,
460
4,67
04,
930
920
1,01
01,
010
1,24
016
014
018
014
0E
duca
tiona
l Ser
vice
sC
ore
320
340
390
450
00
00
570
700
700
760
330
410
440
480
Gen
eral
1,11
01,
190
1,23
01,
400
1,42
01,
690
1,79
01,
950
440
470
480
550
120
130
130
140
Hea
lth C
are
and
Soc
ial
Ass
ista
nce
Cor
e93
054
054
053
00
00
079
01,
080
900
900
1,58
01,
690
1,86
02,
240
Gen
eral
3,11
02,
920
2,76
03,
010
2,52
03,
380
3,53
03,
420
1,63
01,
350
1,44
01,
430
240
250
270
280
Arts
, Ent
erta
inm
ent a
nd
Rec
reat
ion
Cor
e16
015
020
021
00
00
01,
080
1,52
080
078
02,
110
2,00
01,
940
1,92
0
Gen
eral
570
530
570
620
830
750
760
840
310
280
360
370
8080
7010
0A
ccom
mod
atio
n an
d Fo
od
Ser
vice
sC
ore
530
520
540
490
00
00
380
440
490
520
3,69
03,
800
3,88
03,
840
Gen
eral
3,01
02,
860
3,01
03,
040
1,99
02,
060
2,17
02,
020
1,93
02,
040
2,09
02,
170
1,63
01,
560
1,58
01,
600
Oth
er S
ervi
ces
(Exc
ept P
ublic
A
dmin
istra
tion)
Cor
e2,
340
2,71
02,
650
2,74
00
00
03,
110
3,35
03,
330
3,16
03,
850
3,85
03,
750
3,68
0
Gen
eral
2,10
02,
280
2,37
02,
410
1,87
01,
840
1,98
02,
040
1,17
01,
240
1,40
01,
440
280
310
320
340
Pub
lic A
dmin
istra
tion
Cor
e1,
750
2,03
01,
980
1,95
00
00
02,
330
2,75
02,
480
2,51
02,
950
3,46
02,
900
2,97
0G
ener
al1,
120
1,06
091
0 87
01,
640
1,43
01,
460
1,65
01,
390
1,26
01,
240
1,23
014
021
021
020
0W
hole
sale
and
Ret
ail T
rade
Cor
e7,
400
7,64
07,
770
7,91
00
00
013
,690
13,5
1013
,700
13,8
0013
,170
12,6
3013
,360
13,3
70G
ener
al9,
380
9,16
09,
370
9,12
04,
030
3,90
03,
450
3,56
07,
010
6,72
06,
900
7,32
03,
820
3,76
03,
580
3,76
0N
ot C
oded
Cor
e30
3030
100
00
010
1010
3010
1030
30G
ener
al10
010
1010
00
00
00
300
00
0To
tal
Cor
e56
,410
56,5
0056
,450
55,7
100
00
067
,790
70,0
4069
,440
70,3
7085
,120
86,0
9086
,870
88,4
00G
ener
al33
,930
34,3
7034
,410
36,4
9057
,970
57,1
6063
,190
61,8
2021
,910
21,5
0021
,950
23,0
2010
,050
9,98
010
,520
10,8
60G
rand
Tot
al90
,330
90,8
7090
,860
92,2
0057
,970
57,1
6063
,190
61,8
2089
,700
91,5
4091
,400
93,3
9095
,160
96,0
7097
,390
99,2
50
Tabl
e 6:
Tot
al E
mpl
oym
ent i
n Em
ploy
men
t Mon
itorin
g A
reas
by
Type
of E
mpl
oym
ent A
rea
and
NA
ICS,
201
3-20
16
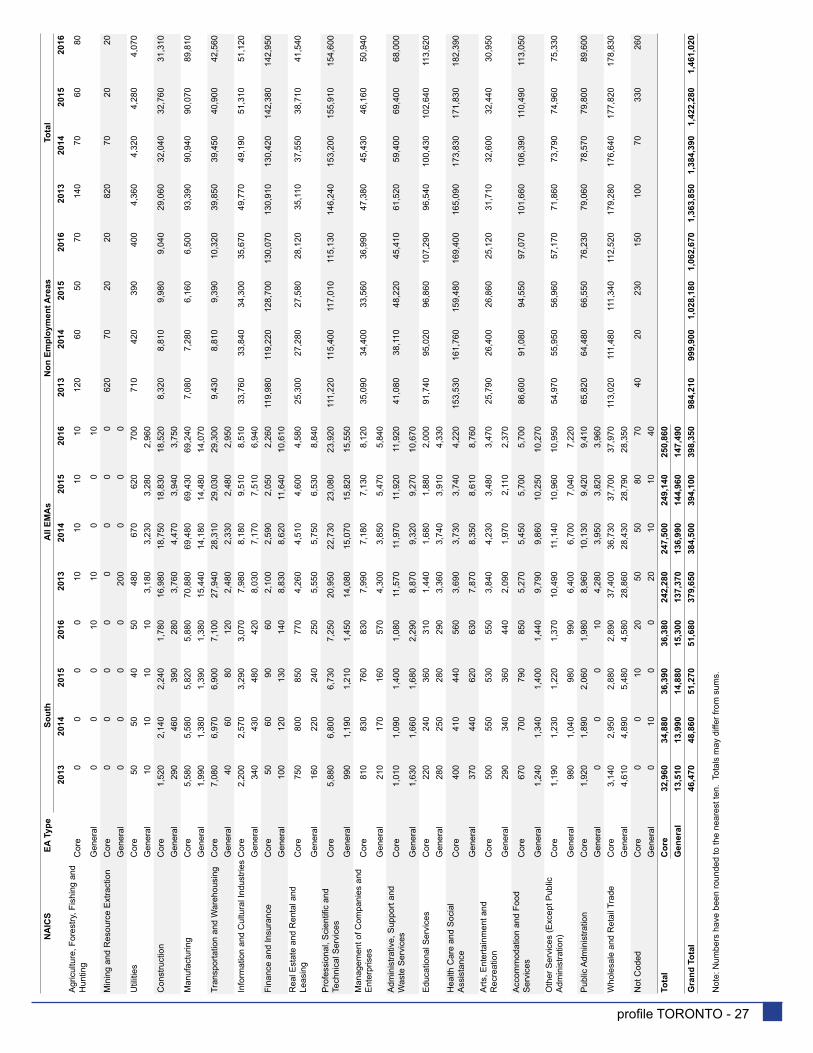
profile TORONTO - 27
NA
ICS
EA T
ype
Sout
hA
ll EM
As
Non
Em
ploy
men
t Are
asTo
tal
2013
2014
2015
2016
2013
2014
2015
2016
2013
2014
2015
2016
2013
2014
2015
2016
Agr
icul
ture
, For
estry
, Fis
hing
and
H
untin
gC
ore
00
00
1010
1010
120
6050
7014
070
6080
Gen
eral
00
010
100
010
Min
ing
and
Res
ourc
e E
xtra
ctio
nC
ore
00
00
00
00
620
7020
2082
070
2020
Gen
eral
00
00
200
00
0U
tiliti
esC
ore
5050
4050
480
670
620
700
710
420
390
400
4,36
04,
320
4,28
04,
070
Gen
eral
1010
1010
3,18
03,
230
3,28
02,
960
Con
stru
ctio
nC
ore
1,52
02,
140
2,24
01,
780
16,9
8018
,750
18,8
3018
,520
8,32
08,
810
9,98
09,
040
29,0
6032
,040
32,7
6031
,310
Gen
eral
290
460
390
280
3,76
04,
470
3,94
03,
750
Man
ufac
turin
gC
ore
5,58
05,
580
5,82
05,
880
70,8
8069
,480
69,4
3069
,240
7,08
07,
280
6,16
06,
500
93,3
9090
,940
90,0
7089
,810
Gen
eral
1,99
01,
380
1,39
01,
380
15,4
4014
,180
14,4
8014
,070
Tran
spor
tatio
n an
d W
areh
ousi
ngC
ore
7,08
06,
970
6,90
07,
100
27,9
4028
,310
29,0
3029
,300
9,43
08,
810
9,39
010
,320
39,8
5039
,450
40,9
0042
,560
Gen
eral
4060
8012
02,
480
2,33
02,
480
2,95
0In
form
atio
n an
d C
ultu
ral I
ndus
tries
Cor
e2,
200
2,57
03,
290
3,07
07,
980
8,18
09,
510
8,51
033
,760
33,8
4034
,300
35,6
7049
,770
49,1
9051
,310
51,1
20G
ener
al34
043
048
042
08,
030
7,17
07,
510
6,94
0Fi
nanc
e an
d In
sura
nce
Cor
e50
6090
602,
100
2,59
02,
050
2,26
011
9,98
011
9,22
012
8,70
013
0,07
013
0,91
013
0,42
014
2,38
014
2,95
0G
ener
al10
012
013
014
08,
830
8,62
011
,640
10,6
10R
eal E
stat
e an
d R
enta
l and
Le
asin
gC
ore
750
800
850
770
4,26
04,
510
4,60
04,
580
25,3
0027
,280
27,5
8028
,120
35,1
1037
,550
38,7
1041
,540
Gen
eral
160
220
240
250
5,55
05,
750
6,53
08,
840
Pro
fess
iona
l, S
cien
tific
and
Tech
nica
l Ser
vice
sC
ore
5,88
06,
800
6,73
07,
250
20,9
5022
,730
23,0
8023
,920
111,
220
115,
400
117,
010
115,
130
146,
240
153,
200
155,
910
154,
600
Gen
eral
990
1,19
01,
210
1,45
014
,080
15,0
7015
,820
15,5
50M
anag
emen
t of C
ompa
nies
and
E
nter
pris
esC
ore
810
830
760
830
7,99
07,
180
7,13
08,
120
35,0
9034
,400
33,5
6036
,990
47,3
8045
,430
46,1
6050
,940
Gen
eral
210
170
160
570
4,30
03,
850
5,47
05,
840
Adm
inis
trativ
e, S
uppo
rt an
d W
aste
Ser
vice
sC
ore
1,01
01,
090
1,40
01,
080
11,5
7011
,970
11,9
2011
,920
41,0
8038
,110
48,2
2045
,410
61,5
2059
,400
69,4
0068
,000
Gen
eral
1,63
01,
660
1,68
02,
290
8,87
09,
320
9,27
010
,670
Edu
catio
nal S
ervi
ces
Cor
e22
024
036
031
01,
440
1,68
01,
880
2,00
091
,740
95,0
2096
,860
107,
290
96,5
4010
0,43
010
2,64
011
3,62
0G
ener
al28
025
028
029
03,
360
3,74
03,
910
4,33
0H
ealth
Car
e an
d S
ocia
l A
ssis
tanc
eC
ore
400
410
440
560
3,69
03,
730
3,74
04,
220
153,
530
161,
760
159,
480
169,
400
165,
090
173,
830
171,
830
182,
390
Gen
eral
370
440
620
630
7,87
08,
350
8,61
08,
760
Arts
, Ent
erta
inm
ent a
nd
Rec
reat
ion
Cor
e50
055
053
055
03,
840
4,23
03,
480
3,47
025
,790
26,4
0026
,860
25,1
2031
,710
32,6
0032
,440
30,9
50
Gen
eral
290
340
360
440
2,09
01,
970
2,11
02,
370
Acc
omm
odat
ion
and
Food
S
ervi
ces
Cor
e67
070
079
085
05,
270
5,45
05,
700
5,70
086
,600
91,0
8094
,550
97,0
7010
1,66
010
6,39
011
0,49
011
3,05
0
Gen
eral
1,24
01,
340
1,40
01,
440
9,79
09,
860
10,2
5010
,270
Oth
er S
ervi
ces
(Exc
ept P
ublic
A
dmin
istra
tion)
Cor
e1,
190
1,23
01,
220
1,37
010
,490
11,1
4010
,960
10,9
5054
,970
55,9
5056
,960
57,1
7071
,860
73,7
9074
,960
75,3
30
Gen
eral
980
1,04
098
099
06,
400
6,70
07,
040
7,22
0P
ublic
Adm
inis
tratio
nC
ore
1,92
01,
890
2,06
01,
980
8,96
010
,130
9,42
09,
410
65,8
2064
,480
66,5
5076
,230
79,0
6078
,570
79,8
0089
,600
Gen
eral
00
010
4,28
03,
950
3,82
03,
960
Who
lesa
le a
nd R
etai
l Tra
deC
ore
3,14
02,
950
2,88
02,
890
37,4
0036
,730
37,7
0037
,970
113,
020
111,
480
111,
340
112,
520
179,
280
176,
640
177,
820
178,
830
Gen
eral
4,61
04,
890
5,48
04,
580
28,8
6028
,430
28,7
9028
,350
Not
Cod
edC
ore
00
1020
5050
8070
4020
230
150
100
7033
026
0G
ener
al0
100
020
1010
40To
tal
Cor
e32
,960
34,8
8036
,390
36,3
8024
2,28
024
7,50
024
9,14
025
0,86
0G
ener
al13
,510
13,9
9014
,880
15,3
0013
7,37
013
6,99
014
4,96
014
7,49
0G
rand
Tot
al46
,470
48,8
6051
,270
51,6
8037
9,65
038
4,50
039
4,10
039
8,35
098
4,21
099
9,90
01,
028,
180
1,06
2,67
01,
363,
850
1,38
4,39
01,
422,
280
1,46
1,02
0
Not
e: N
umbe
rs h
ave
been
roun
ded
to th
e ne
ares
t ten
. To
tals
may
diff
er fr
om s
ums.

28 - Toronto City Planning - December 2016
Core Employment Areas. Employment stayed fairly stable in the South EMA over the past year, adding 0.8% or 410 jobs, but saw a significant 11.2% increase of 5,210 jobs since 2013. Most of this increase resulted from job growth in Core Employment Areas, which increased by 10.4% or 3,420 jobs since 2013.
Similarly to the North-East EMA, the Professional, Scientific and Technical Services sector has the largest share of employment at 16.8% (see Figure 23). The Wholesale and Retail Trade sector follows with 14.4% of employment, while Manufacturing and Transportation and Warehousing are tied with 14.0% each. Professional, Scientific and Technical Services have experienced the most absolute employment growth in the South EMA over both the past year and the past three years, growing by 770 jobs or 9.6% since 2015 and by 1,840 jobs or 26.8% since 2013. Despite losing 290 jobs or 7.5% over the last year, Information and Cultural Industries have grown by 950 jobs or 37.2% since 2013. The growth of both of these office-based, skilled employment sectors in the South EMA reflects the tendency of this type of employment to locate in the Downtown area. Meanwhile, the Wholesale and Retail Trade sector has lost 900 jobs or 10.7% over the past year and 290 jobs or 3.7% over the past three years. Insights Each year, the Toronto Employment Survey explores selected features of employment in Toronto. This year, we examined on-going efforts to improve the quality of NAICS data and assessed the distribution of establishments across the city by comparing the Survey’s establishment counts to similar data from Statistics Canada’s Business Patterns and Environics Analytics’ Business Locations data sets. NAICS As described earlier in this bulletin, City Planning incorporated the North American Industry Classification System (NAICS) into the data collection processes of the Toronto Employment Survey in 2011. NAICS is designed to capture supply-side “production processes” such that
processes based on similar technologies are grouped together. According to Statistics Canada, it is a “supply-based, or production-oriented, economic concept [to be used for] measuring productivity, unit labour costs, and capital intensity of production, estimating employment-output relationships, constructing input-output tables, and other uses that imply the analysis of production relationships in the economy”21.
How Are Establishments Coded? NAICS coding is extremely detailed and highly specific. Coding the data to the lowest, most detailed level enables it to be aggregated to higher levels for analytic and comparative purposes. Surveyors classify the establishments starting from the major industry sectors, then progress through the hierarchy to the most detailed 6-digit code. Each surveyor is equipped with tools to assist with coding, including a reference document listing all NAICS codes and the Industry Classification Coding System (ICCS) search tool available from Statistics Canada. The ICCS is an application
Figure 22: East EMA by NAICS Sector
Figure 23: South EMA by NAICS Sector
24.3%
18.5%
8.5%6.0%5.6%
37.1%
Manufacturing
Wholesale and Retail Trade
Transportation and Warehousing
Construction
Other Services (Except Public Administration)
All other sectors
16.8%
14.4%
14.0%
14.0%
6.7%
34.0%
Professional, Scientif ic and Technical Services
Wholesale and Retail Trade
Manufacturing
Transportation and Warehousing
Information and Cultural Industries
All other sectors

profile TORONTO - 29
that allows surveyors to enter a description of an establishment’s principal activity, and to get a list of potential 2007 NAICS codes, which match this description.22 However, the ICCS was discontinued once the 2012 NAICS was introduced. To bridge the gap between the 2007 and 2012 NAICS, surveyors used a concordance list that shows the relationship between the sets of codes for those areas of the classification which have changed in terms of structure and content.23
To collect NAICS codes, surveyors collect data on the establishments’ economic activities through conducting interviews and observing activities on-site. Coding is performed immediately after an establishment is surveyed. If surveyors are uncertain of an establishment’s code, they record detailed notes for further research and follow up with the establishment by telephone or email at a later time. Coding Challenges NAICS is revised every five years to keep the classification system current with changes in economic activities. However, despite frequent revision and more than 2,000 NAICS codes to choose from, surveyors often encounter difficulties finding appropriate codes for new and unique businesses. To maintain pace with market demands and consumer preferences, the nature of businesses change frequently, and many new types of businesses offering unique products and services are introduced in Toronto every year. Surveyors rely on their training and ensure
consistent coding across both the survey team and the city to classify these businesses to the most appropriate categories available. Data Quality Assurance Measures All surveyors receive intensive NAICS coding training before field surveying begins. A large array of common and complex examples is presented during training to help surveyors build a solid understanding of NAICS coding.
Since NAICS coding was introduced to the Toronto Employment Survey, an increasing number of vigorous data verification and validation tools were implemented to improve data quality. Throughout the surveying period, the Employment Survey co-ordination team performs spot checks and field evaluations to ensure surveyors are coding establishments correctly. A validation tool is also programmed into the survey data collection software to identify invalid NAICS codes.
Once all field data is collected, thorough data validation measures are conducted. One of the measures identifies invalid codes, which include “unknown” codes that are meant to be used temporarily in the field when surveyors are unsure of how to code certain establishments or typographical errors resulting in invalid codes. Each case is subsequently investigated.
The comprehensiveness of these validation tools has produced fruitful results in improving data quality. The percentage of invalid NAICS codes
dropped from 3.3% in 2011 to 0.8% in 2016. The recoding exercises also yielded favourable results as well, as the use of 2 and 3-digit NAICS codes decreased to almost 0% from 2011 to 2016 while the use of 4 and 5-digit NAICS codes increased 15% and 60% respectively from the last six years (see Figure 24). In 2011, 92% of the establishments were coded with the most detailed 6-digit NAICS codes. In the subsequent five years, the average is 98%. City Planning continues to strive to improve the quality of the NAICS data.
Figure 24: NAICS Coding in the Toronto Employment Survey, 2011-2016
0%
10%
20%
30%
40%
50%
60%
70%
80%
2011 2012 2013 2014 2015 2016
2-digit NAICS codes 3-digit NAICS codes 4-digit NAICS codes 5-digit NAICS codes

30 - Toronto City Planning - December 2016
Establishment Count Comparison
In an additional effort to improve the quality and breadth of coverage of the Toronto Employment Survey, establishment data from the 2016 survey was compared to 2016 data from the Statistics Canada Business Register as well as the Environics Analytics’ Business Locations database.
As an establishment-based survey, the Toronto Employment Survey collects employment data through field visits to business establishments located in commercial, industrial, institutional and mixed use areas throughout the City of Toronto. The Survey is not currently designed to capture all those people who work from home, or employment activities that are “footloose” or not place-specific on a daily basis. A strategy for counting these workers is being studied by the City Planning Division. In the meantime, comparing the number and sectoral nature of establishments counted by the Toronto Employment Survey to those counted in the Business Register and Business Locations data sets can provide direction for improving the Survey’s fieldwork coverage. This evaluation will also serve to preface the 2017 Employment Bulletin’s sectoral comparison of Toronto Employment Survey data with the results of the 2016 long-form Census.
Statistics Canada’s Business Register is composed of “all active businesses in Canada that have a corporate income tax (T2) account, are an employer or have a GST account”.24 Data sources include tax filings from the Canada Revenue Agency, interviews with representatives of medium and large businesses, as well as internet and media review. Importantly, participation in the Business Register is mandatory – Statistics Canada has the authority to compel respondents to provide information. This results in a greater degree of data coverage than is possible by the voluntary Toronto Employment Survey, which depends on the goodwill of businesses to participate.
Environics Analytics’ Business Locations dataset is supplied by infoCanada, a data provision company that compiles information from sources including telephone directories, new business filings, utility connections, press releases, annual reports, and other internet and media research. In contrast to the Toronto Employment Survey’s field-based methodology, the Business Locations dataset is updated and verified via telephone interviews.23
Both the Business Register and Business Locations datasets counted more establishments than the Toronto Employment Survey. For the purposes of this comparison, establishment counts exclude establishments that are unclassified by NAICS sector and those without employment. The June 2016 release of the Business Register counted 91,820 establishments or 18.7% more than the Survey, which counted 74,690 establishments, while the 2016 release of Business Locations counted 84,030 establishments or 11.1% more than the Survey (see Figure 25). The Survey’s lower establishment count is to be expected since Statistics Canada can compel participation in the Business Register, and because of the complexity of capturing home-based and footloose employment through the Survey’s field and establishment-based format. Establishment Counts by Major NAICS Sector The differences between the numbers of establishments counted are particularly evident in certain major NAICS sectors, most notably Construction; Real Estate and Rental and Leasing; Professional, Scientific and Technical
Figure 25: Total Establishments Counted by Data Source, 2016
0 20,000 40,000 60,000 80,000 100,000
Business Register
Business Locations
Toronto Employment
Survey

profile TORONTO - 31
Services; Administrative and Support, Waste Management and Remediation Services; Health Care and Social Assistance; Accommodation and Food Services; and Other Services (Except Public Administration). In each of these sectors, the number of establishments counted by the Toronto Employment Survey differed from the number counted by both the Business Register and Business Locations by more than 1,000 establishments. In most sectors, the Survey counted fewer establishments, though in the Accommodation and Food Services and Other Services (Except Public Administration) sectors, the Survey counted more establishments.
Potential explanations for the differences in establishment counts amongst the three data sources when broken down by major NAICS sector include the ability to compel participation and challenges in capturing home-based and footloose employment, as well as differences in how establishments are classified. It is possible that what is classified as Other Services (Except Public Administration) by the Employment Survey, for example, is classified as Administrative and Support, Waste Management and Remediation Services by the Business Register or Business Locations. Establishment Counts by Geography In order to further examine differences in establishment coverage, establishment locations from the Toronto Employment Survey and Business Locations data sets were geocoded and mapped as shown in Map 4. Business Register data were only available at the Census Tract level and are therefore not included. Though a rough comparison at a city-wide scale, there are areas with visibly more Business Locations than Survey establishments. Map 1, on page 6 and 7, demonstrates that Survey establishments tend to be clustered along main streets and in areas designated for growth in the Official Plan, such as the Downtown, Centres, and Employment Areas. However, Business Locations are spread across the city, and are present even in areas with residential land use designations such as Neighbourhoods and Apartment Neighbourhoods. This suggests that some of the establishments being captured in the Business Locations dataset
but not in the Toronto Employment Survey are home-based. Case Study Area: Lawrence Avenue West and Bathurst Street A case study area was chosen to test the assumption that some of the difference in establishment counts between the Toronto Employment Survey and Business Locations data sets stems from the latter’s greater capture of home-based businesses. The area surrounding the intersection of Lawrence Avenue West and Bathurst Street was selected as an example of an area with noticeably more Business Locations establishments than Employment Survey establishments, as shown in the inset map of Map 4 on page 34.
Several Business Locations establishments were selected at random and identified based on their business or organization name and address. Online research was conducted to test whether these establishments were valid businesses and operating out of the correct locations, with 24 out of 28 establishments confirmed as correct and the remainder lacking sufficient data to confirm the precise location. Google Street View was used as a proxy for visual surveying to determine in what type of structure the establishments with confirmed addresses were located in and whether they could be reasonably identified as businesses by a surveyor in the field.
All of the establishments with confirmed locations were located in residential structures, with no signage or any other visible markers of employment activity. These types of establishments would not be captured by field surveyors, who visit visible places of work in commercial, industrial and institutional and mixed use areas. As a result, these findings reflect the assumption that part of the difference in the number of establishments counted between the Business Locations dataset and the Toronto Employment Survey results from the former’s wider coverage of home-based establishments.
Adjusted Non-Residential Area Establishment Counts To study the potential impact of the inclusion of home-based establishments within the Business

32 - Toronto City Planning - December 2016
Locations data set citywide, all Business Locations establishments were overlaid with Toronto’s Official Plan land use designations. Any establishments falling within purely residential land use designations (Neighbourhoods and Apartment Neighbourhoods) were identified and then excluded from the original number of Business Locations establishments in each major NAICS sector. The result is an adjusted Business Locations breakdown of establishment counts by residential and all other land use designations, as shown in Table 7.
When comparing the adjusted Business Locations establishment counts to the original Toronto Employment Survey establishment counts, the results are fairly similar – the difference in total establishments counted is 510 or 0.7%, compared to the 9,340 or 11.1% difference between the Survey and the original Business Locations data. The Toronto Employment Survey captures 99.3% of businesses outside of residential areas, which indicates that it is highly effective in capturing visible business establishments compared to alternatives sources.
There are a few sectors which have notable differences of more than 1,000 establishments between the data sources. The Construction sector has 1,480 more establishments counted in the adjusted Business Locations data than in the Survey, and the Real Estate and Rental and Leasing sector has 1,070 more. This is likely due to the footloose nature of construction and real estate work, where construction workers and real estate agents may have either no singular or multiple regular places of work. There are 1,560 fewer Professional, Scientific and Technical Services establishments in the Toronto Employment Survey than in the adjusted Business Locations data, but 2,470 more Other Services (Except Public Administration) establishments in the Survey than in adjusted Business Locations. This offset may result from the same establishment being classified differently in each of the two data sets. The Survey also counted a higher number of establishments than the adjusted Business Locations data set in two other sectors: Retail Trade and Accommodation and Food Services, by 1,590 and 2,280 establishments respectively. These sectors include establishments such as
convenience stores, cafés, and bed and breakfasts which may be found within residential land use designations and thus have been excluded from the adjusted Business Locations counts, resulting in a larger difference between the two data sets.
In order to further examine the impact of capturing or excluding establishments within residential land use designations, the approximate amount of employment contained at these establishments was estimated. Unlike the Toronto Employment Survey, the Business Locations data set does not provide precise employment counts but rather employment ranges such as one to four employees, five to nine employees, and so on. A conservative approach was taken, using the minimum value of the Business Locations’ employment range to provide an estimated employment count for each establishment in residential land use designations. The result is an estimated 65,280 jobs located at establishments within residential land use designations according to the Business Locations data set, which amounts to 4.5% of the total employment counted in 2016 by the Toronto Employment Survey. Clearly, there are establishments to be counted in residential areas of the city, but their share of total employment in Toronto is limited. Future Work The comparison of Toronto Employment Survey establishment counts with Statistics Canada’s Business Register and Environics Analytics’ Business Locations data sets demonstrates that the Survey is highly effective in capturing visible business establishments across the city. There may be opportunities to expand coverage of non-traditional establishments, and by extension, employment. These include establishments where employment activity is either not visible from the perspective of a field surveyor or does not regularly occur in one location. While the detailed analysis of establishment counts by major NAICS sector and geography undertaken here can help guide future directions for expanded coverage, further research will be required to develop a strategy for expanding the scope of the Toronto Employment Survey programme.

profile TORONTO - 33
Table 7: Business Locations and TES Establishments by Sector and Land Use Designation
NAICS SectorBusiness Locations
Establishments
Business Locations
Establishments in Residential
Areas
Business Locations
Establishments in All Other
Areas
TES Establishments
TES - Business Locations in All
Other AreasDifference
1 Agriculture, Forestry, Fishing and Hunting 30 0 30 10 -20 -66.7%
2 Mining and Resource Extraction 450 20 430 0 -430 -100.0%
3 Utilities 30 0 30 50 20 66.7%
4 Construction 4,100 810 3,290 1,810 -1,480 -45.0%
5 Manufacturing 4,340 240 4,100 3,420 -680 -16.6%
6 Wholesale Trade 3,880 350 3,530 3,080 -450 -12.7%
7 Retail Trade 13,540 1,090 12,450 14,040 1,590 12.8%
8 Transportation and Warehousing 1,120 180 940 970 30 3.2%
9 Information and Cultural Industries 2,020 200 1,820 1,270 -550 -30.2%
10 Finance and Insurance 3,920 300 3,620 3,070 -550 -15.2%
11 Real Estate and Rental and Leasing 3,660 490 3,170 2,100 -1,070 -33.8%
12 Professional, Scientific and Technical Services 11,250 1,300 9,950 8,390 -1,560 -15.7%
13 Management of Companies and Enterprises 110 10 100 570 470 470.0%
14 Administrative, Support, and Waste Services 3,370 420 2,950 2,310 -640 -21.7%
15 Educational Services 2,430 450 1,980 2,900 920 46.5%
16 Health Care and Social Assistance 10,420 1,210 9,210 8,370 -840 -9.1%
17 Arts, Entertainment and Recreation 1,500 240 1,260 1,420 160 12.7%
18 Accommodation and Food Services 6,900 390 6,510 8,790 2,280 35.0%
19 Other Services (Except Public Administration) 9,850 1,040 8,810 11,280 2,470 28.0%
20 Public Administration 1,110 90 1,020 850 -170 -16.7%
Total 84,030 8,830 75,200 74,690 -510 -0.7%
Note: Numbers have been rounded to the nearest ten. Uncoded establishments have been excluded for this comparison.

34 - Toronto City Planning - December 2016

profile TORONTO - 35
End Notes
1 City of Toronto, Economic Development & Culture. Toronto at a Glance 2015.
2 Statistics Canada. Labour Force Survey. 2016.
3 City of Toronto, Economic Development & Culture.
4 City of Toronto, Economic Development & Culture. City of Toronto Annual Economic Dashboard 2015.
5 All data in this Bulletin are from the Toronto Employment Survey unless otherwise indicated.
6 Statistics Canada. CANSIM Table 379-0031. 2016.
7 RBC Economics Research. Economic and Financial Market Outlook. September 2016.
8 TD Economics. Canadian Real GDP. September 30, 2016.
9 City of Toronto, City Planning Division, Research and Information. How Does the City Grow. September 2016.
10 CBRE Research. Toronto Office MarketView, Q2 2016.
11 The Globe and Mail. How Deloitte landed in its new digs. October 20, 2016.
12 City of Toronto, Economic Development & Culture. Toronto Economic Bulletin. October 2016.
13 Cushman Wakefield. MarketBeat: Retail Snapshot Q4 2015.
14 CBRE Research. Toronto Industrial MarketView, Q2 2016.
15 City of Toronto, City Planning Division, Research and Information. Land Use Information System II. Last accessed October 14, 2016.
16 As the boundaries of the Sheppard Avenue Commerical Area Secondary Plan and the Sheppard East Subway Corridor Secondary Plan overlap, the same employment and establishments may appear in more than one Secondary Plan area.
17 Ontario Ministry of Infrastructure. Places to Grow. Web page at https://www.placestogrow.ca/index.php, last updated February 14, 2013.
18 Ontario Ministry of Infrastructure. Growth Plan for the Greater Golden Horseshoe, Schedule 3, 2013. Web page at https:// www.placestogrow.ca/index.php?option=com_content&task=view&id=359&Itemid=12, accessed November 21, 2016.
19 City of Toronto, City Planning Division. Official Plan Amendment 231. Web page at http://www.toronto.ca/legdocs/mmis/2013/pg/bgrd/backgroundfile-63574.pdf, accessed November 21, 2016.
20 Neptis Foundation. Unlocking the potential of the Airport Megazone. October 2016. Web page at http://www.neptis.org/publications/unlocking-potential-airport-megazone, last accessed November 29, 2016.
21 Statistics Canada. North American Industrial Classification System (NAICS) Canada 2012. Web page at http://www.statcan.gc.ca/subjects-sujets/standard-norme/naics-scian/2012/preface-eng.htm, last updated January 10, 2013.
22 Statistics Canada. Industry Classification Coding System (ICCS). Web page at http://publications.gc.ca/site/eng/338756/publication.html, last updated April 3, 2013.
23 Statistics Canada. Concordance: North American Industry Classification System (NAICS) Canada 2007 to North American Industry Classsification System (NAICS) Canada 2012. Web page at http://www.statcan.gc.ca/eng/subjects/standard/naics/2012/concordances-2007-2012-2, last updated April 8, 2015.
24 Statistics Canada. Business Register. Web page at http://www23.statcan.gc.ca/imdb/p2SV.pl?Function=getSurvey&SDDS=1105, last updated August 10, 2016.
25 infoCanada. Sales Leads and Marketing Lists. Web page at https://infogroup.infocanada.ca/sales-leads-and-mailing-lists/business-lists/, last accessed November 8, 2016.

36 - Toronto City Planning - December 2016
Please direct information inquiries and publication orders to:
City Planning Division Strategic Initiatives, Policy & Analysis Research and Information Metro Hall, 22nd Floor Toronto, Ontario M5V 3C6
Tel: 416-395-7196 Fax: 416-392-3821 TTY: 416-392-8764 e-mail: [email protected]