torsional fatigue performance of induction hardened 1045 and 10v45 steels
TRANSCRIPT
Torsional Fatigue Performance of Induction Hardened 1045 and 10V45 Steels
Lee Rothleutner, Robert Cryderman, and Chester J. Van Tyne George S. Ansell Dept. of Metallurgical and Materials Engineering,
Colorado School of Mines, Golden, CO 80401 USA [email protected]
Jody Burke
Gerdau Special Steel North America, Jackson, MI 49201 USA
Abstract
Microalloying of medium carbon bar steels is a common
practice for a number of traditional components; however, use
of vanadium microalloyed steels is expanding into
applications beyond their original designed use as controlled
cooled forged and hot rolled products and into heat treated
components. As a result, there is uncertainty regarding the
influence of vanadium on the properties of heat treated
components, specifically the effect of rapid heat treating such
as induction hardening. In the current study, the torsional
fatigue behavior of hot rolled and scan induction hardened
1045 and 10V45 bars are examined and evaluated at effective
case depths of 25, 32, and 44% of the radius. Torsional fatigue
tests were conducted at a stress ratio of 0.1 and shear stress
amplitudes of 550, 600, and 650 MPa. Cycles to failure are
compared to an empirical model, which accounts for case
depth as well as carbon content.
Introduction
Induction hardening of medium-carbon steels in the ferrite-
pearlite condition is common in applications such as
automotive shafts and forgings. The influence of vanadium
additions on the microstructure, mechanical properties, and
fatigue properties of wrought medium-carbon ferrite-pearlite
steels is well documented in literature [1-7]. However, only a
few studies have investigated the role of vanadium on
induction hardened component microstructures [8-11]. No
studies have investigated the direct influence of vanadium on
fatigue performance. A fundamental understanding of
vanadium’s role in microstructural evolution during induction
hardening and its effect on the fatigue performance of
medium-carbon steel will allow further optimization of
processing and alloy design, potentially improving component
performance.
Torsional Fatigue
Three torsional fatigue studies of induction hardened medium-
carbon steels were found in literature that provided insight for
the current study. Hurd [12] studied both smooth and splined
20 mm diameter induction hardened shafts at case depths of 3,
4, and 7 mm. Although two alloys were used in the study,
SAE 1050H and 38B3, only data from the 1050H was
discussed in the paper. Hurd found that fatigue failures, for all
case depths investigated, were surface initiated at high shear
stress amplitudes. In these surface initiated specimens,
initiation and early crack growth were observed in Mode III
on the order of 1 mm in length and occurred along
longitudinal shear planes which were followed by a Mode I,
normal stress, crack propagation to failure. The longitudinal
crack growth is believed to be a result of linking micro-cracks
initiated at inclusions in the crack plane [12]. At low shear
stress amplitudes, Hurd observed the lowest case depth
condition initiated failure sub-surface at the case-core
transition then propagated in a variety of complex growth
modes. The second study examined was by
Ochi et al. [13, 14]. Ochi et al. studied three plain-carbon
steels (0.35, 0.41, and 0.54 wt. % C) and of each alloy, three
case depths were examined ranging from 2.1 to 6.8 mm in a
20 mm diameter test specimen. Ochi et al. observed similar
results to those found by Hurd in that high shear stress
amplitudes resulted in surface initiated failure while low
amplitudes initiated failure sub-surface. However, Ochi et al.
observed a shift in initiation from surface to sub-surface that
was not only a function of case depth but also a function of
carbon content. As case depth and shear stress amplitude
decreased for a given carbon content, failure initiation shifted
from surface to sub-surface. This change is in agreement with
the observations made by Hurd [12]. In the third study,
Cryderman et al. [15] looked at the influence of continuous
cast section size on the torsional fatigue performance of
induction hardened SAE 1050. Four slight variations in carbon
content were tested (0.52 to 0.56 wt. % C) at a nominal case
depth of 4.4 mm in a 12.8 mm diameter test specimen.
Although negligible differences between the torsional fatigue
performance of the steels were observed, differences in
initiation mode were noted. At high shear stress amplitude
initiation occurred along longitudinal shear planes, Mode III,
while at low strains, or low shear stress amplitudes, initiation
occurred due to normal stresses, Mode I. Table 1 shows a
summary of the aforementioned torsional fatigue studies
regarding carbon contents and effective case depths examined.
One important note about the three studies shown in Table 1
regards the stress ratio. Two of the studies did not report the
stress ratio of the torsional fatigue data. Nevertheless, a study
by Hurd and Irving [16] showed that stress ratio does not play
a significant role in torsional fatigue life. Figure 1 shows all
159 observations of torsional fatigue data for the conditions
summarized in Table 1. The data span a very broad range of
Proceedings of the 28th ASM Heat Treating Society Conference October 20–22, 2015, Detroit, Michigan, USA
Copyright © 2015 ASM International® All rights reserved
asminternational.org
600

cycles to failure, 100 to 3 million cycles, and shear stress
amplitude, 400 to 1200 MPa.
Table 1: Induction Hardened Torsional Fatigue Data
Reference C (wt. %)
Normalized
Effective
Case Depth, t/r
Stress
Ratio
Hurd [12] 0.50 0.30 / 0.40 / 0.70 NR
Ochi
et al. [13]
0.35
0.41
0.54
0.21 / 0.34 / 0.48
0.25 / 0.42 / 0.62
0.37 / 0.52 / 0.68
NR
Cryderman
et al. [15]
0.52
0.54
0.56
0.54
0.33
0.34
0.35
0.35
-1
Figure 1: Torsional fatigue life data (finite only) of induction
hardened medium carbon steel shafts from the
literature [12, 13, 15].
Experimental Procedures
Materials
Two grades of SAE 1045 were produced for this research, one
with aluminum additions and one with vanadium additions,
designated as 1045 and 10V45 respectively. Both alloys were
continuous cast as separate industrial heats and hot rolled to a
final diameter of 39.7 mm, giving a reduction ratio of
18.8 to 1. Table 2 shows the nominal chemical composition
for both alloys. Sulfur levels are much lower than most
commercially produced SAE 1045 heats to reduce, and
possibly eliminate, fatigue crack nucleation at inclusions
during fatigue testing. Slight differences in chemistry, other
than aluminum, vanadium, and nitrogen, are observed between
the 1045 and 10V45. The 10V45 has slightly higher carbon,
manganese, and silicon levels. As a result, ideal diameter (DI)
calculations differ between the two steels, 36.0 mm for the
1045 and 45.5 mm for the 10V45 (39.9 mm without including
the vanadium), and will be considered during the analysis of
the results [17].
Table 2: Chemical Composition of Materials in wt. %
Steel C* Mn Si Ni Cr Mo
1045 0.44 0.74 0.23 0.10 0.12 0.03
10V45 0.47 0.82 0.28 0.09 0.12 0.03
Steel V Al N S P Cu
1045 0.002 0.016 0.0068 0.006 0.010 0.26
10V45 0.080 0.007 0.0100 0.009 0.007 0.22
* Standard deviation of 0.01 wt. % (n=5) for each steel.
Figure 2 shows representative secondary electron SEM images
of the two materials in the hot-rolled condition taken from the
mid-radius of the round bar and transverse to the rolling
direction. Microstructures are ferrite-pearlite with the 10V45
having markedly smaller ferrite grain size and ferrite fraction.
The 1045 has 16.9 ± 2.0 % ferrite with a ferrite grain size of
6.4 ± 3.9 µm while the 10V45 has 13.5 ± 1.5 % ferrite with a
ferrite grain size of 3.3 ± 2.8 µm. These differences in
microstructure, as well as the vanadium additions to the
10V45, result in large differences in hardness, 217 ± 5 HV1kg
for the 1045 and 281 ± 9 HV1kg for the 10V45.
(a) (b)
Figure 2: Representative secondary electron SEM images of
as-hot rolled (a) 1045 and (b) 10V45 steels.
Specimen Design
Both torsional fatigue and induction hardening requirements
were considered in designing the test specimen for the current
study. Figure 3 shows a schematic of the torsional fatigue
specimen. The shallow U-shaped groove torsional fatigue
specimen design provides minimal stress concentration (<1%)
and results in a region approximately 15 mm long in the center
of the specimen that is within 95% of maximum shear stress.
This design allows a reasonable volume of material to be
fatigue tested while facilitating induction hardening by both
scanning and single-shot methods. Specimens were machined
from the center of the as-hot rolled 1045 and 10V45.
Figure 3: Torsional fatigue sample designed for this study.
Dimensions in mm.
601

Induction Hardening
Hot rolled specimens were scan induction hardened to
nominal normalized effective case depths (t/r) of 0.25 (low),
0.32 (medium), and 0.44 (high) using a single turn coil on a
100 kW/200 kHz power supply. The low and high case depth
conditions used identical setups with the high case depth
simply having a slower scan speed (17.3 mm/s) than the low
case depth (22.9 mm/s). To achieve the medium case depth, a
pre-heat cycle and quench delay were incorporated into the
setup used for the low and high case depth conditions.
Figure 4 shows transverse macrographs of 10V45 torsional
fatigue specimens at maximum shear stress (minimum
diameter) illustrating low, medium, and high case depths.
Figure 5 shows representative secondary electron SEM images
of the martensitic case microstructure of the 10V45 steel in the
low and high case depth conditions. The high case depth
condition does appear to have a coarser martensitic structure
due to the longer austenitizing time which resulted from the
slower scan speed needed to achieve the high case depth.
(a) (b) (c)
Figure 4: Macrographs of (a) low (25%), (b) medium
(32%), and (c) high (44%) case depths in the
10V45 steel at maximum shear stress location.
(a) (b)
Figure 5: Representative secondary electron SEM images of
the martensitic case microstructure of (a) low case
depth and (b) high case depth conditions in 10V45.
Figure 6 shows spline curve fits for radial microhardness data
for the low (L), medium (M), and high (H) case depth in the
1045 steel at the specimen minimum diameter. The SAE
specification for effective case depth for a 0.45 wt. % C steel
is indicated [18]. All three conditions show similar case peak
hardness as well as core hardness. Figure 7 shows spline curve
fits for radial microhardness data for the low (L), medium
(M), and high (H) case depth in the 10V45 steel at the
specimen minimum diameter. The medium and high case
depths have similar case peak hardness and core hardness
while the low case depth shows significantly higher case peak
hardness as well as possible over aging at the case/core
transition region. The 10V45 conditions showed slightly
higher case hardness as well as core hardness as compared to
the 1045 conditions. The higher core hardness of the 10V45 is
a result of both precipitation strengthening from the vanadium
as well as the higher pearlite fraction and smaller ferrite grain
size. The higher case hardness of the 10V45 is a result of the
slightly higher carbon content in addition to a possible
vanadium effect yet to be determined.
Figure 6: Spline fits for Vickers microhardness traverses at
torsional fatigue specimen minimum diameter
(maximum shear stress location) for 1045 steel.
Figure 7: Spline fits for Vickers microhardness traverses at
torsional fatigue specimen minimum diameter
(maximum shear stress location) for 10V45 steel.
602
Torsional Fatigue
Appropriate stress levels for torsional fatigue testing were
determined by establishing an empirical model from the data
presented in Table 1 and Figure 1. The following multiple
linear regression model was developed
Shear Stress Amplitude (MPa) =
1115.379
– 169.815*log10(Nf)
+ 467.975*(wt. % C)
+ 445.416*(t/r)
(1)
where Nf is the number of cycles to failure between 102 and
3 x 10⁶ cycles, wt. % C is the carbon content of the steel in
wt. % between 0.35 and 0.56, and t/r is the normalized
effective case depth between 0.21 and 0.68. All variables were
found to be significant to the regression above the 99% level.
Standardized residuals as well as the predicted output are
normally distributed. The adjusted coefficient of determination
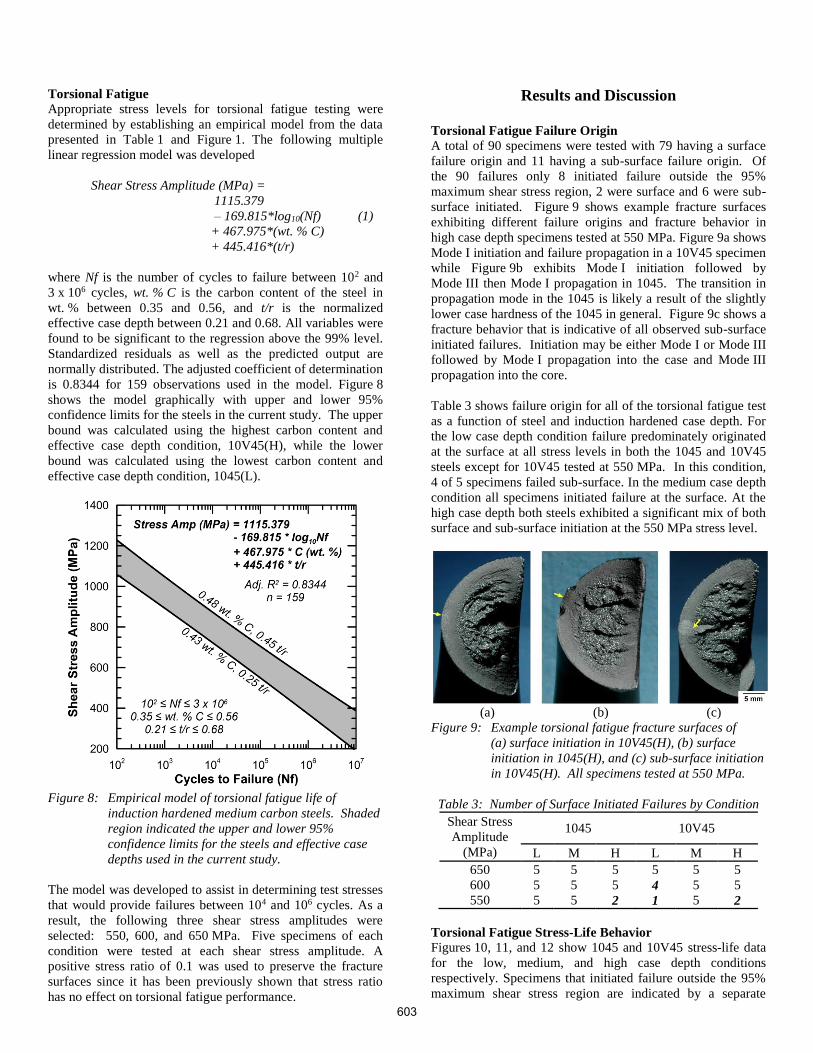
is 0.8344 for 159 observations used in the model. Figure 8
shows the model graphically with upper and lower 95%
confidence limits for the steels in the current study. The upper
bound was calculated using the highest carbon content and
effective case depth condition, 10V45(H), while the lower
bound was calculated using the lowest carbon content and
effective case depth condition, 1045(L).
Figure 8: Empirical model of torsional fatigue life of
induction hardened medium carbon steels. Shaded
region indicated the upper and lower 95%
confidence limits for the steels and effective case
depths used in the current study.
The model was developed to assist in determining test stresses
that would provide failures between 104 and 106 cycles. As a
result, the following three shear stress amplitudes were
selected: 550, 600, and 650 MPa. Five specimens of each
condition were tested at each shear stress amplitude. A
positive stress ratio of 0.1 was used to preserve the fracture
surfaces since it has been previously shown that stress ratio
has no effect on torsional fatigue performance.
Results and Discussion
Torsional Fatigue Failure Origin
A total of 90 specimens were tested with 79 having a surface
failure origin and 11 having a sub-surface failure origin. Of
the 90 failures only 8 initiated failure outside the 95%
maximum shear stress region, 2 were surface and 6 were sub-
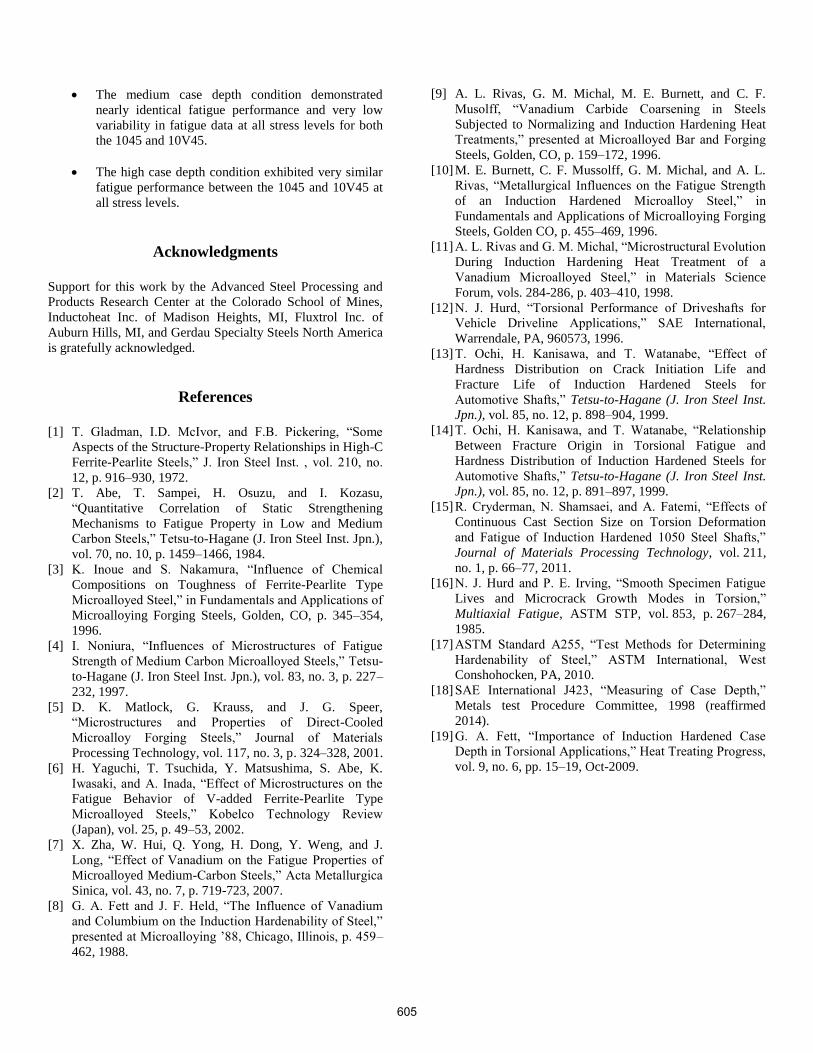
surface initiated. Figure 9 shows example fracture surfaces
exhibiting different failure origins and fracture behavior in
high case depth specimens tested at 550 MPa. Figure 9a shows
Mode I initiation and failure propagation in a 10V45 specimen
while Figure 9b exhibits Mode I initiation followed by
Mode III then Mode I propagation in 1045. The transition in
propagation mode in the 1045 is likely a result of the slightly
lower case hardness of the 1045 in general. Figure 9c shows a
fracture behavior that is indicative of all observed sub-surface
initiated failures. Initiation may be either Mode I or Mode III
followed by Mode I propagation into the case and Mode III
propagation into the core.
Table 3 shows failure origin for all of the torsional fatigue test
as a function of steel and induction hardened case depth. For
the low case depth condition failure predominately originated
at the surface at all stress levels in both the 1045 and 10V45
steels except for 10V45 tested at 550 MPa. In this condition,
4 of 5 specimens failed sub-surface. In the medium case depth
condition all specimens initiated failure at the surface. At the
high case depth both steels exhibited a significant mix of both
surface and sub-surface initiation at the 550 MPa stress level.
(a) (b) (c)
Figure 9: Example torsional fatigue fracture surfaces of
(a) surface initiation in 10V45(H), (b) surface
initiation in 1045(H), and (c) sub-surface initiation
in 10V45(H). All specimens tested at 550 MPa.
Table 3: Number of Surface Initiated Failures by Condition
Shear Stress
Amplitude
(MPa)
1045 10V45
L M H L M H
650 5 5 5 5 5 5
600 5 5 5 4 5 5
550 5 5 2 1 5 2
Torsional Fatigue Stress-Life Behavior
Figures 10, 11, and 12 show 1045 and 10V45 stress-life data
for the low, medium, and high case depth conditions
respectively. Specimens that initiated failure outside the 95%
maximum shear stress region are indicated by a separate
603

symbol on each plot. The 95% confidence limits for the
empirical model are superimposed for each condition for
comparison. The limits were calculated using the applicable
nominal effective case depth along with either 0.43 (lower
limit) or 0.48 wt. % C (upper limit).
In the low case depth condition (Figure 10), a noticeable
difference in fatigue life was observed at all shear stress
amplitudes between the 1045 and 10V45. The 10V45 has
significantly longer fatigue lives that more closely align with
the empirical model. The low case depth 10V45 was
measured to have a higher case hardness than all of the other
conditions tested which may be a reasonable explanation for
its improved fatigue performance.
In the medium case depth condition (Figure 11), fatigue lives
demonstrate very low variability at a given stress level and
appear to be independent of vanadium content. Although this
condition has both deeper effective and total case depths, the
fatigue life is notably worse than the 10V45 low case depth
condition. This result is contrary to literature stating total case
depth is closely related to fatigue performance [19]. This
result suggests the pre-heat cycle and/or the quench delay used
in processing the medium case depth condition may have
influenced factors such as residual stresses which significantly
influence fatigue behavior. In addition, the empirical model
over-predicts the fatigue life of the medium case depth
condition significantly.
In the high case depth condition (Figure 12), very little
difference was observed between the fatigue life of the 1045
and 10V45 steels. At 600 and 650 MPa the fatigue data of the
two steels overlay on each other and the empirical model over-
predicts the fatigue life of both the 1045 and 10V45. At
550 MPa the 1045 steel appears to have increased variability
in fatigue life resulting in the 10V45 having a slightly higher
average fatigue life. Although it is unclear for the 1045, the
empirical model appears to under-predict the fatigue life of the
10V45 steel at 550 MPa in this condition.
Figure 10: Cycles to failure as a function of shear stress
amplitude for the low effective case depth (25%)
condition. Calculated 95% confidence limits from
empirical model included for reference.
Figure 11: Cycles to failure as a function of shear stress
amplitude for the medium effective case depth
(32%) condition. Calculated 95% confidence
limits from empirical model included for reference.
Figure 12: Cycles to failure as a function of shear stress
amplitude for the high effective case depth (44%)
condition. Calculated 95% confidence limits from
empirical model included for reference.
Summary and Conclusions
The torsional fatigue performance of three induction hardened
effective case depths of commercially produced 1045 and
10V45 were compared. Effective case depths of 25, 32, and
44% were produced using a single coil scan-hardening system.
Five specimens per condition were fatigue tested in torsion at
shear stress amplitudes of 550, 600, and 650 MPa. An
empirical model was developed from literature data to
determine test stress levels as well as for comparison. The
most significant observations from the current study are as
follows.
The low case depth 10V45 condition exhibited
1. Significantly higher case hardness than any
other condition.
2. Superior fatigue performance compared to
the 1045 low case depth condition as well as
all medium case depth conditions.
3. Most closely fitting the empirical model of
any condition.
604
The medium case depth condition demonstrated
nearly identical fatigue performance and very low
variability in fatigue data at all stress levels for both
the 1045 and 10V45.
The high case depth condition exhibited very similar
fatigue performance between the 1045 and 10V45 at
all stress levels.
Acknowledgments
Support for this work by the Advanced Steel Processing and
Products Research Center at the Colorado School of Mines,
Inductoheat Inc. of Madison Heights, MI, Fluxtrol Inc. of
Auburn Hills, MI, and Gerdau Specialty Steels North America
is gratefully acknowledged.
References
[1] T. Gladman, I.D. McIvor, and F.B. Pickering, “Some
Aspects of the Structure-Property Relationships in High-C
Ferrite-Pearlite Steels,” J. Iron Steel Inst. , vol. 210, no.
12, p. 916–930, 1972.
[2] T. Abe, T. Sampei, H. Osuzu, and I. Kozasu,
“Quantitative Correlation of Static Strengthening
Mechanisms to Fatigue Property in Low and Medium
Carbon Steels,” Tetsu-to-Hagane (J. Iron Steel Inst. Jpn.),
vol. 70, no. 10, p. 1459–1466, 1984.
[3] K. Inoue and S. Nakamura, “Influence of Chemical
Compositions on Toughness of Ferrite-Pearlite Type
Microalloyed Steel,” in Fundamentals and Applications of
Microalloying Forging Steels, Golden, CO, p. 345–354,
1996.
[4] I. Noniura, “Influences of Microstructures of Fatigue
Strength of Medium Carbon Microalloyed Steels,” Tetsu-
to-Hagane (J. Iron Steel Inst. Jpn.), vol. 83, no. 3, p. 227–
232, 1997.
[5] D. K. Matlock, G. Krauss, and J. G. Speer,
“Microstructures and Properties of Direct-Cooled
Microalloy Forging Steels,” Journal of Materials
Processing Technology, vol. 117, no. 3, p. 324–328, 2001.
[6] H. Yaguchi, T. Tsuchida, Y. Matsushima, S. Abe, K.
Iwasaki, and A. Inada, “Effect of Microstructures on the
Fatigue Behavior of V-added Ferrite-Pearlite Type
Microalloyed Steels,” Kobelco Technology Review
(Japan), vol. 25, p. 49–53, 2002.
[7] X. Zha, W. Hui, Q. Yong, H. Dong, Y. Weng, and J.
Long, “Effect of Vanadium on the Fatigue Properties of
Microalloyed Medium-Carbon Steels,” Acta Metallurgica
Sinica, vol. 43, no. 7, p. 719-723, 2007.
[8] G. A. Fett and J. F. Held, “The Influence of Vanadium
and Columbium on the Induction Hardenability of Steel,”
presented at Microalloying ’88, Chicago, Illinois, p. 459–
462, 1988.
[9] A. L. Rivas, G. M. Michal, M. E. Burnett, and C. F.
Musolff, “Vanadium Carbide Coarsening in Steels
Subjected to Normalizing and Induction Hardening Heat
Treatments,” presented at Microalloyed Bar and Forging
Steels, Golden, CO, p. 159–172, 1996.
[10] M. E. Burnett, C. F. Mussolff, G. M. Michal, and A. L.
Rivas, “Metallurgical Influences on the Fatigue Strength
of an Induction Hardened Microalloy Steel,” in
Fundamentals and Applications of Microalloying Forging
Steels, Golden CO, p. 455–469, 1996.
[11] A. L. Rivas and G. M. Michal, “Microstructural Evolution
During Induction Hardening Heat Treatment of a
Vanadium Microalloyed Steel,” in Materials Science
Forum, vols. 284-286, p. 403–410, 1998.
[12] N. J. Hurd, “Torsional Performance of Driveshafts for
Vehicle Driveline Applications,” SAE International,
Warrendale, PA, 960573, 1996.
[13] T. Ochi, H. Kanisawa, and T. Watanabe, “Effect of
Hardness Distribution on Crack Initiation Life and
Fracture Life of Induction Hardened Steels for
Automotive Shafts,” Tetsu-to-Hagane (J. Iron Steel Inst.
Jpn.), vol. 85, no. 12, p. 898–904, 1999.
[14] T. Ochi, H. Kanisawa, and T. Watanabe, “Relationship
Between Fracture Origin in Torsional Fatigue and
Hardness Distribution of Induction Hardened Steels for
Automotive Shafts,” Tetsu-to-Hagane (J. Iron Steel Inst.
Jpn.), vol. 85, no. 12, p. 891–897, 1999.
[15] R. Cryderman, N. Shamsaei, and A. Fatemi, “Effects of
Continuous Cast Section Size on Torsion Deformation
and Fatigue of Induction Hardened 1050 Steel Shafts,”
Journal of Materials Processing Technology, vol. 211,
no. 1, p. 66–77, 2011.
[16] N. J. Hurd and P. E. Irving, “Smooth Specimen Fatigue
Lives and Microcrack Growth Modes in Torsion,”
Multiaxial Fatigue, ASTM STP, vol. 853, p. 267–284,
1985.
[17] ASTM Standard A255, “Test Methods for Determining
Hardenability of Steel,” ASTM International, West
Conshohocken, PA, 2010.
[18] SAE International J423, “Measuring of Case Depth,”
Metals test Procedure Committee, 1998 (reaffirmed
2014).
[19] G. A. Fett, “Importance of Induction Hardened Case
Depth in Torsional Applications,” Heat Treating Progress,
vol. 9, no. 6, pp. 15–19, Oct-2009.
605