torstar 1st quarter for pdf (page 18)metroland’s operating profit was $13.5 million in the first...
TRANSCRIPT

TORONTO STAR
METROLAND
CITYMEDIA GROUP
TORSTAR DIGITAL
HARLEQUIN ENTERPRISES
T O R S T A R C O R P O R A T I O N
1ST QUARTER REPORT
M A R C H 3 1 , 2 0 0 5

1
For the three months ended March 31, 2005 and 2004
The following review and analysis of Torstar Corporation’s (the “Company” or “Torstar”)operations and financial position for the three months ended March 31, 2005 and2004 should be read in conjunction with the audited consolidated financial statementsand Management’s Discussion and Analysis of Torstar Corporation for the year endedDecember 31, 2004 set forth in the Company’s Annual Report for such fiscal yearand incorporated by reference in the Company’s renewal Annual Information Formdated March 1, 2005.
Certain statements in this report may constitute forward-looking statements thatreflect management’s expectations regarding the Company’s future growth, results of operations, performance and business prospects and opportunities. Wherever possible, words such as “anticipate”, “believe”, “expect”, “intend” and similar expressions have been used to identify these forward-looking statements. Such forward-looking statements involve risks, uncertainties and other factors which maycause actual results, performance or achievements of the company to be materiallydifferent from any future results, performance or achievements expressed or impliedby such forward-looking statements. References in this discussion to “Torstar” are toTorstar Corporation and its subsidiaries.
Torstar reports its financial results under Canadian generally accepted accountingprinciples (“GAAP”). However, management believes that many of the company’sshareholders, creditors, other stakeholders and analysts prefer to assess the company’sperformance using earnings before interest, unusual items, taxes, depreciation andamortization of intangible assets (“EBITDA”) as an estimate of the cash generated bythe business, in addition to the GAAP measures. Torstar calculates segment EBITDAas operating profit before depreciation and amortization of intangible assets. Torstar’smethod of calculating EBITDA may differ from other companies and accordingly, maynot be comparable to measures used by other companies.
Torstar Corporation is a broadly based media company listed on the TorontoStock Exchange (TS.nv.b). Its businesses include newspapers led by theToronto Star, Canada’s largest daily newspaper; CityMedia Group, publishersof daily and community newspapers in Southwestern Ontario; MetrolandPrinting, Publishing & Distributing, publishers of more than 60 communitynewspapers in Southern Ontario; and Harlequin Enterprises, a leading globalpublisher of women’s fiction.
Torstar reports its operations in two segments: Newspapers and Book Publishing.
INTERIM MANAGEMENT’S DISCUSSION AND ANALYSIS

2
RESULTS OF OPERATIONS – First quarter 2005Overall PerformanceNewspaper revenues were $231.9 million in the first quarter of 2005, up $7.2 million or 3.2% from $224.7 million in the same period last year.Book publishing revenues were $129.2 million in the first quarter, down$7.9 million from $137.1 million in the first quarter of 2004. $4.7 millionof the decline in book publishing revenues was from the impact of foreignexchange rates net of gains realized on U.S. dollar hedge contracts. Totalrevenues were $361.1 million, down marginally from $361.7 million in 2004.
Newspaper operating profit was $16.5 million in the first quarter of 2005,down $2.1 million from $18.6 million in the first quarter of 2004. Thedecline was due to the impact of changes in the newspaper publishingschedule (timing of Easter and the number of Fridays) and the higherinvestment spending at Metroland and TTN, which were partially offset bycost savings realized at the Toronto Star and CityMedia daily newspapers.Book Publishing operating profits were $24.6 million in the quarter, down$1.5 million from $26.1 million in the same period last year. The decline in operating profits reflects the impact of lower sales volumes in all markets.
Corporate costs were $4.9 million in the first quarter of 2005, up $0.6 millionfrom $4.3 million in the same quarter last year. The increase in costs wasprimarily from higher stock-based compensation costs (both stock optionsand mark-to-market adjustments on deferred share units). Interest costswere $2.3 million in the quarter down from $2.8 million in 2004 as a resultof lower average debt levels during the quarter.
During the first quarter of 2005, Torstar completed the sale of the land andbuilding that had previously been occupied by The Record in Kitchener. The$1.4 million gain has been shown as an unusual item to avoid distortingtrends in operating income. On an after-tax basis, the gain contributed$0.01 per share in the quarter.
The effective tax rate in the first quarter of 2005 was 39.1%, up slightlyfrom 38.6% in the first quarter of 2004. Higher TTN startup losses thatwere not tax-effected in either year added 1.1% to the effective tax rate inthe first quarter of 2005. The mix of income in the first quarter contributesto a higher effective tax rate than is expected for the full year.
Net income was $21.1 million in the first quarter, down $1.9 million from$23.0 million in 2004. First quarter earnings per share were $0.27 in 2005,down $0.02 from $0.29 in the first quarter of 2004.
NewspapersThe Newspaper segment includes the newspaper and commercial printingresults of the Toronto Star, CityMedia Group and Metroland Printing,Publishing and Distributing; Torstar Digital; Torstar Media Group Television(“TMG TV”) and Transit Television Network (“TTN”). CityMedia Group publishesthree daily newspapers – The Hamilton Spectator, The Record (Kitchener,Cambridge and Waterloo) and the Guelph Mercury – along with 10 communitynewspapers and a number of specialty and monthly publications. Metroland
INTERIM MANAGEMENT’S DISCUSSION AND ANALYSIS

3
publishes 67 community newspapers, a number of specialty publications,operates several consumer shows and publishes the jointly owned Torontodaily commuter paper Metro and the Chinese language newspaper Sing TaoDaily. Torstar Digital was established in 2005 as a reporting unit for theNewspaper segment’s Internet operations.
Selected financial information for the Newspaper segment for the threemonths ended March 31 (in $000’s):
Toronto TorstarStar Metroland CityMedia Digital Other1 Total
2005
Revenue $100,175 $87,584 $35,448 $5,887 $2,813 $231,907
Operating profit 2,065 13,462 2,491 1,168 (2,679) 16,507
Depreciation 8,375 1,948 1,423 219 712 12,677
Segment EBITDA $10,440 $15,410 $3,914 $1,387 ($1,967) $29,184
Margins:
– Operating profit 2.1% 15.4% 7.0% 19.8% n/a 7.1%
– EBITDA 10.4% 17.6% 11.0% 23.6% n/a 12.6%
20042
Revenue3 $101,775 $79,507 $35,381 $5,087 $2,913 $224,663
Operating profit 1,054 15,049 2,979 908 (1,380) 18,610
Depreciation 8,398 1,410 1,461 386 423 12,078
Segment EBITDA $9,452 $16,459 $4,440 $1,294 ($957) $30,688
Margins:
– Operating profit 1.0% 18.9% 8.4% 17.8% n/a 8.3%
– EBITDA 9.3% 20.7% 12.5% 25.4% n/a 13.7%
Each of Torstar’s newspapers was negatively affected by the traditionallyweak Easter weekend advertising period that shifted into March 2005 fromApril in 2004. This affects both ROP and distribution revenues but theimpact reversed in the second quarter of 2005.
The Toronto Star’s revenues were down $1.6 million in the first quarter of2005 with linage declines only partially offset by higher effective line ratesand higher circulation revenues. Linage was down 8.6% in the quarter asthe in-paper advertising market continued to be challenging. National linagewas up 6.9% in the quarter while retail, travel and classified were down
INTERIM MANAGEMENT’S DISCUSSION AND ANALYSIS
1 Consists of TMGTV and TTN.2 The 2004 results have been restated to include the Internet results from each of the newspapers in Torstar Digital.3 2004 quarterly revenue and margins for the Toronto Star and CityMedia have been restated from the previously
presented to reflect the change in accounting for circulation revenues gross of certain distribution costs. Thischange was implemented in the fourth quarter of 2004.

4
10.7%, 12.8% and 16.6% respectively. The effective average line rate was up 5.6% in the quarter reflecting rate increases and the mix of colour,positioning and section premiums. Circulation revenues were up primarilyfrom the Saturday single copy price increase in November 2004 while volumes were down slightly year over year. The Toronto Star announced a Monday to Friday single copy price increase in April 2005.
In April, the Toronto Star reached a three-year collective agreement covering approximately 1,300 employees. The agreement, which will expire December 31, 2007, provides for wage settlements of 2.5% for thefirst two years and 1.5%–3.0% in the third year based upon Toronto CPI.The agreement provides for commission-based compensation for new salesstaff with an opt-in available for existing staff.
Despite the lower revenues, the Toronto Star’s EBITDA was $10.4 million inthe first quarter, up $0.9 million from $9.5 million in the first quarter of 2004.Newsprint costs were down $1.3 million due to reduced consumption fromlower linage and planned paging decreases. Payroll costs were down $1.6 million in the first quarter benefiting from the impact of the voluntaryseverance program offered in the fall of 2004 and lower pension costs.Toronto Star’s operating profits were $2.1 million in the first quarter, up$1.0 million from 2004.
Metroland’s revenues were up $8.1 million in the first quarter of 2005despite the Easter effect and the reversal of the impact from an extra Friday(which is the largest distribution day) that occurred in the fourth quarter of2004. Metroland’s advertising revenue was up $2.1 million in the first quarterwith linage up 7.0% offset slightly by a small decrease in the average linerate. On a “same paper” basis (excluding the impact of any papers thatwere not published in both quarters) linage was up 2.5% in the quarter.Despite the impact of the 2005 publishing calendar, distribution volumes wereup 9.0% in the first quarter, increasing revenues by $1.6 million. Metroland’sshare of Sing Tao and Metro revenues was up $0.7 million in the quarter.
Metroland reached a three-year collective agreement with 45 employees atone printing plant. This agreement, which will expire December 31, 2007,provides for a wage settlement of 2.5% in year one and 2%–3% in yearstwo and three, based on Ontario CPI.
Metroland’s EBITDA was $15.4 million in the first quarter of 2005, down$1.1 million from $16.5 million in 2004. Newsprint, payroll and departmentcosts are all higher in the first quarter 2005, reflecting the impact of investmentin new initiatives and increased infrastructure required to support the expansion.Metroland’s operating profit was $13.5 million in the first quarter of 2005,down $1.6 million from $15.1 million in 2004.
In March, Torstar announced the formation of a new joint venture with CanWestMediaWorks and Metro International S.A. to publish English-language freedaily newspapers in various Canadian cities. Each partner will have a 33.3%interest in the new venture. Metro Vancouver was launched on March 14th
followed by Metro Ottawa on March 30th.
INTERIM MANAGEMENT’S DISCUSSION AND ANALYSIS

5
CityMedia revenues were flat in the first quarter of 2005 with higher insertrevenues offset by lower commercial printing revenues at The HamiltonSpectator’s printing operations. Advertising revenues were down slightly atthe daily newspapers with linage declines almost completely offset by highereffective line rates. The community newspapers had higher advertising andinsert revenues during the quarter.
The Hamilton Spectator reached a three-year agreement with their editorialand part-time mailroom employees (approximately 210 employees). Thecontract is retroactive to January 1, 2004 and provides for wage settlementsof approximately 2.0% in the first two years and 1.5%–3.0% in year threedepending on the Ontario CPI. The Hamilton Web mailroom and productionstaff have been on strike since December 4, 2004.
CityMedia’s EBITDA was $3.9 million in the first quarter of 2005, down$0.5 million from the same period in 2004. Payroll savings were realized inthe quarter from the restructuring that occurred in the third quarter of 2004.The impact of Easter, the lost publishing days and the strike at the HamiltonWeb printing facility reduced profits by about $1.0 million in the quarter.CityMedia’s operating profit was $2.5 million in the quarter, down $0.5 millionfrom $3.0 million last year.
The Torstar Digital reporting unit includes Torstar’s 40% interest inworkopolis.com as well as the wholly owned toronto.com and the Internetoperations for each of the newspapers. This reporting unit was formed inearly 2005 to focus on developing integrated online solutions in the areasof local advertising, classifieds, news and information that will meet theneeds of online advertisers, consumers and readers. During the first quarter the primary objective was getting key staff into place and establishingthe strategic agenda. Improved results at workopolis.com provided theincrease in revenues and operating profits for Torstar Digital in the first quarter of 2005.
TTN continued with its expansion plan in the first quarter of 2005. Revenueswere up $0.4 million from the first quarter of 2004 with both the Atlantaand suburban Chicago systems operational. The Los Angeles sales officeopened in March and installation is scheduled to begin late in the secondquarter. TTN’s EBITDA losses were $2.1 million in the first quarter of 2005,up as expected from $1.5 million in 2004. TTN’s first quarter operatinglosses were $2.8 million compared with $1.8 million in 2004.
Book PublishingThe Book Publishing segment reports the results of Harlequin EnterprisesLimited, a leading global publisher of women’s fiction. Harlequin publisheswomen’s fiction around the world, selling books through the retail channeland directly to the consumer by mail and the Internet. Harlequin’s women’sfiction publishing operations are comprised of three divisions: North AmericaRetail, North America Direct-To-Consumer and Overseas.
INTERIM MANAGEMENT’S DISCUSSION AND ANALYSIS

6
As an international publisher, Harlequin’s results are affected by changes inforeign exchange rates relative to the Canadian dollar. The most significantis the change in the U.S.$/Cdn.$ exchange rate. To offset some of this risk,Torstar has entered into forward foreign exchange and option contracts forU.S. dollars and Euros.
The following chart identifies the impact of foreign currency movements, foreign currency hedges and underlying operations on reported revenue and operating profits for the three months ended March 31 (in $000’s):
2005 2004
Reported revenue, prior year $137,085 $149,891Impact of currency movements (6,608) (10,978)Impact of U.S. dollar hedges4 1,952 5,075Change in operating revenue (3,237) (6,903)
Reported revenue, current year $129,192 $137,085
Reported operating profit, prior year $26,121 $29,897Impact of currency movements (1,941) (3,983)Impact of U.S. dollar hedges 1,952 3,690Impact of other currency hedges (526) 718Change in operating profit (1,014) (4,201)
Reported operating profit, current year $24,592 $26,121
Depreciation and amortization 1,972 1,951
Segment EBITDA $26,564 $28,072
Reported margins:Operating profit 19.0% 19.1%EBITDA 20.6% 20.5%Impact of foreign exchange contracts on margins:Reported revenue, current year $129,192 $137,085Hedge gains 7,027 5,075
Revenue before hedge gains $122,165 $132,010
Reported operating profit, current year $24,592 $26,121Hedge gains 7,263 5,837
Operating profit before hedge gains $17,329 $20,284
Operating profit margin 14.2% 15.4%EBITDA margin 15.8% 16.8%
INTERIM MANAGEMENT’S DISCUSSION AND ANALYSIS
4The impact of the U.S. dollar hedges is reported in revenue effective January 1, 2004. Torstar has hedged $76 millionof its 2005 U.S. dollar revenue at $1.59 ($75 million at $1.58 in 2004). There are no hedges in place for 2006.
7
Harlequin’s revenues were down $3.2 million in the first quarter excludingthe impact of foreign exchange. North America Retail was down $2.0 million,North America Direct-To-Consumer was down $1.3 million and Overseaswas up $0.1 million. Harlequin’s operating profits were down $1.0 million in the first quarter excluding the impact of foreign exchange. North AmericaRetail was down $3.6 million, North America Direct-To-Consumer was up$1.1 million and Overseas was up $1.5 million. Although down from thefirst quarter of 2004, Harlequin’s operating profits were consistent with thelast three quarters of 2004.
North America Retail revenues were $2.0 million lower in the first quarter of2005 compared with the first quarter of 2004 due to lower net sales ratesfor both series and single title books. The lower volumes were partially offsetby a higher average cover price resulting from a mid-year 2004 series priceincrease and a change in the product mix. Operating profits were down$3.6 million in the first quarter including the impact of higher product costsrelated to the change in product mix.
North America Direct-To-Consumer revenues were down $1.3 million in thefirst quarter of 2005 compared with the first quarter of 2004. This was volumedriven and consistent with the longer-term trend of a declining number ofbooks sold. Operating profits were up $1.1 million in the first quarter withlower promotional costs from smaller mailings.
Overseas revenues were up $0.1 million in the first quarter of 2005 comparedwith the same period last year. The revenues were mixed within the groupwith the U.K., Japan and Germany down from the first quarter of 2004 andAustralia and the Nordic group up. Overseas operating profits were up $1.5million in the first quarter primarily as actual returns from retail sales werelower than previously provided for. The Australia and Nordic group operatingprofits were up year over year and the U.K. operation realized cost savingsfrom the restructuring that took place in the third quarter of 2004.
Associated BusinessesTorstar has a 19.35% equity investment in Black Press Ltd. and a 30%equity interest in Q-ponz Inc. Black Press Ltd. is a privately held companythat publishes 95 newspapers (both dailies and weeklies) and has 17 printingplants in Western Canada, Washington State and Hawaii. Q-ponz Inc. is acoupon envelope business based in Toronto.
Torstar’s loss from associated businesses was $0.2 million in the first quarterof 2005, consistent with the loss in the same quarter last year.
LIQUIDITY AND CAPITAL RESOURCESOverviewFunds are generally used for capital expenditures, debt repayment and distributions to shareholders. Long-term debt is used to supplement fundsfrom operations and as required for acquisitions. It is expected that futurecash flows from operating activities, combined with the credit facilities available will be adequate to cover forecasted financing requirements.
INTERIM MANAGEMENT’S DISCUSSION AND ANALYSIS

8
In the first quarter of 2005, $19.2 million of cash was generated by operations, $3.9 million was used for investing activities and $12.8 millionwas used for financing activities. Cash and cash equivalents net of bankoverdraft increased by $1.9 million in the quarter from $40.8 million to$42.7 million.
Operating activitiesOperating activities provided cash of $19.2 million in the first quarter of2005, down $23.2 million from $42.4 million in the first quarter of 2004.During the first quarter of 2005 non-cash working capital increased by$17.4 million compared with a decrease of $5.2 million in the first quarterof 2004. The increase in working capital in 2005 was caused by the timingof income tax payments, payments made related to restructuring provisionsand an increase in prepaid balances, primarily author advances and direct-to-consumer advertising and promotion costs.
Investing activitiesDuring the first quarter of 2005, $3.9 million was used for investments,down from $14.2 million in the first quarter of 2004. Additions to property,plant and equipment were $2.9 million lower in the first quarter of 2005than in 2004 when press additions at Metroland and CityMedia were inprogress. During the first quarter of 2005, net proceeds of $5.7 millionwere received from the sale of the property in Kitchener that had previouslybeen occupied by The Record.
Financing activitiesCash of $12.8 million was used in financing activities during the first quarterof 2005, down $28.6 million from $41.4 million in 2004.
During the first quarter of 2005, Torstar increased its long-term debt by$11.8 million compared with a decrease of $49.7 million in the same periodin 2004. Average debt outstanding during the first quarter was $282 millionin 2005 and $320 million in 2004. At March 31, 2005, Torstar had $90million of available credit facilities after providing for outstanding letters ofcredit, commercial paper and the medium term notes that will mature inSeptember 2005.
Cash dividends of $14.2 million were paid in the first quarter of 2005, up $0.6 million from $13.6 million in 2004 reflecting the increase in thequarterly dividend.
During the first quarter of 2005, Torstar purchased 0.5 million shares for atotal price of $11.3 million under the normal course issuer bid that openedon May 7, 2004. Subsequent to the quarter end, Torstar completed thenormal course issuer bid for the purchase of 2 million shares for a totalprice of $48.0 million.
INTERIM MANAGEMENT’S DISCUSSION AND ANALYSIS

9
OUTLOOKThe weakness in retail in-paper advertising presents a significant challengeto the Newspaper Segment. Each newspaper must focus on new advertisingopportunities to try to bring the major retailers back to in-paper advertising.The labour settlements reached over the past few months will allow thenewspapers to maintain their focus on their businesses.
Harlequin continues to focus on its strategic plans for 2005. New productswill be launched in the upcoming quarters as part of the ongoing process of renewing the product offerings. The Brazilian partnership began its publishing activities in April.
RECENT DEVELOPMENTSTorstar announced on May 4, 2005 that the Toronto Stock Exchangeaccepted its notice of intention to make a normal course issuer bid. Underthe normal course issuer bid, Torstar may purchase up to an aggregate of 2 million Class B non-voting shares during the period May 6, 2005 to May 5, 2006. Torstar believes the purchase of its own shares is a prudentuse of corporate funds. In addition, the share buy back will help to offsetthe dilution of the holdings of Torstar’s Class B shareholders resulting fromthe issue of shares pursuant to the exercise of stock options.
Subsequent to the end of the quarter, Torstar completed the purchase of TheBracebridge Examiner Limited. The Bracebridge Examiner Limited publishesThe Bracebridge Examiner, The Gravenhurst Banner, The Muskokan and avariety of other publications covering the Muskoka Region. It also holds a50% interest in the Muskoka Advance, Bracebridge Weekender, GravenhurstWeekender and the Huntsville Weekender.
OTHERAt March 31, 2005, Torstar had 9,917,935 Class A voting shares and68,089,878 Class B non-voting shares outstanding and 5,540,768 options topurchase Class B non-voting shares outstanding to executives and non-executivedirectors. More information on Torstar’s share capital and stock option planis provided in Notes 3 and 4 of the consolidated financial statements.
Additional information relating to Torstar is available on SEDAR atwww.sedar.com.
Dated: May 3, 2005.
INTERIM MANAGEMENT’S DISCUSSION AND ANALYSIS

10
Three months endedMarch 31
(thousands of dollars) 2005 2004
Operating revenueNewspapers $231,907 $224,663Book publishing 129,192 137,085
$361,099 $361,748
Operating profitNewspapers $16,507 $18,610Book publishing 24,593 26,121Corporate (4,905) (4,332)
36,195 40,399Interest (2,297) (2,782)Foreign exchange (248) 210Unusual items (note 7) 1,350
Income before taxes 35,000 37,827Income and other taxes (13,700) (14,600)
Income before loss of associated businesses 21,300 23,227Loss of associated businesses (161) (189)
Net income $21,139 $23,038
Earnings per Class A and Class B share (note 3(c)):Net income – Basic $0.27 $0.29Net income – Diluted $0.27 $0.29
(See accompanying notes)
Torstar Corporation Consolidated Statement of Income(Unaudited)

11
March 31 December 31
(thousands of dollars) 2005 2004
AssetsCurrent:
Cash and cash equivalents $44,773 $47,229Receivables 229,023 247,942Inventories 35,780 35,236Prepaid expenses 75,143 68,250Future income tax assets 23,353 23,851
Total current assets 408,072 422,508
Property, plant and equipment (net) 383,296 392,141Investment in associated businesses 22,847 22,954Goodwill (net) 499,635 499,637Other assets 115,080 114,731Future income tax assets 57,798 58,056
Total assets $1,486,728 $1,510,027
Liabilities and Shareholders' EquityCurrent:
Bank overdraft $2,047 $6,414Accounts payable and accrued liabilities 200,851 214,352Income taxes payable 9,544 23,917
Total current liabilities 212,442 244,683
Long-term debt (note 2) 329,973 317,829
Other liabilities 84,649 83,177
Future income tax liabilities 70,477 70,677
Shareholders' equity:Share capital (note 3) 367,438 369,140Contributed surplus 3,048 2,442Retained earnings 423,751 425,787Foreign currency translation adjustment (5,050) (3,708)
Total shareholders' equity 789,187 793,661
Total liabilities and shareholders' equity $1,486,728 $1,510,027
(See accompanying notes)
Torstar Corporation Consolidated Balance Sheets(Unaudited)

12
Three months endedMarch 31
(thousands of dollars) 2005 2004
Cash was provided by (used in)Operating activities $19,239 $42,412Investing activities (3,939) (14,241)Financing activities (12,799) (41,370)
Increase (decrease) in cash 2,501 (13,199)Effect of exchange rate changes (590) 480Cash, beginning of period 40,815 50,417
Cash, end of period $42,726 $37,698
Operating activities:Net income $21,139 $23,038Depreciation 14,025 13,417Amortization 639 641Future income taxes 200 341Loss of associated businesses 161 189Other 498 (388)
36,662 37,238Decrease (increase) in non-cash working capital (17,423) 5,174
Cash provided by operating activities $19,239 $42,412
Investing activities:Additions to property, plant and equipment ($9,749) ($12,585)Acquisitions (1,705)Other (note 7) 5,810 49
Cash used in investing activities ($3,939) ($14,241)
Financing activities:Issuance of commercial paper debt (net) $11,803 $25,275Repayment of medium term notes (75,000)Dividends paid (14,152) (13,624)Exercise of stock options (note 3(a)) 579 21,012Purchase of shares for cancellation (note 3(b)) (11,328)Other 299 967
Cash used in financing activities ($12,799) ($41,370)
Cash represented by:Cash and cash equivalents $44,773 $40,017Bank indebtedness (2,047) (2,319)
$42,726 $37,698
(See accompanying notes)
Torstar Corporation Consolidated Statements Of Cash Flows(Unaudited)

13
Torstar Corporation Consolidated Statements Of Retained Earnings(Unaudited)
Three months endedMarch 31
(thousands of dollars) 2005 2004
Retained earnings, beginning of period $425,787 $395,758
Net income 21,139 23,038
Dividends (14,462) (13,844)
Premium paid on repurchase of shares for cancellation (note 3(b)) (8,713)
Retained earnings, end of period $423,751 $404,952
(See accompanying notes)
Torstar Corporation Notes to the Interim Consolidated Financial Statements(Dollar amounts in thousands unless otherwise stated)
1. Accounting policiesThe accounting policies used in the preparation of these unauditedinterim consolidated financial statements conform with those in Torstar Corporation’s December 31, 2004 audited annual consolidatedfinancial statements. These interim financial statements do not includeall of the disclosures included in the annual financial statements andaccordingly should be read in conjunction with the annual consolidatedfinancial statements.
2. Long-term debt
As at As atMarch 31, 2005 December 31, 2004
Commercial paper:
Cdn. Dollar denominated $152,142 $156,792
U.S. Dollar denominated 132,831 116,037
284,973 272,829
Medium Term Notes:
Cdn. Dollar denominated 45,000 45,000
$329,973 $317,829

14
Torstar Corporation Notes to the Interim Consolidated Financial Statements(Dollar amounts in thousands unless otherwise stated)
All commercial paper and medium term notes with a term of less thanone year have been classified as long-term debt as the company has the ability and intention to refinance these amounts under its existingcredit facilities.
The carrying values of the various long-term debt instruments approximatetheir fair value at March 31, 2005. The company entered into an interestrate swap agreement that will fix the interest rate on U.S. $80 million ofborrowings at approximately 3.5% for four years beginning December 2003.The fair value of the U.S. interest rate swap arrangement was $1.7 millionfavourable at March 31, 2005.
3. Share Capitala) A summary of changes to the company’s share capital is as follows:
Class A shares (voting)
At March 31, 2005 there were 9,917,935 Class A shares outstandingwith a stated value of $2,694. The only changes in the Class A sharessince December 31, 2004 were the conversion to Class B shares of540 shares with a stated value of $1.
Class B shares (non-voting)
Shares Amount
December 31, 2004 68,533,752 $366,445
Converted from Class A 540 1
Issued under Employee Share Purchase Plan 900 17
Stock options exercised 30,300 579
Purchased for cancellation (489,100) (2,615)
Dividend reinvestment plan 13,164 310
Other 322 7
March 31, 2005 68,089,878 $364,744
Total Class A and Class B shares 78,007,813 $367,438
b) The company commenced a normal course issuer bid on May 7, 2004,effective for one year, to repurchase for cancellation up to 2 millionClass B shares, representing approximately 2.9% of the company’s outstanding Class B shares. As at March 31, 2005 1,929,900 Class Bshares were repurchased and cancelled at an average repurchase priceof $23.99 per share for a total consideration of $46,304 since thebeginning of the issuer bid. During the first quarter of 2005, 489,100Class B shares were repurchased at an average price of $23.16 pershare for a total consideration of $11,328. Retained earnings werereduced by $8,713 representing the excess of the cost of the sharesrepurchased over their stated value.

15
c) Earnings per share
Basic per share amounts have been determined by dividing net incomeby the weighted average number of shares outstanding during the period.Diluted per share amounts have taken into consideration the dilutiveeffect of stock options and the employee share purchase plan. Theweighted average number of Class A and Class B shares outstanding(in thousands) were:
Three months ended March 31
2005 2004
Basic 78,201 78,943
Diluted 78,569 80,114
d) During the three months ended March 31, 2005, controlling shareholderssold 10,000 Class B shares.
4. Stock-based compensationThe company has four stock-based compensation plans: an executive shareoption plan, an employee share purchase plan, a deferred share unit planfor employees and a deferred share unit plan for non-employee directors.
a) A summary of changes in the executive share option plan is as follows:
Weighted averageShare options exercise price
December 31, 2004 4,936,962 $22.63
Granted 643,531 22.00
Exercised (30,300) (19.09)
Cancelled (9,425) (25.53)
March 31, 2005 5,540,768 $22.57
Options exercisable at March 31, 2005 are as follows:
Range of Share options Weighted averageexercise price exercisable exercise price
$15.75–18.05 543,700 $17.11
$18.50–22.20 2,148,364 $20.96
$25.00–29.01 1,016,910 $25.82
$15.75–29.01 3,708,974 $21.73
Torstar Corporation Notes to the Interim Consolidated Financial Statements(Dollar amounts in thousands unless otherwise stated)
16
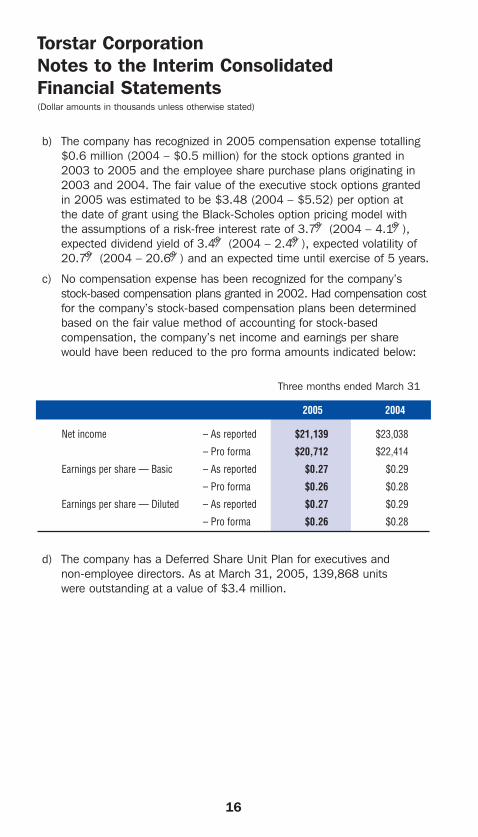
b) The company has recognized in 2005 compensation expense totalling$0.6 million (2004 – $0.5 million) for the stock options granted in2003 to 2005 and the employee share purchase plans originating in2003 and 2004. The fair value of the executive stock options grantedin 2005 was estimated to be $3.48 (2004 – $5.52) per option at the date of grant using the Black-Scholes option pricing model with the assumptions of a risk-free interest rate of 3.7% (2004 – 4.1%),expected dividend yield of 3.4% (2004 – 2.4%), expected volatility of20.7% (2004 – 20.6%) and an expected time until exercise of 5 years.
c) No compensation expense has been recognized for the company’sstock-based compensation plans granted in 2002. Had compensation costfor the company’s stock-based compensation plans been determinedbased on the fair value method of accounting for stock-based compensation, the company’s net income and earnings per sharewould have been reduced to the pro forma amounts indicated below:
Three months ended March 31
2005 2004
Net income – As reported $21,139 $23,038
– Pro forma $20,712 $22,414
Earnings per share — Basic – As reported $0.27 $0.29
– Pro forma $0.26 $0.28
Earnings per share — Diluted – As reported $0.27 $0.29
– Pro forma $0.26 $0.28
d) The company has a Deferred Share Unit Plan for executives and non-employee directors. As at March 31, 2005, 139,868 units were outstanding at a value of $3.4 million.
Torstar Corporation Notes to the Interim Consolidated Financial Statements(Dollar amounts in thousands unless otherwise stated)
17
5. Employee Future BenefitsThe company maintains a number of defined benefit plans, which provide pension benefits to its employees in Canada and the UnitedStates. Post employment benefits other than pensions are also availableto employees, primarily in the Canadian newspapers operations, whichprovide for various health and life insurance benefits.
The company has expensed net pension benefit costs of $4.1 millionfor the three months ended March 31, 2005 (2004 – $3.8 million).With respect to post-employment benefits other than pensions, for the three months ended March 31, 2005 the net benefit cost was$1.0 million (2004 – $1.0 million).
6. Forward Foreign Exchange Contracts and OptionsAs described in Note 13 of the company’s December 31, 2004 annualfinancial statements, the company has entered into various forward foreign exchange contracts and option contracts.
During the first quarter of 2005 the company entered into an offsettingposition for 1.0 million of its 4.0 million 2006 Euro forward foreignexchange contracts.
The company has marked to market its outstanding Euro forward foreignexchange contracts at March 31, 2005. As a result, an unrealized gainof $0.2 million was included in the operating profit of the book publishingsegment for the three months ended March 31, 2005.
7. Unusual items During the first quarter of 2005, the company recognized a $1.4 milliongain from the completion of the sale of the land and building previouslyoccupied by The Record in Kitchener. Net proceeds were $5.7 million.
Torstar Corporation Notes to the Interim Consolidated Financial Statements(Dollar amounts in thousands unless otherwise stated)

CORPORATE OFFICEONE YONGE STREET
TORONTO, ONTARIO M5E 1P9
(416) 869-4010
www.torstar.com
SHARES LISTEDTORSTAR CLASS B SHARES ARE TRADED
ON THE TORONTO STOCK EXCHANGE UNDER
TS.nv.b
TRANSFER AGENT AND REGISTRARCIBC MELLON TRUST COMPANY
AUDITORSERNST & YOUNG LLP,
TORONTO