tort reform and innovation - nber.org · tort reform and innovation alberto galasso and hong luo...
TRANSCRIPT

NBER WORKING PAPER SERIES
TORT REFORM AND INNOVATION
Alberto GalassoHong Luo
Working Paper 22712http://www.nber.org/papers/w22712
NATIONAL BUREAU OF ECONOMIC RESEARCH1050 Massachusetts Avenue
Cambridge, MA 02138October 2016
We thank James Dana, Deepak Hegde, Curtis Huttenhower, Mark Schankerman, Kathryn Spier, Ariel Stern, Scott Stern, Laurina Zhang and seminar participants at Duke University, Harvard Business School, the NBER productivity seminar, New York University Innovation and Strategy conference, and the Northwestern Searle Conference on Innovation Economics for helpful comments. We are also grateful to Kira Fabrizio and Ronnie Chatterji for sharing data on physician-inventors. Danielle Wedde and Esther Yan provided excellent research assistance. The views expressed herein are those of the authors and do not necessarily reflect the views of the National Bureau of Economic Research.
NBER working papers are circulated for discussion and comment purposes. They have not been peer-reviewed or been subject to the review by the NBER Board of Directors that accompanies official NBER publications.
© 2016 by Alberto Galasso and Hong Luo. All rights reserved. Short sections of text, not to exceed two paragraphs, may be quoted without explicit permission provided that full credit, including © notice, is given to the source.

Tort Reform and InnovationAlberto Galasso and Hong LuoNBER Working Paper No. 22712October 2016JEL No. I1,K4,O3
ABSTRACT
Current academic and policy debates focus on the impact of tort reforms on physicians' behavior and medical costs. This paper examines whether these reforms also affect incentives to develop new technologies. We find that, on average, laws that limit the liability exposure of healthcare providers are associated with a significant reduction in medical device patenting and that the effect is predominantly driven by innovators located in the states passing the reforms. Tort laws have the strongest impact in medical fields in which the probability of facing a malpractice claim is the largest, and they do not seem to affect the amount of new technologies of the highest and lowest quality. Our results underscore the importance of considering dynamic effects in the economic analysis of tort laws.
Alberto GalassoRotman School of ManagementUniversity of Toronto105 St. George StreetToronto, ON M5S 3E6CANADAand [email protected]
Hong LuoHarvard UniversityMorgan Hall 241Soldiers Field RoadBoston, MA [email protected]

1 Introduction
Economists have long recognized the crucial role of innovation for economic growth. A key
feature of research and development (R&D) investments is their public-good nature, which
generates under-investment in innovation relative to the socially optimal level (Arrow, 1962;
Bloom et al., 2013). How to avoid such under-investment and how to provide greater innovation
incentives are central questions in the macroeconomic and public policy literatures.
To increase R&D incentives, governments typically implement a variety of policies - such
as patents and subsidies - directly targeted at innovation investments. To assess and quantify
the effects of these policies is a key focus of the innovation literature. Only recently, econo-
mists have recognized that policies not directly targeted at innovation investments may also
have large impacts on R&D incentives and the direction of technological progress (Finkelstein,
2004). Documenting and quantifying these indirect and dynamic effects is crucial not only to
understanding the determinants of innovation activities, but also to evaluating the costs and
benefits of policy reforms. The objective of this paper is to examine the innovation investment
response to a prominently debated public policy: tort reform.
Torts are actions that injure someone and are recognized by law as grounds for a lawsuit.
The role of the tort system is to deter people from injuring others. An important class of
torts related to professional negligence is medical malpractice. A danger prominently voiced
in public debates is that large settlements arising from medical malpractice litigation lead
doctors to practice “defensive medicine” -i.e., to perform excessive tests and procedures because
of concerns about malpractice liability. Policy debates typically contrast the high costs of
defensive medicine procedures with their low expected benefits to patients. A number of studies
have investigated the relationship between the tort system and treatment intensity or medical
expenditures, and they provide evidence of the practice of defensive medicine (inter alia see
Kessler and McClellan, 1996; and Avraham and Schanzenbach, 2015).
In addition to their effects on procedure use and malpractice claims, tort reforms may
also impact R&D investments and technological change. In particular, a number of law scholars
have warned about a possible “chilling effect” of the current tort system on innovation; that is,
high damage awards and the court’s reliance on custom may reduce physicians’ willingness to
adopt new, but riskier technologies, even if they are potentially superior to customary treat-
1

ments (e.g., Parchomovsky and Stein, 2008; Greenberg, 2009; and Priest, 2011). This idea that
‘liability retards innovation’ has become a key argument for tort reform advocates, and has
gained substantial ground over the years in courts and Congress. A typical counter-argument
is that high liabilities may also encourage innovation because they induce physicians to ‘de-
fensively adopt’ innovative technologies that are themselves safer or help physicians manage
risks. Despite these claims, the empirical literature on the relationship between liability risk
and innovation is scarce. We aim to address this gap by studying the impact of tort reform
on innovation in the medical device sector, a field of technology closely linked to malpractice
litigation.
To illustrate the channels through which tort reforms may affect innovation incentives,
we begin our analysis with a simple theoretical model. In our framework, physicians adopt
medical technologies considering both their expected benefits to patients and their “riskiness”
-i.e., the likelihood that adoption will lead to malpractice liability. A tort reform, such as the
introduction of caps on malpractice damages, will affect physicians’ adoption decisions. Consis-
tent with the idea that high liabilities chills innovation, our model predicts that a reduction in
the cost associated with malpractice litigation will increase physicians’ propensity to use riskier
technologies with high patient benefits. However, our analysis also shows an additional effect
of tort reforms -i.e., they reduce the propensity of physicians to “defensively adopt” low-risk
technologies with limited benefits to patients in order to avoid suits. These shifts in technology
adoption affect upstream R&D investments, and the overall impact on the development of new
devices depends on the relative strengths of the two effects.
While our theoretical framework shows that the overall effect of tort reforms on inno-
vation is ambiguous, it provides a testable prediction. Tort reforms are more likely to reduce
innovation incentives in technology fields characterized by high risk of malpractice claims. In-
tuitively, in these fields, it is likely that physicians adopt new technologies mainly for defensive
reasons. Thus, if the expected liability cost is reduced, the incentives to use these technologies
decrease, resulting in an overall decline in innovation incentives.
To test these predictions, we combine standard measures of innovation, based on US
patent data, with data on state tort reforms from the American Tort Reform Association for
the period 1985-2005. We use the inventor address information provided by the United States
Patent and Trademark Office (USPTO) and the application year of a patent to link patents
with U.S. state-years. We also exploit the USPTO 3-digit technology classification to identify
2

medical instrument patents. The class of tort reform central to our empirical analysis is the
introduction of caps on non-economic damages -that is, damages other than monetary losses,
such as pain and suffering. These damages typically comprise a substantial fraction of total
awards and represent the main focus of tort reform advocates.
Our main result shows that patenting in medical instruments is reduced by roughly 14
percent in the presence of caps on non-economic damages. This negative effect suggests that,
on average, the demand for new technologies that high liabilities generate through defensive-
adoption exceeds their negative chilling effect on medical device innovation. This finding is
robust to a wide variety of alternative specifications and controls. In particular, the synthetic
control method by Abadie et al. (2010) provides clear graphical evidence that medical instru-
ment patenting responds to tort reforms, mostly after five years. Results are similar if we
exclude from the sample states for which caps on non-economic damages affect only medical
malpractice rather than general torts. Moreover, we show that our findings are not driven by
the largest states or by the largest medical device producers. Finally, we run a placebo test
that indicates no effect of tort reforms in the sample of non-medical, measuring and testing
instruments.
Because innovation activities may respond to demand changes beyond the local level,
we also examine whether medical device patenting in a state is affected by policy changes
in other states. We construct measures of economic linkages across states exploiting proxies
for the relative demand and supply of medical device innovation and find that the effect is
predominantly driven by local reforms. We show that such a local nature of the policy impact is
related to a key feature of the medical device industry: the involvement of practicing physicians.
Indeed, a sizable fraction of the negative impact of tort reforms appears to be driven by the
patenting activity of physician innovators located in the state.
We extend these baseline results in several direction. First, to confirm the prediction of
our theoretical model, we show that the effect of tort reforms is much more pronounced for
patenting related to specialities with a high frequency of malpractice claims (such as surgery
and orthopedics). Conversely, caps on damages have a small and statistically insignificant effect
on patenting in medical fields with few malpractice claims (such as dental and optics). Second,
exploiting patent citations as a proxy for technological value, we document a non-monotonic U-
shaped relationship between the effect of tort reforms and innovation quality. Caps on damages
have no statistically significant effect on innovation at the lowest and highest quality quintiles.
3

The effect is negative, statistically significant and of large magnitudes at intermediate quality
levels.
Taken together, our findings indicate that tort reforms can have an impact on the level
and direction of innovation and that an effective assessment of these policies should consider
both their static impact on patients and their dynamic effects on medical technologies. While,
on average, caps on damages appear to reduce the propensity to innovate, our analysis shows
that this effect is highly heterogeneous and depends on the characteristics of both the devices
and the medical fields.
The paper is organized as follows. Section 2 summarizes the related literature. In Section
3, we present a simple model that links tort reforms with innovation incentives. Section 4
describes the data and the econometric specification. Section 5 presents the baseline estimates
of the average effect of tort reforms on medical device patenting. In Section 6, we show that
the impact of tort reform is heterogeneous and depends on the characteristics of the field and
the innovation. We conclude with a brief summary of the findings.
2 Related literature
Our paper is related to studies that investigate the determinants and direction of innovation,
in line with the induced-innovation and directed technical change literatures. In the context
of pharmaceuticals, a number of papers have investigated the impact of variations in poten-
tial market size, exploiting shifts in population demographics (Acemoglu and Linn, 2004), the
introduction of Medicare Part D (Blume-Kohout and Sood, 2013), and variations in effective
patent life (Budish et al., 2015). More specifically, our paper is related to studies that examine
how public policies focusing on achieving some social goal other than innovation affect innova-
tion. In the health sector, Finkelstein (2004) exploits three different policy changes designed
to increase the usage of preexisting vaccines and finds that these policies are associated with
a 2.5-fold increase in clinical trials for new vaccines. Acemoglu et al. (2006) find that the
introduction of Medicare was not associated with an increase in drug consumption among the
elderly; and consistent with this, they find no evidence of an increase in the approval of new
drugs targeting diseases that affect the elderly. In the energy and environment sector, Jaffe
and Palmer (1997) conclude that environmental compliance standards increase R&D spending
at the firm level.
Our analysis draws on the literature studying the relationship between legal liabilities
4

and medical practice.1 Most studies in this literature exploit the variations provided by state
tort reforms. Kessler and McClellan (1996) examine Medicare beneficiaries treated for serious
heart diseases and find that tort reforms lead to reductions in medical expenditures of five
to nine percent without substantial effects on mortality or medical complications. Similarly,
Avraham and Schanzenbach (2015) find that the probability of heart patients receiving a major
intervention drops by five percent after a state implements non-economic damage caps. These
results provide evidence for the practice of defensive medicine when liability risks are high.
Other papers provide more-nuanced evidence on the influence of liability risks on physician
behaviors. Currie and MacLeod (2008) find that caps on non-economic damages increase, while
the joint and several liability rule decreases the use of cesarean sections. Shurtz (2014) shows
that the effects of tort reforms may depend on physicians’ financial incentives. Frakes (2013)
shows that states’ utilization rates of various treatments and diagnostic procedures changed
substantially following the adoption of a rule requiring physicians to follow national, as opposed
to local, malpractice standards of care. Frakes and Jena (2016) show that changes in clinical
standards can induce higher levels of health care quality.
The only empirical study that we are aware of linking liability and innovation is by
Viscusi and Moore (1993), who show that, on average, liability costs increase firms’ R&D
intensity. Their paper differs from ours in a number of dimensions. Theoretically, they study
the direct effect of product liability on firms’ R&D investment, whereas, in our model, changes
in liability risks affect innovation indirectly, as they first influence physicians’ demand for new
technologies. Empirically, they study the impacts of the cost of product-liability insurance
using a cross-industry dataset covering large firms in the period 1984-1987. We focus on the
effects of state tort reforms on medical device patenting for all firms in the period 1985-2005.
Our paper relates to the literature on innovation and technology diffusion in the medical
device industry. Clemens (2013) finds that the introduction of Medicare and Medicaid had a
positive effect on U.S.-based medical equipment patenting. Chatterji and Fabrizio (2014) study
the role of users in medical device innovation. Grennan and Town (2015) examine the impact
of regulatory testing requirements for medical devices on innovation diffusion. Stern (2015)
shows that medical device innovation incentives are shaped by the regulatory approval process.
1Another stream of studies examines the effects of tort reforms on malpractice claims such as the frequency
and severity (e.g., Danzon, 1984; and Avraham, 2007), and malpractice insurance-related outcomes, such as
insurers’ reported losses, mean payments, and insurance premiums (e.g., Barker,1992; and Viscusi and Born,
1995). For an overview of the malpractice system and the effects of tort reforms, see the survey by Kessler
(2011).
5

Nistor and Tucker (2015) show that the Food and Drug Administration’s (FDA) decision to
allow for third-party certification of medical devices led to more adverse medical events.
Finally, our work is related to the literature on the determinants of state and regional
innovation. For example, Agrawal and Cockburn (2003) report evidence in support of the
anchor tenant hypothesis that large, local, R&D-intensive firms have a positive impact on
regional innovation. Marx et al. (2009) show that regional non-compete regulations affect
inventor mobility and knowledge spillovers. Galasso et al. (2013) show that state-level taxes
strongly impact knowledge diffusion through the decision to trade patent rights. Vakili and
Zhang (2015) show that liberalization policies are associated with an increase in the level of
state innovation.
3 Theoretical model
In this section, we develop a simple theoretical model to explore the effects of tort reforms
on innovation incentives. In our framework, innovations are characterized by multidimen-
sional heterogeneity, as in Weyl and Tirole (2012). Policy reforms affect technological progress
through their impact on downstream technology adoption, which, in turn, shapes upstream
R&D investments, as in Aghion et al. (2015).
3.1 Basic framework
We consider a medical field with a representative (consumer) physician. We assume that
the physician’s utility from adopting a medical technology includes the patient’s expected
benefits and the expected cost of medical malpractice liability, as in Schurtz (2014). A medical
technology, , is thus characterized by two parameters: ∈ [0 1] and ∈ [0 1], where is theexpected benefit to the patient, and is the technology-specific malpractice liability risk (e.g.,
the probability of a bad patient outcome). The expected liability cost is which captures the
probability that a bad patient outcome would result in a malpractice claim (or even a suit)
and the costs that the physician expects to face if involved in such a dispute. The literature
on medical malpractice points out that even when physicians are insured against claims for
monetary damages, they still suffer from malpractice disputes due to additional costs such as
time loss, stress, and damage to the physician’s reputation.2 We model a tort reform as a
2As discussed in Currie and MacLeod (2008), payments made on behalf of a physician to settle malpractice
claims are registered in the National Practitioners’ Data Bank (NPDB), which hospitals, health care professionals
and lawyers often access. Seabury et al. (2013) analyze data from 40,916 physicians covered by a nationwide
6

decrease in , which may operate through two channels: (i) a reduction in the frequency of
malpractice claims given bad patient outcomes;3 and (ii) a reduction in the expected costs
associated with malpractice disputes.
The physician’s utility, when she adopts technology is
= − (1)
For a simple micro-foundation of our setting, consider an environment in which each innovation
is characterized by a distribution of potential patient outcomes ∼ , with mean and
support [0 1] . If a dispute between the patient and the physician arises when the realized
outcome is below a certain threshold , the utility of the physician is = −(), which
is equivalent to equation (1) once we set = and = ().
There is an innovator with an idea for a new patentable technology, which we denote as
. The medical field is characterized by a dominant standard technology , which is freely
available to physicians. We model the idea-generation process following Scotchmer (1999) and
assume that and are independent draws from the uniform distribution over the interval
[0 1] . We assume that and are exogenously given and that 0 and 1 −.
These assumptions rule out extreme outcomes and ensure that there are no regions in which
the old technology is dominated or dominant for all values of .
An idea can be developed into a new technology through an R&D process. Successful
development takes place with probability () = if the innovator incurs a research cost
() = 22 As in Aghion et al. (2015), we refer to as the “innovation intensity,” which
captures the likelihood of successfully developing a new technology.
The timing of the game is as follows. The innovator draws the idea, observes and
and decides whether and how much to invest in R&D to develop the new technology. If the
new technology is developed, the innovator makes a take-it-or-leave-it offer to the physician,
who then decides whether to adopt or . If is not developed, the physician adopts .
For an illustrative example of how liability risks influence the physician’s choice between
alternative technologies, consider the case of heart-attack patients. Avraham and Schanzenbach
(2015) show that the probability of receiving a major intervention in the form of either an
insurer and find that the average physician spends 50.7 months (about 11% of a forty-year career) with an
unresolved, open malpractice claim.
3For example, Avraham (2007) finds that caps on non-economic damages enacted in a state significantly
decrease the number of cases per 1,000 doctors by 10-15 percent.
7

angioplasty or a bypass, instead of drug management and monitoring, declines by 1.25 to two
percentage points after non-economic damage caps are enacted. This provides evidence that
damage limitations can reduce treatment intensity. Furthermore, they also find evidence of
substitution between major interventions. Angioplasty declines by roughly two percentage
points after caps are imposed, while bypass surgery, which is more invasive and remunerative
than angioplasty, rises by 0.5-0.6 percentage points.
More broadly, we can also interpret the two technologies as complements. When bundled
together, the new technologies help the physician improve the patient outcome and/or better
manage the risk. In other words, is the utility of the bundle combining the old and the new
technologies, and the innovator is rewarded with the extra utility generated to the physician
when the new technology is included in the bundle. Examples include a surgical device allowing
for an easy delivery of the fetus during a cesarean section when fetal head is deeply wedged
in the pelvic cavity; an apparatus and method that position a patient for rapid and effective
endotracheal intubation; and a device delivering bioactive materials that help wound recovery
after surgeries.
3.2 Tort reforms and innovation incentives
If technology is developed, the innovator makes a take-it-or-leave-it offer to the physician
for a transfer, . The physician decides whether to accept the offer, which yields a payoff of
− or to adopt the old technology, which yields . This implies that the payoff of the
innovator will be either − or zero, depending on whether the new technology offers the
physician lower utility than the old technology.4
The physician will adopt the new technology if ≥ which occurs when is above
the following threshold:
∗ = −( − ) (2)
Figure 1 illustrates the parameter region in which the new technology is adopted and
the shift associated with tort reforms (i.e., a decrease in ). For a fixed level of liability, ,
physicians trade off technology quality with the risk of malpractice litigation. Riskier tech-
nologies ( ) are adopted as long as their quality ( − ) is large enough. Conversely,
safer technologies are adopted only if their quality is not too low. A decrease in rotates the
4Our results are robust to replacing the take-it-or-leave it offer with a Nash bargaining protocol in which the
surplus is split between the innovator and the physician.
8

adoption threshold clockwise. The result highlights that a tort reform has different effects on
adoption, depending on the characteristics of the new technology. First, there is an increase
in the adoption of high-quality but riskier technologies. This is consistent with tort reforms
mitigating the concern that high liability exposure makes physicians reluctant to adopt new
technologies (i.e., the ‘chilling effect’ of the current tort system on innovation suggested by
Parchomovsky and Stein, 2008). Second, in contrast, there is a reduction in the adoption of
low quality and safer technologies. This is consistent with the argument that high liability
exposure motivates physicians to use low-risk technologies even if their benefits to patients are
limited, and that tort reforms help mitigate this ‘defensive-adoption’ incentive. Finally, there
is no effect on the adoption of high-quality/low-risk or low-quality/high-risk technologies.
0
1
1
ALWAYS ADOPT
NEVER ADOPT
Adopt if low H
Adopt if high H
decrease in H
Figure 1: Tort reform (reduction in ) and technology adoption
The overall effect of a tort reform on technology adoption is, therefore, ambiguous. The
following proposition shows that when the old technology is sufficiently risky, in the absence of
tort reforms, the incentive to avoid malpractice claims by defensively adopting safer technologies
dominates the chilling effect of high liabilities. As a result, a tort reform would result in an
overall decrease in the propensity to adopt new technologies. That is,
Proposition 1 A decrease in generates an overall decrease in the propensity to adopt new
technologies if and only if the old technology is sufficiently risky (i.e., 12).
Proof. See Appendix.
9

So far, our analysis has focused on the effect of tort reform on technology adoption. The
overall impact of a tort reform on innovation combines its impact on adoption with the effects
on the incentives to invest in R&D. For technologies that are going to be adopted ( ≥ ),
the profits from a successful innovation are −, and the innovator will invest in R&D, ,
to the point at which the marginal cost of R&D equals its marginal benefits.
Generally speaking, tort reforms may have a positive or a negative effect on innovation
incentives, depending on the type of the new technology. At the extensive margin, because
tort reforms affect the physician’s adoption decisions, some technologies become profitable
after the reform while others are no longer profitable. The former experience an increase
in the innovation intensity while the latter experience a drop. At the intensive margin, for
technologies that are adopted regardless of the liability regime, tort reforms affect their profit
incentives. Recall that the profit from a successful innovation is equal to −−(− ).Therefore, a reduction in increases innovation intensity for technologies with and
decreases innovation intensity for those with . Finally, the relative magnitudes of the
opposing effects (extensive and intensive margins combined) on innovation incentives would
depend on how the patient benefit of the new technology compares to the old technology, as
the relative importance of safety consideration is different. The characterization of the optimal
R&D intensity shows that the overall effect of a tort reform on innovation incentives depends
on the risk level of the existing technology.
Proposition 2 The impact of a decrease in on innovation intensity is negative when the
old technology is sufficiently risky ( 12) and ambiguous otherwise (i.e., when ≤ 12).
Proof. See Appendix.
In the proof of Proposition 2, we show that, when 12, the negative impact of tort
reform on innovation dominates regardless of the level of patient benefit and, hence, the overall
net effect is negative. Intuitively, when the risk level of the old technology is high enough, a
large number of new technologies are developed and generate high profits mainly for defensive
reasons. Thus, if a reduction in is implemented, the profitability of these technologies
declines and this reduces innovation incentives. When the risk level of the existing technology
is relatively low ( 12), we show that the positive impact of tort reform on innovation
intensity dominates for technologies that convey high enough patient benefit, rendering the
overall net effect of tort reform ambiguous.
10

To summarize, our simple model shows that tort reforms have an ambiguous effect on
innovation. Moreover, it generates a testable prediction: the effect of tort reform on innovation
is more likely to be negative in technology fields characterized by a higher risk of malpractice
litigation.
3.3 Discussion of the main modeling assumptions
The model builds on a number of assumptions that warrant additional discussion. First, in
describing the idea-generation process, we assume that parameters are drawn from uniform
distributions. Uniform distribution is a common assumption when modeling ideas, given the
abstract nature of the creative process (Scotchmer, 1999). An important feature of our model
is that, even though ideas are uniformly drawn, the distribution of ideas developed into tech-
nologies is not restricted to being uniform. The innovator chooses endogenously how much to
invest in development, and she invests more when ideas are more profitable.
Second, our framework assumes that and are independently distributed. A priori,
there is no reason to impose correlation between and in the idea space. Under the interpre-
tation of and as features of a distribution of patient outcomes, correlation between and
requires restricting the shapes of the outcome distributions across ideas. For developed ideas,
correlation between and arises endogenously in our model and depends on .5
Third, for simplicity - and different from Schurtz (2014) - our model does not include
physicians’ financial incentives. Therefore, the parameter should be interpreted as a combina-
tion of the utility that the physician attaches to patients’ benefits and the financial incentives
associated with the adoption of the medical technology. These financial incentives typically
depend on patients’ insurance plans, and in our empirical analysis, we will show that our esti-
mates do not change when we control for the extent of public and private insurance coverage
by a state.
Finally, in our model, physicians act as users of medical devices, not as inventors. Our
theoretical results generalize to the case in which physicians are also innovators, as long as they
can appropriate in part or fully the rents from commercialization.
5 If we extend the model by imposing a negative correlation between and , we would expect a lower impact
of a tort reform on innovation incentives. This is because negative correlation renders more likely ideas with
high benefit and low risk (which are developed independently of the malpractice regime) and ideas with high
risk and low benefits (which are not developed even in the presence of caps on damages). Conversely, we would
expect positive correlation between and to amplify the impact of tort reforms.
11

4 Data and methods
We begin with a U.S. state-year panel dataset measuring tort reforms during the period 1985-
2005. The main source of data on tort reforms is the American Tort Reform Association
(ATRA), which lists information on reforms implemented since 1986. We complement these
data with additional information collected by Currie and MacLeod (2008) on the pre-1986
status quo and on laws overlooked by ATRA because they were overturned.
We merge this panel with the United States Patent and Trademark Office (USPTO)
patent dataset to measure patenting activity across U.S. states during our sample period.
We use the address information of the first inventor and the application year of a patent to
aggregate patents to the state-year level. Each patent is classified by the USPTO using 3-
digit technology classes, and we exploit this detailed classification system to identify medical
instrument patents.6 We also obtain data on the gross product, the population and the number
of physicians in a state.7
USPTO patents offer a unique source of data for large-scale studies on innovation.
Nonetheless, certain qualifications should be kept in mind. First, not all inventions are patented,
but the innovation literature has shown that technologies with greater impact on social welfare
and economic growth are more likely to be patented (Pakes and Griliches, 1980). Second,
innovation is a process for which it is impossible to measure the origin. Relative to alternative
measures, such as an FDA-approved device and the location information of its manufacturer,
the application date of a patent and the location of the inventors are probably the best available
measures to capture the timing and location of the origin of the invention.
It is unlikely that the tort law changes that we exploit in the paper are driven by, or
systematically correlated with, trends in medical device innovation for the following reasons.
First, most of the law changes in the ATRA sample are modifications of the general tort statutes
and are not aimed directly at medical malpractice. As described in Currie and MacLeod (2008),
there is little evidence that tort laws were passed in response to specific developments in the
health sector, and most laws apply to all torts. Priest (1987) argues that an important driver
of early tort reforms was a doctrinal change in the interpretation of tort law, leading some
6Specifically, we follow a list provided by the USPTO indicating patent classes related to medical devices:
http://www.uspto.gov/web/offices/ac/ido/oeip/taf/meddev.htm.
7These data are obtained from the US Census and the BEA. Information on the number of physicians is not
reported in the US Census Statistical Series for the years 89, 91 and 93 and are imputed by interpolation.
12

courts to increase injury compensations substantially. Moreover, a number of more recent tort
reforms were influenced by the extensive media coverage of the 1992 Liebeck v. McDonald’s
Restaurants case, in which a woman was awarded more than two million dollars when she
accidentally spilled hot coffee in her lap. Finally, it is important to note that our data also
include instances in which state courts overturned laws because of constitutionality issues. As
we show later, analysis focusing on these reforms alone provides results that are consistent with
our baseline results.8
Our paper focuses on the demand channel of liability risks (that is, changes in mal-
practice liability risks affect physicians’ demand for new technologies) instead of on the direct
effect of product liability risk on manufacturers for the following reasons. First, different from
many other sectors, medical devices are subject to national regulation. Specifically, manufac-
turers of medical devices reviewed by the FDA are subject to the Medical Device Amendments
to the Federal Food and Drug and Cosmetic Act passed in 1976, which preempts state tort
claims (Bivans, 1995). This implies that changes in state tort laws exploited in this paper are
likely to affect manufacturers through their impact on downstream users rather than through
product liability costs. Second, the product-liability risk channel seems too narrow to capture
the phenomenon in our context. For example, technologies that are demanded for defensive
reasons (e.g., diagnostic and monitoring technologies; devices that aid smooth delivery of ba-
bies during cesarean sections; or a small diameter steerable guidewire for use in procedures in
narrow arteries) are unlikely to be targets of liability claims, rendering the product-liability
channel irrelevant.
The class of tort reforms central to our empirical analysis is the introduction of caps on
non-economic damages -i.e., damages other than monetary losses, such as pain and sufferings.
As discussed in Avraham et al. (2012), these damages comprise a substantial fraction of total
awards and have often been the main focus of tort reform advocates. Consistent with the
literature, we capture tort reforms using a dummy variable, Damage Caps, which equals one if
caps on non-economic damages are in place. In our setting an indicator variable is preferable
to the actual level of caps for two reasons. First, for some of the reforms, it is difficult to
identify a precise dollar amount (i.e., they do not impose a cap of a fixed dollar amount and
8Moreover, Deng and Zanjani (2015) do not find evidence of an influence of private interest groups - such
as doctors or insurance industry professionals - on tort reform adoption. Similarly, Avraham and Schanzenbach
(2015) exploit a detailed dataset of patients experiencing heart attacks and show that passages of tort reforms
do not appear correlated with pre-existing trends in treatment intensity.
13

use a multiplier of the economic damages). Second, and more importantly, with fixed-effects
models, changes in the presence of a cap within a state provide more meaningful identification
variations than cross-state variations in the level of caps. While caps on non-economic damages
are a common state-level tort reform, we also control for other (less common) tort reforms,
such as caps on punitive damages or changes in the joint-and-several liability rules.
During our sample period, 25 states experienced changes in caps on non-economic dam-
ages. Of these states, 16 switched from no caps to a cap, whereas the remaining nine states
experienced multiple shifts (e.g., caps were instituted and then rescinded, and in some cases,
reinstated). About half of the reforms took place in the late 1980s. In terms of 1985 medical
device patenting, population and gross state product, the states in which caps on damages
were not implemented for the entire sample period are not statistically different from states in
which caps were present in some years.
Table 1 provides summary statistics. Caps on non-economic damages were present in
about 34 percent of the state-year observations of our sample. On average, inventors in a state
applied for roughly 1,700 patents (eventually granted), and about 100 of these patents were
classified by the USPTO in one of the medical device technology classes.
4.1 Econometric specification
Our main econometric model focuses on the relationship between measures of innovative activity
in state and period and the indicator for the presence of caps on non-economic damages
in state and period . Our baseline specification is:
log = Damage Caps + 0 + + + (3)
where is a vector of control variables, and and are, respectively, the state and year
fixed effects. The coefficient captures the effect of tort reforms on patenting in the state: for
example, 0 means that innovators located in a state reduce their patent applications when
damage caps are in place. We cluster the standard errors at the state level.
Our identification comes primarily from changes in damage caps over time within a state.
The controls and state effects , therefore, play an important role in our analysis. As
discussed previously, there is little evidence that the tort reforms used in our analysis are driven
by, or systematically correlated with, trends in medical device innovation. Nonetheless, we
perform several robustness checks designed to placate remaining endogeneity concerns and to
14

isolate confounding factors. For example, we construct better controls to each of the states
affected by a tort reform using the synthetic control method developed by Abadie et al. (2010).
We also exclude large states and large device companies to confirm that the results are not
driven by states that may have implemented pro-innovation policies or by large companies that
were particularly innovative during the sample period.
Because innovation activities may respond to changes in demand beyond the local level,
we also examine whether innovative activity in state and period is affected by tort
reforms in other states. This requires extending the baseline model to include non-local effects
log = Damage Caps + Non-Local Reforms + 0 + + + (4)
where Non-Local Reforms is a weighted average of tort reforms in other states
Non-Local Reforms =X6=
Damage Caps (5)
5 Baseline empirical results
In this section, we report the overall effects of the presence of non-economic damage caps on
patent applications in the medical device fields. In the next section, we explore the heterogeneity
in the data to further test the predictions of our model. The regressions in Table 2 show a
strong negative correlation between medical device patenting by innovators located in the state
and the presence of caps on non-economic damages. All the specifications include year and
state effects. These results are consistent with the idea that, in the absence of tort reforms,
the defensive-adoption effect of high liabilies dominates the chilling effect, on average.
Column 1 presents the estimates of an OLS regression with the number of medical patents
as the dependent variable. The coefficient implies an average reduction of roughly 30 patents
in years in which damage caps are present. Column 2 shows that the results are similar with an
OLS regression with log of patents as the dependent variable. Exponentiation of the coefficient
implies that in periods when caps on damages are in place, innovation is reduced by roughly 14
percent. Evaluated at the median level of patenting for state-years without damage caps (i.e.,
28 patents), this effect is equivalent to a reduction of roughly four medical device patents per
year.9
9The difference between the average effect presented in column 1 and the effect evaluated at the median is
due to the skeweness in the distribution of patenting across state-years. In Section 5.2, we report the estimated
effects separately for each treated state.
15

In column 3, we show that results are not affected if we introduce a variety of controls:
lagged total patenting; population; and the number of physicians in the state.10 Column 4
controls for other changes in tort law: cap on punitive damages; modifications of the collateral-
source rule; and modifications of the joint-and-several liability rule. The coefficients on these
dummies are all statistically insignificant and small in magnitude, confirming the predominance
of non-economic damages. Finally, column 5 shows that results are robust to excluding from the
sample states for which caps on non-economic damages pertained only to medical malpractice
rather than to torts more generally. This helps to address the concern that the effects might
be driven by legislation passed in response to specific incidents of malpractice.11
We perform a variety of robustness tests to confirm our main finding. First, there is the
concern that our regressions ignore the count nature of our dependent variable. To address this
issue, we show that our results are robust to estimating the effect of caps on damages using a
Poisson regression model with fixed effects (column 1 in Appendix Table A1).
A second series of extensions demonstrates that our main results are robust to including
extra covariates. First, Table A1 shows that the results are similar when we allow for dynamics
and use a multiplicative feedback model that controls for the logarithm of lagged patenting in
medical instruments. Also in Table A1, we extend our baseline model to include additional
controls for gross state products (GSP), the percentage of the state’s population with med-
ical insurance coverage, and the percentage of the population with private medical insurance.
These variables are proxies for the demand for new medical technologies in the state, and their
inclusion reduces the concern that tort reforms are correlated with other unobservable demand
shocks affecting innovation. The coefficient on tort reform is stable, and the coefficients on the
insurance variables are small and statistically insignificant.12 In unreported regressions, we also
confirm that our results are robust to including a control, constructed by Frakes (2013), for
the adoption of rules requiring physicians to follow national, as opposed to local, standards.13
10As an alternative approach, instead of controlling for the population and the number of physicians in the
state, we run a weighted regression with weights constructed from the pre-sample (year 1981) population in
each state. The estimated coefficient on Damage Caps is equal to -0.116 with p-value below 0.01. We find a
very similar coefficient when weights are constructed from the pre-sample number of practicing physicians in the
state. For both coefficients we cannot reject equality with the estimate in column 3 of Table 2.
11Currie and Macleod (2008) identify these states as Montana, Nevada and Alaska.
12The insurance variables are obtained from the US census, which only reports data for the period 1987-2005.
We extrapolate the time series to construct the data for the two missing years.
13The coefficient on tort reform is stable, whereas the dummy on national standardization is negative, small
16

We also examine whether our results are robust to: (i) excluding the five states with the
largest number of medical device patents in 1984; and (ii) dropping the ten largest patentees
over our sample period. The regressions reported in Table A1 indicate that the estimated
effect is not driven by the largest states or the largest firms. These findings mitigate a number
of concerns over confounding factors (e.g., that large patenting firms happen to be located in
control states or that large control states happen to have implemented pro-innovation policies).
Finally, in the last column of Table A1, we present a placebo test that estimates our base-
line model using the sample of non-medical measuring and testing instruments (USPTO class
073). The estimated coefficient is statistically insignificant and small in magnitude, suggesting
that tort reforms have not affected patenting in this technological field. This finding help to
address the concern that the impact of cap-on-damages on medical device patenting may reflect
omitted variables (e.g., pro-innovation policies) or pre-trends in patenting correlated with tort
reforms.
We turn next to two extensions that are of independent interest.
5.1 Non-local effects of tort reforms
Our empirical analysis thus far has assumed that the impact of tort reforms on innovation
is localized -i.e., it affects innovators only in states with policy changes. In this section, we
extend our baseline model and examine the effects that tort reforms have outside the state in
which they are implemented. There are a number of possible channels through which a cap on
damages imposed by one state can impact innovation incentives in other states. For example,
if caps on damages in one state substantially reduce the demand for certain technologies in the
state, they may decrease R&D investments in these technologies by local innovators, as well
as by innovators located in other states. This would lead us to underestimate the impact of
tort reform on innovation. More complex spillover effects may also arise through competitive
interaction between medical device firms in treated states and those in control states.
To examine whether market forces generate effects of tort reforms beyond the focal
state, we extend our baseline model including a new variable Non-Local Reforms, which
is a weighted average of tort reforms in other states. The first set of weights we construct
aims to be a proxy for the relative demand of medical instruments in each state 6= . To
and insignificant. A priori, it is not clear how standardization of physician practice may impact innovation
incentives, because it may combine a positive demand effect for devices used in national standard procedures,
and a negative impact for devices employed in local procedures which deviates from the standard.
17

this end, we exploit the American Medical Association (AMA) publication titled “Physician
characteristics and distribution in the U.S.” that provides detailed information on the number
of practicing physicians in the US by state and compute the share of physicians in each state
in the pre-sample year 1981, which we label . We then generate weights = to
use in the construction of Non-Local Reforms as defined in equation (5). This approach gives
higher weights to tort reforms in bigger states and, at the same time, allows us to compare the
magnitudes of the estimated effects of reforms in the focal state and other states. We add this
new control to our baseline in column 1 of Table 3. The result is striking, we find no evidence
of a significant effect of tort reform in other states on medical device patenting in the focal
state.
Our second approach constructs weights which take into account both the demand for
specific categories of medical devices in each state and the innovation supply of the focal
state across these categories. Exploiting the AMA’s data, we construct a vector with the pre-
sample (year 1981) number of practicing physicians in each state across three main speciality
groups: surgery, orthopedics and others. We then use the USPTO patent classification system
to identify pre-sample (years 1980-82) medical instrument patents in three technology areas
which parallel these speciality groups: surgery, orthopedics and others. We exploit these data
to construct
=X
where ∈ {surgery, orthopedics, others} captures specialities/technology areas, is thefraction of US patenting in technology area accounted by state and is the fraction of
US physicians in speciality area accounted by state . The construction of this variable is
consistent with a simple supply/demand model for medical instruments innovation. Intuitively,
the number of doctors in each state and speciality area is a proxy of its demand for innovation
in technology area . Similarly, the level of patenting in state and technology area is a proxy
of its supply of medical innovation to doctors in speciality area . The Non-Local Reforms
variable is then constructed using = as weights. Column 2 of Table 3 shows that
adding this, more sophisticated, control does not change our conclusion. Also in this case the
coefficient is very small in magnitude and statistically insignificant, suggesting that non-local
effects do not play a central role.14
14 In unreported regressions, we also considered a weighted average of the tort reforms in other states, in which
weights are constructed from the state-to-state migration flows data in the 2005 American Community Survey
18

The above two sets of weights do not take into account the geographic distance between
demand and supply, which may influence factors such as shipping costs and regional scale ef-
fect of sales force. We next investigate the effects of tort reforms in other states by geographic
distance directly. First, in column 3 of Table 3, we extend our baseline model by adding a
dummy for damage caps implemented in bordering states. The result shows that a tort reform
in a bordering state does not have a significant impact on the focal state’s innovation incen-
tives, with an estimated coefficient being negative but statistically insignificant. Column 4 of
Table 3 introduces a flexible specification that allows for non-linear effects of distance. Specifi-
cally, we employ five dummy variables for reforms within 500Kms, 500-750Kms, 750-1,000Kms,
1,000-1,250Kms and 1,250-1,500Kms from the focal state. The distance is constructed from
the latitude and longitude coordinates of states’ population centroids provided by the Census
Bureau. The only coefficient statistically significant (at the 0.1 level) and with magnitude
substantially larger than the others is the one for reforms within 500Km. In all regressions,
the coefficient of the direct effect of a tort reform within the focal state is stable and similar
in magnitude to the baseline regression. Overall, the data suggest that geographical spillover
effects appear to be small and concentrated within 500Kms of the focal state.
Explaining the local nature of the effect
We showed that the effect of tort reforms on medical device innovation is concentrated
among local innovators. Various features of the medical device industry may explain this find-
ing. Specifically, the medical device innovation process is characterized by the substantial
involvement of practicing physicians. Chatterji et al. (2008) find that roughly 20 percent of
medical device patents list a licensed physician among their inventors. This occurs because
physicians often develop new technologies and either patent them directly or collaborate with
manufacturing firms to protect and commercialize the technologies (Chatterji and Fabrizio,
2014). This widespread user-innovation paradigm suggests that the local nature of the effect
of tort reforms on innovation may be explained by changes in patenting by local physicians
who are directly affected by the policy change. On top of doctors’ involvement in patenting,
the local effect of tort reforms can also be explained by an informational advantage of local
innovators. Medical device innovators geographically located closer to physicians affected by
of the US Census Bureau as in Moretti and Wilson (2014). The larger the population flow from state to state
, the greater is the weight of a reform in state for state . The coefficient on this variable is also small and
statistically insignificant.
19

tort reforms may be better suited to understand and address doctors’ technological needs.15
It is hard to observe feedback from physicians systematically. We can, however, examine
the user-patenting channel more directly. We exploit data from Chatterji et al. (2008) and
identify the patents in our sample that list a licensed physician as inventor for the period
1990-1996. We find that 19.1 percent of the 1990-96 medical device patents in our sample are
classified as invented by doctors or with the participation of doctors, a figure very similar to
that in Chatterji et al. (2008). In column 1 of Table 4, we show that our main finding is
robust to focusing on the 1990-96 sub-period. In columns 2 and 3, we contrast the effect of tort
reforms for patents involving practicing physicians and other patents. The negative impact
of tort reforms appears statistically significant only for patents involving physicians, with a
coefficient twice as large as that for the other patents. This result supports the idea that a
sizable fraction of the tort reform effect is driven by local physician innovators who are directly
affected by tort law in a state.16
5.2 Synthetic control method
Our analysis so far has focused on the average effect (across treated states and over time). In
this section, we use the synthetic control method (Abadie et al., 2010) to obtain a clear graphical
representation of the effect of adopting the damage cap. By investigating each treated state
separately, this method also allows us to see which states drive the average results and the
timing and magnitude of the effect for each state.
Specifically, for each of the 16 states that transitioned from no cap to adopting a cap, we
construct a synthetic control using the 23 states that did not have a cap throughout our sample
period (donor states). The predictor variables used to construct the synthetic controls are the
number of medical patents, the total number of patents, population, GSP, and physicians per
population. The weights on the donor states are reported in Table A2 for the top six treated
15Thomas Fogarty, inventor of the embolectomy balloon catheter, states: “Physicians are the ones who recog-
nize the need, and very often, the physician is capable of conceiving what may satisfy that need. . . .. The physician
plays a key role, followed by the engineer and other specialties who have knowledge in the development of tech-
nology related to the medical field” (in Endovascular Today, March 2013). This idea is also confirmed by Shaw
(1985). In a study of British medical innovations he finds that, for half of the devices in his sample, a prototype
was developed and produced by a user. In another third of the cases, the idea was transferred directly from the
user to the manufacturer at the user’s initiative.
16As we discuss in Section 3.3, in our model, physicians act as users of medical devices, not as inventors. Our
theoretical results generalize to the case in which physicians are also innovators, as long as they can appropriate
in part or fully the rents from commercialization. For Table 4, we control only for state and year effects because
of the smaller size of this sample.
20

states (as explained below).17
The treated states vary substantially in their inventive activities. For example, the total
number of medical patents applied for between 1974 and 1986 ranges from three to 416. We
report, in Figure 2, the results for the top six treated states (according to their pre-1987 patent
stock).18 Before adopting the cap, the number of medical patents in the treated state is similar
to the corresponding synthetic control state, while patenting decreases relatively after the tort
reform. The treatment effect, defined as ( treated,after − treated,before) − ( control,after − control,before) where is the yearly average, ranges from -51.7 to -22.4 patents per year for
these six states. The mean and the median are, respectively, -36.7 and -36.1. Visual inspection
shows that, when tort reforms make a difference, the magnitude increases over time and starts
to become meaningful after five or six years.
The treatment effects for the other ten smaller states that switched from no cap to a cap
(not reported graphically) are small, ranging from -7.8 to 4.1 patents per year, with the mean
and median being both about -1. We confirm robustness of these results to excluding large
patenting states, top ten assignees, or states that are less than 500Kms from the control.
We use the placebo tests suggested by Abadie et al. (2010) for inference. For each
treated state, we iteratively apply the synthetic control method to every state in the donor
pool. Specifically, we reassign the adoption of the cap to each of the 23 donor states and
shift the treated state to the donor pool. This iterative procedure provides a distribution of
estimated treatment effects for states in which no intervention took place. The results for
the top six treated states, presented in Figure A1, show that the estimated effect for the true
treated state is among the most negative in this distribution.
Exploiting this methodology, we also examine two large states, Texas and Ohio, which
eliminated their damage caps off during the sample period. The estimated treatment effects of
eliminating the cap are positive, and equal to 48.2 and 62.7, respectively, for Texas and Ohio.
These results are consistent with our theoretical model, confirming that the negative effect of
the presence of a cap on patenting activities is unlikely to be caused by the general trend of
17Because the method requires a relatively long pre-treatment period, we extend the sample back to 1977. We
obtain the weights on the donor states by minimizing the distance between the average values of the predictor
variables in the pre-treatment period for a treated state and those for its synthetic control, subject to: (i) all
weights must be non-negative, and (ii) they sum to one.
18The top six treated states are Colorado, Maryland, Michigan, Missouri, Utah and Wisconsin. There is a
discrete drop in the pre-1987 patent stock between the sixth and the seventh states: the number is 221 for the
former and 89 for the latter.
21

increasing inventive activities in the control state.19
6 Heterogeneous effects
Our baseline analysis has documented an average negative effect of tort reforms on medical
device patenting. In this section, we examine the heterogeneity in the impact of tort reforms:
(1) by the extent of malpractice risk of a particular medical field; and (2) by the quality of an
invention.
6.1 Malpractice risk and innovation incentives
The model predicts that the impact of tort reforms is more likely to be negative in technology
fields characterized by frequent malpractice risk (i.e., high ). Intuitively, in these fields, it
is likely that physicians adopt new technologies mainly to manage liability risk. Thus, if caps
on damages are implemented, the incentives to use these technologies decline and, thus, reduce
the overall innovation incentives.
Jena et al. (2011) study US malpractice data from 1991 through 2005. They show that
the proportion of physicians facing litigation risk varies substantially across medical specialities.
The likelihood of facing a malpractice claim is the largest in surgery (especially in neurosurgery
and thoracic-cardiovascular surgery) and orthopedics, where the annual probability of facing a
claim is about 20 percent. Conversely, malpractice claims are not frequent in specialities such
as psychiatry, optics or dentistry, where the annual probability of a claim is below 3 percent.
Building on these findings, we exploit the detailed USPTO patent classification system and
identify medical instrument patents related to four technology fields: surgical, orthopedics,
optics, and dental.20
Table 5 provides the estimates for the effect of tort reforms on patenting in each of
these four fields. As our model predicts, there is a large negative effect for medical instrument
patenting related to specialities in which the frequency of malpractice claims is high (surgery
and orthopedics). Conversely, the effect is small and statistically insignificant for devices as-
sociated with specialities with fewer malpractice claims (dental and optics). While we cannot
reject that the effects on surgical and orthopedic devices have the same magnitude ( = 097),
19Both Texas and Ohio reinstated the cap in 2004, and we do not use 2004 and years after that in our analysis.
Ohio also had a brief one-year reinstatement in 1999, which we ignore in the analysis.
20We use the following 3-digit classes: 128 and 600-607 for surgical; 433 for dental; 351 and 356 for optics;
and various sub-classes of class 623 for orthopedics.
22

we can strongly reject that the effect for surgery is equal to the effect for optics ( 001) or
to the effect for dental ( 001).
6.2 Tort reform and innovation quality
Our baseline regressions indicate a negative effect of tort reforms on medical device patenting.
Such a reduction in the number of patent applications may have very different impacts on
welfare depending on whether it affects high-quality patents or marginal patents with limited
impact on the technology field. To unbundle the heterogeneous effect of tort reforms across
different quality levels, we exploit information on the citations received by each patent. Patent
citations identify prior knowledge upon which a patent builds. USPTO patent examiners are
responsible for insuring that all appropriate prior art has been cited, and this delimits the
scope of property rights granted to the patentee. Because of this important legal function, the
economics of innovation literature has often employed the number of citations received by a
patent as an indirect measure of patent value (Pakes and Griliches, 1980). Since citation counts
are inherently truncated, and levels may differ across technology areas, we filter citations by
removing grant-year and 3-digit technology class effects. We then identify the (filtered) citation
quintile in which each patent belongs.
In Table 6 we present the estimates of our baseline model for each of the quality quin-
tiles. The estimates show a non-monotonic relation between damage caps and patenting across
patents of different quintiles. The effect is not statistically significant for innovations in the
lowest quintile of innovation quality. The effect becomes negative and significant in the second
quintile, and the magnitude of the negative effect is larger as innovation quality increases (with
the largest being in the fourth quintile). The effect, again, becomes small and insignificant for
innovations in the top quality quintile.
We perform a variety of tests to confirm robustness of this finding. First, we re-estimate
the relationship between damage caps and patenting disaggregating at the finer level of citation
deciles. The (unreported) estimates are in line with those from the quintile analysis and show
a U-shaped relationship between tort reform and innovation. There is a statically significant
negative impact only for patents from the 4th to the 9th deciles, with the largest effects on
the 7th decile of the distribution. Second, we confirm that the pattern is robust to using
alternative measures of patent quality. In Appendix Table A3, we construct quintile bins
exploiting residuals obtained from regressing citations against year effects, technology effects
and the number of claims. This alternative measure - which captures normalized citations per
23

patent claim — yields results very similar to those obtained in Table 6.21
Explaining the U-shaped effect
The non-monotonic impact of tort reforms illustrated in Table 6 is predicted by our
model when we perform comparative statics in , which is the expected benefit to the patient
from the new technology. This result is formally proved when we derive the main result of
Proposition 2, and it is illustrated in Appendix Figure A2. Intuitively, physicians do not
adopt low-quality technologies independent of the malpractice liability regime and, hence, tort
reforms have little impact in that quality bin. As the value of a new technology increases and
gets closer to the value of the old technology, adoption becomes more likely mainly to manage
risk. In this quality bin, the effect of tort reforms on innovation incentives is negative because
the physician’s willingness to pay for a safer technology decreases after the reform. For new
technologies with value greater than the old technology, tort reform has two opposing effects: It
decreases innovation incentives for safer devices, but increases innovation incentives for riskier
devices. Furthermore, the positive effect of the reform gets stronger than its negative effect as
the value of the new technologies becomes higher. This explains why the negative effect of tort
reform is mitigated at higher quality bins and we find an insignificant effect for patents of the
highest quality.
Note that the model generates a non-monotonic relationship between tort reform and
, which is the expected benefit to the patient from the new technology. In performing this
comparative statics, we let (the expected risk level of the new technology) vary endogenously
for each level of . To empirically disentangle from is very challenging with our data,
and citations are a measure of quality available for a variety of different medical technologies.
While it is likely that the lowest quintile of the citation distribution captures innovations with
very low and that patents in the top quintile capture technologies with very large ,
intermediate quintiles may contain technologies with mixed levels of and . Despite the
presence of such measurement error, the estimates are consistent with the model’s predictions,
suggesting that citations may be a reasonable proxy for .
We perform an additional test of the prediction of the model exploiting the fact that
in the U.S. medical devices are subject to the FDA regulatory process. One of the FDA’s
regulatory pathways to bring a device to market is the Pre-market Approval (PMA) process,
21We also obtain similar results: (i) filtering citations removing only the grant year effects; and (ii) measuring
quality with the number of patent claims filtered by 3-digit technology effects.
24

which requires detailed product information and evidence of safety from clinical trials (Stern,
2015). The FDA requests PMAs for “high-risk” devices that are used to support or sustain
human life, and the expenditure required to complete PMAs is substantial (75 million dollar
per device according to survey evidence in Makower et al., 2010). This high cost, combined
with the “high-risk” nature of the medical devices involved in PMAs, suggests that data on
PMAs may provide a reasonable window on technologies with high and . Our theoretical
framework suggests that tort reforms will not strongly affect innovation incentives for these
devices. The model predicts an ambiguous effect for these technologies, with a magnitude
(positive or negative) lower than the one for devices with lower .
Exploiting the data released by the FDA for PMA requests as a measure of innovation,
we run a variety of (unreported) regressions estimating the impact of tort reforms. Coefficients
are small and statistically insignificant across the various specifications. While this insignificant
effect is in line with our theory, two key qualifications should be kept in mind. First, FDA
applicants are often manufacturers that are not necessarily the innovators. Second, there is
evidence of strategic delays in the introduction of medical devices in the U.S. market relative
to the European markets (Grennan and Town, 2015). Both of these issues may generate
substantial measurement errors for innovative activities and geographic locations and, hence,
bias the coefficients toward zero.
7 Conclusions
This paper investigates how tort reforms affect the development of new medical device tech-
nologies by exploiting state tort reforms and patent data for the period 1985-2005. We develop
a theoretical model in which tort reforms increase physicians’ propensity to adopt riskier tech-
nologies by mitigating the “chilling effect” of high liabilities emphasized by legal scholars. At
the same time, we show that tort reforms also reduce physicians’ propensity to defensively
adopt low-risk technologies in order to avoid malpractice liability, even when their benefits to
patients are limited. These shifts in technology adoption affect upstream R&D investments,
and the overall impact on the development of new devices depends on the relative strengths of
the two effects.
Our empirical analysis shows that the introduction of caps on non-economic damages
is associated with an average decline in patenting for medical instrument technologies. This
suggests that, on average, the demand for new technologies generated by high liabilities exceeds
25

the negative chilling effect that damages have on medical device innovation. Consistent with
the model’s predictions, we find that tort reforms have a greater negative effect in specialities
with a high frequency of malpractice claims (and, hence, stronger defensive-adoption effects
when damages are high). Moreover, we find that the effect is the most negative for patenting
at intermediate quality levels, while it is insignificant for patenting at the top and the bottom
of the quality distribution. For the most valuable medical technologies, the insignificant effect
of tort reforms indicates that, empirically, the positive effect of caps on damages on medical
innovation counterbalances their negative effect.
More broadly, our paper provides empirical evidence that tort reforms can affect the
rate of technological change, indicating that these policies have dynamic effects on innovation
incentives that go beyond their short-term impact on patients and health costs. As Finkelstein
(2004) stresses, recognizing and estimating these dynamic effects is crucial to evaluating the
costs and benefits of tort reforms.
There are several useful directions for further research. Our paper infers the differential
effects of tort reforms on different types of technologies without directly categorizing the tech-
nologies. With patent textual analysis, it may be possible to more precisely measure the impact
of tort reforms across finer classes of medical devices. Second, our paper does not evaluate the
welfare effect of tort reforms on innovations. This would require a more structural analysis
of the value of safer technologies versus riskier, but potentially more effective, technologies to
physicians and to patients, as well as the spillover effects of these technologies to other sectors
of the economy.
References
[1] Abadie, Alberto, Alexis Diamond, and Jens Hainmueller (2010), “Synthetic control meth-
ods for comparative case studies: Estimating the effect of California’s tobacco control
program,” Journal of the American Statistical Association 105: 493-505
[2] Acemoglu, Daron, David Cutler, Amy Finkelstein, and Joshua Linn (2006), “Did Medicare
Induce Pharmaceutical Innovation?,” American Economic Review 96: 103-107
[3] Acemoglu, Daron and Joshua Linn (2004), “Market Size in Innovation: Theory and Evi-
dence from the Pharmaceutical Industry,” Quarterly Journal of Economics 119: 1049-1090
26

[4] Aghion, Philippe, Antoine Dechezleprêtre, David Hemous, Ralf Martin, and John Van
Reenen (2015), “Carbon taxes, path dependency and directed technical change: evidence
from the auto industry,” Journal of Political Economy, forthcoming
[5] Agrawal, Ajay and Iain Cockburn (2003), “The anchor tenant hypothesis: exploring the
role of large, local, R&D-intensive firms in regional innovation systems,” International
Journal of Industrial Organization 21: 1227—1253
[6] Avraham, Ronen (2007), “An empirical study of the impact of tort reforms on medical
malpractice settlement payments,” Journal of Legal Studies 36: 183—229.
[7] Avraham, Ronen, Leemore S. Dafny and MaxM. Schanzenbach (2012), “The impact of tort
reform on employer-sponsored health insurance premiums,” Journal of Law, Economics,
and Organization 28: 657-686
[8] Avraham, Ronen and Max Schanzenbach (2015), “The impact of tort reform on intensity
of treatment: Evidence from heart patients,” Journal of Health Economics 39: 273-288
[9] Arrow, Kenneth (1962), “Economic welfare and the allocation of resources for invention,”
in The Rate and Direction of Inventive Activity: Economic and Social Factors (Princeton:
Princeton University Press)
[10] Barker, Drucilla (1992), “The Effects of Tort Reform on Medical Malpractice Insurance
Markets: An Empirical Analysis,” Journal of Health Politics, Policy and Law 17: 143-
161.
[11] Bivans, Roger (1995), “Substantially Equivalent Federal Preemption of State Common-
Law Claims Involving Medical Devices,” Texas Law Review 74: 1087-1095
[12] Bloom, Nick, Mark Schankerman, and John Van Reenen (2013), “Identifying Technology
Spillovers and Product Market Rivalry,” Econometrica, 81: 1347—1393
[13] Blume-Kohout, Margaret and Neraj Sood (2013), “Market Size and Innovation: Effects
of Medicare Part D on Pharmaceutical Research and Development,” Journal of Public
Economics 97: 327-336
[14] Budish, Eric, Benjamin Roin and Heidi Williams (2015), “Do Firms Underinvest in Long-
Term Research? Evidence from Cancer Clinical Trials,” American Economic Review, 105:
2044-2085
27

[15] Chatterji, Aaron, Kira Fabrizio, Will Mitchell and Kevin Schulman (2008), “Physician-
industry cooperation in the medical device industry,” Health Affairs 27: 1532-1543
[16] Chatterji, Aaron, Kira Fabrizio (2014), “Using users: When does external knowledge
enhance corporate product innovation?,” Strategic Management Journal 35: 1427-1445
[17] Clemens, Jeffrey (2013), “The effect of U.S. health insurance expansion on medical inno-
vation,” NBER working paper 19761
[18] Currie, Janet and Bentley MacLeod (2008), “First Do No Harm? Tort Reform and Birth
Outcomes,” Quarterly Journal of Economics 123: 795-830
[19] Danzon, Patricia (1984), “The Frequency and Severity of Medical Malpractice Claims,”
Journal of Law and Economics 17: 115-148.
[20] Deng, Yiling and George Zanjani (2015), “What Drives Tort Reform Legislation? Eco-
nomics and Politics of the State Decisions to Restrict Liability Torts,” working paper
[21] Finkelstein, Amy (2004), “Static and dynamic effects of health policy: Evidence from the
vaccine industry,” Quarterly Journal of Economics 119, 527-564
[22] Frakes, Michael (2013), “The Impact of Medical Liability Standards on Regional Varia-
tions in Physician Behavior: Evidence from the Adoption of National-Standard Rules,”
American Economic Review 103: 257-276
[23] Frakes, Michael and Jena Anupam (2016), “Does Medical Malpractice Law Improve Health
Care Quality?,” Journal of Public Economics, forthcoming.
[24] Galasso, Alberto, Mark Schankerman, and Carlos Serrano (2013), “Trading and enforcing
patent rights,” RAND Journal of Economics 44: 275-312
[25] Greenberg, Michael (2009), “Medical Malpractice and New Devices: Defining an Elusive
Standard of Care,” Health Matrix 19: 423-45
[26] Grennan, Matthew and Robert Town (2015), “Regulating Innovation with Uncertain Qual-
ity: Information, Risk, and Access in Medical Devices,” working paper
[27] Jaffe, Adam and Karen Palmer (1997), “Environmental Regulation And Innovation: A
Panel Data Study,” Review of Economics and Statistics 79: 610-619
28

[28] Jena, Anupam, Seth Seabury, Darius Lakdawalla and Amitabh Chandra (2011), “Mal-
practice risk according to physician specialty,” New England Journal of Medicine 365:
629-636
[29] Kessler, Daniel (2011), “Evaluating the Medical Malpractice System and Options for Re-
form,” Journal of Economic Perspectives 25: 93—110.
[30] Kessler, Daniel and Mark McClellan (1996), “Do Doctors Practice Defensive Medicine?,”
Quarterly Journal of Economics 111: 353-390
[31] Makower, Josh, Aabed Meer and Lyn Denend (2010), “FDA impact of us medical technol-
ogy innovation: A survey of over 200 medical technology companies,” Stanford University
Report
[32] Marx, Matt, Deborah Strumsky, and Lee Fleming (2009), “Mobility, skills, and the Michi-
gan non-compete experiment,” Management Science 55: 875-889
[33] Moretti, Enrico and Daniel Wilson (2014), “State incentives for innovation, star scientists
and jobs: Evidence from biotech,” Journal of Urban Economics 79: 20-38.
[34] Nistor Christina and Catherine Tucker (2015), “Third-Party Certification: The Case of
Medical Devices,” working paper
[35] Pakes, Ariel and Zvi Griliches (1980), “Patents and R&D at the firm level: A first report,”
Economics Letters 5: 377-381
[36] Parchomovsky, Gideon and Alex Stein (2008), “Torts and Innovation,” Michigan Law
Review 107: 285-315
[37] Priest, George (1987), “The current insurance crisis and modern tort law,” Yale Law
Journal 96: 1521-1590
[38] Priest, George (2011), “The Effects of Modern Tort Law on Innovation and Economic
Growth,” in Rules for Growth, the Kauffman Task Force on Law, Innovation, and Growth
[39] Scotchmer, Suzanne (1999), “On the optimality of the patent renewal system,” RAND
Journal of Economics 30: 181-196
29

[40] Seabury, Seth, Amitabh Chandra, Darius Lakdawalla, and Anupam B. Jena (2013) “On
average, physicians spend nearly 11 percent of their 40-year careers with an open, unre-
solved malpractice claim,” Health Affairs 32: 111-119
[41] Shaw, Brian (1985), “The role of the interaction between the user and the manufacturer
in medical equipment innovation,” R&D Management 15: 283-292
[42] Shurtz, Ity (2014), “Malpractice Law, Physicians’ Financial Incentives, and Medical Treat-
ment: How Do They Interact?,” Journal of Law and Economics 57: 1-29
[43] Stern, Ariel (2015), “Innovation under Regulatory Uncertainty: Evidence from Medical
Technology,” working paper
[44] Vakili, Keyvan and Laurina Zhang (2015), “High on Creativity: The Impact of Marijuana
Legalization on Innovative and Creative Outcomes,” working paper
[45] Viscusi, Kip and Michael Moore (1993), “Product liability, research and development, and
innovation,” Journal of Political Economy 101: 161-184
[46] Viscusi, W. Kip, and Patricia Born (1995), “Medical Malpractice Insurance in the Wake
of Liability Reform,” Journal of Legal Studies 24: 463-490.
[47] Weyl, Glenn and Jean Tirole (2012), “Market Power ScreensWillingness to Pay,”Quarterly
Journal of Economics 127: 1971-2003
Appendix
Proof of Proposition 1
The area in the ( ) space in which technology is adopted is equal to
=
1Z0
(1− +( − ))
= 1− +( − 12)
with derivative
= − 1
2which is positive if 12
30

Proof of Proposition 2
The optimal innovation intensity for an innovator with idea ( ) solves
max
( − −( − ))− 2
2
which is equal to ∗ = −. Consider an innovator with an idea with expected benefit .
She will invest in R&D as long as
− −( − ) ≥ 0
or
≤ −
+ ≡ .
The innovation intensity for firms at is
Z
0
− −(− ) =2
2 (6)
Considering the corner solutions when is outside the unit interval in (6), we obtain the
expected innovation intensity for a fixed level of :
( ) =
⎧⎪⎨⎪⎩0 if 0 −0
2
−
+ 2 if 0 −0 + 0 −0
− +( − 12) if ≥ + 0 −0.
(7)
We exploit formula (7) to study the impact of tort reforms on innovation as well as the hetero-
geneity in the impact across technologies with different levels of expected benefits. To compute
the total expected innovation investment we integrate ( ) for each value of . The total
effect comprises three parts. The first part isZ −0
0
0 = 0
The second part is+−Z−
2
−
+ 2 =
1
62
The third part of the innovation intensity is
Z 1
+−
µ − +( − 1
2)
=1
222 −
1
22 − +
1
2 + − 1
2 +
1
22 − +
1
2.
31

Which implies that the expected innovation intensity as function of ( ) is equal to
( ) =1
222 −
1
22 +
1
62 − +
1
2 + − 1
2 +
1
22 − +
1
2
The following derivative captures the impact of a tort reform:
=1
3 +
1
2 + − − +2 −
1
2.
When = 05 we have that = 12 0 Moreover,2
= 1 − − + 2
which is increasing in for every value of if ≥ 12 We now look at the effect acrossvarious levels of . When −, we have that
= 0 and
2
= 0. When
− ≤ ≤ + − we have that
=
22− ( − )
2
22≥ 0
The positive inequality follows because − implies − which in
turn implies ( − )2 ()
2. Moreover2
= − −
2which is increasing when
− 0 and decreasing when − 0 Thus the derivative is maximized at = .
Finally, when ≥ + −, we have that
= (− 1
2) and
2
= 0 Notice that
the maximum value that
can take is
22because
22
− 12for any ≤ 1 Figure A2
illustrates these findings.
32

Figure 2. Medical patenting in treated states and synthetic controls
NOTES: This figure plots the number of medical patents by the application year for a treated state and its synthetic
control. These six states had the largest pre‐1987 medical‐patent stock among the 16 states that switched from
having no cap to imposing a cap on non‐economic damages between 1977 and 2005. The control is generated
using the same 23 states that did not impose a cap throughout the sample period. Vertical lines separate the pre‐
and post‐cap periods.

Obs. Mean Std. Dev. Min Max
Total Patents 1071 1697.8 3110.4 21 28383
Medical Device Patents 1071 98.8 210.4 0 2070
Damage Caps 1071 0.3 0.5 0 1
Year 1071 1995 6.1 1985 2005
Population (1,000) 1071 5189.2 5753.1 453.5 35827.9
Physicians per 1,000 population 1071 2.3 0.9 1.2 7.9
Table 1. Summary statistics
NOTES: Unit of observation is U.S. state‐year. Total Patents is the total number of patents applied for (and eventually granted)
in a year in the state. Medical Device Patents are applications classified by the USPTO in one of the medical device patent
classes. Damage Caps is equal to one if the state has a cap on non‐economic damages. Data on population and physicians are
from the US Census and the Bureau of Economic Analysis (BEA).

(1) (2) (3) (4) (5)
Dependent Variable Med Patst log(Med Patst) log(Med Patst) log(Med Patst) log(Med Patst)
Damage Capst ‐29.708** ‐0.150** ‐0.159*** ‐0.152*** ‐0.162**
(12.52) (0.06) (0.06) (0.06) (0.07)
log(Population) 1.134*** 1.400*** 1.094**
(0.44) (0.43) (0.42)
Physicians per 1,000 population 0.130 0.119 0.112
(0.16) (0.162) (0.17)
log(Total Patentst‐1) 0.045 0.030 0.083
(0.13) (0.13) (0.14)
Punitive Damage Cap ‐0.084
(0.07)
Collateral‐source rule 0.053
(0.09)
Joint and Separate Liability ‐0.030(0.07)
Year Effects YES YES YES YES YESState Effects YES YES YES YES YES
Drop states with malpractice‐
focused reformYES
Observations 1071 1071 1071 1071 1008
Table 2. Damage caps and medical device patenting
NOTES: OLS estimation. * significant at 10 percent, ** significant at 5 percent and *** significant at 1 percent. Med Pats =
number of patent applications in medical device fields in the state. Damage Caps =1 if a cap on non‐economic damages is
present in the state. Total Patents = total patent applications in the state. Other reform dummies are indicator variables for
cap on punitive damages, modifications of the collateral‐source rule and modifications of the joint‐and‐several l iability rule.
Robust standard errors clustered at the state level. In columns 2‐5, we add 1 to Med Pats and include a dummy that equals one
for state‐years without patenting.

Table 3. Non‐local effects of tort reforms
(1) (2) (3) (4)
Dependent Variable log(Med Patst) log(Med Patst) log(Med Patst) log(Med Patst)
Damage Capst ‐0.161*** ‐0.161*** ‐0.161*** ‐0.147***
(0.06) (0.06) (0.06) (0.05)
Non‐Local Reforms
(Demand)‐0.002
(0.01)
Non‐Local Reforms
(Demand‐Supply)‐0.001
(0.01)
Cap in border state ‐0.086
(0.06)
Cap within 500 Km ‐0.119*
(0.07)
Cap in 500 to 750 Km 0.093
(0.07)
Cap in 750 to 1000 Km ‐0.001
(0.06)
Cap in 1000 to 1250 Km ‐0.003
(0.09)
Cap in 1250 to 1500 Km 0.093
(0.06)
Control variables YES YES YES YES
Year Effects YES YES YES YES
State Effects YES YES YES YES
Observations 1071 1071 1071 1071
NOTES: OLS estimation. * significant at 10 percent, ** significant at 5 percent and *** significant at 1 percent. Med Pats =
number of patent applications in medical device fields in the state. Damage Caps =1 if a cap on non‐economic damages is
present in the state. We add 1 to Med Pats and include a dummy that equals one for state‐years without patenting. Non‐Local
Reform (Demand) = weighted average of Damage Caps in other states with weights constructed from pre‐sample distributions
of practicing physicians. Non‐Local Reform (Demand‐Supply) = weighted average of Damage Caps in other states with weights
constructed exploiting both pre‐sample distributions of practicing physicians across special ities and pre‐sample patenting
across technology fields. Cap in border state = 1 if caps are present in border state. Other dummies =1 if caps are present
within geographical distance. Control variables include log(Population), Physicians per 1,000 population, and lagged
log(TotalPatents).

Table 4. Damage caps and physicians' patents
(1) (2) (3)
Dependent Variable log(Med Patst)log(Med Patst)
by physicians
log(Med Patst)
by other
inventors
Damage Capst ‐0.268* ‐0.426*** ‐0.210
(0.13) (0.15) (0.13)
Year Effects YES YES YES
State Effects YES YES YES
Observations 357 357 357
NOTES: OLS estimation. * significant at 10 percent, ** significant at 5 percent and ***
significant at 1 percent. Med Pats = number of patent applications in medical device
fields in the state. Damage Caps =1 if a cap on non‐economic damages is present in the
state. Robust standard errors clustered at the state level. Data on medical patenting by
physicians are from Chatterji et al. (2008).
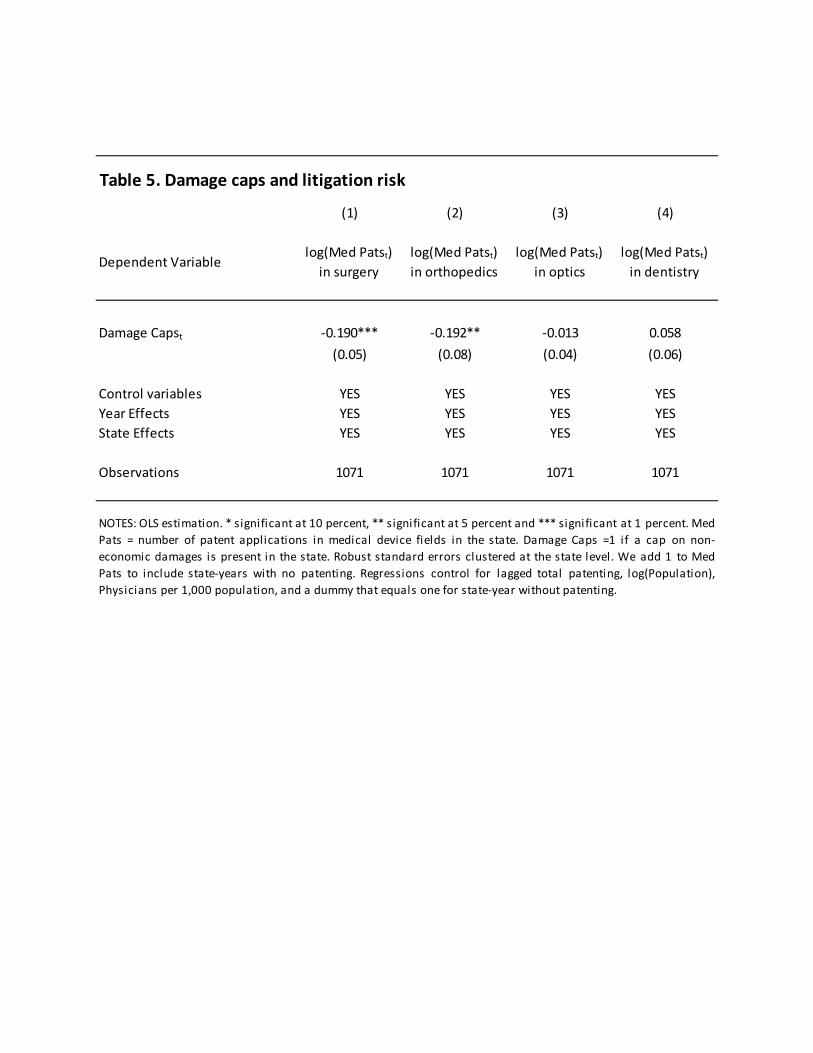
Table 5. Damage caps and litigation risk
(1) (2) (3) (4)
Dependent Variablelog(Med Patst)
in surgery
log(Med Patst)
in orthopedics
log(Med Patst)
in optics
log(Med Patst)
in dentistry
Damage Capst ‐0.190*** ‐0.192** ‐0.013 0.058
(0.05) (0.08) (0.04) (0.06)
Control variables YES YES YES YES
Year Effects YES YES YES YES
State Effects YES YES YES YES
Observations 1071 1071 1071 1071
NOTES: OLS estimation. * significant at 10 percent, ** significant at 5 percent and *** significant at 1 percent. Med
Pats = number of patent applications in medical device fields in the state. Damage Caps =1 if a cap on non‐
economic damages is present in the state. Robust standard errors clustered at the state level. We add 1 to Med
Pats to include state‐years with no patenting. Regressions control for lagged total patenting, log(Population),
Physicians per 1,000 population, and a dummy that equals one for state‐year without patenting.

Table 6. Damage caps and patent quality
(1) (2) (3) (4) (5)
Dependent Variable
log(Med Patst) in
1st citation
quintile
log(Med Patst) in
2nd citation
quintile
log(Med Patst) in
3rd citation
quintile
log(Med Patst) in
4th citation
quintile
log(Med Patst) in
5th citation
quintile
Damage Capst 0.312 ‐0.399** ‐0.603*** ‐0.810*** ‐0.177
(0.21) (0.16) (0.18) (0.16) (0.14)
Control variables YES YES YES YES YES
Year Effects YES YES YES YES YES
State Effects YES YES YES YES YES
Observations 1071 1071 1071 1071 1071
NOTES: OLS estimation. * significant at 10 percent, ** significant at 5 percent and *** significant at 1 percent. Med Pats = number of patent
applications in medical device fields in the state. Damage Caps =1 if a cap on non‐economic damages is present in the state. Citations
quintiles constructed from citations fi ltered by grant‐year and technology‐class effects. Robust standard errors clustered at the state level.
We add 1 to Med Pats to include state‐years with no patenting. Regressions control for lagged total patenting, log(Population), Physicians
per 1,000 population, and a dummy that equals one for state‐years without patenting.

Figure A1. Effect of damage caps in treated and placebo states
NOTES: For each of the six largest states switching from no caps on non-economic damages to a cap, we apply the same synthetic control method to each of the same 23 donor states (i.e., states that do not impose a cap throughout the sample period). During each iteration, this particular treated group is allocated to the donor pool. We follow Abadie et al. (2010) and exclude the placebo states for which the pre-intervention MSPE is more than twice as large as that of the treated state.

Figure A2. Effect of a reduction in H on innovation intensity for different levels of bN and rO.

(1) (2) (3) (4) (5) (6)
Dependent Variable Med Patst log(Med Patst) log(Med Patst) log(Med Patst)log(Med Patst)
dropping largest assignees
log(Mesurement Patst)
Estimation Method Poisson OLS OLS OLS OLS OLS
Samplefull full full
drop largest states
full full
Damage Capst -0.097** -0.132*** -0.186** -0.154*** -0.163*** -0.027(0.04) (0.05) (0.09) (0.06) (0.06) (0.06)
log(MedPatst-1) 0.231***(0.06)
-0.008(0.01)
-0.002(0.01)
log(GSP) 0.255(0.312)
Control variables YES YES YES YES YES YESYear Effects YES YES YES YES YES YESState Effects YES YES YES YES YES YES
Observations 1071 1071 1071 966 1071 1071
Table A1. Robustness of baseline specification
Percentage of population with insurance coverage
Percentage of population with private insurance
NOTES: OLS estimation. * significant at 10 percent, ** significant at 5 percent and *** significant at 1 percent. Med Pats = number of patentapplications in medical device fields in State. Damage Caps =1 if a cap on non-economic damages is present in the state. GSP= Gross Stateproduct. Robust standard errors clustered at the state level. We include a dummy that equals one for state-years with zero patenting. Incolumn 4, we drop states with the largest patenting in medical devices in 1984 (CA, DE, NY, NJ and FL). In column 5, we drop the ten largestpatentees in medical instruments over our sample period. In Column 6, we conduct a placebo test using the measuring and testing (patentclass 73). Columns 2-6 also control for lagged total patenting, log(Population), and Physicians per 1,000 population.

Table A2. Weights of donor states used to contruct the synthetic controls
Donor States CO MD MI MO UT WI
AZ 0.005 0 0 0.011 0 0.009 AR 0 0 0 0.006 0.023 0.006 CT 0.007 0 0 0.008 0 0.009 DE 0.004 0 0.015 0.003 0 0.002 DC 0.124 0.2 0 0.021 0 0.013 GA 0.144 0.467 0 0.53 0 0.153 IN 0.139 0 0 0.017 0 0.417 IA 0.36 0 0 0.001 0 0.008 KY 0.008 0 0 0.008 0 0.01 ME 0 0 0 0.003 0.657 0.004 MA 0.005 0.01 0 0.007 0 0.006 MN 0.143 0.154 0 0.112 0.246 0.228 NE 0.002 0 0 0.004 0 0.005 NJ 0.006 0 0 0.006 0 0.005 NY 0.003 0.116 0 0.003 0 0.001 NC 0.007 0 0.537 0.193 0 0.075 PA 0.004 0 0.447 0.004 0 0.003 RI 0.002 0 0 0.004 0 0.004 SC 0.001 0 0 0.011 0 0.009 TN 0.005 0.053 0 0.03 0 0.016 VT 0.001 0 0 0.003 0 0.003 VA 0.01 0 0 0.014 0 0.009 WY 0.02 0 0 0.002 0.074 0.003
NOTES: This table reports the weights of the 23 donor states used to construct the synthetic controls for the largest six states that changed from having no non-economic damage cap to having one. See Figure 3 for the estimates of the synthetic control method.

Table A3. Damage caps and patent quality - Robustness to extra-filtering
(1) (2) (3) (4) (5)
Dependent Variablelog(Med Patst) in 1st citation
quintile
log(Med Patst) in 2nd citation
quintile
log(Med Patst) in 3rd citation
quintile
log(Med Patst) in 4th citation
quintile
log(Med Patst) in 5th citation
quintile
Damage Capst 0.234 -0.404** -0.678*** -0.733*** -0.193(0.18) (0.19) (0.18) (0.17) (0.13)
Control variables YES YES YES YES YESYear Effects YES YES YES YES YESState Effects YES YES YES YES YES
Observations 1071 1071 1071 1071 1071
NOTES: OLS estimation. * significant at 10 percent, ** significant at 5 percent and *** significant at 1 percent. Med Pats =number of patent applications in medical device fields in the state. Damage Caps =1 if a cap on non-economic damages ispresent in the state. Citations quintiles constructed from citations filtered by grant-year effects, technology-class effects andnumber of claims. Robust standard errors clustered at the state level. We add 1 to Med Pats to include state-years with nopatenting. Regressions also control for lagged total patenting, log(Population), and Physicians per 1,000 population.