total and nonheme dietary iron intake is associated with ... · nutrients article total and nonheme...
TRANSCRIPT

nutrients
Article
Total and Nonheme Dietary Iron Intake Is Associatedwith Metabolic Syndrome and Its Componentsin Chinese Men and Women
Zhenni Zhu 1,2 , Fan Wu 2, Ye Lu 3, Chunfeng Wu 4, Zhengyuan Wang 2, Jiajie Zang 2,Changyi Guo 2, Xiaodong Jia 2, Jiahui Yao 5, Hui Peng 6, Yuna He 1, Jing Sun 1,Jian Huang 1 and Gangqiang Ding 1,*
1 National Institute for Nutrition and Health, Chinese Center for Disease Control and Prevention,27 Nanwei Road, Xicheng District, Beijing 100050, China; [email protected] (Z.Z.);[email protected] (Y.H.); [email protected] (J.S.); [email protected] (J.H.)
2 Division of Health Risk Factors Monitoring and Control, Shanghai Municipal Center for DiseaseControl and Prevention, 1380 West Zhongshan Road, Shanghai 20036, China; [email protected] (F.W.);[email protected] (Z.W.); [email protected] (J.Z.); [email protected] (C.G.);[email protected] (X.J.)
3 Division of Non-Communicable Diseases Prevention and Control, Shanghai Municipal Center forDisease Control and Prevention, 1380 West Zhongshan Road, Shanghai 20036, China; [email protected]
4 Department of Profession Management, Shanghai Municipal Center for Disease Control and Prevention,1380 West Zhongshan Road, Shanghai 20036, China; [email protected]
5 Department of Public Health, Shanghai Xuhui District Center for Disease Control and Prevention,50 Yongchuan Road, Shanghai 200237, China; [email protected]
6 Department of Public Health, Shanghai Jiading District Center for Disease Control and Prevention,264 Tacheng Road, Shanghai 201800, China; [email protected]
* Correspondence: [email protected]; Tel.: +86-10-6623-7001
Received: 13 October 2018; Accepted: 31 October 2018; Published: 4 November 2018�����������������
Abstract: The causal relationship between serum ferritin and metabolic syndrome (MetS) remainsinconclusive. Dietary iron intake increases serum ferritin. The objective of this study was to evaluateassociations of total, heme, and nonheme dietary iron intake with MetS and its components in menand women in metropolitan China. Data from 3099 participants in the Shanghai Diet and HealthSurvey (SDHS) obtained during 2012–2013 were included in this analysis. Dietary intake was assessedby 24-h diet records from 3 consecutive days. Multivariate generalized linear mixed models were usedto evaluate the associations of dietary iron intake with MetS and its components. After adjustment forpotential confounders as age, sex, income, physical exercise, smoking status, alcohol use, and energyintake, a positive trend was observed across quartiles of total iron intake and risk of MetS (p fortrend = 0.022). Compared with the lowest quartile of total iron intake (<12.72 mg/day), the highestquartile (≥21.88 mg/day) had an odds ratio (95% confidence interval), OR (95% CI), of 1.59 (1.15,2.20).In addition, the highest quartile of nonheme iron intake (≥20.10 mg/day) had a 1.44-fold higher riskof MetS compared with the lowest quartile (<11.62 mg/day), and higher risks of MetS componentswere associated with the third quartiles of total and nonheme iron intake. There was no associationbetween heme iron intake and risk of MetS (p for trend = 0.895). Associations for total and nonhemeiron intake with MetS risk were found in men but not in women. Total and nonheme dietary ironintake was found to be positively associated with MetS and its components in the adult populationin metropolitan China. This research also revealed a gender difference in the association betweendietary iron intake and MetS.
Keywords: dietary iron intake; heme iron; nonheme iron; metabolic syndrome; population-based study
Nutrients 2018, 10, 1663; doi:10.3390/nu10111663 www.mdpi.com/journal/nutrients

Nutrients 2018, 10, 1663 2 of 20
1. Introduction
China has experienced a cardiovascular disease epidemic in recent decades [1]. Metabolic syndrome(MetS) refers to a constellation of interrelated risk factors that increase the development of bothcardiovascular disease and type 2 diabetes mellitus [2]. The current nationwide prevalence of MetSamong Chinese adults is 24.2%, which is an astonishing increase compared with the value of 9.8%calculated one decade ago based on the same diagnostic criteria [3,4].
A few studies have demonstrated an association between serum ferritin and MetS [5–8], but whetherMetS is causally related to higher levels of iron metabolic markers or whether higher levels of ironmetabolic markers lead to MetS remains inconclusive. Iron overload is characterized physiologically byan increase in the serum ferritin levels [9], and some studies have shown that meat or heme iron intake isrelated to the ferritin levels in serum [10,11]. However, high levels of serum ferritin can also be producedas a consequence of metabolic disorders, regardless of the iron overload status [12].
Few studies have investigated the relationship between dietary iron intake and MetS, which couldpotentially address the causative nature of the association between iron metabolic markers and MetS.Iron is present in foods in a heme or nonheme form. Heme iron is in most animal foods, and the restof the iron in animal or plant food is nonheme iron [13]. Heme iron is more efficiently absorbed thannonheme iron as approximately 25% heme iron and 5% nonheme iron from diet absorbed by body [14].The Chinese diet is known to be plant-based, which implies a low bioavailability of dietary iron.The primary objective of this study was to evaluate the associations of dietary iron intake, in termsof total, heme and nonheme iron intake, with MetS and its components in the adult population inmetropolitan China. Considering the different physiologic mechanisms underlying body iron lossamong men and women, it was intended to also analyze these associations stratified by gender. To thebest of our knowledge, this population-based study constitutes the first investigation of the relationshipbetween dietary iron intake and MetS in a Chinese population.
2. Materials and Methods
2.1. Study Population
The data used in this study were obtained from a cross-sectional investigation, the firstwave of the Shanghai Diet and Health Survey (SDHS), which was conducted in Shanghai, one ofthe most developed cities in China, during the period 2012–2013. The SDHS was designedto examine the associations of food consumption, energy and nutrient intake, and behavioralfactors with nutrition-related health outcomes among local residents. The investigation enrolled4504 community-dwelling men and women aged at least 18 years from 54 randomly stratified-sampledcommunities. The participants were initially selected to constitute a random representative sampleof the local adult population (n = 1725), and their family members aged at least 18 years were thenrecruited (approximately 2.6 persons per family). Those who had lived in the area for less than6 months in total during the last year of the survey were excluded. The Shanghai Municipal Center forDisease Control and Prevention was responsible for the implementation of the SDHS.
Participants with missing anthropometric measurements (n = 251) or lack of blood pressureassessed (n = 54) or whose blood samples were not collected or tested (n = 817) for indicators ofMetS diagnosis, as well as those who reported an energy intake less than 300 kcal/d or greater than3500 kcal/d for the average energy intake (mean ± SD) was 1766 ± 880 kcal in the study populationand the mean ± 2SD interval was finally used for the acceptable range (n = 51), were excluded.Participants with missing dietary survey information (n = 38) or other pertinent covariates (n = 194)were also excluded. The data from 3099 participants were ultimately included in the present analysis.
The SDHS was approved by the Shanghai Municipal Center for Disease Control and Prevention’sInstitutional Review Board on 31 January 2012. Informed consent was obtained from each participantbefore the survey. The study complied with the code of ethics of the World Medical Association(Declaration of Helsinki).

Nutrients 2018, 10, 1663 3 of 20
2.2. Dietary Assessment
The dietary survey included a 24-h dietary record for 3 consecutive days (including 2 weekdaysand 1 weekend day) in the consideration of different dietary behavior between working days and rest,as well as the feasibility of investigation. Household condiments mainly containing fat or sodium,including cooking oil, salt, soy sauce, chili sauce, etc., were weighed before and after the 3 survey days.The interviewers were public health doctors from 54 local community health centers who received astandard training course on the recording of dietary information. Each participant was orally instructedto record their daily food intake both at home and out of home on draft paper at the beginning andinterviewed face-to-face by interviewers in the consecutive survey days at home. At each survey day,the interviewers collected and checked though the draft paper, and afterward, revised the food weightand transcribed the draft dietary information into a structured form. Furthermore, the participantswere instructed not to change their typical diet or physical activity during the survey period. The dietrecords in the structured form were reviewed by nutrition specialists from local centers of diseasecontrol and prevention. No disastrous events such as rain or snow disasters that would have affectedthe normal food supply occurred during the survey period.
Daily food consumption was calculated from the 3-day, 24-h diet record. The 3-day consumptionof condiments based on the calculated weight difference was divided into individual intake accordingto the eating times in the home and the individuals’ energy intake (only from food) proportion amongfamily members. That consumption of condiments from meals out of home was simulated accordingto the previously calculated condiments’ densities in food consumed at home. The intake of dietaryenergy, macronutrients and iron was estimated according to daily food and condiment consumptionusing the Chinese food composition database [15,16]. Dietary supplements and medications wereexcluded from nutrient intake. Heme iron was estimated as 40% of the total iron from animal foods,including red meat, poultry, fish, and animal organs, and nonheme iron was calculated as the remainingportion of the total iron from all foods [14,17].
2.3. Potential Confounders
Information on each participant’s age, sex, education, income, smoking status, alcohol use,physical activity level, and intentional physical exercise was recorded using an interviewer-administeredquestionnaire at each participant’s home. The educational level of the participants was reported asyears of education. The yearly income was calculated by dividing the total family yearly incomeby the number of family members. The physical activity level was recorded as sedentary, moderate,or vigorous according to professional and nonprofessional activities. Intentional physical exercise wasdefined as physical exercise performed for the purpose of health maintenance or fitness. The smokingstatus was categorized as never smoked, former smoker, or current smoker. With respect to alcohol use,the respondents were classified as follows according to their alcohol consumption during the sevendays prior to the interview: lifetime abstainers, the respondent did not consume an alcoholic beverage;nonheavy drinkers (social drinkers), the respondent consumed 5+ standard drinks once (1 day) inthe 1-week period; infrequent heavy drinkers (binge drinkers), the respondent consumed 5+ standarddrinks on 2–3 days in the 1-week period; or frequent heavy drinkers, the respondent consumed 5+standard drinks on at least 4 days in the 1-week period.
2.4. Anthropometric and Laboratory Measurements
All anthropometric measurements were conducted in the community health centers locatedin each participant’s community. The waist circumference was measured using a Graham-Field1340-2 tape measure. The blood pressure was measured three times after a quiet rest for 5 min usingan Omron HEM-7071 electronic sphygmomanometer (Omron Healthcare, Kyoto, Japan).
Each participant was asked to fast for more than 10 h, and their blood was then collected andanalyzed at the laboratory of the Shanghai Municipal Centers for Disease Control and Prevention.

Nutrients 2018, 10, 1663 4 of 20
The serum concentrations of glucose, triglycerides, and high-density lipoprotein-cholesterol (HDL-C)were measured using a HITACHI 7080 Automatic Biochemical Analyzer with reagents from WakoPure Chemical Industries, Ltd. (Tokyo, Japan).
2.5. Definition of Metabolic Syndrome
MetS was identified based on the criteria in the US National Cholesterol Education Program AdultTreatment Panel III (NCEP-ATP III) for Asian populations [2], which states that at least three of thefollowing metabolic abnormalities should be present: (1) elevated waist circumference (WC ≥ 90 cm formen and WC ≥ 80 cm for women); (2) elevated triglycerides (triglycerides ≥ 150 mg/dL) or on drugtreatment for elevated triglycerides; (3) reduced HDL-C (HDL-C < 40 mg/dL for men and < 50 mg/dLfor women) or on drug treatment for reduced HDL-C; (4) elevated blood pressure (systolic bloodpressure ≥ 130 mmHg and/or diastolic blood pressure ≥ 85 mmHg) or on antihypertensive drugtreatment with a history of hypertension; and (5) elevated fasting glucose (100 mg/dL) or on drugtreatment for elevated glucose.
2.6. Statistical Analyses
Statistical analyses were conducted using SAS statistical software (v. 9.2; SAS Institute, Cary,NC, USA). Given that the occurrence of MetS might aggregate in families due to a similar geneticbackground, which would potentially cause aggregation bias, multilevel models were introduced inthe analysis. Multivariate generalized linear mixed models for binary data with a logit link functionwere applied to determine the odds ratios (ORs) and 95% confidence intervals (CIs) of the occurrenceof MetS and its five components as the dependent variables based on four tertiles of total, heme,and nonheme dietary iron intake as the independent fixed-effect variables and family aggregation asthe random-effect variable. No covariate was included in the crude model. Potential confounders,including age, sex, income, physical activity level, intentional physical exercise, dietary energy intake,smoking status, and alcohol use, were introduced as covariates in the adjusted models. To examinethe linear trend between dietary iron intake and the occurrence of MetS, the medians in each quartileof dietary iron intake were used as the independent fixed-effect variables, and the occurrences ofMetS and its five components were used as the dependent variables. A two-sided p value < 0.05 wasconsidered to indicate statistical significance.
3. Results
3.1. Characteristics of the Participants
The analysis sample included 3099 participants, consisting of 1430 male adults and 1669 femaleadults. Among the participants, the total, heme, and nonheme dietary iron intake was 19.7 mg/day,1.6 mg/day, and 18.1 mg/day, respectively, and the prevalence of MetS was 23.9%. The characteristicsof the participants are shown in Table 1.
3.2. Dietary Sources of Iron Intake
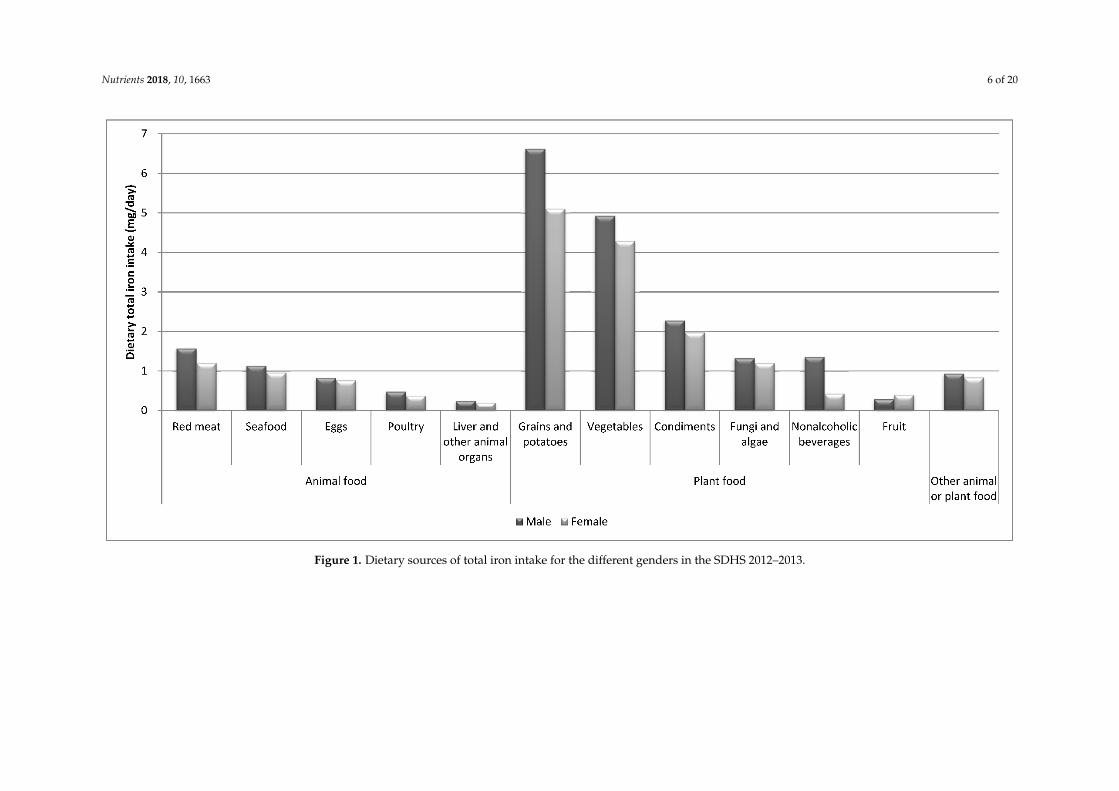
In present study population, the main dietary sources of total iron intake were plant-basedfoods. Specifically, the top three dietary sources of total iron intake were grains/potatoes, vegetables,and condiments, and this finding was obtained for both males (6.62 mg/day, 4.92 mg/day,and 2.28 mg/day, respectively) and females (5.10 mg/day, 4.29 mg/day, and 1.97 mg/day, respectively).Red meat was ranked first among the animal food sources of total dietary iron intake consumed byboth genders (Figure 1).
3.3. Quartiles of Dietary Iron Intake and MetS Risk
After adjusting for age, sex, income, physical activity level, intentional physical exercise,dietary energy intake, smoking status, and alcohol use, a significant positive trend was found across

Nutrients 2018, 10, 1663 5 of 20
quartiles of total dietary iron intake and risk of MetS (p for trend = 0.022). Compared with the lowestquartile of dietary total iron intake (<12.72 mg/day), the highest quartile (≥21.88 mg/day) had anodds ratio (95% confidence interval), OR (95% CI), of 1.59 (1.15,2.20). However, after adjusting for thesame confounders, there was no association between heme dietary iron intake and risk of MetS (p fortrend = 0.895), and compared with the lowest quartile of heme iron intake, the second to fourth tertiles didnot show significant differences in ORs. Although the quartiles of nonheme iron intake were not in linewith the risk of MetS (p for trend = 0.065), the highest quartile of nonheme iron intake (≥20.10 mg/day)had a 1.44-fold higher risk of MetS compared with the lowest quartile (<11.62 mg/day). After adjustment,higher risks for the five components of MetS were observed in the third and fourth quartiles of total andnonheme dietary iron intake. However, no differences in the risks for the MetS components were foundbetween the second to fourth quartiles of heme iron intake and the reference quartile (Tables 2–4).
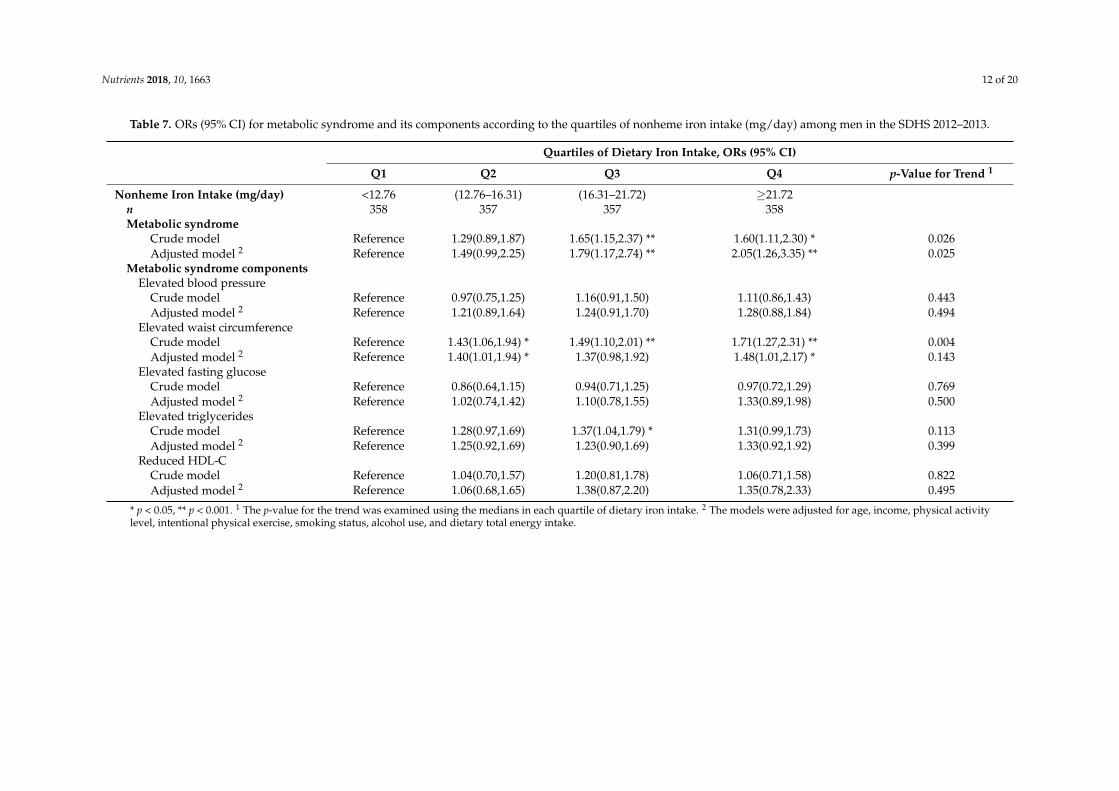
After stratifying by gender, the linear trend between the quartiles of total dietary iron intake andrisk of MetS was still significant in male participants (p for trend = 0.016) but not in female participants(p for trend = 0.322). In men, a higher risk (OR = 2.11, 95% CI: 1.29–3.45) of MetS was observedin the fourth quartile of total dietary iron intake (≥23.68 mg/day) compared with the first quartile(<14.12 mg/day), whereas in women, the risks of MetS were not significantly different between thelowest quartile of total iron intake and the other quartiles. A positive association was found betweennonheme iron intake and MetS risk in men (p for trend = 0.025) but not in women (p for trend = 0.150).Finally, heme iron intake was not associated with MetS in either men or women (Men, Tables 5–7;Women, Tables 8–10).
Table 1. Characteristics of the participants by gender in the SDHS 2012–2013.
All Male Female p-Value
n (%) 3099 (100.0) 1430 (46.1) 1669 (53.9)Age, % 0.513
18–44 years 30.8 30.1 31.445–59 years 36.2 36.3 36.160-years 33.0 33.6 32.6
Yearly Income, % 0.523Above average level (>60,000 RMB 1) 7.2 7.0 7.4Average level (30,000–59, RMB) 30.9 32.1 30.0Below average level (<30,000 RMB) 57.2 56.0 58.2No answer 4.7 4.9 4.5
Years of Education, years (SD 2) 9.5 (4.53) 10.2 (4.01) 8.9 (4.86) <0.001Physical Activity Level, % <0.001
Sedentary 84.2 78.7 89.0Moderate 13.8 18.1 10.2Vigorous 2.0 3.3 0.8
Intentional Physical Exercise, % 24.8 25.2 24.5 0.940Smoking Status, %
Never smoked 72.0 40.8 98.8Former smoker 5.0 10.5 0.3Current smoker 23.0 48.8 1.0
Alcohol Use, % <0.001Lifetime abstainers 80.7 64.0 94.9Nonheavy drinkers 15.1 27.3 4.6Infrequent heavy drinkers 1.3 2.6 0.3Frequent heavy drinkers 3.0 6.1 0.3
Dietary IntakeEnergy, kcal/day (SD) 1760.9 (842.5) 1938.5 (884.5) 1608.9(773.4) <0.001Carbohydrate, g/day (SD) 207.4(119.3) 226.8(131.5) 190.8(105.1) <0.001Protein, g/day (SD) 67.9(45.6) 75.0(53.1) 61.9(37.1) <0.001Total fat, g/day (SD) 74.6(41.8) 81.1(40.7) 69.0(41.9) <0.001Total iron, mg/day (SD) 19.7(16.3) 22.0(20.4) 17.7(11.3) <0.001Heme iron, mg/day (SD) 1.6(1.4) 1.7(1.4) 1.5(1.4) <0.001Nonheme iron, mg/day (SD) 18.1(15.8) 20.3(20.0) 16.2(10.6) <0.001
Metabolic Syndrome, % 23.9 21.8 25.7 0.011Metabolic Syndrome Components
Elevated blood pressure, % 52.4 56.8 48.7 <0.001Elevated waist circumference, % 33.6 25.5 40.5 <0.001Elevated fasting glucose, % 23.1 25.4 21.1 0.007Elevated triglycerides, % 27.2 30.3 24.4 <0.001Reduced HDL-C 3, % 21.0 14.8 26.2 <0.001
1 RMB, renminbi, China’s currency; 2 SD, standard deviation; 3 HDL-C, high-density lipoprotein-cholesterol.
Nutrients 2018, 10, 1663 6 of 20Nutrients 2018, 10, x FOR PEER REVIEW 7 of 21
Figure 1. Dietary sources of total iron intake for the different genders in the SDHS 2012–2013.
Figure 1. Dietary sources of total iron intake for the different genders in the SDHS 2012–2013.

Nutrients 2018, 10, 1663 7 of 20
Table 2. Odds ratios (ORs) (95% CI) for metabolic syndrome and its components according to the quartiles of total iron intake (mg/day) among all participants in theSDHS 2012–2013.
Quartiles of Dietary Iron Intake, ORs (95% CI)
Q1 Q2 Q3 Q4 p-Value for Trend 1
Total Iron Intake (mg/day) <12.72 (12.72–16.50) (16.50–21.88) ≥21.88n 776 773 776 774Metabolic syndrome
Crude model Reference 1.12(0.88,1.42) 1.24(0.98,1.57) 1.17(0.92,1.48) 0.335Adjusted model 2 Reference 1.37(1.06,1.78) * 1.47(1.11,1.94) ** 1.59(1.15,2.20) ** 0.022
p-Value for interaction 3 = 0.060Metabolic syndrome components
Elevated blood pressureCrude model Reference 0.95(0.79,1.13) 1.19(1.00,1.42) * 1.07(0.89,1.27) 0.063Adjusted model 2 Reference 1.14(0.92,1.41) 1.33(1.06,1.66) * 1.21(0.93,1.57) 0.100
Elevated waist circumferenceCrude model Reference 1.07(0.89,1.29) 1.09(0.91,1.32) 1.00(0.83,1.21) 0.691Adjusted model 2 Reference 1.25(1.01,1.53) * 1.29(1.04,1.60) * 1.25(0.96,1.61) 0.096
Elevated fasting glucoseCrude model Reference 1.03(0.83,1.27) 1.16(0.94,1.42) 1.12(0.91,1.38) 0.458Adjusted model 2 Reference 1.18(0.94,1.49) 1.25(0.98,1.60) 1.33(1.00,1.77) 0.221
Elevated triglyceridesCrude model Reference 1.17(0.95,1.43) 1.46(1.20,1.77) ** 1.34(1.10,1.64) ** 0.001Adjusted model 2 Reference 1.14(0.92,1.42) 1.37(1.09,1.72) ** 1.31(1.00,1.71) * 0.047
Reduced HDL-C 4
Crude model Reference 1.09(0.86,1.38) 1.11(0.87,1.41) 0.91(0.71,1.16) 0.348Adjusted model 2 Reference 1.27(0.98,1.65) 1.42(1.08,1.87) * 1.31(0.94,1.83) 0.088
* p < 0.05, ** p < 0.001. 1 The p-value for the trend was examined using the medians in each quartile of dietary iron intake. 2 The models were adjusted for age, sex, income, physical activitylevel, intentional physical exercise, smoking status, alcohol use and dietary total energy intake. 3 The p-value for the interaction was tested for the quartiles of dietary iron intake by gender.4 HDL-C: high-density lipoprotein-cholesterol.

Nutrients 2018, 10, 1663 8 of 20
Table 3. ORs (95% CI) for metabolic syndrome and its components according to the quartiles of heme iron intake (mg/day) among all participants in theSDHS 2012–2013.
Quartiles of Dietary Iron Intake, ORs (95% CI)
Q1 Q2 Q3 Q4 p-Value for Trend 1
Heme Iron Intake (mg/day) <0.83 (0.83–1.28) (1.28–1.94) ≥1.94n 776 774 773 776Metabolic syndrome
Crude model Reference 0.91(0.72,1.15) 0.92(0.73,1.16) 0.85(0.67,1.07) 0.593Adjusted model 2 Reference 1.06(0.82,1.36) 1.11(0.86,1.44) 1.06(0.80,1.39) 0.895
p-Value for interaction 3 = 0.096Metabolic syndrome components
Elevated blood pressureCrude model Reference 0.76(0.64,0.91) ** 0.73(0.61,0.87) ** 0.73(0.61,0.87) ** 0.001Adjusted model 2 Reference 0.91(0.74,1.13) 0.98(0.79,1.22) 1.05(0.83,1.32) 0.620
Elevated waist circumferenceCrude model Reference 0.89(0.74,1.08) 0.95(0.79,1.14) 0.93(0.77,1.12) 0.681Adjusted model 2 Reference 1.07(0.87,1.31) 1.20(0.98,1.48) 1.24(0.99,1.55) 0.189
Elevated fasting glucoseCrude model Reference 0.90(0.73,1.11) 0.82(0.67,1.01) 0.89(0.73,1.10) 0.330Adjusted model 2 Reference 1.02(0.82,1.28) 0.96(0.76,1.21) 1.11(0.87,1.41) 0.661
Elevated triglyceridesCrude model Reference 1.05(0.86,1.29) 1.12(0.92,1.36) 1.08(0.89,1.32) 0.723Adjusted model 2 Reference 1.03(0.83,1.28) 1.10(0.88,1.36) 1.00(0.79,1.26) 0.784
Reduced HDL-C 4
Crude model Reference 1.05(0.83,1.35) 1.16(0.91,1.47) 0.99(0.78,1.27) 0.547Adjusted model 2 Reference 1.17(0.91,1.52) 1.29(0.99,1.68) 1.15(0.87,1.53) 0.291
* p < 0.05, ** p < 0.001. 1 The p-value for the trend was examined using the medians in each quartile of dietary iron intake. 2 The models were adjusted for age, sex, income, physical activitylevel, intentional physical exercise, smoking status, alcohol use and dietary total energy intake. 3 The p-value for the interaction was tested for the quartiles of dietary iron intake by gender.4 HDL-C: high-density lipoprotein-cholesterol.

Nutrients 2018, 10, 1663 9 of 20
Table 4. ORs (95% CI) for metabolic syndrome and its components according to the quartiles of nonheme iron intake (mg/day) among all participants in theSDHS 2012–2013.
Quartiles of Dietary Iron Intake, ORs (95% CI)
Q1 Q2 Q3 Q4 p-Value for Trend 1
Nonheme Iron Intake (mg/day) <11.62 (11.62–15.10) (15.10–20.10) ≥20.10n 774 774 775 776Metabolic syndrome
Crude model Reference 1.07(0.84,1.36) 1.23(0.97,1.55) 1.12(0.89,1.42) 0.364Adjusted model 2 Reference 1.28(0.98,1.66) 1.43(1.09,1.87) * 1.44(1.04,1.99) * 0.065
p-Value for interaction 3 = 0.086Metabolic syndrome components
Elevated blood pressureCrude model Reference 0.91(0.77,1.09) 1.26(1.06,1.50) ** 1.08(0.91,1.29) 0.003Adjusted model 2 Reference 1.07(0.86,1.32) 1.34(1.07,1.67) * 1.18(0.91,1.53) 0.058
Elevated waist circumferenceCrude model Reference 1.07(0.89,1.29) 1.10(0.91,1.32) 1.00(0.83,1.20) 0.662Adjusted model 2 Reference 1.22(0.99,1.50) 1.26(1.02,1.57) * 1.19(0.92,1.53) 0.149
Elevated fasting glucoseCrude model Reference 0.92(0.74,1.14) 1.19(0.97,1.46) 1.08(0.88,1.33) 0.088Adjusted model 2 Reference 1.01(0.80,1.28) 1.28(1.01,1.63) * 1.25(0.94,1.66) 0.107
Elevated triglyceridesCrude model Reference 1.21(0.99,1.48) 1.42(1.17,1.73) ** 1.34(1.10,1.64) ** 0.003Adjusted model 2 Reference 1.15(0.93,1.44) 1.33(1.06,1.66) * 1.26(0.96,1.64) 0.100
Reduced HDL-C 4
Crude model Reference 1.11(0.87,1.40) 1.06(0.83,1.35) 0.91(0.71,1.16) 0.425Adjusted model 2 Reference 1.29(0.99,1.67) 1.34(1.02,1.76) * 1.30(0.93,1.81) 0.157
* p < 0.05, ** p < 0.001. 1 The p-value for the trend was examined using the medians in each quartile of dietary iron intake. 2 The models were adjusted for age, sex, income, physical activitylevel, intentional physical exercise, smoking status, alcohol use, and dietary total energy intake. 3 The p-value for the interaction was tested for the quartiles of dietary iron intake bygender. 4 HDL-C: high-density lipoprotein-cholesterol.

Nutrients 2018, 10, 1663 10 of 20
Table 5. ORs (95% CI) for metabolic syndrome and its components according to the quartiles of total iron intake (mg/day) among men in the SDHS 2012–2013.
Quartiles of Dietary Iron Intake, ORs (95% CI)
Q1 Q2 Q3 Q4 p-Value for Trend 1
Total Iron Intake (mg/day) <14.12 (14.12–17.87) (17.87–23.68) ≥23.68n 357 358 358 357Metabolic syndrome
Crude model Reference 1.22(0.84,1.77) 1.66(1.16,2.39) ** 1.65(1.15,2.36) ** 0.013Adjusted model 2 Reference 1.36(0.90,2.07) 1.83(1.19,2.81) ** 2.11(1.29,3.45) ** 0.016
Metabolic syndrome componentsElevated blood pressure
Crude model Reference 1.07(0.83,1.38) 1.15(0.90,1.48) 1.16(0.90,1.49) 0.619Adjusted model 2 Reference 1.35(1.00,1.84) 1.33(0.97,1.82) 1.43(0.99,2.06) 0.164
Elevated waist circumferenceCrude model Reference 1.65(1.21,2.24) ** 1.74(1.29,2.36) ** 1.84(1.36,2.49) ** 0.000Adjusted model 2 Reference 1.59(1.14,2.21) ** 1.61(1.15,2.27) ** 1.65(1.12,2.43) * 0.019
Elevated fasting glucoseCrude model Reference 0.94(0.70,1.26) 1.00(0.75,1.33) 0.98(0.74,1.31) 0.973Adjusted model 2 Reference 1.14(0.82,1.58) 1.17(0.83,1.66) 1.40(0.94,2.10) 0.431
Elevated triglyceridesCrude model Reference 1.24(0.94,1.64) 1.38(1.05,1.82) * 1.32(1.01,1.74) * 0.096Adjusted model 2 Reference 1.21(0.89,1.65) 1.30(0.95,1.78) 1.34(0.93,1.94) 0.361
Reduced HDL-CCrude model Reference 0.98(0.65,1.48) 1.23(0.83,1.83) 1.08(0.72,1.62) 0.658Adjusted model 2 Reference 0.92(0.59,1.45) 1.38(0.87,2.19) 1.34(0.77,2.32) 0.287
* p < 0.05, ** p < 0.001. 1 The p-value for the trend was examined using the medians in each quartile of dietary iron intake. 2 The models were adjusted for age, income, physical activitylevel, intentional physical exercise, smoking status, alcohol use, and dietary total energy intake.

Nutrients 2018, 10, 1663 11 of 20
Table 6. ORs (95% CI) for metabolic syndrome and its components according to the quartiles of heme iron intake (mg/day) among men in the SDHS 2012–2013.
Quartiles of Dietary Iron Intake, ORs (95% CI)
Q1 Q2 Q3 Q4 p-Value for Trend 1
Heme Iron Intake (mg/day) <0.93 (0.93–1.40) (1.40–2.02) ≥2.02n 357 358 357 358Metabolic syndrome
Crude model Reference 1.27(0.89,1.81) 1.09(0.76,1.56) 1.21(0.85,1.73) 0.547Adjusted model 2 Reference 1.38(0.94,2.02) 1.12(0.75,1.68) 1.21(0.80,1.82) 0.415
Metabolic syndrome componentsElevated blood pressure
Crude model Reference 0.99(0.76,1.28) 0.73(0.57,0.95) * 0.85(0.66,1.09) 0.059Adjusted model 2 Reference 1.29(0.95,1.75) 1.05(0.77,1.43) 1.23(0.89,1.69) 0.308
Elevated waist circumferenceCrude model Reference 1.25(0.91,1.69) 1.37(1.01,1.86) * 1.82(1.36,2.45) ** 0.001Adjusted model 2 Reference 1.26(0.91,1.76) 1.33(0.95,1.86) 1.89(1.35,2.65) ** 0.003
Elevated fasting glucoseCrude model Reference 1.02(0.76,1.36) 0.85(0.63,1.14) 0.92(0.69,1.23) 0.597Adjusted model 2 Reference 1.12(0.82,1.54) 1.02(0.73,1.42) 1.18(0.84,1.65) 0.729
Elevated triglyceridesCrude model Reference 1.02(0.78,1.35) 1.06(0.81,1.39) 1.01(0.77,1.33) 0.978Adjusted model 2 Reference 0.90(0.67,1.22) 0.96(0.71,1.30) 0.82(0.59,1.12) 0.607
Reduced HDL-CCrude model Reference 1.06(0.71,1.59) 1.03(0.69,1.54) 1.06(0.71,1.58) 0.991Adjusted model 2 Reference 1.05(0.68,1.61) 0.96(0.62,1.49) 0.98(0.62,1.55) 0.982
* p < 0.05, ** p < 0.001. 1 The p-value for the trend was examined using the medians in each quartile of dietary iron intake. 2 The models were adjusted for age, income, physical activitylevel, intentional physical exercise, smoking status, alcohol use, and dietary total energy intake.
Nutrients 2018, 10, 1663 12 of 20
Table 7. ORs (95% CI) for metabolic syndrome and its components according to the quartiles of nonheme iron intake (mg/day) among men in the SDHS 2012–2013.
Quartiles of Dietary Iron Intake, ORs (95% CI)
Q1 Q2 Q3 Q4 p-Value for Trend 1
Nonheme Iron Intake (mg/day) <12.76 (12.76–16.31) (16.31–21.72) ≥21.72n 358 357 357 358Metabolic syndrome
Crude model Reference 1.29(0.89,1.87) 1.65(1.15,2.37) ** 1.60(1.11,2.30) * 0.026Adjusted model 2 Reference 1.49(0.99,2.25) 1.79(1.17,2.74) ** 2.05(1.26,3.35) ** 0.025
Metabolic syndrome componentsElevated blood pressure
Crude model Reference 0.97(0.75,1.25) 1.16(0.91,1.50) 1.11(0.86,1.43) 0.443Adjusted model 2 Reference 1.21(0.89,1.64) 1.24(0.91,1.70) 1.28(0.88,1.84) 0.494
Elevated waist circumferenceCrude model Reference 1.43(1.06,1.94) * 1.49(1.10,2.01) ** 1.71(1.27,2.31) ** 0.004Adjusted model 2 Reference 1.40(1.01,1.94) * 1.37(0.98,1.92) 1.48(1.01,2.17) * 0.143
Elevated fasting glucoseCrude model Reference 0.86(0.64,1.15) 0.94(0.71,1.25) 0.97(0.72,1.29) 0.769Adjusted model 2 Reference 1.02(0.74,1.42) 1.10(0.78,1.55) 1.33(0.89,1.98) 0.500
Elevated triglyceridesCrude model Reference 1.28(0.97,1.69) 1.37(1.04,1.79) * 1.31(0.99,1.73) 0.113Adjusted model 2 Reference 1.25(0.92,1.69) 1.23(0.90,1.69) 1.33(0.92,1.92) 0.399
Reduced HDL-CCrude model Reference 1.04(0.70,1.57) 1.20(0.81,1.78) 1.06(0.71,1.58) 0.822Adjusted model 2 Reference 1.06(0.68,1.65) 1.38(0.87,2.20) 1.35(0.78,2.33) 0.495
* p < 0.05, ** p < 0.001. 1 The p-value for the trend was examined using the medians in each quartile of dietary iron intake. 2 The models were adjusted for age, income, physical activitylevel, intentional physical exercise, smoking status, alcohol use, and dietary total energy intake.

Nutrients 2018, 10, 1663 13 of 20
Table 8. ORs (95% CI) for metabolic syndrome and its components according to the quartiles of total iron intake (mg/day) among women in the SDHS 2012–2013.
Quartiles of Dietary Iron Intake, ORs (95% CI)
Q1 Q2 Q3 Q4 p-Value for Trend 1
Total Iron Intake (mg/day) <11.67 (11.67–15.10) (15.10–20.00) ≥20.00n 416 419 416 418Metabolic syndrome
Crude model Reference 1.02(0.74,1.40) 1.21(0.88,1.65) 0.96(0.70,1.32) 0.476Adjusted model 2 Reference 1.25(0.88,1.78) 1.41(0.98,2.02) 1.27(0.82,1.96) 0.322
Metabolic syndrome componentsElevated blood pressure
Crude model Reference 0.86(0.68,1.10) 1.08(0.85,1.37) 0.85(0.67,1.09) 0.163Adjusted model 2 Reference 1.01(0.75,1.37) 1.29(0.94,1.76) 1.05(0.73,1.52) 0.306
Elevated waist circumferenceCrude model Reference 0.97(0.76,1.24) 1.01(0.79,1.29) 0.93(0.72,1.19) 0.914Adjusted model 2 Reference 1.09(0.83,1.44) 1.13(0.85,1.50) 1.15(0.82,1.62) 0.839
Elevated fasting glucoseCrude model Reference 0.90(0.67,1.22) 1.23(0.92,1.64) 1.09(0.81,1.47) 0.216Adjusted model 2 Reference 1.01(0.73,1.41) 1.33(0.95,1.85) 1.23(0.83,1.83) 0.274
Elevated triglyceridesCrude model Reference 1.01(0.75,1.34) 1.13(0.85,1.50) 1.08(0.81,1.44) 0.814Adjusted model 2 Reference 1.06(0.77,1.44) 1.16(0.85,1.60) 1.18(0.81,1.72) 0.773
Reduced HDL-CCrude model Reference 1.19(0.88,1.62) 1.14(0.84,1.56) 1.14(0.84,1.56) 0.710Adjusted model 2 Reference 1.37(0.98,1.91) 1.31(0.93,1.85) 1.40(0.93,2.10) 0.264
1 The p-value for the trend was examined using medians in each quartile of dietary iron intake. 2 The models were adjusted for age, income, physical activity level, intentional physicalexercise, smoking status, alcohol use, and dietary total energy intake.

Nutrients 2018, 10, 1663 14 of 20
Table 9. ORs (95% CI) for metabolic syndrome and its components according to the quartiles of heme iron intake (mg/day) among women in the SDHS 2012–2013.
Quartiles of Dietary Iron Intake, ORs (95% CI)
Q1 Q2 Q3 Q4 p-Value for Trend 1
Heme Iron Intake (mg/day) <0.76 (0.76–1.19) (1.19–1.81) ≥1.81n 416 419 419 415Metabolic syndrome
Crude model Reference 0.88(0.65,1.19) 0.81(0.60,1.11) 0.74(0.54,1.01) 0.273Adjusted model 2 Reference 1.08(0.78,1.52) 1.06(0.75,1.51) 1.08(0.74,1.57) 0.967
Metabolic syndrome componentsElevated blood pressure
Crude model Reference 0.71(0.55,0.90) ** 0.63(0.49,0.80) ** 0.58(0.45,0.74) ** 0.000Adjusted model 2 Reference 0.93(0.69,1.26) 0.90(0.67,1.23) 0.91(0.66,1.26) 0.924
Elevated waist circumferenceCrude model Reference 0.94(0.74,1.21) 0.91(0.71,1.16) 0.77(0.59,0.99) * 0.193Adjusted model 2 Reference 1.18(0.90,1.54) 1.22(0.92,1.61) 1.05(0.78,1.42) 0.439
Elevated fasting glucoseCrude model Reference 0.85(0.63,1.13) 0.75(0.55,1.00) 0.87(0.65,1.17) 0.285Adjusted model 2 Reference 0.98(0.72,1.35) 0.94(0.67,1.30) 1.12(0.79,1.58) 0.755
Elevated triglyceridesCrude model Reference 1.06(0.79,1.41) 1.01(0.76,1.35) 1.00(0.75,1.34) 0.979Adjusted model 2 Reference 1.17(0.87,1.59) 1.14(0.83,1.57) 1.20(0.86,1.67) 0.700
Reduced HDL-CCrude model Reference 1.13(0.83,1.55) 1.54(1.13,2.09) ** 1.11(0.81,1.53) 0.033Adjusted model 2 Reference 1.24(0.89,1.73) 1.65(1.18,2.31) ** 1.25(0.87,1.79) 0.027
* p < 0.05, ** p < 0.001. 1 The p-value for the trend was examined using medians in each quartile of dietary iron intake. 2 The models were adjusted for age, income, physical activity level,intentional physical exercise, smoking status, alcohol use, and dietary total energy intake.

Nutrients 2018, 10, 1663 15 of 20
Table 10. ORs (95% CI) for metabolic syndrome and its components according to the quartiles of nonheme iron intake (mg/day) among women in the SDHS 2012–2013.
Quartiles of Dietary Iron Intake, ORs (95% CI)
Q1 Q2 Q3 Q4 p-Value for Trend 1
Nonheme Iron Intake (mg/day) <10.69 (10.69–13.76) (13.76–18.24) ≥18.24n 418 418 416 417Metabolic syndrome
Crude model Reference 0.87(0.64,1.21) 1.25(0.92,1.70) 0.92(0.67,1.27) 0.111Adjusted model 2 Reference 1.01(0.71,1.44) 1.42(0.99,2.03) 1.14(0.74,1.75) 0.150
Metabolic syndrome componentsElevated blood pressure
Crude model Reference 0.93(0.73,1.18) 1.17(0.92,1.49) 0.93(0.73,1.19) 0.214Adjusted model 2 Reference 1.10(0.81,1.49) 1.42(1.03,1.94) * 1.15(0.80,1.66) 0.140
Elevated waist circumferenceCrude model Reference 0.90(0.70,1.15) 1.00(0.78,1.28) ** 0.90(0.70,1.15) 0.689Adjusted model 2 Reference 0.99(0.75,1.30) 1.08(0.81,1.44) 1.05(0.74,1.47) 0.918
Elevated fasting glucoseCrude model Reference 0.96(0.71,1.31) 1.29(0.97,1.73) 1.16(0.86,1.56) 0.181Adjusted model 2 Reference 1.09(0.78,1.51) 1.40(1.00,1.95) * 1.29(0.87,1.91) 0.215
Elevated triglyceridesCrude model Reference 0.92(0.68,1.23) 1.24(0.94,1.64) 1.02(0.76,1.35) 0.194Adjusted model 2 Reference 0.94(0.68,1.28) 1.26(0.92,1.72) 1.06(0.73,1.54) 0.243
Reduced HDL-CCrude model Reference 1.19(0.87,1.62) 1.16(0.85,1.58) 1.07(0.78,1.47) 0.685Adjusted model 2 Reference 1.30(0.93,1.81) 1.28(0.91,1.80) 1.23(0.82,1.85) 0.421
* p < 0.05, ** p < 0.001. 1 The p-value for the trend was examined using medians in each quartile of dietary iron intake. 2 The models were adjusted for age, income, physical activity level,intentional physical exercise, smoking status, alcohol use, and dietary total energy intake.

Nutrients 2018, 10, 1663 16 of 20
After stratifying by age group, a higher risk of MetS was observed in the third and fourth quartileof total dietary iron intake among the age group of above 60 (Table A1).
4. Discussion
The current findings were consistent with two previous studies indicating that the consumptionof a certain type of dietary iron is related to the risk of developing MetS or its components [18,19].Compared with the total dietary iron intake of the Western population, the average intake ofChinese adults is reportedly much higher, which is consistent with the iron intake determined inthis study [18,20–22]. Free iron has strong pro-oxidant properties and generates reactive oxygenspecies by participating in Fenton chemistry, which results in the induction of oxidative damage andapoptosis [23]. Although iron plays an indispensable role in some physiological processes, excess ironcan cause tissue damage or subclinical inflammation [24]. These side effects of iron are balanced outthrough binding to ferritin, an iron storage protein [13]. Given that several population-based humanobservational studies have reported a positive association between dietary iron intake and serumferritin [10,11,21,25,26], the elevated concentration of serum ferritin is regarded as an indicator of ironoverload. This research potentially supported the hypothesis that excessive iron in the body mightplay a causal role in the development of MetS. Nevertheless, MetS has been found to increase theinflammatory status and thereby induces changes in iron homeostasis; thus, the influence of MetS oniron metabolism cannot be ruled out [27,28]. These two mechanisms might mutually correspond to acontinuous circle between iron metabolism and MetS.
In present study population, we observed that nonheme iron intake but not heme iron intakewas associated with MetS. This finding was inconsistent with studies on Western populations,which concluded that heme iron intake is correlated with MetS [18,20,29]. Dietary iron is present intwo forms: heme iron (animal food) and nonheme iron (plant and animal food) [13]. The Chinese dietis well known to be a predominantly plant-based diet. The major food sources of dietary iron in thecurrent analysis were grains/potatoes, vegetables, and condiments. These foods are quite differentfrom those in the typical diet of the Western population, in which a greater proportion of dietaryiron is obtained from animal food [22], which indicated more heme iron intake. The dominance ofplant-based food sources of dietary iron in the Chinese diet indicates a larger proportion of nonhemeiron. In a Chinese study, no definite association was found for heme iron intake with iron status [25].Another study on a Japanese population also found that heme iron intake is not correlated with ironstatus [30]. The difference between Western and Chinese dietary patterns could partially explain thedifference in the associations of heme iron with MetS between the present findings and results fromWestern populations. Heme iron has been widely acknowledged to have better bioavailability thannonheme iron [31]. However, the ascorbic acid found in fruits and vegetables can enhance nonhemeiron absorption [13]. In a study focusing on Chinese females, nonheme iron intake was found to beassociated with serum ferritin [25]. This finding could support the correlation between nonheme ironintake and MetS observed in the present study.
In this study, higher risks of the four components of MetS, including elevated waist circumference,elevated triglycerides, reduced HDL-C, and elevated blood pressure, were observed with moderatelyhigher total iron intake (the third quartile of total iron intake). Moderately higher nonheme ironintake (the third quartile of nonheme iron intake) was associated with higher risks of all fivecomponents of MetS. However, no associations were found between heme iron intake and the fivecomponents of MetS. Meanwhile, previous published studies indicated that iron overload in the bodyis correlated with all features of abnormal metabolism, such as obesity, hypertension, hyperlipidemia,and hyperglycemia [5,9,19,32,33].
We found that total iron and nonheme iron intake was associated with risk of MetS in maleparticipants, but an association between iron intake and MetS was not observed in female participantsin the current study. In the male population, the highest quartile of total iron intake was associatedwith a 2.1-fold higher risk of MetS compared with the lowest quartile. The Chinese recommended daily

Nutrients 2018, 10, 1663 17 of 20
iron intakes for male and female adults are 12 mg and 20 mg, respectively, and the tolerable upper ironintake is 42 mg [34]. In this study, although the average dietary iron intake of both genders was farfrom the tolerable upper limit, the average total dietary iron intake of the male participants was almostdouble the recommended level, whereas that of the females was slightly under the recommendedlevel. In addition, women experience greater iron loss than men due to menses. Increased iron storesare correlated with markers of chronic inflammation and risk of MetS [35,36]. The relatively higheriron intake and lower iron loss in men might explain the gender difference in the association betweendietary iron intake and the occurrence of MetS observed in this study. Assessing the blood loss in thecase of women warrants further study.
A limitation of this study is the methodology used to assess dietary intake. We used 3-day,24-h dietary records to obtain food consumption information, and this information was then usedto calculate the total, heme, and nonheme iron intake based on Chinese food composition data.Thus, the estimates of dietary iron intake were limited by the accuracy of the participants’ recall andestimation. Furthermore, although we adjusted for several potential confounding factors, includingdietary energy intake, we did not treat other iron intake-related dietary components, such as saturatedfat or zinc, as covariates to avoid multicollinearity. Therefore, we cannot avoid the possibility thatrecall bias, nonresponse bias, and other unknown confounding factors might influence the resultof the risk factor analysis. Finally, it is logical to hypothesize that dietary iron intake influences thebody’s metabolism, but the cross-sectional nature of the current study did not allow us to draw causalassociations between total, heme, and nonheme dietary iron intake and MetS. Therefore, prospectiveobservational studies or random clinical trials are needed to clarify the causal relationship betweendietary iron and MetS.
5. Conclusions
Total and nonheme dietary iron intake was positively associated with MetS and its componentsin the adult population in metropolitan China, but an association between heme iron intake and MetSwas not observed in this population. Moreover, a gender difference in the association between dietaryiron intake and the occurrence of MetS was found: higher levels of total and nonheme iron intake wereassociated with greater risks of MetS in men but not in women.
Author Contributions: Conceptualization, G.D. and Z.Z.; Methodology, F.W. and Y.L.; Investigation, C.W.,Z.W., C.G., X.J., J.Y. and H.P.; Data Analysis, J.Z. and Z.Z.; Writing-Original Draft Preparation, Z.Z.;Writing-Review & Editing, Y.H., J.S. and J.H.; Supervision and manuscript review, G.D. and F.W.
Funding: This study was supported by the National Key Research and Development Program of China(2016YFD0400602), the Three-year Action Plan on Public Health (15GWZK0801), Foundation of ShanghaiMunicipal Commission of Health and Family Planning (201740073) and DANONE International Prize for Nutrition(DIC2015-01).
Acknowledgments: We are grateful to all the individuals who participated in the study. We also thank ourcolleagues at the local districts’ Centers for Disease Control and Prevention and local community health centersfor their assistance with data collection.
Conflicts of Interest: The authors declare no conflict of interest.

Nutrients 2018, 10, 1663 18 of 20
Appendix A
Table A1. ORs (95% CI) for metabolic syndrome according to the quartiles of total iron intake (mg/day) by age group in the SDHS 2012–2013.
Quartiles of Dietary Iron Intake, ORs (95% CI)
Q1 Q2 Q3 Q4 p-Value for Trend 1
18–44 years
Total Iron Intake (mg/day) <12.84 (12.84–16.02) (16.02–21.50) ≥21.50n 241 241 241 241Metabolic syndrome
Crude model Reference 1.55(0.81,2.94) 1.72(0.92,3.24) 1.88(1.00,3.51) * 0.237Adjusted model 2 Reference 1.53(0.77,3.03) 1.66(0.82,3.34) 1.96(0.86,4.46) 0.430
45–59 years
Total Iron Intake (mg/day) <13.03 (13.03–17.04) (17.04–20.00) ≥22.31n 280 279 279 279Metabolic syndrome
Crude model Reference 1.10(0.74,1.65) 1.35(0.91,2.00) 1.05(0.70,1.58) 0.448Adjusted model 2 Reference 1.16(0.77,1.76) 1.41(0.92,2.16) 1.18(0.71,1.96) 0.458
60-years
Total Iron Intake (mg/day) <12.31 (12.31–16.28) (16.28–20.00) ≥21.86n 255 254 255 254Metabolic syndrome
Crude model Reference 1.03(0.70,1.50) 1.11(0.77,1.62) 1.03(0.70,1.51) 0.949Adjusted model 2 Reference 1.24(0.83,1.86) 1.54(1.00,2.37) * 1.77(1.06,2.96) * 0.135
* p < 0.05. 1 The p-value for the trend was examined using the medians in each quartile of dietary iron intake. 2 The models were adjusted for sex, income, physical activity level,intentional physical exercise, smoking status, alcohol use, and dietary total energy intake.

Nutrients 2018, 10, 1663 19 of 20
References
1. Zhou, M.; Wang, H.; Zhu, J.; Chen, W.; Wang, L.; Liu, S.; Li, Y.; Wang, L.; Liu, Y.; Yin, P.; et al. Cause-specificmortality for 240 causes in China during 1990–2013: A systematic subnational analysis for the Global Burdenof Disease Study 2013. Lancet 2016, 387, 251–272. [CrossRef]
2. Grundy, S.M.; Cleeman, J.I.; Daniels, S.R.; Donato, K.A.; Eckel, R.H.; Franklin, B.A.; Gordon, D.J.;Krauss, R.M.; Savage, P.J.; Smith, S.J.; et al. Diagnosis and management of the metabolic syndrome:An American Heart Association/National Heart, Lung, and Blood Institute Scientific Statement. Circulation2005, 112, 2735–2752. [CrossRef] [PubMed]
3. Gu, D.; Reynolds, K.; Wu, X.; Chen, J.; Duan, X.; Reynolds, R.F.; Whelton, P.K.; He, J. Prevalence of themetabolic syndrome and overweight among adults in China. Lancet 2005, 365, 1398–1405. [CrossRef]
4. Li, Y.; Zhao, L.; Yu, D.; Wang, Z.; Ding, G. Metabolic syndrome prevalence and its risk factors among adults inChina: A nationally representative cross-sectional study. PLoS ONE 2018, 13, e199293. [CrossRef] [PubMed]
5. Felipe, A.; Guadalupe, E.; Druso, P.; Carlos, M.; Pablo, S.; Oscar, C.; Luis, V.; Diego, M.; Jaime, R.; Inés, U.;Federico, L. Serum Ferritin Is Associated with Metabolic Syndrome and Red Meat Consumption. Oxid. Med.Cell. Longev. 2015, 2015, 1–8. [CrossRef] [PubMed]
6. Cho, M.; Park, J.; Choi, W.; Cho, A.; Lee, Y. Serum ferritin level is positively associated with insulin resistanceand metabolic syndrome in postmenopausal women: A nationwide population-based study. Maturitas 2017,103, 3–7. [CrossRef] [PubMed]
7. Kilani, N.; Vollenweider, P.; Waeber, G.; Marques-Vidal, P. Iron metabolism and incidence of metabolicsyndrome. Nutr. Metab. Cardiovasc. Dis. 2015, 25, 1025–1032. [CrossRef] [PubMed]
8. Jehn, M.; Clark, J.M.; Guallar, E. Serum ferritin and risk of the metabolic syndrome in U.S. adults. Diabetes Care2004, 27, 2422–2428. [CrossRef] [PubMed]
9. Fleming, R.E.; Ponka, P. Iron overload in human disease. N. Engl. J. Med. 2012, 366, 348–359. [CrossRef][PubMed]
10. Cade, J.E.; Moreton, J.A.; O’Hara, B.; Greenwood, D.C.; Moor, J.; Burley, V.J.; Kukalizch, K.; Bishop, D.T.;Worwood, M. Diet and genetic factors associated with iron status in middle-aged women. Am. J. Clin. Nutr.2005, 82, 813–820. [CrossRef] [PubMed]
11. Fleming, D.J.; Jacques, P.F.; Dallal, G.E.; Tucker, K.L.; Wilson, P.W.; Wood, R.J. Dietary determinants of ironstores in a free-living elderly population: The Framingham Heart Study. Am. J. Clin. Nutr. 1998, 67, 722–733.[CrossRef] [PubMed]
12. Ferreira, C.; Santambrogio, P.; Martin, M.E.; Andrieu, V.; Feldmann, G.; Henin, D.; Beaumont, C. H ferritinknockout mice: A model of hyperferritinemia in the absence of iron overload. Blood 2001, 98, 525–532.[CrossRef] [PubMed]
13. Geissler, C.; Singh, M. Iron, Meat and Health. Nutrients 2011, 3, 283–316. [CrossRef] [PubMed]14. Monsen, E.R.; Hallberg, L.; Layrisse, M.; Hegsted, D.M.; Cook, J.D.; Mertz, W.; Finch, C.A. Estimation of
available dietary iron. Am. J. Clin. Nutr. 1978, 31, 134. [CrossRef] [PubMed]15. Yang, Y.; Wang, G.; Pan, X. Chinese Food Composition Book 2; Peking University Medical Press: Beijing, China,
2005; pp. 75–216, ISBN 9787810716789.16. Yang, Y.; Wang, G.; Pan, X. Chinese Food Composition Book 1; Peking University Medical Press: Beijing, China,
2009; pp. 45–192, ISBN 9787811167276.17. Pretorius, B.; Schonfeldt, H.C.; Hall, N. Total and haem iron content lean meat cuts and the contribution to
the diet. Food Chem. 2016, 193, 97–101. [CrossRef] [PubMed]18. De Oliveira Otto, M.C.; Alonso, A.; Lee, D.; Delclos, G.L.; Bertoni, A.G.; Jiang, R.; Lima, J.A.; Symanski, E.;
Jacobs, D.R.; Nettleton, J.A. Dietary Intakes of Zinc and Heme Iron from Red Meat, but Not from OtherSources, Are Associated with Greater Risk of Metabolic Syndrome and Cardiovascular Disease. J. Nutr. 2012,142, 526–533. [CrossRef] [PubMed]
19. Choi, J.S.; Koh, I.; Lee, H.J.; Kim, W.H.; Song, J. Effects of excess dietary iron and fat on glucose and lipidmetabolism. J. Nutr. Biochem. 2013, 24, 1634–1644. [CrossRef] [PubMed]
20. Dos Santos Vieira, D.; Hermes Sales, C.; Galvão Cesar, C.; Marchioni, D.; Fisberg, R. Influence of Haem,Non-Haem, and Total Iron Intake on Metabolic Syndrome and Its Components: A Population-Based Study.Nutrients 2018, 10, 314. [CrossRef] [PubMed]

Nutrients 2018, 10, 1663 20 of 20
21. Young, I.; Parker, H.; Rangan, A.; Prvan, T.; Cook, R.; Donges, C.; Steinbeck, K.; O’Dwyer, N.; Cheng, H.;Franklin, J.; et al. Association between Haem and Non-Haem Iron Intake and Serum Ferritin in HealthyYoung Women. Nutrients 2018, 10, 81. [CrossRef] [PubMed]
22. Samaniego-Vaesken, M.; Partearroyo, T.; Olza, J.; Aranceta-Bartrina, J.; Gil, Á.; González-Gross, M.; Ortega, R.;Serra-Majem, L.; Varela-Moreiras, G. Iron Intake and Dietary Sources in the Spanish Population: Findingsfrom the ANIBES Study. Nutrients 2017, 9, 203. [CrossRef] [PubMed]
23. Hansen, J.B.; Moen, I.W.; Mandrup-Poulsen, T. Iron: The hard player in diabetes pathophysiology.Acta Physiol. 2014, 210, 717–732. [CrossRef] [PubMed]
24. Day, S.M.; Duquaine, D.; Mundada, L.V.; Menon, R.G.; Khan, B.V.; Rajagopalan, S.; Fay, W.P. Chronic ironadministration increases vascular oxidative stress and accelerates arterial thrombosis. Circulation 2003, 107,2601–2606. [CrossRef] [PubMed]
25. He, J.; Shen, X.; Fang, A.; Song, J.; Li, H.; Guo, M.; Li, K. Association between predominantly plant-baseddiets and iron status in Chinese adults: A cross-sectional analysis. Br. J. Nutr. 2016, 116, 1621–1632. [CrossRef][PubMed]
26. Davis, C.D.; Malecki, E.A.; Greger, J.L. Interactions among dietary manganese, heme iron, and nonheme ironin women. Am. J. Clin. Nutr. 1992, 56, 926–932. [CrossRef] [PubMed]
27. MacDonald, M.J.; Cook, J.D.; Epstein, M.L.; Flowers, C.H. Large amount of (apo)ferritin in the pancreaticinsulin cell and its stimulation by glucose. FASEB J. 1994, 8, 777–781. [CrossRef] [PubMed]
28. Deugnier, Y.; Bardou-Jacquet, E.; Le Lan, C.; Brissot, P. Hyperferritinemia not related to hemochromatosis.Gastroenterol. Clin. Biol. 2009, 33, 323. [CrossRef] [PubMed]
29. Azadbakht, L.; Esmaillzadeh, A. Red meat intake is associated with metabolic syndrome and the plasmaC-reactive protein concentration in women. J. Nutr. 2009, 139, 335–339. [CrossRef] [PubMed]
30. Asakura, K.; Sasaki, S.; Murakami, K.; Takahashi, Y.; Uenishi, K.; Yamakawa, M.; Nishiwaki, Y.; Kikuchi, Y.;Takebayashi, T.; Group, J.D.S.S.; et al. Iron intake does not significantly correlate with iron deficiencyamong young Japanese women: A cross-sectional study. Public Health Nutr. 2009, 12, 1373–1383. [CrossRef][PubMed]
31. Hallberg, L. Bioavailability of dietary iron in man. Annu. Rev. Nutr. 1981, 1, 123–147. [CrossRef] [PubMed]32. Piperno, A.; Trombini, P.; Gelosa, M.; Mauri, V.; Pecci, V.; Vergani, A.; Salvioni, A.; Mariani, R.; Mancia, G.
Increased serum ferritin is common in men with essential hypertension. J. Hypertens. 2002, 20, 1513–1518.[CrossRef] [PubMed]
33. Bozzini, C.; Girelli, D.; Olivieri, O.; Martinelli, N.; Bassi, A.; De Matteis, G.; Tenuti, I.; Lotto, V.; Friso, S.;Pizzolo, F.; et al. Prevalence of body iron excess in the metabolic syndrome. Diabetes Care 2005, 28, 2061–2063.[CrossRef] [PubMed]
34. Chinese Nutrition Society. Chinese Dietary Reference Intakes; Science Press: Beijing, China, 2013.35. Vari, I.S.; Balkau, B.; Kettaneh, A.; André, P.; Tichet, J.; Fumeron, F.; Caces, E.; Marre, M.; Grandchamp, B.;
Ducimetière, P. Ferritin and Transferrin Are Associated with Metabolic Syndrome Abnormalities and TheirChange Over Time in a General Population. Diabetes Care 2007, 30, 1795. [CrossRef] [PubMed]
36. Fumeron, F.; Pean, F.; Driss, F.; Balkau, B.; Tichet, J.; Marre, M.; Grandchamp, B. Ferritin and transferrinare both predictive of the onset of hyperglycemia in men and women over 3 years: The data from anepidemiological study on the Insulin Resistance Syndrome (DESIR) study. Diabetes Care 2006, 29, 2090–2094.[CrossRef] [PubMed]
© 2018 by the authors. Licensee MDPI, Basel, Switzerland. This article is an open accessarticle distributed under the terms and conditions of the Creative Commons Attribution(CC BY) license (http://creativecommons.org/licenses/by/4.0/).