total energy expenditure and energy requirements in healthy
TRANSCRIPT
Total Energy Expenditure and Energy Requirements in Healthy Elderly Persons
Michael I. Goran and Eric T. Poehlman
To investigate energy requirements in healthy elderly subjects, we assessed the association of total energy expenditure (TEE)
with resting metabolic rate (RMR), physical activity, body composition, and energy intake in 13 individuals (aged 56 to 76 years,
six women and seven men). Free-living TEE was measured using doubly labeled water, RMR was measured by respiratory gas
analysis, and energy expenditure of physical activity (EEPA) was derived from the difference between TEE and RMR, assuming
the thermic response to feeding contributes 10% of TEE. Fat mass (FM) and fat-free mass (FFM) were obtained from underwater
weighing, Volmax was determined from a bicycle test to exhaustion, energy intake was obtained from a 3-day food diary, and
leisure time activity (LTA) was determined by structured interview. TEE was 2,406 f 436 kcal/d (range, 1,656 to 3,200 kcal/d, or
1.25 to 2.11 times RMR) and was related to Vormax (I = ,.79, P = .OOl), LTA (r = .74. P = .004), FFM (r = .69. P = .OOS), and FM (r = -.64, P = .016). The association between TEE and Vo,max persisted after adjustment for FFM (partial r = .56, P = .036).
EEPA was related to LTA (r = .63, P c .OOOl) and FM (r = -.56, P = ,039). Energy intake underestimated TEE by 31% + 16% in
women and by 12% rt 11% in men. Using stepwise regression, TEE was best predicted by Vo,max and LTA (total adjusted
rz = .66). We conclude the following: (1) TEE varies greatly within healthy elderly subjects due to variations in physical activity;
(2) Vo,max has an important role in predicting energy requirements in older individuals; and (3) healthy older individuals
underreport energy intake.
Copyright 0 1992 by W.B. Saunders Company
T HE AGE-RELATED decline in energy intake and resting metabolic rate (RMR) has been well docu-
mented in both cross-sectional and longitudinal studies.1-7 In addition, physical activity generally declines with age, although this observation is limited to measurements ob- tained from self-recorded physical activity diaries or motion sensors.slg However, a recent study did not detect age- related differences in spontaneous physical activity, as measured in a room calorimeter.4 The age-related reduc- tion in energy flux is associated with a concomitant increase in adiposity,1° which is a risk factor for cardiovascular disease,” and loss of muscle tissue,10,12 which may contrib- ute to the age-related decline in functional independence. Taken together, these observations imply that aging is associated with a breakdown in the balance between energy intake and energy expenditure. A growing focus of our laboratory is therefore to identify environmental factors that can maintain and/or reestablish the homeostatic regu- lation of energy balance in older persons to promote healthy aging.
The aforementioned studies provide useful data on the age-related changes in RMR and body composition. How- ever, the more valuable information resides in knowledge of total energy expenditure (TEE) in elderly persons, mea- sured under free-living conditions with ample opportunity for socially desirable levels of energy intake and expendi-
From the Division of Endocrinology, Metabolism and Nutrition, Department of Medicine, College of Medicine, and the Depatiment of Nutritional Sciences, University of Vermont, Burlington, VT.
Supported by National Institute on Aging Grant No. AG-07857 (E. T P.), Andrus Foundation for the American Association of Retired Persons (E.T.P.), a Biomedical Research Support Grant from the University of Vermont, College of Medicine (M. I. G.), The American Diabetes Association (M.I.G.), and in part by the General Clinical Research Center (National Institutes of Health Grant No. RR-109).
Address reprint requests to Michael I. Goran, PhD, Division of Endocrinology, Metabolism and Nutrition, Department of Medicine, College of Medicine, University of Vermont, Burlington, VT 05405.
Copyright 0 I992 by W B. Saunders Cornpam 0026-0495192/4107-0013$03.OOlO
744
ture. Information on TEE under these conditions is essen- tial for a precise characterization of daily energy expendi- ture, in particular, that associated with the energy expenditure of physical activity (EEPA). Furthermore, information on TEE is required because it is generally accepted that recommendations for energy intake should be based on direct measurements of TEE performed under free-living conditions, in favor of using less reliable mea- sures of energy intake.13
James et al have defined the energy requirements of the elderly as being approximately 1.51 times basal metabolic rate.13 The approach of James et al is to compute daily energy needs based on subjective assessment of the activity pattern of an individual and a factorial-type calculation based on the energy costs of the various activities per- formed.‘3 However, this approach is still not based on measurements of TEE under free-living conditions, and clearly does not take into account the potential for individ- ual variation. Thus, in the absence of data on TEE in elderly persons, the aims of the present study were to characterize TEE in free-living healthy elderly individuals using doubly labeled water. In addition, the contributions of RMR, body composition, reported energy intake, cardio- vascular fitness, and reported physical activity to the individ- ual variation in TEE were examined to identify effective markers for individual variation in TEE.
SUBJECTS AND METHODS
Subjects
Data from 13 older individuals (aged 56 to 78 years, six women
and seven men) arc presented. Subjects were recruited from
newspaper advertisements and radio announcements, and were all
retired individuals living in the rural areas surrounding Burlington,
VT. All participants were in excellent general health, as defined by
(1) no clinical symptoms or signs of heart disease, as assessed by
normal resting and exercise stress test electrocardiograms (ECGs); (2) a resting blood pressure less than 140/90; (3) absence of any
prescription or over-the-counter medication that could affect
cardiovascular function; (4) no family history of diabetes or obesity;
(5) weight stability (?2 kg) by medical history within the past year;
Metabolism, Vol41, No 7 (July), 1992: pp 744-753
TOTAL ENERGY EXPENDITURE IN ELDERLY SUBJECTS 745
and (6) absence of any abnormal liver enzyme or lipid values from a routine blood chemistry screening.
The nature, purpose, and possible risks of the study were carefully explained to each subject before obtaining consent to participate. The experimental protocol was approved by the Committee on Human Research for the Medical Sciences of the University of Vermont.
Ourline of Protocol
After an overnight fast, the subjects reported to the Clinical Research Center at 7:00 AM to provide baseline urine and blood samples, after which an oral dose of doubly labeled water was administered. Additional samples were collected as described below. Subjects were free to leave the Clinical Research Center and to continue with their usual daily living patterns, and were unaware that TEE was being measured, as they were informed that the oral dose of doubly labeled water and urine collections were for measurement of body composition. During 3 subsequent days, they were asked to keep a diary of food intake. Ten days after the initial oral dose, subjects returned to the Clinical Research Center in the early evening. RMR was measured the following morning after an overnight fast. The second urine void of the morning was collected to mark the end of the doubly labeled water study period. The subjects underwent further testing to obtain measurements of maximal aerobic capacity (Qo,max) and body composition.
Measurement of TEE
TEE was measured over a IO-day period using the doubly labeled water technique. The protocol was designed in accordance with the technical recommendations for use of the doubly labeled water method in humans.14 In designing the protocol, a 2-point method was chosen to maximize the noninvasive, free-living nature of the technique. With this approach, subjects were unaware that energy expenditure and physical activity were being measured, thus reducing the possibility of behavioral modification. The validity of this approach is based on the following: (1) the 2-point and multiple-point methods have been shown to compare well in a group of free-living obese subjects,15 and (2) the 2-point method is theoretically more accurate under conditions where temporal variation in either energy expenditure or water flux is anticipated.lh
After an overnight fast and collection of a single baseline urine and plasma sample (10 mL), a mixed dose of doubly labeled water was orally administered at 0.15 g H$sO and 0.075 g 2H20 per kg body mass. The weight of isotope administered was weighed to the nearest mg, and in practice the subjects received approximately 80 to 120 g of doubly labeled water mixed from 10% (atom percent excess) H21X0 (Cambridge Isotope Laboratories, Cambridge, MA) and 99.8% (atom percent excess) 2H20 (Icon Services, Summit, NJ) in a ratio of 2O:l. After oral administration of the isotopes, the vial was rinsed with 50 to 100 mL tap water, which was then also consumed by the subject. A weighed 1:400 dilution of the dose was prepared for each subject at the time of dosing, and samples of the water used for the dilution and the diluted dose were saved and anaiyzed with each sample set.
An additional plasma sample was obtained 4 hours after isotope administration. The subjects were then instructed to collect and freeze the second-void urine sample the following morning. A final urine sample was collected from the second void during the morning of inpatient status. All samples were stored in sealed vacutainers at -70°C until analysis by isotope ratio mass spectrom- etry at the Biomedical Mass Spectrometry Facility of the Clinical Research Center at the University of Vermont. Samples were analyzed in triplicate for H21s0 and *Hz0 using the CO* equilibra- tion technique.17 and the off-line zinc reduction method,‘* respec-
tively. All isotope enrichments are expressed using the relative de1 per mil (%0) scale.
The CO2 equilibration technique involved dispensing 1.5 mL of sample into a lo-mLvacutainer and filling it with 99.9% pure COz. Equilibration of 180 between water and CO2 was achieved by overnight shaking at room temperature. The CO? was introduced into a VG Sira II isotope ratio mass spectrometer via an automated carousel sample system (VG, Middlewhich. Cheshire. UK) and analyzed for the ratio of mass 46:44. Using this method. the average SD for 91 sets of triplicate samples analyzed for H?‘sO enrichment (average enrichment, 93.8%0) ) was +0.4%~, . and the SD was independent of the enrichment of the sample analyzed (r = .33, P > .05). Samples of the water used for dilution and the diluted dose were analyzed as standards concurrently with each sample set.
The zinc reduction method was similar to that previously described.” and used the quartz reduction vessels described by Wong and Klein’” and a ratio of 3 PL sample (undistilled) with 100 mg zinc (Biogeochemical Laboratories, Bloomington, IN). Reduc- tion was achieved by heating at 500°C for 30 minutes in an aluminum block (Biogeochemical Laboratories). The ratio of mass/charge 3 to mass/charge 2 in the hydrogen gas produced was analyzed using a VG Sira II isotope ratio mass spectrometer equipped with a 20-port automated inlet system (VG). Using this method, the average SD for 65 sets of triplicate lH:O sample analysis was -+2.8%0 at a mean sample enrichment of 334.0%0, and the SD was independent of the enrichment of the sample (r = .24, P > .05). Samples of the water used for dilution and the diluted dose were analyzed as standards, concurrently with each sample set.
Turnover rates and zero-time enrichments of H:lXO and ?HZO were calculated from the slope and intercept of the semilogarith- mic plot of isotope enrichment in urine versus time after dosing. CO2 production rates were calculated using the following equation:
rC02(mol/d) = 0.4554(D,K, - DhKh), (Eq 1)
where D, and Dh are the individual, zero-time extrapolated dilution spaces of H2180 and 2H20 in moles, and K) and Kh are the turnover rates of Hz’s0 and ‘Hz0 in days-‘.
Isotope dilution spaces were calculated using the following equation14:
D(mol)= & x (EDOSE - EWATER
(EPOST - EPR~) ’ (Eq 2)
where D is the isotope dilution space in moles: W is the weight of water used to make the dilution of the dose; A is the weight of dose administered: a is the weight of dose diluted; Eoos~. EWA~R, Epos~, and E~RE are enrichments in %O of the diluted dose. the water used for the dilution, urine at time zero from back- extrapolation, and in urine prior to dose administration, respec- tively.
Oxygen consumption was derived by dividing the CO2 produc- tion rate by the food quotient, derived on an individual basis from the composition of the diet, using the equations of Black et al.” TEE was calculated using equation no. 12 of Weir.2’
In calculating CO2 production rates, isotope dilution spaces were obtained from enrichments at time zero. in favor of using the enrichments in plasma 4 hours after dosing. The advantage of using the intercepts is that the same data is essentially used to calculate turnover rates (slope) and dilution space (intercept), and random analytical errors cancel’” when turnover rate is divided by dilution space in the calculation of CO? production rates. In this study, the dilution space of H21X0, calculated from the 4-hour plasma enrichment, was only 2.0% above the zero-time dilution space

746 GORAN AND POEHLMAN
(2,041.l mol Y 2JIOO.2 mol), and use of the former value would have increased TEE by a similar magnitude.
The equation described for calculating CO* production is a combination of the multiple-point methodU and the 2-point method,24 and uses the individual dilution spaces and turnover rates for both isotopes derived from 2 points. The importance of using the individual dilution spaces is highlighted in the present data because the 2Hr0:H21s0 dilution space ratio was variable (1.0297 to 1.0793; mean, 1.0503 f 0.0133) and significantly higher than the traditionally assumed value of 1.029 in younger subjects. If a fixed ratio of 1.04:1.01 for the dilution space of 2Hr0:H2180 is assumed, the calculated CO* production rates and energy expendi- ture would have increased by 10.5%. There is no current evidence to explain whether the observed variability in the dilution space ratio has any physiological basis or is simply explained by random analytical error. In this data set, the dilution space ratio of 2Hr0:H2180 was not significantly related to sex, age, body mass, fat-free mass (FFM), fat mass (FM), or relative body fatness. Similarly, in analyzing doubly labeled water data from studies in obese subjects, Ravussin et al found no association between body fatness and the dilution space ratio of 2Hz0:H2180.X
To convert CO* production to energy expenditure, the individual food quotient values obtained from the 3-day intake diary were used, rather than assuming a constant value of 0.85. The food quotient value averaged 0.88, but varied from 0.83 to 0.93 and was not significantly different between men (0.87 2 0.03) and women (0.89 ? 0.02). Use of the mean food quotient value rather than the individual value would not have changed the calculated daily energy expenditure by more than 25%.
Measurement of RMR
RMR was measured for 45 minutes in the early morning after an overnight fast by respiratory gas analysis using a ventilated hood system for breath collections, as previously described.2 Flow rate was measured by a pneumotachograph (Vertek, Burlington, VT), and oxygen and CO2 content of expired air were analyzed using a zirconium cell oxygen analyzer (Ametek, Pittsburgh, PA) and an infrared CO2 analyzer (Ametek), respectively. Energy expenditure was calculated using the Weir equation.22 Duplicate measures of RMR in nine older volunteers (five men, four women; 65.6 f 4.0 years) in our laboratory showed a coefficient of variation of 4.3% and an intraclass correlation of 0.96.
Derivation of EEPA
EEPA was derived from measurements of TEE and RMR and an estimation of the thermic response to feeding based on previous results from our laboratory.s The equation is based on the following three-compartment model of TEE:
TEE = RMR + TEM + EEPA, (Eq 3)
where TEE is measured with doubly labeled water; RMR is the daily energy cost of the resting metabolic rate; TEM is the thermic response to meals; and EEPA is the energy cost of daily physical activity.
Energy and macronutrient content of the diet intake were estimated from a 3-day, self-administered food diary, which in- cluded 2 week days and 1 weekend day, as previously described.* The purpose of administering the 3-day food diary was to compare this method with measurement of TEE using doubly labeled water, and to obtain individual estimates of the dietary food quotient. We have shown that self-recording of energy intake approximates spontaneous energy intake covertly measured in a clinical research environment in compliant volunteers.29
Assessment of Leisure Time Activity
The contribution of RMR to TEE was assumed to be equivalent The energy cost of leisure time activities (LTA) during the to that measured upon awakening. Although we have recently previous 12-month period was estimated using The Minnesota shown that RMR at rest during the day is 6% higher compared with Leisure Time Physical Activity Questionnaire,3o,31 as previously measurements performed in the early morning after an overnight described.* This evaluation is a structured interview that assesses stay in the Clinical Research Center,*6 this is partially offset by a the frequency and duration of participation in recreational activi- reduction in metabolic rate during sleep. ties over the previous 12-month period. Each activity is assigned an
The contribution from the thermic response to feeding was intensity code (eg, walking for pleasure, 3.5; cross-country skiing, estimated at 10% of TEE, (ie, TEM = 0.1 x TEE) based on 8.0) that is multiplied by the total estimated minutes in the year
previous studies? Thus, by substitution,
TEE = RMR + (0.1 x TEE) + EEPA (Eq 4)
and by solving for EEPA,
EEPA = (0.9 x TEE) - RMR (Eq 5)
Measurement of Body Composition
Body fat was estimated from body density as measured by underwater weighing, with simultaneous measurement of residual lung volume by helium dilution, using the Siri equation2’ FFM was estimated as body mass minus FM. Duplicate measures of body composition by underwater weight in nine older volunteers (five men; four women; 65.6 ? 4.0 years) in our laboratory showed a coefficient of variation of 4.1% and an intraclass correlation of 0.91.
Although body composition data was also available from total body water analysis (by assuming that lean body mass is 73% hydrated), the data from densitometry was used for the correlation analysis between energy expenditure, Vozmax, and body composi- tion values. We chose to use the densitometry data because TEE and body composition derived from total body water analysis are not strictly independent of one another, as both numbers are derived from the isotope dilution spaces of *H20 and H2r80. Values for FFM derived by both methods were highly correlated with one another (r = .99, P < .OOl), although FFM derived by underwater weight was systematically higher by 2.4% (50.00 ? 9.50 kg by underwater weight, 49.36 f 9.41 kg by total body water).
Measurement of p~~ax
Vozmax was measured in all subjects as previously described.= Briefly, this test consisted of cycling at 50 rpm at an initial workload of 25 W (women) and 50 W (men) for 3 minutes, followed by a 25-W increase every 2 minutes until exhaustion, or until subjects were unable to maintain 50 rpm. The attainment of Vozmax requires meeting at least two of the following criteria: (1) attain- ment of age-predicted maximal heart rate, (2) a maximal respira- tory exchange ratio greater than 1.0, or (3) no further increase in oxygen consumption, despite an increase in workload. Duplicate measures of Volmax in nine older volunteers (five men, four women; 65.6 * 4.0 years) in our laboratory showed a coefficient of variation of 4.3% and an intraclass correlation of 0.90.
Assessment of Dietary Intake

TOTAL ENERGY EXPENDITURE IN ELDERLY SUBJECTS 747
Table 1. Physical Characteristics of 13 Elderly Subjects
Subject Age (years) Height (cm) EM Ikg) FFM IW FM (kg1 Vozmax (Liminl
Females
No. 1
No. 2
No. 3
No. 4
No. 5
No. 6
Males
No. 1
No. 2
No. 3
No. 4
No. 5
No. 6
No. 7
Mean f; SD (group) 67 ? 6 170 + 8 71.62 + 9.52 50.6 2 9.5 21.1 + 6.7 1.95 + 0.64
Mean ? SD (females) 64 2 5 165 2 3 65.24 + 7.80 41.5 t 2.9 23.8 f 5.6 1.53 ir 0.18
Mean rt SD (males) 68 -t 6 175 2 9* 77.08 + 7.42* 58.3 -t 4.6’ 18.8 t 7.1 2.31 2 0.67*
65 169 69.06 44.6 24.5 1.71
60 161 61.90 39.0 22.9 1.74
66 168 60.78 38.1 22.7 1.31
69 165 79.50 45.3 34.3 1.51
56 166 58.93 40.6 18.4 1.56
70 165 61.24 41.5 19.8 1.33
59 185 80.29 64.4 15.9 2.94
65 167 64.16 56.8 7.4 2.94
78 171 79.76 55.7 24.1 1.25
69 175 73.16 61.3 11.9 3.00
65 162 74.15 51.3 22.9 1.86
73 187 80.48 56.4 24.1 2.13
70 176 87.58 62.5 25.1 2.07
NOTE. FM and FFM are derived from underwater weighing.
Abbreviation: BM, body mass.
*Significant (P < .05) difference between males and females.
spent performing this activity. The cumulative energy cost for LTA over the previous year was averaged and expressed as kcal/d.
hlean values, SD, and ranges are presented for all measures and parameters. Differences between men and women were assessed by an independent t test. The Pearson product moment correlation was used to derive the level of association between pairs of variables. Stepwise regression analysis was used to determine the relative contribution of selected independent variables to the variation in dependent variables under examination. All statistical and data manipulations were performed on a personal microcom- puter using either Lotus l-2-3 (Lotus Corp, Cambridge, MA) or Starplan (The Futures Group, Washington, DC) software pack- ages.
RESULTS
Description of Subjects
Table 1 presents a summary of some of the physical characteristics of the elderly subjects, who ranged in age from 56 to 78 years. Men and women were similar with respect to age and FM, although, as shown in Table 1, men were significantly heavier than women, due to a significantly greater FFM. Percent body fat (not shown in table form) averaged 29.5% 4 8.9% in the group and was significantly higher (P < .Ol) in women (36.1% + 4.2%) than in men (28.9% * 7.9%). ?o,max ranged from 1.25 to 3.00 L/min and was significantly greater in men, although this differ- ence was not apparent when Qo,max was expressed per kg FFM (38.05 2 10.4 L/min/kg FFM in men, 34.32 r 4.37 L/min/kg FFM in women; P > .05).
Doubly Labeled Water Data
The initial and final enrichments (above natural back- ground), turnover rates, and dilution spaces for both
isotopes are given in Table 2. On day 1, the enrichments of *HZ0 and HZlsO were 280 and 310 times the level of analytical error, respectively. The enrichments on day 1 were significantly higher in women for both *HZ0 (885.5%0 ? 71.1%0 v 697.5%0 ? 54.8%0; P < ,001) and H2180 (133.5%0 ? ll.O%o v 111.3%0 t 11.5%0; P < .OOl), but by day 10 the enrichments of both isotopes were similar in men and women. There was no significant difference in the turnover rates of either 2H20 or HZ180 between men and women. Not shown in table form is the fact that isotope dilution spaces at time zero for both 2Hz0 and H2180 were
Table 2. Group Data From the Doubly Labeled Water Experiment in
13 Healthy Elderly Subjects
Variable Meall SD Range
2H,O: Day 1 I%.) 784.2 114.5 618.7 to 963.6
ZH,O: Day 10 (%.) 353.4 60.2 214.9 to 400.2
H,‘eO: Day 1 (%0) 121.6 15.8 99.0 to 133.7
H*‘*O: Day 10 (%o) 43.2 7.1 30.4 to 57.6
Kh (days-” -0.0883 0.015 -0.0741 to -0.1179
K, (days-‘) -0.1144 0.018 -0.0988 to -0.1459
D,,, time zero (mol) 2.099.4 396.7 1.627.2 to 2.687.8
D,, time zero (mol) 2.000.2 385.2 1.572.9 to 2.570.0
Dh:D, 1.050 0.013 1.030 to 1.079
rC02 (molid) 19.4 3.3 15.3 to 24.7
FQ diet 0.88 0.027 0.83 to 0.93
TEE (kcal/d) 2,406 438 1,856 to 3,200
NOTE. Enrichments of 2H,O and H, ‘80 on day 1 and day IO after
dosing are on the relative del per mil (%o) scale above predosing
values. Kh and K, are the turnover rates of 2H,0 and H,l*O from a Z-point
method between day 1 and day 10. Dh and D, are the zero-time dilution
spaces of *Hz0 and H2180 in urine, obtained by back-extrapolation. rC0,
is carbon dioxide production corrected for fractionation. FQ is the food
quotient of the diet obtained from a 3-day diary, and TEE is averaged
over the lo-day study period. See Methods for further details.

748 GORAN AND POEHLMAN
significantly higher in men, although the Dh:D, ratio was similar in men (1.048 c 0.012) and women (1.054 2 0.015).
Components of TEE 2500
5
< 2000
i 0
Y V
w 1500 Qz
?
0 6 1000
A summary of the components of TEE is presented in Fig 1, and the individual raw data for TEE, RMR, EEPA, energy intake, and LTA (questionnaire) are presented in Table 3. TEE and RMR were both significantly higher in men. TEE was equivalent to 1.51 2 0.27 times RMR (range, 1.25 to 2.11). The RMR contributed 68% c 11% to TEE (range, 54% to 79%), and EEPA contributed 22% -c 11% to TEE (range, 10% to 43%).
Interaction Between the Components of TEE and Fitness and Body Composition
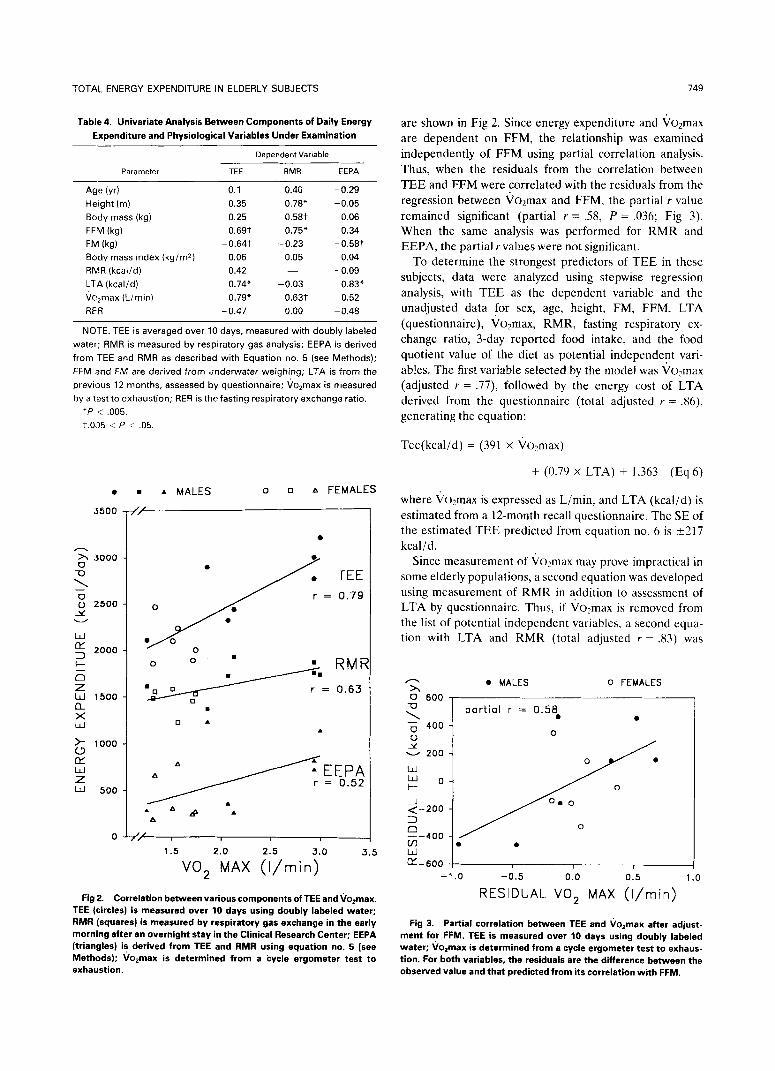
A summary of univariate analyses between the depen- dent variables, TEE, RMR, and EEPA, and the indepen- dent physiological parameters under investig+ion is shown in Table 4. TEE was significantly related to Vozmax, LTA from the questionnaire, and FFM, and was inversely related to FM. TEE was not significantly related to age, height, body mass, body mass index, RMR, respiratory exchange ratio, or the food quotient. RMR was strongly related to height, FFM, qo,max, and body mass.
TEE RMR EEPA TEM
Fig 1. Components of TEE in free-living elderly persons. TEE is
measured over 10 days using doubly labeled water; RMR is measured
by respiratory gas exchange in the early morning after an overnight
stay in the Clinical Research Center; EEPA is derived from TEE and
RMR using equation no. 5 (see Methods); TEM is the thermic response
to meals, estimated at 10% of TEE based on previous results from our
laboratory.&
EEPA was significantly related to LTA and inversely related to FM, and there was a trend toward a significant association with ?ozmax (r = .52, P = .069). EEPA was not significantly related to age, height, body mass, FFM, body mass index, RMR, respiratory exchange ratio, or the food quotient value of the diet.
The correlations between the three components pf daily energy expenditure (TEE, RMR, and EEPA) and Vo2max
Table 3. Components of Daily Energy Expenditure, Reported Energy Intake, and LTA in 13 Elderly Subjects
Subject
Females
No. 1
No. 2
No. 3
No. 4
No. 5
No. 6
Males
No. 1
No. 2
No. 3
No. 4
No. 5
No. 6
No. 7
TEE (kcalid) RMR (kcal/dl EEPA Ikcalld) Intake (kcalldl LTA (kcalid)
i ,889 1,454 246 927 154
2,001 1,529 272 1,000 191
I.856 1,493 187 1.785 224
2,101 1,584 307 1,300 61
2,238 1,227 787 1,807 470
2,467 1,555 665 1,774 126
2,994 1,869 a25 2,368 494
2.763 1,757 730 1,968 445
2,110 1,613 286 2,135 200
3,200 1.738 1,142 2,747 628
2,895 1,371 1,235 2,448 978
2,438 1,930 264 2,225 450
2,323 1,728 363 2.388 la2
Mean + SE (group) 2,406 2 436 1,603 f 199 562 2 356 1,913 ? 562 354 2 256
Mean 2 SD (females) 2,092 2 231 1,472 2 129 410 2 251 1,432 * 410 204 r 141
Mean 2 SD (males) 2,675 r 394* 1,715 2 183* 692 ? 402 2,326 + 249* 482 2 2JO*
NOTE. TEE is measured over IO days with doubly labeled water; RMR is measured by respiratory gas analysis; EEPA isderived fromTEE and RMR
as described with Equation no. 5 (see Methods); Intake is 3-day reported intake from a diary; LTA is determined over the previous 12 months as
estimated by questionnaire.
*A significant difference (P < .05) between males and females.
TOTAL ENERGY EXPENDITURE IN ELDERLY SUBJECTS 749
Table 4. Univariate Analysis Between Components of Daily Energy
Expenditure and Physiological Variables Under Examination
Dependent Variable
Parameter TEE RMR EEPA
Age (vr) 0.1 0.40 -0.29
Height(m) 0.35 0.78X -0.05
Body mass (kg) 0.25 0.58t -0.06
FF’VI (kg) 0.69t 0.75* 0.34
FM (kg) -0.64t -0.23 -0.58t
Body mass index (kg/m2) 0.06 0.05 0.04
RMR (kcalid) 0.42 -0.09
LTA (kcal/d) 0.74* -0.03 0.83*
\ic,max (L/min) 0.79* 0.63t 0.52
RER -0.47 0.00 -0.48
NOTE. TEE is averaged over 10 days, measured with doubly labeled
water; RMR is measured by respiratory gas analysis; EEPA is derived
from TEE and RMR as described with Equation no. 5 (see Methods):
FFM and FM are derived from underwater weighing; LTA is from the
previous 12 months, assessed by questionnaire: \io,max is measured
by a test to exhaustion; RER is the fasting respiratory exchange ratio.
‘P < ,005.
t.035 < P c .05.
l
3500
- $l 3000
<
E t_l 2500
Y -
W
!zj 2000
I--
0 z w 1500
g W
& 1000
rY
Y W 500
0
. . MALES 0 i7 A FEMALES
r = 0.63
TEE
= 0.79
, ,
1.5
“0, XAX i;irniny’
Fig 2. Correlation between various components of TEE and \io,max.
TEE (circles) is measured over 10 days using doubly labeled water;
RMR (squares) is measured by respiratory gas exchange in the early morning after an overnight stay in the Clinical Research Center; EEPA (triangles) is derived from TEE and RMR using equation no. 5 (see
Methods); Vo,max is determined from a cycle ergometer test to exhaustion.
are shown in Fig 2. Since energy expenditure and ?ozmax are dependent on FFM, the relationship was examined independently of FFM using partial correlation analysis. Thus, when the residuals from the correlation between TEE and FFM were correlated with the residuals from the regression between Qo,max and FFM, the partial r value remained significant (partial r = S8, P = ,036; Fig 3). When the same analysis was performed for RMR and EEPA, the partial r values were not significant.
To determine the strongest predictors of TEE in these subjects, data were analyzed using stepwise regression analysis, with TEE as the dependent variable and the unadjusted data for sex, age, height, FM, FFM, LTA (questionnaire), Vo?max, RMR, fasting respiratory ex- change ratio, 3-day reported food intake, and the food quotient value of the diet as potential independent vari- ables. The first variable selected by the model was Volmax (adjusted r = .77), followed by the energy cost of LTA derived from the questionnaire (total adjusted r = .86), generating the equation:
Tee(kcal/d) = (391 x Vozmax)
+ (0.79 x LTA) + 1.363 (Eq 6)
where i/o,max is expressed as Limin, and LTA (kcal/d) is estimated from a 12-month recall questionnaire. The SE of the estimated TEE predicted from equation no. 6 is +217 kcalid.
Since measurement of \jo,max may prove impractical in some elderly populations, a second equation was developed using measurement of RMR in addition to assessment of LTA by questionnaire. Thus, if G(>,max is removed from the list of potential independent variables, a second cqua- tion with LTA and RMR (total adjusted r = 33) was
A
>\
0 600
? u 400
y” - 200
S-200
2
K400 W E-600
. MALES 0 FEMALES
-1.0 -0.5 0.0 0.5 1.0
RESIDUAL VO, MAX (I/min)
portial r = 0.58 l .
I
Fig 3. Partial correlation between TEE and vo,max after adjust-
ment fo! FFM. TEE is measured over 10 days using doubly labeled
water; Vo,max is determined from a cycle ergometer test to exhaus- tion. For both variables, the residuals are the difference between the
observed value and that predicted from its correlation with FFM.

750 GORAN AND POEHLMAN
obtained:
TEE(kcal/d) = (1.29 x LTA)
+ (0.98 x RMR) + 387 (Eq 7)
The SE of the TEE estimated from equation no. 7 is 2242 kcalld.
Comparison of Reported Energy Intake With TEE
Figure 4 shows the relationship between self-reported energy intake and TEE measured over 10 days with doubly labeled water. There was a strong association between the two measures (I = .77, P = .002), although a consistent negative bias was observed, with the regression line lying below the line of identity (intake, kcalid = [TEE x 0.991 - 455), and the average 3-day reported energy intake was, on average, 21% 2 18% below the measured value of TEE for the total group. Moreover, as shown in Fig 4, the degree of underreporting was significantly greater in women (re- ported intake, 31% 2 18% below measured TEE) than in men (12% * 11% in men; P = .031).
The difference between intake and expenditure could not be explained by changes in energy balance, since there was no significant change in body mass over the lo-day study period (71.61 + 9.52 kg on day 1; 71.45 2 9.54 kg on day lo), and the mean individual body mass change was -0.17 * 0.49 kg (range, -1.03 to 0.52 kg). Furthermore, the individual weight change over the lo-day study period
1500 2000 2500 3000 3500
TEE (kcal/day) r\
g 3500
> 3000 malss/fsmoles male8 females
_ T
g 2500
; 2000
I- 1500
g 1000
ti 5co
5 0 TEE INTAKE
- TEE INTAKE TEE INTAKE
Fig 4. Association between reported energy intake and measured TEE. Intake is the setf-recorded energy intake by administration of a a-day food diary; TEE is measured over 10 days using doubly labeled water. (--) The line of identity for intake = TEE; (----I the observed regression line between the two variables. Lower figure compares TEE (H) with reported energy intake (0) in males and females combined (left), males only (center). and females only (right).
1400
2 1200
0 XJ > 1000
0 800
5 600
d 400
; 200
0
r = 0.83; p<0.0001
EEPA = l.lB*LTA +155 ’
0 4
200 400 800 000 1000
LTA (kcal/day)
Fig 5. Association between EEPA and LTA assessed from a ques-
tionnaire. EEPA is averaged over a lo-day period, derived from measurements of TEE and RMR using equation no. 5; LTA is from the
previous 12 months as assessed from the Minnesota Leisure Time
Physical Activity Questionnaire.3t
was not significantly related to the difference between measured TEE and reported energy intake.
Comparison of EEPA With LTA Derived From the Questionnaire
Figure 5 shows the association between EEPA derived from measurement of TEE and RMR and that derived from a 1Zmonth recall questionnaire. The strong associa- tion between these two parameters (EEPA = [1.16 x
LTA] + 155 kcal/d; r = .83, P < .OOOl; SE of estimate, ?208 kcal/d) provides new evidence regarding the validity of the leisure time questionnaire as a measure of daily LTA in this elderly population.
DISCUSSION
This study represents the first attempt to characterize TEE with doubly labeled water in free-living healthy elderly persons. The new findings are: (1) TEE is highly variable, due principally to high interindividual variation in daily physical activity; (2) Vo2max is a significant predictor of TEE for this population; and (3) healthy older individuals underreport habitual energy intake, with this effect being more pronounced in women.
TEE in Healthy Elderly Persons
A high degree of interindividual variation in TEE was observed (range, 1,856 to 3,200 kcal/d; coefficient of varia- tion, ? 18.2%) in these elderly subjects. As seen in Table 3, this was a reflection of interindividual variation both in RMR (range, 1,227 to 1,930 kcal/d; coefficient of variation, 212.4%) and EEPA (range, 187 to 1,235 kcal/d; coefficient of variation, &63.7%). This wide variation presents a potential problem for formulating effective guidelines for energy requirements. Since the doubly labeled water tech- nique does not lend itself to epidemiologic field use because of the cost and time involved, suitable physiological mark- ers for TEE must be identified if energy requirements are to be accurately predicted.

TOTAL ENERGY EXPENDITURE IN ELDERLY SUBJECTS
The data currently presented examine the relationships between TEE and body composition, RMR, LTA by questionnaire, reported energy intake, and Vo,max within a group of free-living older subjects, in an attempt to identify suitable physiological markers for FE. We found that TEE was most significantly related to VOzmax (Table 4. Fig 2), and this relationship. was independent of differ- ences in FFM (Fig 3). In fact, Vo;?max alone accounted for 79% of the variation in TEE in this group of healthy elderly subjects, This tinding can be interpreted in two ways: (1) the increased TEE, assocjated with a physically active life-style, leads to a higher Vo2ma.x or, alternatively, (2) those individuals with a higher Vozmax, as a result of genetic factors and/or regular participation in physical activity, engage in physical activities more frequently because of the higher work capacity.
Although we have previously reported a significant rela- tionship between RMR and Vozmax (independent of FFM) in older individuals,2 we were surprised to find that the correlation between TEE and Vozmax was stronger than that between TEE and FFM. Our results should not be interpreted as implying that FFM was not a significant predictor of TEE, because of the significant univariate correlation (r = .64, P = .018). The fact that FFM was not an independent predictor in muJtivariate analysis suggests a probable interaction between Vo,max and FFM, in which the effect of FFM on TEE is mediated by its covariance with Gozmax. The practical implication of this finding is that Go,max should be considered a useful physiological marker for TEE and, therefore, a useful variable for the determination of energy requirements in healthy elderly persons.
Information on EEPA in elderly persons has previously been limited to data derived from activity diaries or motion scnsors.x.3z This component of TEE includes exercise, voluntary physical activity, and spontaneous physical activ- ity (fidgeting). By measurement of TEE with doubly labeled water in combination with measurement of RMR and an estimation of the thermic response to meals, we were able to estimate EEPA more directly and unobtrusively than has previously been possible (see Methods). The data demon- strate that in an active and healthy group of elderly subjects, EEPA is the main factor contributing to individual varia- tion in TEE. In the present study, EEPA ranged from 187 to 1,235 kcalid, and contributed from 10% to 43% of TEE. Despite the wide interindividual variation, EEPA could be accurately predicted from the LTA questionnaire (Fig 5). This was a surprising finding, given the relatively simple task of estimating LTA from a 30-minute structured inter- view. The implication of this finding is the effective valida- tion of this questionnaire as an estimate of the energy expended in leisure time. This is reassuring, given that many epidemiological studies have previously shown that high LTA, as derived from the same questionnaire used in this study, protects against cardiovascular disease.33 Further- more, the use of physical activity questionnaires may also provide additional information for estimating energy re- quirements in older persons.
Since RMR declines with age1J-5 and elderly people are
751
generally less active,ss’ it would seem apparent that TEE would bk lower in the elderly. For exam&, Vaughan et al4 recently showed that 24-hour energy expenditure measured in a room calorimeter was 13% lower in elderly persons (1,861 & 284 kcal/d) when compared with younger individ- uals (2,144 t 351 kcalid). However, interestingly, they did not find age differences in spontaneous physical activity as measured in a room calorimeter. Although such studies provide valuable information on differences in 24-hour sedentary energy expenditure in younger and older persons under confined living conditions, they do not provide information on age-related differences in free-living daily energy expenditure.
We therefore compared the present data on free-living TEE in the older subjects with data in younger subjects. Data in older men was compared with 17 younger (aged 22.1 + 3.7 years) men (Goran et al, unpublished). The younger men had a significantly lower body mass (68.4 t 8.3 kg; P = .02) and TEE was not significantly different be- tween younger and older men (2,849 +- 518 kcal/d, 1.73 + 0.25 times RMR in younger males v 2,675 -C 394 kcal/d, 1.58 + 0.31 times RMR in older males). However, TEE was approximately 18% lower in the older subjects when expressed per kg body mass (41.6 2 5.2 kcalldikg body mass in younger men; 35.2 2 7.4 kcalldikg body mass in older men, P = .048) or per kg FFM, as derived from total body water (55.5 +- 6.8 kcalldikg FFM in younger men; 47.2 r 7.4 kcal/d/kg FFM in older men, P = .017). In addition, the presently reported data in the seven healthy elderly men were compared with baseline values in seven healthy younger men (mean age, 23.7 years) recently reported by Roberts et a1.34 The two groups were surrepti- tiously matched for body mass (76.3 ? 12.4 kg in the younger subjects, 77.1 2 7.4 kg in the older subjects), but TEE was 20% lower in the older men (2,675 2 395 kcalid; 1.58 2 0.31 times RMR) compared with the younger men (3,321 ? 490 kcal/d; 1.85 c 0.03 times RMR).
For comparing age effects in women, the presently reported data were compared with the six younger (aged 24.8 + 6.9 years) control subjects in the study of Casper et a1.35 The younger women weighed significantly less than the older women (56.5 -t 4.9 kg in younger women, 65.2 t 7.8 kg in older women; P = .048), but the two groups were comparable with respect to FFM, as derived from total body water (39.6 2 7.4 kg in younger women, 41.5 ? 2.9 kg in older women). There was no significant difference between young and old women in TEE (1,985 t 352 kcal/d in younger women v 2,092 f 231 kcalid in older women), even when expressed as a function of RMR (1.50 c 0.2 times RMR in younger women v 1.43 2 0.22 times RMR in older women), body mass (35.2 2 6.2 kcalldikg body mass in younger women v 32.5 -t 5.6 kcalldikg body mass in older women), or FFM (50.1 ? 8.5 kcalidlkg FFM in younger women v 52.0 +- 7.4 kcalldlkg FFM in older women).
Taken together, these age-related comparisons imply that measurement of TEE in a room calorimeter may blunt age-related differences in spontaneous physical activity, due to the artificial nature of the living arrangements. On
752 GORAN AND POEHLMAN
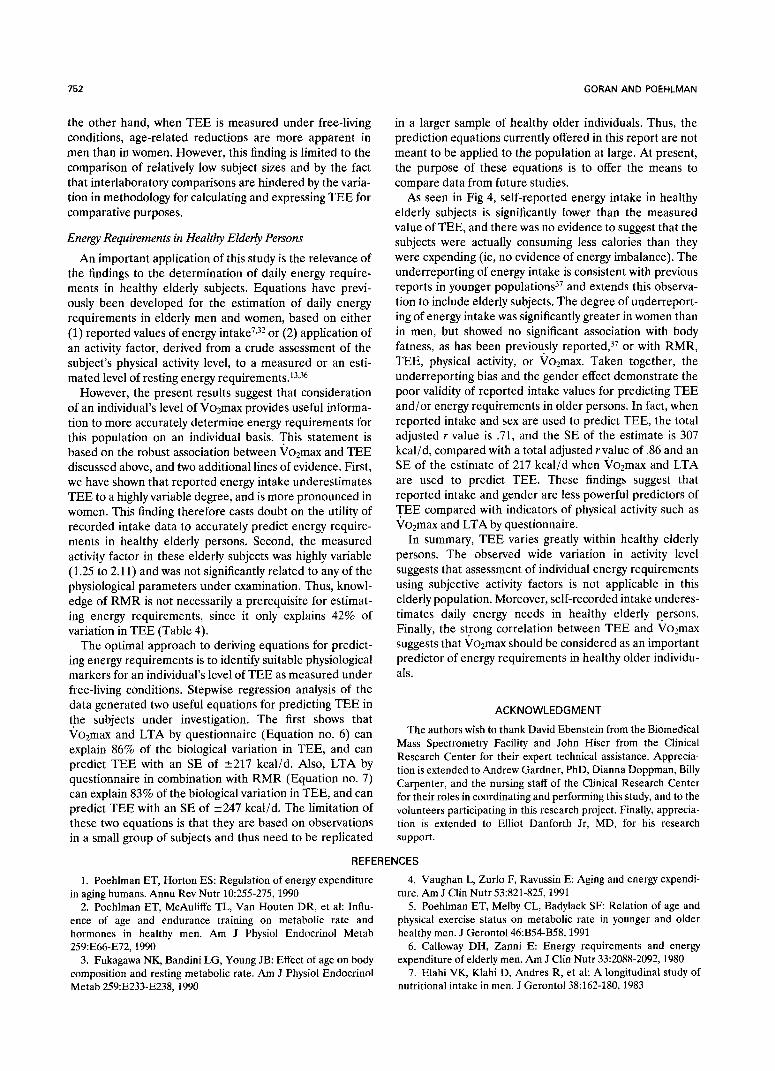
the other hand, when TEE is measured under free-living conditions, age-related reductions are more apparent in men than in women. However, this finding is limited to the comparison of relatively low subject sizes and by the fact that interlaboratory comparisons are hindered by the varia- tion in methodology for calculating and expressing TEE for comparative purposes.
in a larger sample of healthy older individuals. Thus, the prediction equations currently offered in this report are not meant to be applied to the population at large. At present, the purpose of these equations is to offer the means to compare data from future studies.
Energy Requirements in Healthy Elderly Persons
An important application of this study is the relevance of the findings to the determination of daily energy require- ments in healthy elderly subjects. Equations have previ- ously been developed for the estimation of daily energy requirements in elderly men and women, based on either (1) reported values of energy intake7,32 or (2) application of an activity factor, derived from a crude assessment of the subject’s physical activity level, to a measured or an esti- mated level of resting energy requirements.13,36
However, the present results suggest that consideration of an individual’s level of Vozmax provides useful informa- tion to more accurately determine energy requirements for this population on an individual basis. This statement is based on the robust association between Vozmax and TEE discussed above, and two additional lines of evidence. First, we have shown that reported energy intake underestimates TEE to a highly variable degree, and is more pronounced in women. This finding therefore casts doubt on the utility of recorded intake data to accurately predict energy require- ments in healthy elderly persons. Second, the measured activity factor in these elderly subjects was highly variable (1.25 to 2.11) and was not significantly related to any of the physiological parameters under examination. Thus, knowl- edge of RMR is not necessarily a prerequisite for estimat- ing energy requirements, since it only explains 42% of variation in TEE (Table 4).
As seen in Fig 4, self-reported energy intake in healthy elderly subjects is significantly lower than the measured value of TEE, and there was no evidence to suggest that the subjects were actually consuming less calories than they were expending (ie, no evidence of energy imbalance). The underreporting of energy intake is consistent with previous reports in younger populations37 and extends this observa- tion to include elderly subjects. The degree of underreport- ing of energy intake was significantly greater in women than in men, but showed no significant association with body fatness, as has been previously reported,37 or with RMR, TEE, physical activity, or Vozmax. Taken together, the underreporting bias and the gender effect demonstrate the poor validity of reported intake values for predicting TEE and/or energy requirements in older persons. In fact, when reported intake and sex are used to predict TEE, the total adjusted r value is .71, and the SE of the estimate is 307 kcal/d, compared with a total adjusted r value of .86 and an SE of the estimate of 217 kcal/d when Vozmax and LTA are used to predict TEE. These findings suggest that reported intake and gender are less powerful predictors of TEE compared with indicators of physical activity such as Vozmax and LTA by questionnaire.
The optimal approach to deriving equations for predict- ing energy requirements is to identify suitable physiological markers for an individual’s level of TEE as measured under free-living conditions. Stepwise regression analysis of the data generated two useful equations for predicting TEE in the subjects under investigation. The first shows that Vo,?rnax and LTA by questionnaire (Equation no. 6) can explain 86% of the biological variation in TEE, and can predict TEE with an SE of 2217 kcal/d. Also, LTA by questionnaire in combination with RMR (Equation no. 7) can explain 83% of the biological variation in TEE, and can predict TEE with an SE of k-247 kcal/d. The limitation of these two equations is that they are based on observations in a small group of subjects and thus need to be replicated
In summary, TEE varies greatly within healthy elderly persons. The observed wide variation in activity level suggests that assessment of individual energy requirements using subjective activity factors is not applicable in this elderly population. Moreover, self-recorded intake underes- timates daily energy needs in healthy elderly persons. Finally, the strong correlation between TEE and Vozmax suggests that Vozmax should be considered as an important predictor of energy requirements in healthy older individu- als.
ACKNOWLEDGMENT
The authors wish to thank David Ebenstein from the Biomedical Mass Spectrometry Facility and John Hiser from the Clinical Research Center for their expert technical assistance. Apprecia- tion is extended to Andrew Gardner, PhD, Dianna Doppman, Billy Carpenter, and the nursing staff of the Clinical Research Center for their roles in coordinating and performing this study, and to the volunteers participating in this research project. Finally, apprecia- tion is extended to Elliot Danforth Jr, MD, for his research support.
REFERENCES
1. Poehlman ET, Horton ES: Regulation of energy expenditure in aging humans. Annu Rev Nutr 10:2.55-275, 1990
2. Poehlman ET, McAuliffe TL, Van Houten DR, et al: Influ- ence of age and endurance training on metabolic rate and hormones in healthy men. Am J Physiol Endocrinol Metab 259:E66-E72,1990
3. Fukagawa NK, Bandini LG, Young JB: Effect of age on body composition and resting metabolic rate. Am J Physiol Endocrinol Metab 259:E233-E238,1990
4. Vaughan L, Zurlo F, Ravussin E: Aging and energy expendi- ture. Am J Clin Nutr 53:821-825, 1991
5. Poehlman ET, Melby CL, Badylack SF: Relation of age and physical exercise status on metabolic rate in younger and older healthy men. J Gerontol46:B54-B58.1991
6. Calloway DH, Zanni E: Energy requirements and energy expenditure of elderly men. Am J Clin Nutr 33:2088-2092,198O
7. Elahi VK, Klahi D, Andres R, et al: A longitudinal study of nutritional intake in men. J Gerontol38:162-180,1983
TOTAL ENERGY EXPENDITURE IN ELDERLY SUBJECTS 753
8. Dallosso HM, Morgan K, Bassey EJ, et al: Levels of custom- ary physical activity among the old and the very old living at home. J Epidemiol Commun Health 42:121-127, 1988
9. Patrick JM, Bassey EJ, Irving JM, et al: Objective measure- ments of customary physical activity in elderly men and women before and after retirement. QJ Exp Physiol71:47-58, 1986
10. Flynn MA, Nolph GB, Baker AS, et al: Total body potassium in aging humans: A longitudinal study. Am J Clin Nutr 50:713-717, 1989
11. Hubert HA: Obesity as an independent risk factor for cardiovascular disease. A 26 year follow up of participants in the Framingham heart study. Circulation 67:968-987, 1983
12. Cohn SH. Vartsky D. Yasumua S. et al: Compartmental body composition based on total body nitrogen, potassium and calcium. Am J Physiol239:E524-E530,1980
13. James WPT. Ralph A, Ferro-Luzzi A: Energy needs of the elderly: A new approach, in Munro HN, Danford DE (eds): Nutrition, Aging, and the elderly. New York, NY, Plenum, 1989, pp 129-181
14. Prentice AM (ed): The doubly-labelled water method for measuring energy expenditure: Technical recommendations for use in humans. A consensus report by the IDECG Working Group. Vienna. Austria, International Atomic Energy Agency, 1990
15. Welle S: Two-point vs multipoint sample collection for the analysis of energy expenditure by use of the doubly labeled water method. Am J Clin Nutr 52:1134-1138,199O
16. Speakman JR, Racey PA: Doubly labelled water: Errors in the evaluation of oxygen isotope turnover due to temporal varia- tion in CO2 production do not always covary with dilution space estimate. J Theor Biol 141547-556, 1989
17. Cohn M, Urey HC: Oxygen exchange reactions of organic compounds and water. J Am Chem Sot 60:679-687,1938
18. Kendall C, Copelan TB: Multisample conversion of water to hydrogen by zinc for stable isotope determination. Anal Chem 57:1437-1440.1985
1’1. Goran MI, Peters EJ. Herndon DN, et al: Total energy expenditure in burned children using the doubly labeled water technique. Am J Physiol259:E576-E585, 1990
20. Wong WW. Klein PD: A review of techniques for the preparation of biological samples for mass-spectrometric measure- ments of hydrogen-S/hydrogen-l and oxygen-18/oxygen-16 isotope ratios. Mass Spectrom Rev 5:313-342, 1986
21. Black AE, Prentice AM, Coward WA: Use of food quotients to predict respiratory quotients for the doubly-labelled water method of measuring energy expenditure. Hum Nutr Clin Nutr 4OC:38 l-391. 1986
22. Weir de JB: New methods for calculating metabolic rate with special reference to protein metabolism. J Physiol 109:1-9. 194’)
23. Coward WA, Prentice AM. Murgatroyd PR, et al: Measure-
ment of CO? and water production rates in man using ?H, 180-labelled HzO: Comparisons between calorimeter and isotope values, in van Es AJH (ed): Human Energy Metabolism: Physical Activity and Energy Expenditure Measurements in Epidemiologi- cal Research Based Upon Direct and Indirect Calorimetry. Wa- geningen, The Netherlands, Euro Nutrition Report 5;CIP- gegevens Koninklijke Bibliotheek, Den Haag, 1984, pp 126-128
24. Schoeller DA, Ravussin E, Schutz Y. et al: Energy expendi- ture by doubly labeled water: Validation in humans and proposed calculation. Am J Physiol Regul Integr Comp Physiol 250:R823- R830,1986
25. Ravussin E, Harper I, Rising R, et al: Energy expenditure by doubly labeled water: Validation in lean and obese subjects. Am J Physiol261:E402-E409, 1991
26. Berke EM, Gardner AW, Goran MI, et al: Resting meta- bolic rate and the influence of the pretesting environment. Am J Clin Nutr 55:626-629, 1992
27. Siri WE: Body composition from fluid spaces and density: Analysis of methods, in Brozek J, Henschel A (eds): Techniques for Measuring Body Composition. Washington, DC, National Academy of Science, National Dairy Council, 1961, pp 223-244
28. Poehlman ET, Danforth E Jr: Endurance training increases metabolic rate and norepinephrine appearance rates in older individuals. Am J Physiol261:E233-E239, 1991
29. Poehlman ET, Gardner AW, Goran MI: Influence of endur- ance training on energy intake, norepinephrine kinetics and metabolic rate in older individuals. Metabolism (in press)
30. Folsom AR, Jacobs DR Jr, Caspersen CJ, et al: Test-retest reliability of the Minnesota Leisure Time Physical Activity Ques- tionnaire. J Chron Dis 39:505-511, 1986
31. Taylor HL, Jacobs DR, Schucker B, et al: Questionnaire for the assessment of leisure time physical activities. J Chronic Dis 31:741-755. 1978
32. McGandy RB, Barrows CH Jr. Spanias A, et al: Nutrient intakes and energy expenditure in men of different ages. J Gerontol21:581-587, 1966
33. Ekelund L-G, Haskell WL, Johnson JL. et al: Physical- fitness as a predictor of cardiovascular mortality in asymptomatic North American men. N Engl J Med 319:1379-1384, 1988
34. Roberts SB, Young VR, Fuss P, et al: Energy expenditure and subsequent nutrient intakes in overfed young men. Am J Physiol Regul lntegr Comp Physiol259:R461-R469, 1990
35. Casper RC. Schoeller DA, Kushner R, et al: Total daily energy expenditure and activity level in anorexia nervosa. Am J Clin Nutr 53:1143-1150,199l
36. WHO: World Health Organization, Technical Report Se- ries, No. 724. Energy and Protein Requirements. Geneva, Switzer- land, WHO, 1985
37. Schoeller DA: How accurate is self-reported dietary energy intake? Nutr Rev 48:373-379, 1990